a mathematical model for dynamic simulation of...
TRANSCRIPT

A MATHEMATICAL MODEL FOR DYNAMIC
SIMULATION OF APOPTOSIS PATHWAYS
Paolo Massari
Department of Information Engineering
Bioengineering
University of Padova
April 2014
Advisor: Gianna Maria To�olo
Coadvisor: Barbara Di Camillo
Anno Accademico: 2013-2014


Summary
Programmed cell death, termed apoptosis, plays a fundamental role in the developmentand homeostasis of multicellular organisms. Dysregulation of apoptosis can lead to nu-merous diseases, including autoimmune diseases, neurodegenerative diseases, and cancer.In mammalian cells apoptosis can be induced by intra- or extracellular stimuli. Extracel-lular stimuli comprise death ligands (like TRAIL or FAS/Apo-1/CD95) which can lead,through extrinsic pathway, to receptor-induced apoptosis. Intracellular signals, such asDNA damage, trigger the intrinsic pathway which results in release and activation, bymitochondria into cytosol, of proapoptotic factors. Apoptosis is promoted by a familyof cysteine proteases, the caspases, which could lead to apoptotic phenotypes such aschromatin condensation, nuclear fragmentation, membrane blebbing, cell shrinkage, andformation of apoptotic bodies. A series of other non-apoptotic pathways occur whenthe cell is stymolated by death receptors. In particular nuclear factor kappa B is a pro-tein complex that, when active, transfers into DNA generating transcriptional factorsthat could interact and inhibit caspase and mitochondrial apoptotic pathways. Creatingmodels of apoptotic phenomenon is a key tool to understand the role of any singularmolecule involved in this process. In particular, ordinar di�erential equations (ODEs)models allows to obtain quantitative concentrations of each molecule. There are a lot ofODEs models in literature, each of them dedicated to a di�erent branch of apoptosis.The aim of this thesis is to perform a new ODE-based model (using BioNetGen language)by integrating those already existing. Therefore is possible to reproduce and simulatethe complex signal of extrinsic apoptotic pathway and give new insights to cell deathmechanism. In particular, were selected two models with similar cellular lines (HeLacells). The �rst involves mitochondria reactions describing intrinsic apoptosis inducedby TRAIL receptors. It represents cellular death like a biologic time switch, whose activa-tion could be delayed by opportune inhibitors. The second delineates extrinsic apoptosisthrough NfkB pathway by stimolation of FAS receptors. The derived BioNetGen codes,for these two di�erent approaches, was after imported in Matlab and integrated usingnon linear least square method (NNLSQ). The new model is conceived to join togethermechanisms that leads to cellular death or survival. Controlling apoptosis inhibitor coulddelay caspase and mitochondrial events and, consequently, induce NfkB transcriptionalfactors activity, suppressing apoptosis in a de�nitive manner. To further study and val-idate it, sensitivity analysis and pattern classi�cation were performed and underlininga good agreement with previous models. Since no complex algebric forms such as 'Hillfunctions' were used in the model, ultrasensitivity and other nonlinear behaviors arisefrom interactions among simple elementary reactions. In future perspectives, this modelcould be used for cross-talks investigation between di�erent pathways and also for betterdescription of NfkB in�uence in apoptosis propagation.
I


Contents
1 Introduction 1
2 Apoptosis 42.1 Key molecules on apoptosis pathway . . . . . . . . . . . . . . . . . . . . . 4
2.1.1 Caspases as major e�ector molecules of apoptosis pathway . . . . . 62.1.1.1 Caspase-8/10 activation at DISC . . . . . . . . . . . . . . 7
2.1.2 c-Flip proteins regulate caspase activation at the DISC . . . . . . . 82.1.3 IAP family of proteins . . . . . . . . . . . . . . . . . . . . . . . . . 9
2.1.3.1 XIAP and Smac/DIABLO . . . . . . . . . . . . . . . . . 92.1.4 The Bcl-2 family . . . . . . . . . . . . . . . . . . . . . . . . . . . . 9
2.2 System biology of extrinsic apoptosis . . . . . . . . . . . . . . . . . . . . . 102.2.1 Death receptor-induced apoptosis . . . . . . . . . . . . . . . . . . . 10
2.3 System biology of intrinsic apoptosis . . . . . . . . . . . . . . . . . . . . . 122.3.1 Mithocondrial apoptosis pathway . . . . . . . . . . . . . . . . . . . 13
2.4 Nf-kB non-apoptotic pathway . . . . . . . . . . . . . . . . . . . . . . . . . 142.4.1 CD95-Mediated NF-kB activation . . . . . . . . . . . . . . . . . . . 142.4.2 TRAIL-Mediated NF-kB activation . . . . . . . . . . . . . . . . . . 14
3 Modelling biochemical systems 163.1 introduction . . . . . . . . . . . . . . . . . . . . . . . . . . . . . . . . . . . 163.2 Why modelling apoptosis? . . . . . . . . . . . . . . . . . . . . . . . . . . 163.3 Ultrasensitivity . . . . . . . . . . . . . . . . . . . . . . . . . . . . . . . . . 17
3.3.1 E�ect of feedbacks on ultrasensitive cascades . . . . . . . . . . . . 183.3.2 Bistability caused by positive feedback . . . . . . . . . . . . . . . . 19
3.4 Computational modeling techniques . . . . . . . . . . . . . . . . . . . . . 193.4.1 ODE Models Describing Apoptosis Networks . . . . . . . . . . . . 21
3.4.1.1 Models of Extrinsic Apoptosis Pathway . . . . . . . . . . 213.4.1.2 Models of Intrinsic Apoptosis Pathway . . . . . . . . . . . 223.4.1.3 Implicit Feedback Mechanism in Intrinsic Apoptosis . . . 223.4.1.4 Models with a switching / threshold mechanisms . . . . . 233.4.1.5 Models with a timing switch . . . . . . . . . . . . . . . . 233.4.1.6 Nf-kB Models . . . . . . . . . . . . . . . . . . . . . . . . . 24
3.5 Rule-based modeling . . . . . . . . . . . . . . . . . . . . . . . . . . . . . . 253.6 BioNetGen language . . . . . . . . . . . . . . . . . . . . . . . . . . . . . . 26
3.6.1 BioNetGen simulation tools . . . . . . . . . . . . . . . . . . . . . . 30
III

Contents
4 Mathematical model of apoptosis 324.1 Introduction . . . . . . . . . . . . . . . . . . . . . . . . . . . . . . . . . . . 324.2 Albeck's model of intrinsic apoptosis with TRAIL . . . . . . . . . . . . . . 32
4.2.1 Model description . . . . . . . . . . . . . . . . . . . . . . . . . . . 354.2.2 Model implementation using BioNetGen . . . . . . . . . . . . . . . 36
4.3 Neumann's model of extrinsic apoptosis with FAS/APO-1 . . . . . . . . . 404.3.1 Model description . . . . . . . . . . . . . . . . . . . . . . . . . . . 424.3.2 Model implementation using BioNetGen . . . . . . . . . . . . . . . 43
4.4 Model integration . . . . . . . . . . . . . . . . . . . . . . . . . . . . . . . . 464.4.1 Robust parametric sensitivity analysis . . . . . . . . . . . . . . . . 47
4.4.1.1 Neumann DISC sensitivity analysis . . . . . . . . . . . . 494.4.1.2 Albeck DISC sensitivity analysis . . . . . . . . . . . . . . 50
4.4.2 Merging using nonlinear least-squares method . . . . . . . . . . . . 524.4.2.1 Parameters calibration . . . . . . . . . . . . . . . . . . . . 544.4.2.2 Conclusion . . . . . . . . . . . . . . . . . . . . . . . . . . 57
5 Model Analysis and validation 585.1 Apoptosis model simulations: results and analysis . . . . . . . . . . . . . . 59
5.1.1 Pattern classi�cation . . . . . . . . . . . . . . . . . . . . . . . . . . 595.1.1.1 Classi�cation parameters . . . . . . . . . . . . . . . . . . 605.1.1.2 Classi�cation rules . . . . . . . . . . . . . . . . . . . . . . 61
5.1.2 Classi�cation analysis and discussion . . . . . . . . . . . . . . . . . 625.2 Model validation . . . . . . . . . . . . . . . . . . . . . . . . . . . . . . . . 66
5.2.1 DISC formation, p43Flip and p43p41 activation . . . . . . . . . . . 665.2.2 mitochondrial ampli�cation loop . . . . . . . . . . . . . . . . . . . 685.2.3 C3 - C6 feedback loop . . . . . . . . . . . . . . . . . . . . . . . . . 695.2.4 NfkB activation . . . . . . . . . . . . . . . . . . . . . . . . . . . . . 705.2.5 FAS pathway . . . . . . . . . . . . . . . . . . . . . . . . . . . . . . 725.2.6 Sensitivity analysis . . . . . . . . . . . . . . . . . . . . . . . . . . . 72
6 Conclusions 766.1 Future plans . . . . . . . . . . . . . . . . . . . . . . . . . . . . . . . . . . . 77
7 Appendix 78
IV


1 Introduction
Programmed cell death is a fascinating process common to all multicellular organisms. Itresults in the elimination of cells via a complex but a highly de�ned programme. Defectsin the regulation of programmed cell death are associated with serious diseases such ascancer, autoimmunity, AIDS, and neurodegeneration. Apoptosis has been the best stu-died type of programmed cell death so far. Cells that undergo apoptosis are characterizedby chromatin condensation, nuclear fragmentation, membrane blebbing, cell shrinkage,and formation of apoptotic bodies. The central role in apoptosis execution belongs tocysteine-speci�c aspartate proteases (caspases). Caspases are enzymes that orchestrateapoptosis via cleavage of cellular substrates.
There are two major pathways of apoptosis: intrinsic and extrinsic. The intrinsic path-way is triggered via chemotherapeutic drugs, irradiation, and growth factor withdrawal.These stimuli lead to mitochondrial outer membrane permeabilization (MOMP), whichresults in cytochrome-c release and caspase activation. In the extrinsic apoptotic path-way, the caspase cascade is triggered by signals emanating from the cell-surface deathreceptors (DR) triggered by death ligands (DL) (TNF, CD95L/FasL, TRAIL). The DRstimulation results in the formation of the death-inducing signaling complex (DISC) andsubsequent caspase activation. DISC molecule, promotes caspase 8 and 10 activation andwas inhibited by cellular FADD-like interleukin-1b-converting enzyme inhibitory proteins(c-Flips). Three splicing variants of c-Flips, c-Flip short (c-FlipS), c-Flip long (FlipL),and c-Flip Raji (FlipR) can heterodimerize with a monomer of procaspase-8 bound to aFADD molecule at the DISC and interfere with caspase-8 activation. c-Flips moleculespromotes Nf-kB activation through the formation of p43Flip.
Despite the fact that signaling pathways of apoptosis have been described with an im-pressive level of detail, the understanding of apoptosis regulation in quantitative termshas been missing until recently. There were many unclear points: when does a cell decidethat it has to die, what are the rate-limiting steps in apoptosis, is there a point of noreturn, how can cell death be accelerated or blocked, and many others. From anotherside the years of apoptosis research resulted in a profound understanding of how signalingin apoptosis occurs. All major apoptotic complexes have been identi�ed from the DISCto the apoptosome, including the death receptors and adaptors and the most importantenzymes and their inhibitors. Therefore, apoptosis was an ideal system to go into quan-titative studies using the emerging �eld of systems biology.
On the modeling side there are a number of mathematical formalisms, e.g., Ordina-ry Di�erential Equations (ODEs), Boolean models, etc., that allow to address di�erent
1

1 Introduction
biological questions. Experimental work for systems biology of apoptosis involves thegeneration of quantitative data using di�erent apoptotic assays. The development of this�eld in the recent years is fascinating. Studies of apoptosis using systems biology haveprovided novel insights into the quantitative regulation of cell death.
The aim of this thesis is to �nd new insights of the complex regulatory mechanismof apoptosis by implementing and simulation of a state-of-art model. Two models havebeen used from literature, each of them describing a di�erent behavior of apoptotic path-way. The �rst model consider the pathway generated by TRAIL receptors and involvesthe mitochondrion. It conisder apoptosis like a biological switch that can be delayedby some molecules (called inhibitors of apoptosis). The second model evaluate two ex-trinsic pathways produced by FAS receptors: apoptosis and Nf-kB. The last could leadto the activation of trascriptional factors that act as inhibitors of both mitochondrialand apoptosi pathway. We will merge them togheter using sensitivty analysis and non-linear-least-square method. Then, we will study the new complete model using patternclassi�cation, Hill equation and sensitivity analysis.
Structure of the thesis:Chapter 2 starts with an overview of the biology of the di�erent pathways involved
in the apoptosis stimuli. We analyze both the extrinsic pathways (mediated by deathreceptors) and intrinsic pathways (mediated by mithocondrial and the formation of theapoptosome) and all the other major non-apoptotic pathways that occurs during theapoptotic stimuli.Chapter 3 gives an overview of the main computational modeling techniques focusing
on rule-based modeling approach and on BioNetGen language, the software implementingit. It also gives an insight of the most widespreads mathematical models used in apoptosisand cell death.Chapter 4 starts illustrating two published models describing di�erent apoptosis signal-
ling branches to realize a �nal and more complete model. We analyze step by step theirimplementation using BioNetGen language. At last, we import the models in MatLaband we use sensitive analysis and the non linear square method for model integrationand parameter adjustment.In chapter 5 the new apoptosis model has been used to obtain predictions of the system.
Simulated time series, describing concentrations of chemical species, has been consideredto characterized the dynamic behavior of the system. Both sensitivity analysis and Hillequation have been used to further describe and validate the new model.In chapter 6 we discuss the results and we introduce future plans. At last, chapter 7
shows model observables and BioNetGen source code.Some chapters in section 2 and 3 are based on Inna Lavrik's [4] and Sangdun Choi's
[11] books.
2

1 Introduction
Su�x Description
Apaf-1 Adaptor protein, apoptotic protease activating factor-1
Bcl-2 B-cell lymphoma protein 2
IAP Inhibitor of Apoptosis
MOMP Mitochondrial Outer Membrane Permeabilisation
BH Bcl-2 homolgy
BIR Baculoviral IAP Repeat
RING Really Interesting New Gene
c-IAP1 and c-IAP2 Cellular inhibitor of apoptosis 1 and 2
XIAP X-linked inhibitor of apoptosis protein
Smac Second Mitochondria-derived Activator of Caspases
DIABLO Direct IAP Binding Protein with Low PI
ODE Ordinary Di�erential Equations
BAR Bifunctional Apoptosis Regulator
NF-kB Nuclear Factor-KappaB
IKK IkB kinase
FRET Foerster resonance energy transfer
TRAIL/Apo2L Tumour Necrosis factor-Related Apoptosis-Inducing Ligand
TRAIL-R1 TRAIL receptor 1
CHX Cycloheximide
ATP Adenosine Triphosphate
CA Cellular Automata
TNF Tumor Necrosis Factor
TNFR1 Tumor Necrosis Factor Receptor 1
CD95L/FasL death receptor
DISC death-inducing signaling complex
DR death receptor
DL death ligand
BH3 Bcl2 Homology domain
C8/C8* pro caspases 8 and the active form
FADD Fas-Associated protein with Death Domain
CD95/Apo-1/FAS First apoptosis signal ligand
c-FLIP cellular FLICE inhibitory proteins
Table 1.1: Legend of molecules abbrevations
3

2 Apoptosis
Apoptosis or programmed cell death (PCD) is a genetically controlled process wherebycells die in response to environmental or developmental cues. The morphological char-acteristics of apoptosis include cytoplasmic blebbing, chromatin condensation and nu-cleosomal fragmentation. Dead cells are rapidly phagocytized to prevent damage toneighboring cells. Regulation of apoptosis is critical for normal development and tissuehomeostasis and disruption of this process can have severe consequences. Too much celldeath may produce neurodegenerative diseases and impaired development, while insu�-cient cell death can lead to increased susceptibility to cancer and sustained viral infection.Progress has been made in the past decade to identify many of the basic components thatcontribute to apoptosis, including transcriptional mediators, membranebound receptors(e.g. TNF-a receptor and Fas), Bcl-2 family members, kinases/ phosphatases, and cys-teine proteases. We �rst illustrate (par. 2.1) di�erent molecules involved in apoptosispathway and then we focus on extrinsic (par. 2.2) intrinsic (par. 2.3) and non apoptoticpathways (par. 2.4). In particular we refer to pathway generated by TRAIL and FASreceptors. In table 1.1 we illustrate a legend of the common abbrevations used in thisthesis.
2.1 Key molecules on apoptosis pathway
The importance of properly balanced cell survival and death in an organism is undeniable.Unscheduled survival and proliferation of cells beyond their natural life span can leadto the formation of tumours and cancer, while, at the other end of the spectrum, thepremature death of di�erentiated cells such as neurons or cardiac muscle cells leads toirreversible, degenerative diseases. Given the complexity of the signaling involved, itis not surprising that a large variety of endogenous regulators of apoptotic signalinghave been identi�ed and investigated in mammalian cells. Of particular importance forthe mitochondrial apoptosis pathway are the B-cell lymphoma protein 2 (Bcl-2) andinhibitor of apoptosis (IAP) protein families. On the other side, death receptor-inducedapoptosis is regulated at several levels and involves numerous protein families. Theinterplay between the di�erent levels of regulation provides a signi�cant complexity, whichcan be understood better using systems biology. In the following sections, we will givea summary of the di�erent protein families and their roles in intrinsic and extrinsicapoptosis. In �g. 2.1 it is represented a little part of the apoptotic pathway mediated bydeath receptor. In the red circles there are the molecules considered in this thesis.
4

2 Apoptosis
Figura 2.1: Cellular apoptosis pathway by death receptors. Red circles representmolecules and pathway evaluated in this study.
5

2 Apoptosis
2.1.1 Caspases as major e�ector molecules of apoptosis pathway
Caspases are cysteine proteases and are the e�ector molecules of the apoptotic machine-ry. There are apoptotic, as well as in�ammatory caspases. The apoptotic caspases aredivided into initiator caspases, including caspase-2, -8, -9, and -10, and e�ector caspa-ses, such as caspase-7 and -3. All caspases are present in the cell as inactive zymogensreferred to as procaspases and are activated by internal cleavage. Initiator caspases actupstream of e�ector caspases and activate them through cleavage. E�ector caspases thencleave a variety of cellular substrates, eventually resulting in cell death.
Figura 2.2: Structural organization of caspases. Caspases are generally divided into in-�ammatory and apoptotic caspases. Apoptotic caspases are further dividedinto initiator and e�ector caspases. Caspases possess a large (p20) and small(p10) subunit. Initiator caspases additionally have DEDs (procaspase-8/10)or CARD domains (procaspase-9) at their N-terminus [1]
All caspases share a common structure. Caspase monomers consist of a large (∼20kDa) and small (∼10 kDa) subunit (Fig. 2.2). Initiator caspases additionally have spe-ci�c recruitment domains at their N-terminus. Procaspase-8 and -10 have two tandemDED through which they interact with FADD at the DISC, procaspase-9 possesses acaspase-recruitment domain (CARD) which is required for recruitment to the apoptoso-me via interactions with Apaf-1. Active caspases are heterotetramers consisting of twolarge and two small subunits. Initiator caspases are present in the cytosol as monomersand are activated by dimerization or oligomerization at caspase-activating platforms andcleavage between the large and small subunits only stabilizes the dimer. It was sho-wn that both dimerization and interdomain cleavage are required for full activation ofcaspase-8. E�ector caspases on the contrary are present as inactive dimers and are rea-dily activated by internal cleavage. This cleavage is performed by initiator caspases.
6

2 Apoptosis
The conceptual di�erence between the two classes is that there is no proteolytic enzymeupstream of initiator caspases. Consequently, initiator caspases exhibit low zymogenici-ty, which is de�ned as the ratio of activity between the cleaved and the uncleaved form.While initiator caspases have highest ratios of 10 (caspase-9) or 100 (caspase-8), the ratiofor caspase-3 is more than 10,000.
2.1.1.1 Caspase-8/10 activation at DISC
Two isoforms of procaspase-8 procaspase-8a (p55) and -8b (p53) are recruited to theDISC. After binding to the DISC, procaspase-8a/b (p55/p53) undergoes processing, thusgenerating active caspase-8 (Fig. 2.3). This processing has been suggested to occur viadimerization of two procaspase-8 monomers followed by a conformational change, leadingto autoactivation of procaspase-8 homodimers. Procaspase-8a/b (p55/p53) processingat the DISC also results in the generation of the N-terminal cleavage products p43/p41,the prodomains p26/p24, as well as the C-terminal cleavage products p30, p18, andp10. Active caspase-8 heterotetramers (p10/p18) generated at the DISC initiate theexecution of apoptotis. Recently, it has been reported that the cleavage products p30 andp43/p41 also possess catalytic activity leading to apoptosis initiation. Hence, procaspase-8 processing at the DISC initiates apoptosis through the generation of several catalyticallyactive cleavage products.
Figura 2.3: Caspase-8 cleavage products and processing at the DISC. (a) Procaspase-8can be cleaved between the large and small subunit or between the prodomainand the large catalytic subunit, resulting in numerous di�erent cleavage prod-ucts. (b) Procaspase-8 homodimers at the DISC can be processed to the ac-tive caspase-8 heterotetramers (p10/p18) via the intermediate p43/p41. Theprocaspase-8/c-FLIPL heterodimer can only be processed to the intermediatep43-FLIP
7

2 Apoptosis
Three isoforms of caspase-10 namely procaspase-10a, procaspase-10c, and procaspase-10d were reported to be bound to the DISC. Procaspase-10 is also activated at the DISCvia generation of homodimers, leading to the formation of an active heterotetramer.However, whether caspase-10 cantrigger cell death in the absence of caspase-8 in responseto CD95 stimulation is controversial.The pathways generating apoptosis are usually divided into two principal categories:
extrinsic and intrinsic. The �rst are generated by an external stimulus (e. g. throughreceptors) while the second are produced by reactions that occur inside the cell. Otherpathways occur when cell undergo apoptosis and some of them promote cell survival.They are usually called non-apoptotic or survival pathways.
2.1.2 c-Flip proteins regulate caspase activation at the DISC
Three c-FLIP isoforms and two cleavage products have been characterized so far (Fig.2.4). Three isoforms include one long, c-FLIPL, and two short variants, c-FLIPS and c-FLIPR. All three c-FLIP isoforms possess two tandem DED domains at their N-terminus.c-FLIPL additionally contains catalytically inactive caspase-like domains (p20 and p12).
Figura 2.4: c-FLIP isoforms and cleavage products. Three isoforms of c-FLIP proteinsexist, one long (c-FLIPL) and two short variants (c-FLIPS and c-FLIPR). Allisoforms contain two tandem DEDs which are required for DISC recruitment.c-FLIPL additionally has a large and small caspase-like subunit, which arecatalytically inactive. C-FLIPL can be cleaved by caspase-8 at di�erent posi-tions generating the N-terminal fragment p43-FLIP or N-terminal fragmentp22-FLIP [1]
The two short isoforms, c-FLIPS and c-FLIPR, block DR-induced apoptosis by inhi-bition of procaspase-8 activation at the DISC. This has been suggested to occur throughthe formation of catalytically inactive procaspase-8/c-FLIPR/S heterodimers. c-FLIPLcan play both a pro- and an antiapoptotic role. It can act as an antiapoptotic molecule,functioning in a way analogous to c-FLIPS when it is present at high concentrations
8

2 Apoptosis
at the DISC. c-FLIPL can act proapoptotic when expressed at lower concentrations, incombination with strong receptor stimulation or in the presence of high amounts of ei-ther of the short c-FLIP isoforms c-FLIPS or c-FLIPR. Under these conditions c-FLIPLfacilitates the activation of procaspase-8 at the DISC. This occurs via the formation ofcatalytically active procaspase-8/c-FLIPL heterodimers in which the procaspase- 8 activeloop is stabilized by c-FLIPL, thereby increasing the catalytic activity of procaspase-8.
2.1.3 IAP family of proteins
The Inhibitors of Apoptosis (IAP) proteins directly inhibit caspases. They all share aconserved sequence motif of 70�80 amino acids, the baculoviral IAP repeat (BIR) domain,which is arranged around a coordinated zinc atom, of which each family member canpossess up to three copies. There are six human IAPs,which include XIAP, c- IAP1,c-IAP2, NAIP, Bruce, and survivin. Numerous mammalian IAPs, as well as IAPs in �iesand viruses, possess a C-terminal RING domain, however, the requirement of this domainfor apoptosis suppression remains unclear. There are reports that both domains arerequired for their antiapoptotic function in insects, however, c-IAP1, c-IAP2, and XIAPin humans could still inhibit apoptosiswhen lacking the RINGdomain. XIAP directlyinhibits active caspase-3. During the intrinsic apoptosis, mitochondrion is activated andopens its pores (MOMP). After MOMP Smac is released from the mitochondria into thecytosol and relieves XIAP-mediated inhibition. This causes a delay between receptor-mediated initiator phase and �nal commitment to cell death in type II cells [2]. XIAPalso contains a RING domain with E3 ubiquitin ligase activity, which promotes caspase-3degradation by the proteasome ([2, 5]).
2.1.3.1 XIAP and Smac/DIABLO
Among the IAPs, XIAP is the most potent inhibitor of cell death, capable of blockingboth the intrinsic and extrinsic pathways of apoptosis through inhibition of the initiatorcaspase-9 and e�ector caspases-3 and -7. In addition to its caspase inhibition abili-ties, XIAP also has a RING motif which functions as an E3 ubiquitin protein ligase tocatalyse the ubiquitination of itself as well as substrate proteins. Caspase inhibition byXIAP may be counteracted by the release of Second Mitochondria-derived Activator ofCaspases/ Direct IAP Binding Protein with Low PI (Smac/DIABLO) or the serine pro-tease Omi/HtrA2, both of which are released by mitochondria into the cytosol duringapoptosis.
2.1.4 The Bcl-2 family
The Bcl-2 family of proteins are probably the best described endogenous modulatorsof the mitochondrial pathway of apoptosis, and regulate apoptosis by either promotingor preventing mitochondrial outer membrane permeabilisation (MOMP). Pro- and anti-apoptotic family members can heterodimerise and neutralise each other's function. TheBcl-2 family proteins can be divided into three subfamilies. The �rst subfamily com-prises the anti-apoptotic proteins (Bcl-2, Bcl-xL, Bcl-w, Mcl-l, Al and Boo) which are
9

2 Apoptosis
potent inhibitors of the apoptotic programme and antagonise pore formation at the mi-tochondrial outer membrane. These proteins are structurally characterised by four Bcl-2homolgy (BH) domains. The remaining two subgroups, the Bax/Bak family and theBH3-only protein family, are pro-apoptotic and required for the initiation of apoptosis.The multi-domain, pro-apoptotic proteins, Bax and Bak (and potentially a third protein,Bok), bear three BH domains, and oligomerise and facilitate pore formation in the outermitochondrial membrane. The BH3-only proteins promote apoptosis by not only selec-tively binding to the anti-apoptotic Bcl-2 family members, but also by directly inducingthe activation and oligomerisation of the Bax and Bak proteins. Activation of Bax andBak is essential for the activation of the mitochondrial apoptosis pathway. It should alsobe noted that there is crosstalk between the mitochondrial and death receptor apoptosispathways. This crosstalk is carried out by caspase-8- mediated cleavage of the BH3-onlyprotein family member, Bid.
2.2 System biology of extrinsic apoptosis
The extrinsic signaling pathway leading to apoptosis involves transmembrane death re-ceptors that are members of the tumor necrosis factor (TNF) receptor gene superfamily.Members of this receptor family bind to extrinsic ligands and transduce intracellularsignals that ultimately result in the destruction of the cell. The signal transduction ofthe extrinsic pathway involves several caspases which are proteases with speci�c cellulartargets. Once activated, the caspases a�ect several cellular functions as part of a processthat results in the death of the cells. The focus of this chapter is on understandingthe signaling complexity of the extrinsic apoptotic pathway using systems biology. Wesummarize the main signaling paradigms and the major features of the extrinsic pathway.
2.2.1 Death receptor-induced apoptosis
Death receptors (DR) belong to the tumor necrosis factor (TNF) family of proteins andare characterized by extracellular cysteine rich domains (CRD) and an intracellular ∼80amino acid long motif, the death domain (DD). The best characterized DRs are CD95(also named Fas/APO-1), TNFR1, TRAIL receptor 1 (TRAIL-R1), and TRAIL-R2.Death ligands (DL) are assumed to be homotrimeric and exist in a membrane-bound ora soluble form.
CD95/Apo-1/FASThe CD95-induced apoptotic pathway is one of the best-studied signaling pathways.The natural ligand of CD95, CD95L, is expressed on a variety of cells, such as cytotoxicT cells, as a type II membrane protein1. Stimulation of CD95 with its ligand or wi-th agonistic anti-CD95 antibodies, such as anti-APO-1, triggers the oligomerization ofCD95. This leads to the recruitment of Fas-associated death domain (FADD) throughDD interactions, as well as procaspase-8, procaspase-10 (par. 2.1.1), and cellular FLICE
1Type II membrane proteins are trans membrane proteins that have their amino terminus on thecytoplasmic side of the cell and the carboxy terminus on the exterior.
10

2 Apoptosis
inhibitory proteins (c-FLIPs) via N-terminal death e�ector domains (DED) (par. 2.1.2),and formation of the death-inducing signaling complex (DISC). In the DISC procaspase-8/10 are activated by dimerization and internal cleavage, which is regulated by c-FLIPproteins. Recent structural analyses challenge the concept of a trimeric ligand binding toa trimeric receptor. Triggering of CD95 has also been reported to induce nonapoptoticpathways, such as NF-kB, AKT, and ERK [3]. However, the detailed mechanisms of theinduction of CD95-mediated nonapoptotic pathways are not elucidated yet. Activatedcaspase-8 is released from the DISC and activates e�ector caspases-3 and -7, which cleavea variety of substrates, and are responsible of the fragmentation of chromosomes.
Figura 2.5: Fas ligand and receptor
Additionally, caspase-8 cleaves Bcl-2 protein Bid (par. 2.1.4). The C-terminal part,tBid, then translocates to the mitochondria resulting in mitochondrial outer membranepermeabilization (MOMP) and the release of proapoptotic factors into the cytosol, suchas cytochrome c, Apaf-1, or endonuclease G. This results in the formation of anothercomplex, the apoptosome, including cytochrome c, Apaf-1, ATP and procaspase-9, andactivation of procaspase-9 in this complex. Caspase-9 also cleaves and activates caspase-3. In CD95-induced apoptosis two di�erent cell types are distinguished: Type I andType II. Type I cells are characterized by high amounts of CD95 DISC, which resultsin very e�cient procaspase-8 activation, leading to massive activation of caspase-3 and
11

2 Apoptosis
cell death. Type II cells, on the other side, are characterized by lower amounts of CD95DISC formation, that results in less active procaspase-8 and require signal ampli�cationthrough tBid-mediated mitochondrial permeabilization.
TRAILTRAIL (TNF-Related Apoptosis-Inducing Ligand) is a protein consisting of 281 ami-no acids. It is also called Apo2L. Five proteins, TRAILR1 (DR4), TRAILR2 (DR5/TRICK2 or KILLER), TRAILR3 (DcR1/ TRID or LIT), TRAILR4 (DcR2 or TRUNDD),and Opg (Osteoprotegerin), have been identi�ed as TRAIL receptors (Ref.1). BothTRAILR1 and TRAILR2 contain the functional DD (Death Domain), capable of indu-cing apoptosis. The other three receptors DcR1, DcR2 and Opg serve as "decoy" recep-tors. These three receptors can bind to TRAIL, but cannot induce apoptosis. DcR1 isa glycosylphosphatidylinositol-anchored cell surface protein, which contains the TRAIL-binding region as well as a region that anchors the receptor to the membrane. Butunlike the other receptors, DcR1 lacks an intracellular tail needed to spark the deathpathway. DcR2 is also able to bind TRAIL but contains a truncated DD that doesnot signal apoptosis induction but can activate NF-KappaB (Nuclear Factor-KappaB).Finally, Opg, slightly weaker receptor for TRAIL also binds to OpgL (OsteoprotegrinLigand/Receptor), activator for NF-KappaB ligand (RANKL/Receptor Activator of NF-KappaB Ligand), inhibits osteoclastogenesis, and increases bone density. A cell expres-sing more decoy receptors is more likely to survive upon binding of the death ligands.TRAIL has been demonstrated to kill a wide variety of tumor cells with minimal e�ectson normal cells. This is because TRAIL's death receptors (TRAILR1 and TRAILR2)are mainly expressed in transformed cells while its decoy receptors are expressed in nor-mal cells. Binding of TRAIL to DR4 and DR5 leads to the recruitment of an adaptorprotein FADD (Fas-Associated Death Domain), which functions as a molecular bridgeto Caspase8. Caspase8 then oligomerizes and is activated via autocatalysis. ActivatedCaspase8 stimulates apoptosis via two parallel cascades: it directly cleaves and activa-tes Caspase3, and it cleaves BID (BH3 Interacting Death Domain) (par. 2.1.4). tBID(Truncated BID) translocates to mitochondria, inducing CytoC (Cytochrome-C) release,which sequentially activates Caspases9 and 3. BAX (BCL-2 Associated X-Protein) de�-ciency has no e�ect on TRAIL-induced Caspase8 activation and subsequent cleavage ofBID; however, it results in an incomplete Caspase3 processing due to inhibition by XIAP(Inhibitor of Apoptosis, X-Linked). Release of SMAC/DIABLO from mitochondria th-rough TRAIL-Caspase8-tBID-BAX cascade is required to remove the inhibitory e�ect ofXIAP and allow apoptosis to proceed. BAX-dependent release of SMAC, not CytoC frommitochondria, mediates the contribution of mitochondrial pathway to TRAIL throughdeath receptor-mediated apoptosis. Caspase3 directly cleaves downstream substrates e.g.PARP (Poly ADP Ribose Polymerase).
2.3 System biology of intrinsic apoptosis
For intrinsic apoptosis we usually mean the mitochondrial apoptosis pathway. Mitochon-dria have multiple functions. Apart from their role in the regulation of cellular bioen-
12

2 Apoptosis
ergetics, redox homeostasis and signal transduction, mitochondria are able to initiateapoptosis. The Bcl-2 family proteins are the key regulators of the mitochondria-initiatedcaspase activation pathway. Activation of caspases is considered one of the most impor-tant regulatory steps for apoptosis. Caspase cascades can be initiated or ampli�ed by therelease of cytochrome-c from the mitochondria. On release into the cytosol, cytochrome-cbinds to Apaf-1. Apaf-1 oligomerises and engages the initiator caspase, pro-caspase-9,which in turn activates downstream caspases-3 and -7. Furthermore, the release of Smacfrom mitochondria assists the ampli�cation of the caspase cascade by abrogating the func-tion of caspase inhibitors such as XIAP. Moreover, mitochondria are involved in caspaseindependent cell death with the release of factors including apoptosis-inducing factor.There have been considerable developments in recent years in further understanding thecomplex signaling networks and cellular decision making during mitochondria-initiatedapoptosis through the use of systems biology. In this chapter, we examine the modelingapproaches that are currently employed to further our understanding of the mitochondrialpathway of apoptosis.
2.3.1 Mithocondrial apoptosis pathway
In mammalian cells there are at least three main pathways which lead to caspase activa-tion, the intrinsic or mitochondrial pathway, the extrinsic or death receptor pathway andthe cytotoxic T-lymphocytes (CTL)/natural killer (NK)-derived granzyme B-dependentpathway. There is a certain amount of crosstalk between the pathways and all may ul-timately result in the apoptotic death of the cell. The intrinsic pathway of apoptosiscan be initiated by various forms of stress such as DNA damage, trophic factor with-drawal, nutrient deprivation, heat shock and oxidative stress. Apoptotic signaling in thispathway results in an increase in the permeability of the mitochondrial outer membraneand the subsequent release of several proteins from the inter-membrane space of the mi-tochondria into the cytoplasm, resulting in the activation of both initiator and e�ectorcaspases. Central to this pathway is the release of cytochrome c from the mitochondria.Normally cytochrome-c resides in the inter-membrane space of the mitochondria, whereit functions by transporting electrons between protein complexes of the respiratory chainduring oxidative phosphorylation. On release of cytochrome-c into the cytosol, it bindsto and activates the adaptor protein, apoptotic protease activating factor-1 (Apaf-1).Oligomerisation of Apaf-1 results in the recruitment of the initiator caspase pro-caspase-9 and the formation of the apoptosome. Once activated, the mature caspase-9 remainspart of the apoptosome complex, with Apaf-1 functioning as an allosteric regulator ofcaspase-9 activity, allowing it to cleave and activate downstream e�ector caspases suchas pro-caspase-3 and pro-caspase-7. The executioner caspases-3 and -7 exist within thecytosol as inactive dimers. When activated, these caspases cleave and activate furtherdownstream caspases such as caspases-2 and -6. Caspase-3 is also involved in a feedbackampli�cation loop to further activate caspase-9.
13

2 Apoptosis
2.4 Nf-kB non-apoptotic pathway
The eukaryotic transcription factor NF-kB was originally discovered transcribing theimmunoglobulin kappa light chain gene in B cells. NF-kB can be activated following avariety of stimuli, including bacterial lipopolysaccharide (LPS), T cell receptor (TCR)signaling, di�erent cytokines, such as TNFa, interleukin 1 (IL-1) and IL-2, viral infections,UV and X-ray radiation, nitric oxide, and also CD95. The NF-kB transcription familycomprises multiple members, including RelA (p65), NF-kB1 (p50, p105), NF-kB2 (p52,p100), c-Rel, and RelB. All NF-kB proteins share a conserved N-terminal 300-aminoacid motif, the Rel homology domain (RHD), which contains a dimerization, nuclearlocalization as well as DNA-binding domain. NF-kB proteins form homo- or heterodimerswith each other, except for RelB. The most prominent dimer which is commonly referredto as NF-kB is the heterodimer of p65 with either p50 or p52. Importantly, only c-Rel, RelA, and RelB possess a transactivation domain and thus act as transcriptionalactivators, while other NF-kB proteins act as transcriptional repressors. In the absenceof activating stimuli NF-kB dimers are inhibited by IkB (inhibitor of NF-kB) proteinsvia ankyrin-repeat motifs and masking their nuclear localization signal. IkB proteins arephosphorylated by IkB kinases (IKKs) and subsequently degraded by the proteasome.The IKK complex, consisting of IKKa, IKKb, and NEMO (IKKg) regulates NF-kBactivation following various stimuli and lack of either IKK complex component blocksNF-kB activation.
2.4.1 CD95-Mediated NF-kB activation
Accumulating evidence suggests that stimulation of CD95 can also induce nonapoptoticpathways, such as tumor growth and invasion, as well as proliferation and programmednecrosis, termed necroptosis. CD95-mediated nonapoptotic signaling occurs via induc-tion of NF-kB, Akt and mitogen-activated protein kinases (MAPK) pathways. These,however, are not well understood, but have been reported to require caspase-8 activity[3]. C-FLIP proteins play a very important role in the regulation of caspase-8 activa-tion [6, 7] as well as induction of nonapoptotic pathways. It could be shown that thecleavage product of c-FLIPL p43-FLIP directly interacts with the IKK complex, leadingto the activation of NF-kB [3]. Other prominent players in nonapoptotic pathways arereceptor-interacting protein 1 (RIP1) and RIP3 which are important for CD95-inducednecroptosis, as well as activation of NF-kB.
2.4.2 TRAIL-Mediated NF-kB activation
Upon binding to TRAILR1, TRAILR2, or TRAILR4, TRAIL can also activate the tran-scriptional factor NF-kB and JNK (c-Jun N-terminal Kinase). Recently, it was suggestedthat TRAF2 (TNF Receptor-Associated Factor-2), an important e�ector of TNF (Tu-mor Necrosis Factor) signaling, was involved in both NF-kB and JNK activation inducedby overexpression of TRAIL receptors. Inactive NF-kB is located in the cytoplasm be-cause its interaction with the inhibitory proteins, IkBs, masks its nuclear translocation
14

2 Apoptosis
signal. When IKK is activated, it phosphorylates IkBs. Then the phosphorylated IkBswill be polyubiquitinated and rapidly degraded by the proteasome. The degradation ofIkBs leads to the release of NF-kB and allows NF-kB to translocate into the nucleusand to activate its target genes, some of which are the crucial mediators of the NF-kBantiapoptotic function.
15

3 Modelling biochemical systems
3.1 introduction
Signal transduction inside cells is carried out by network of interacting signal mediatorsand is often a very complex process. Complexity derives not only from the enormousamount of di�erent molecules involved in the process but also from the presence ofnumerous feedbacks and feedforward loops, both negative or positive, concerning thepathway itself, and ample crosstalks involving distinct pathways. This high degree ofcomplexity issues new challenges in understanding how cellular signaling works in detailand thus new and more powerful tools have to be introduced beyond the simple reasoningon experimental data. Apoptosis signaling pathway represents a typical example ofcomplex network due to the numerous molecules constituting it and the several types ofinteractions between these elements. Hence, in order to analyse in detail the dynamicswhich characterizes this network it is necessary to make use of mathematical tools ableto model the system comprising the majority of its biochemical reactions. The resultingmodel can be used to make predictions of signaling pathway in physiological state togain new knowledge about the process or may be used to test the system varying somequantities and parameters which describe the model to obtain information about networkmalfunctioning and mimicking pathological condictions. The most common approachmakes use of a system of ordinary di�erential equations (ODEs) to model the kinetics ofthe molecules populating the system. This method works well in case of simple networkscomprising just few molecules. When the system under investigation is particularly largeand involves a great amount of interactions between molecules, the ODEs approach isno more e�cient from both implementational and computational point of view. For thisreason the rule-based modeling approach has been introduced providing an easy way toimplement the system and new simulation tools.
3.2 Why modelling apoptosis?
Apoptosis is a phenomenologically easily observable process. However, understandingits mechanistic basis is challenging owing to complex interactions of a large number ofsignaling proteins and emergent behavior at the systems level. After applying a su�cien-tly strong death-inducing stimulus to a population of cells, irreversible signaling eventsare initiated leading to the characteristic appearance of an apoptotic cell: membraneblebbing proceeds, the cell shrinks, and organelles disintegrate. Apoptosis occurs forextrinsic stimuli on a timescale of hours and for intrinsic stimuli of days, and is accessi-ble to several experimental techniques allowing for the acquisition of quantitative data.
16

3 Modelling biochemical systems
The wide range of available experimental techniques and the detailed knowledge aboutmolecular events render apoptosis a system suitable for modeling analyses. Apoptosisinduced by death ligands is one of the few cell fate decisions known to proceed by purelypost-transcriptional mechanisms, thus further simplifying the formulation of mathema-tical models. Even though individual steps of the apoptotic signal transduction cascadesare well understood, we lack insights into the system properties and the dynamics of thedeath decision. Questions to be addressed in apoptosis by systems biology approachesinclude:
1. How do cells ensure that apoptosis robustly occurs in all-or-none manner? What isthe �point-of-no-return� representing irreversibility in apoptosis? Which signalingmotifs are responsible for such digital and history-dependent behavior? As detai-led below, mechanisms proposed using kinetic modeling include bistability due topositive feedback and sigmoidal responses arising from competitive inhibition.
2. How is speci�city in the apoptosis vs. survival responses ensured? A topic of par-ticular interest for apoptosis modeling is that apoptotic stimuli trigger survival ordeath signaling depending on initial conditions and the stimulus strength. Mode-ling can be employed to identify critical nodes of signaling crosstalk that tip thebalance between cell death and survival. Furthermore, the interlocked regulationof cell cycle is a topic followed by modelers.
3. What are the principles underlying cell-to-cell variability in the apoptosis responseof a cell population? Why do cell types di�er in their sensitivity to death-inducingstimuli? Currently, several therapeutic applications are tested to stimulate apop-tosis in cancer cells, to decelerate tumor growth, or to prevent cells, preferentiallyneurons or cardiomyocytes, from undergoing programmed cell death. Modeling ap-proaches could help to plan therapies and to predict the outcome on a populationof cells. Particularly by distinguishing cell death kinetics and the behavioral hete-rogeneity of di�erent cell types, and predicting drug sensitization by cotreatments,modeling could be a valuable tool.
To answer these questions, we �rst give an overview of the basics of mathematical for-malisms in system biology (par. 3.3 and 3.4). At last we review successful application ofODE apoptosis models created to characterize apoptosis pathway (par. 3.4.1).
3.3 Ultrasensitivity
In molecular biology, ultrasensitivity describes an output response that is more sensitiveto stimulus change than the hyperbolic Michaelis-Menten response1 [22]. Ultrasensitivity
1In biochemistry, Michaelis�Menten kinetics is one of best-known models of enzyme kinetics. The modeltakes the form of an equation describing the rate of enzymatic reactions, by relating reaction rate v
to [S], the concentration of a substrate S. Its formula is given by: v =Vmax[S]
Km+[S]. Vmaxrepresents the
maximum rate achieved by the system. The Michaelis constant Kmis the substrate concentration atiwhich the reaction rate is half of Vmax.
17

3 Modelling biochemical systems
can help to �lter out noise or can delay responses. Mechanisms that lead to ultrasensitivestimulus-response curves include cooperativity, multisite phosphorylation, feed-forwardloops, and enzymes operating under saturation. The latter mechanism has been termedzero-order ultrasensitivity because a necessary condition is that the opposing enzymes ofa covalent modi�cation cycle display zero-order kinetics. Molecular binding is an inte-raction between molecules that results in a stable association between those molecules.Cooperative binding occurs if the number of binding sites of a macromolecule, that areoccupied by a speci�c type of ligand, is a non-linear function of this ligand's concentra-tion. This can be due, for instance, to an a�nity for the ligand that depends on theamount of ligand bound.
Figure 3.1: Ultrasensitive versus Michaelian curve response [22]
Oscillations can be observed if an ultrasensitive cascade possesses a negative feedback.Bistability (hysteresis) can occur if such an ultrasensitive cascade is equipped with apositive feedback. Ultrasensitive responses are usually represented by sigmoidal graphs.
3.3.1 E�ect of feedbacks on ultrasensitive cascades
The dynamic behavior of signal transduction cascades is strongly controlled by feed-back loops. These feedbacks act on all levels of signal transduction. Feedbacks arisefrom autocrine induction of hormones, from the transcriptional regulation of cascade in-termediates, from their covalent modi�cation or from receptor internalization. Positivefeedback is a process in which the e�ects of a small disturbance on a system include anincrease in the magnitude of the perturbation. That is, A produces more of B which inturn produces more of A. Mathematically, positive feedback is de�ned as a positive loopgain around a feedback loop. That is, positive feedback is in phase with the input, in thesense that it adds to make the input larger. Positive feedback tends to cause system in-stability. When the loop gain is positive and above 1, there will typically be exponentialgrowth, increasing oscillations or divergences from equilibrium. System parameters willtypically accelerate towards extreme values, which may damage or destroy the system, or
18

3 Modelling biochemical systems
may end with the system latched into a new stable state. Positive feedback may be con-trolled by signals in the system being �ltered, damped, or limited, or it can be cancelledor reduced by adding negative feedback. In the following sections, the consequences ofsuch feedback loops on the dynamics are brie�y reviewed.
3.3.2 Bistability caused by positive feedback
Many theoretical and experimental investigations have shown that a positive (or doublenegative) feedback loop in gene regulatory circuits is a structural condition that allowsfor bistability. A bistable system is a system that exhibits two stable steady states,separated by an unstable state. Often the coexistence of the steady states is a functionof a stimulus; therefore, the system can be switched from one state to another at so-calledsaddle-node bifurcations. There is now ample evidence that bistability is important inbiological signal processing, in the cell cycle, in apoptosis, and in the yeast Gal/Glcnetwork. A prerequisite for observing bistability is that either the cascade or the feedbackloop is ultrasensitive. Bistability provides the means for a biological signaling system tosuppress noise, to memorize the signaling history, or to perform all-or-none decisions. Itis a mechanism to establish checkpoints, i.e. a threshold, which a stimulus has to exceedbefore the system is committed into a new state, e.g. cell cycle phase.
3.4 Computational modeling techniques
Analyzing the cell on a systems view can be done by top-down and bottom-up approaches.Detailed mechanistic mathematical models constructed from the molecular characteris-tics of individual proteins (�bottom-up models�) have only been developed for metabolicand signaling networks. In contrast, transcriptional regulatory networks, and the linkbetween signaling networks and ultimate cellular decisions are best tackled by statis-tical methods which integrate huge amounts of data but are mostly phenomenological(�top-down modeling�). Top-down approaches examine the cell on a global level, treat-ing individual regulatory modules as black boxes that are not analyzed mechanisticallybut only characterized with respect to input�output behavior. Thus, top-down methodstypically do not require much prior knowledge about the system, so that many signal-ing and/or metabolic pathways can be studied at once. Most top-down approaches aresolely data-driven and rely on high throughput screens of cellular behavior (gene expres-sion pro�ling, proteomics, siRNA screening, sequencing, and a�nity assays). Typically,the ultimate goal of top-down approaches is to identify biologically relevant patterns andcorrelations to the data (e.g., disease marker gene identi�cation) or to predict new molec-ular interactions (e.g., reverse engineering algorithms). Bottom-up approaches focus onwell-characterized parts of the biochemical regulatory network, and are typically based onthe assumption that the properties of these subnetworks (or �modules�) can be studied inisolation. Based on prior knowledge and on time-resolved experimental data, mechanisticmathematical models describing the interactions of individual proteins in the module areconstructed (e.g., by using sets of coupled di�erential equations). The goal of bottom-upmodeling is to identify physiologically relevant systems-level properties emerging from
19

3 Modelling biochemical systems
complex interactions within the network (e.g., feedback). Apoptosis-inducing signalingcascades, especially those induced by death ligands, were mainly studied using bottom-upmodeling approaches, since (1) the molecular events are well characterized; (2) transcrip-tional events can be neglected; (3) the ultimate death decision often closely correlateswith all-or-none activation of e�ector caspases, implying that statistical methods are notrequired to link signaling to cellular phenotypes.However, bottom-up approaches to apoptosis are diverse and the methodology of choice
depends on the complexity of the signaling network under study, the available experimen-tal data, and the question to be addressed by modeling. Boolean approaches are typicallyemployed to qualitatively analyze the (quasi-)static behavior of large apoptosis-survivalcrosstalk networks which comprise many molecular species. Ordinary di�erential equa-tion (ODE) models allow for the quantitative description of network dynamics but typi-cally require knowledge about many kinetic parameters which either limits the networksize and/or requires huge amounts of experimental data. Standard ordinary di�eren-tial equations (ODE) modeling may even not be su�cient if spatiotemporally resolvedsingle-cell data is available(1) spatial gradients within the cell can be modeled using subcellular compartment
ODE models or partial di�erential equations (PDEs);(2) cell-to-cell variability may arise due to stochastic dynamics of the apoptotic sig-
naling cascade (�intrinsic noise�) or due to cell-to-cell variability in the expression ofpathway components (�extrinsic noise�).While ODE models with randomly sampled initial protein concentrations can be em-
ployed to simulate extrinsic noise, stochastic simulation algorithms are required to un-derstand intrinsic noise. In the following, we will give an overview of principal di�erencesbetween boolean and quantitaive ODE models.
Boolean models:Simulations of largescale networks is therefore often performed using boolean or logicmodeling, a qualitative approach that is based on network topology, but does not takeinto account quantitative features of individual reactions. Instead protein activities arerepresented by nodes which can either be on or o� (activity 0 or 1), depending onthe activities of upstream input nodes. Logic rules are applied at each iteration: Forexample, in a so-called AND-gate, the node Z will be activated if and only if both inputnodes X and Y are active. In contrast, an OR-gate simply requires either X or Y tobe active. Thus, boolean rules can be used to qualitatively represent real biochemicalmechanisms such as functional redundancy (OR-gate) or coincidence detection (AND-gate), the latter, arising from sequential processing by two distinct enzymes. Since logicalrules are applied iteratively, the approach can be used to study temporal phenomena suchas adaptation. Moreover, boolean networks can exhibit nonlinear dynamic phenomenasuch as oscillations, and stable vs. unstable attractors.
Quantitative models:Boolean models are inherently limited in their capability of quantitatively describing thetemporal dynamics of biochemical networks. In the context of perturbation analysis,
20

3 Modelling biochemical systems
boolean approaches are restricted to the simulation of complete elimination of networknodes and/or reactions; thus, gradual phenomena such as dosage compensation cannotbe studied. Moreover, the qualitative e�ects of perturbations as revealed by booleanmodeling are often intuitively clear. Thus, in many cases, nontrivial and experimentallytestable predictions require quantitative modeling approaches such as ODE and PDEmodeling, as well as stochastic simulations. ODE approaches assume that large numbersof signaling molecules are present within the cell, so that random �uctuations in reactionevents can be neglected by averaging over the whole molecule population. Moreover, inODE modeling it is assumed that the cell represents a well-stirred reactor, implying thatdi�usion e�ects do not matter. In apoptosis networks, these assumptions are likely to beful�lled, as caspase and their regulators are typically expressed at the number of severalhundred thousand molecules per cell. Furthermore, the time scale of apoptosis induction(hours) is slow relative to the time scale of protein di�usion within a cell (millisecondsto seconds); therefore, spatial gradients of apoptosis signaling molecules are unlikely toplay a decisive role in apoptosis initiation.
3.4.1 ODE Models Describing Apoptosis Networks
In this section, we will review some models of apoptosis found in literature. The �rstmechanistic apoptosis model of coupled di�erential equations, presented by Fusseneg-ger et. al. [12], described sequential activation of caspase-8, caspase-9, and caspase-3by intrinsic or extrinsic stimuli. The model encountered for a positive feedback fromcaspase-3 promoting the release of cytochrome c from mitochondria and thus promotingthe additional activation of caspase-9 in apoptosomes. As this model was not trainedagainst quantitative data, it provided only predictions on activated fractions of initiatorand executioner caspases dependent on initial concentrations of apoptosis promoting orinhibiting proteins. A lot of progress has been made since this �rst apoptosis model, anddi�erent aspects have been studied in detail. In the following, we will review a piece ofthe current literature on ODE-based apoptosis modeling.
3.4.1.1 Models of Extrinsic Apoptosis Pathway
Understanding bistability in the process of apoptosis initiation was the focus of the studyof Eissing et. al. [13]. Their model described the bistability in extrinsic apoptosis withinthe context of caspase-mediated positive feedback. Caspase-8 activated by receptor-induced apoptosis in type I cells activates caspase-3, while caspase-3 promotes positivefeedback by caspase-8 activation. A stability analysis of this minimal model showed thatbistability and therefore a stable live steady state were only possible parameter values faro� the experimentally measured kinetic parameters. By extending the model topology,the authors concluded that bistable caspase activation within the physiologically rea-sonable parameter range required the consideration of inhibitors of activated caspase-8.It was found that BAR molecule palys an important role in establish bistability. Theimportant antiapoptotic role of the protein BAR was investigated also in the study ofPace et. al. [14].
21

3 Modelling biochemical systems
3.4.1.2 Models of Intrinsic Apoptosis Pathway
The theoretical study by Bagci at. al. [15] addressed origins of bistability on the levelof MOMP and apoptosome formation. Two positive feedback mechanisms contributeto bistability: �rst, caspase-3 cleaves and inactivates the MOMP inhibitor Bcl-2, andthereby ampli�es its own production. A second feedback arises from the cleavage ofthe MOMP inducer Bid by caspase-3; thus Bid cleavage, initially triggered by caspase-8, can be enhanced by caspase-3. Their mass-action model describes oligomerizationof Apaf-1 bound to cytochrome c to the heptameric complexes of apoptosomes. As thiscooperative oligomerization process leads to higher-order terms in the corresponding rateequation, the positive feedback interactions can result in bistable regimes correspondingto either survival or apoptosis. In the model of Bagci at. al. [15], bifurcation points in thecaspase-3 activity were investigated, that are dependent on the production or degradationof Bax and their relation to inhibitory Bcl-2 proteins. Above a certain threshold for thedegradation rate of Bax or below a certain threshold for the Bax production rate, thebistable behavior is changed into a monostable survival state.
3.4.1.3 Implicit Feedback Mechanism in Intrinsic Apoptosis
In the modeling studies summarized so far, the positive feedback mechanisms knownfrom the biomedical literature and their contribution to bistability were analyzed. Addi-tionally, mathematical modeling could provide valuable insights into non-obvious, hiddenfeedback loops that arise from the topology of the apoptosis network. This phenomenonhas been referred to as implicit positive feedback regulation. The interplay of caspase-3,caspase-9, and inhibitors of apoptosis (IAPs) in the mitochondrial proapoptotic path-way was investigated in a model by Legewie at. al. [16]: cytochrome c released frommitochondria, triggers activation of caspase-9, which in turn cleaves procaspase-3 intoactive caspase-3. Both caspase-3 and caspase-9 are inhibited by XIAPs to prevent au-toreactive activation. Interestingly, an implicit positive feedback loop arises from thedual inhibition of both caspases by XIAPs: once active caspase-3 is generated, it canbind to XIAPs, thus sequestering XIAPs away from caspase-9. This sequestration e�ectenhances caspase-9 activation, resulting in autoampli�cation of caspase-3 cleavage. Inthe model by Legewie et al., the dependency of the concentration of active caspase-3 asthe response to an Apaf-1 concentration shows di�erent characteristics of either monos-table, bistable reversible, or bistable irreversible behavior. The authors concluded thatimplicit positive feedback alone brings a very small range of bistability; however, implicitfeedback synergizes with other feedback mechanisms to establish a broad bistable rangeand irreversibility in the life�death decision. The studies of Chen et. al. [17] combinedODE, stochastic and cellular automaton modeling to further understand signaling pro-cesses that potentially lead to MOMP. In these studies interactions between pore-forminge�ectors (Bax, Bak), activators and enablers (tBid and several others), and inhibitors(Bcl-2 amongst others) that lead to or prevent mitochondria outer membrane perme-abilization are analyzed. After translocation to mitochondria, inactive Bax and Bak arecatalyzed to their active form by an activator. Subsequently, activated Bax and Bak lead
22

3 Modelling biochemical systems
to membrane pore formation and cell death. In the study of Cui et. al. [18], modelsinvolved in the bistability of MOMP were further developed. Questions on the possiblemodel topology led to hierarchical considerations in Chen's[17] and Cui's [18] studies: doactivators and enablers indirectly induce apoptosis by sequestering Bcl-2 away from Bax,or are activators directly proapoptotic by catalyzing the reaction of Bax to its active formthat can cause pore formation and cytochrome c release? This question led to an indirectmodel recapturing the inhibition of Bcl-2 by activators and topologies describing directBax activation. Inhibitors as Bcl-2 in the indirect topology interfere by inhibiting Baxand thereby preventing its oligomerization at the pores. In direct topologies they inhibitactivators from catalyzing Bax activation. Direct topologies were favored in this study,as they involve two possible feedback mechanisms that could contribute to a bistabilityin Bax activation.
3.4.1.4 Models with a switching / threshold mechanisms
The critical roles of c-FLIPL and c-FLIPS, which potentially act as stoichiometric in-hibitors in the DISC, were investigated in a model of Bentele et. al [19]. The dependenceof the ligand concentration threshold on the concentrations of both splicing variants ofc-FLIP was characterized, and it was concluded that c-FLIPs establish a stoichiometricswitch. A large-scale model comprising DISC assembly, caspase activation, MOMP, in-terference from caspase inhibitors, and degradation processes was derived. By a globalsensitivity analysis, clusters of modeled signaling proteins with high mutual sensitivi-ties of protein concentrations were de�ned, which lead to functional subsystems. Bydisregarding parameters that had low sensitivities to parameters in one cluster, the di-mensionality of the parameter estimation problem could be decreased. It could be shownthat the threshold ligand concentration was highly sensitive to the c-FLIP concentrationwhich is consistent with a stoichiometric switch mechanism. It could be shown that theconcentration of c-FLIP at the time of ligand addition is central to apoptosis timing.Another monostable model of the apoptosis threshold was introduced in the theoreticalstudy of Stucki and Simon [20]. However, these authors did not focus on the mechanismof ultrasensitivity, but represented all-or-none caspase-3 activation phenomenologicallyusing a Heaviside function2 in the caspase-3 production term. The major focus of thestudy was to analyze how the caspase-3 activation threshold could be modulated by thecaspase-3 inhibitory XIAPs, the XIAP antagonist Smac, and Smac-binding antiapoptoticproteins such as survivin. The potentially limiting role of caspase-3 degradation was ad-dressed, and it was concluded that XIAPs e�ciently suppress apoptosis by triggering thedegradation of caspase-3 in a nonlinear manner.
3.4.1.5 Models with a timing switch
Steady states, bistable switches, and ultrasensitivity govern long-term decision makingwithin biochemical signaling networks. However, in the context of apoptosis, it is also
2The Heaviside step function, or the unit step function, usually denoted by H (but sometimes u or j),is a discontinuous function whose value is zero for negative argument and one for positive argument.
23

3 Modelling biochemical systems
important that the time course of e�ector caspase activation is abrupt. Such temporalswitching ensures complete and coherent initiation of cellular demise. A recent study con-cluded that the apoptosis timing in single cells consists of a variable lag time followed bythe sudden switch-like e�ector caspase activation (Albeck et. al. [5]). While the lag timevaries within the range of one to several hours, dependent on the stimulus strength, thesudden switching time was shown to be relatively invariant around 30 min. This robust-ness of sudden switching can be interpreted as necessary to prevent from states of partialdestruction that could cause genomic instability. The lag time is lengthened by proteinsupstream of activated Bax, as c-FLIP, BAR, or cytosolic Bcl-2, and shortened by TRAILreceptors, caspase-8, Bid, and Bax. Moreover, the robustness of the switching time isdetermined on the level of Bax�Bcl-2 interaction leading to mitochondria pore formation.Thus, most modeling studies characterizing the temporal dynamics of apoptosis initiationin type II cells employing the mitochondrial pathway focused on regulation at caspase-8or Bcl-2 level. In a combined experimental and theoretical study, Rehm et. al. [21]analyzed the kinetics of temporally switch-like e�ector caspase activation downstream ofmitochondria. In particular, they focused on the control of e�ector caspase activationby XIAP. Their model described apoptosis signaling following MOMP induced by thedrug staurosporine. In their model, Smac and cytochrome c released from mitochon-dria served as stimuli. Subsequent events in the model include apoptosome formation,caspase-9 as well as caspase-3 activation and caspase inhibition by XIAP. Speci�cally,their model predict that a reduction of XIAP levels would not a�ect apoptosis timing,while an XIAP overexpression would signi�cantly delay e�ector caspase activation.
3.4.1.6 Nf-kB Models
To understand the double-edged role of CD95 (APO-1/Fas) activation in apoptosis as wellas in NF-êB activation, models describing the role of c-FLIP on both cell fates were estab-lished (Fricker [7]; Neumann [3]). A focus of the models is the balance between caspaseactivation and inhibitory processes at the DISC. Cleavage of procaspase-8 homodimersbound to FADD can result in two forms that possess catalytic activity: an intermediateform p43 that remains bound to the DISC as a homodimer, and the completely processedform p18 that dissociates from the DISC as p182�p102 heterotetramers. Three splicingvariants of the cellular FADD-like interleukin-1b-converting enzyme inhibitory protein(c-FLIP), c-FLIP short (c-FLIPS), c-FLIP long (FLIPL), and c-FLIP Raji (FLIPR) canheterodimerize with a monomer of procaspase-8 bound to a FADD molecule at the DISCand interfere with caspase-8 activation. The two variants c-FLIPS and c-FLIPR blockprocaspase-8 autoprocessing in a heterodimer and therefore inhibit propagation of theapoptosis signal. In contrast, c-FLIPL can facilitate procaspase-8 cleavage to p43 but notto p18. While the two forms c-FLIPS and c-FLIPR clearly inhibit signal propagation, itwas not obvious if c-FLIPL promotes or also inhibits apoptosis. To resolve this question,a study of Fricker [7] on the signaling function of c-FLIPL combined experiments andmodeling, and showed an ambiguous function of the protein as dependent on the stim-ulus strength. Their model considered the formation of homodimers of procaspase-8 orheterodimers of procaspase-8 and c-FLIP variants at the DISC and either termination
24

3 Modelling biochemical systems
of further reactions or processing to caspase-8 or p43-FLIPL by other active homo- orheterodimers.
3.5 Rule-based modeling
We mentioned the importance to catch every site-speci�c detail of protein-protein in-teractions in order to achieve the complete comprehension of how a signaling pathwaysworks. In addiction to di�culties arising from incomplete experimental data, anotherimpediment is present due to the intrinsic complexity in describing every interaction oc-curring in the network. Signaling proteins contain multiple functional components andseveral sites of post-translational modi�cation. As result, interactions among signalingproteins may generate a myriad of protein complexes and post-translational modi�cationstates. For instance, a protein containing n phosphorylation sites can be found in up to2n distinct states. This feature has been called combinatorial complexity and has beenrecognized as a signi�cant challenge to our understanding about cellular regulation. Inconventional model speci�cation using a set of ODEs, each chemical species that poten-tially populates the system and each reaction that can occur must be explicitly speci�edand this may generate a combinatorial number of coupled di�erential equations mak-ing model implementation tedious, prone to errors or even impossible. Since the samemolecule found in a di�erent state represents a di�erent chemical species, to describecompletely each molecule as many of di�erential equations as the number of its dinstictstates are necassary (without considering any kind of interaction with other molecules).Taking the example above, a protein containing n phosphorylation sites is described by2n di�erential equations. Moreover, the amount of di�erential equations increases rapidlywhen molecules with more than one site bind together forming in a complex which canbe found in a myriad of di�erent possible states. The most common solution adopted toovercome this limitation entails the simpli�cation of the model. Proteins with multiplephosphorylation sites are represented with a single phosphorylation site which reassumesthe properties of all sites, termed virtual phosphorylation site. The same procedure isadopted when a complex sequential multi-step process is taking place by substituting itwith a single step. Obviously these simpli�cations con�icts with the knowledge of cel-lular biochemistry and there is no proof that these assumptions could not a�ict modelpredictions in some way. In order to deal with the issue of combinatorial complexity, anew useful tool has been introduced with the purpose to specify all the reactions arisingfrom molecular interactions in a more e�cient and compact way. Rule-based modelingapproach is based on the key assumption that the characteristics of molecular interactionsdepend on local properties of the protein involved and this modularity mostly determinesthe network dynamics. According to this assumption, structure of a reaction occurringin the network can easily be de�ned by means of a rule. A rule represents a class ofreactions involving reactants with common components and component properties. Theimportant simpli�cation of the rule-based modeling approach is that all the reactionswithin a class are assigned the same rate law. In conclusion, both rule-based model andODEs model provide a representation of chemical kinetics but they are di�erent in the
25

3 Modelling biochemical systems
model speci�cation procedure. While in ODEs model the modeler must state explicitlywhich chemical species populate the system and how these are connected and in�uenceeach other, in a rule-based model, the modeler must state only the interactions occurringin the system and their contextual dependencies. Rule-based modeling approach is im-plemented by means of two major languages, termed Kappa and BioNetGen. Due to itsfacility of use we chose BioNetGen language to implement our models but the di�erencescompared with Kappa language are neglegible.
3.6 BioNetGen language
BioNetGen [4] is a set of software tools for rule-based modeling and is a mnemonicfor �Biological Network Generator�. The software not only generates reaction networksstarting from reaction rules, but also simulates such networks using a variety of methods.In order to understand how this software practically implements a biological system usingrule-based modeling, we report a simple example taken from that will clear the basicconcepts lying beneath this approach.
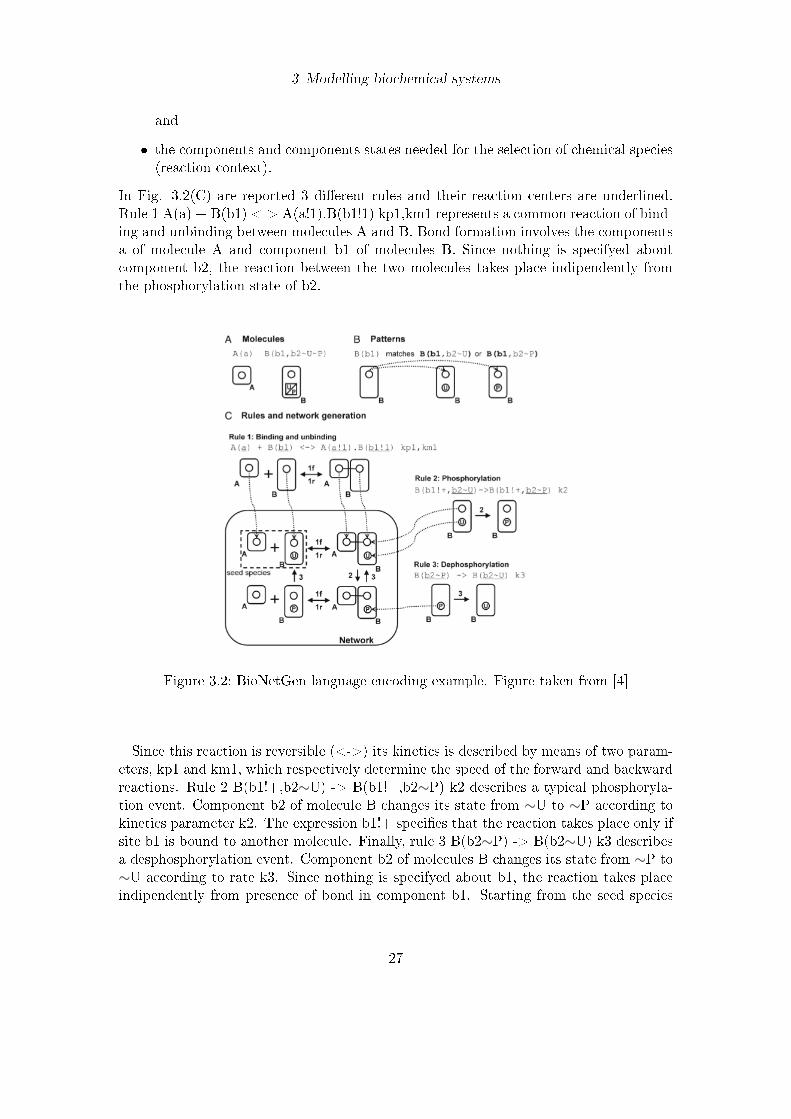
Bionetgen language encoding example: Fig. 3.2 depicts the implementation of a sim-ple network in all its essential parts. Molecules are implemented as structured objectsthat can be constituted by di�erent components. These components represent functionalelements of proteins and may have associated states representing covalent modi�cationsor conformations (e.g. phosphorylated/ unsphosphorylated state, active/inactive stateetc.). The expression reported in Fig.3.2(A) indicates the de�nition of two moleculestypes. A(a) represents the presence of molecules type A having only the componet a.B(b1,b2∼U∼P) represents molecules type B having two components, b1 and b2. Inparticular, the expression b2∼U∼P indicates that component b2 may be found in twopossible states, ∼U and ∼P, which can be used to indicates respectively the unphophory-lated and the phosphorylated states. Components of distinct molecules can link togetherforming a bond, thereby building complexes of assembled molecules. Patterns can beused to select particular molecular attributes. In particular, the pattern B(b1) shownin Fig. 3.2(B) selects molecules B having the binding site b1 completely free despite ofthe phosphorylation and binding status of b2 component. Rules are needed to specifythe biochemical transformations that can potentially take place in the system. The term�transformation� is used instead of �reaction� to indicate that the same reaction ruleis applied to a selected set of reactant species and not necessarily to only one chemi-cal species. This approach is worthy if, as already said, the chemical reactions mainlydepend on the local properties of protein components. Modularity feature implies thatthe same reaction rule can be used to describe the transformation of di�erent chemicalspecies sharing common components and component properties. This selection methodof the chemical species permits to write many complicated chemical reactions in a set offew rules making more compact and e�cient the implementation of the model. In rules,the �pattern matching� is accomplished specifying two essential parts:
� the protein components directly modi�ed by the transformation (reaction center)
26
3 Modelling biochemical systems
and
� the components and components states needed for the selection of chemical species(reaction context).
In Fig. 3.2(C) are reported 3 di�erent rules and their reaction centers are underlined.Rule 1 A(a) + B(b1) <-> A(a!1).B(b1!1) kp1,km1 represents a common reaction of bind-ing and unbinding between molecules A and B. Bond formation involves the componentsa of molecule A and component b1 of molecules B. Since nothing is specifyed aboutcomponent b2, the reaction between the two molecules takes place indipendently fromthe phosphorylation state of b2.
Figure 3.2: BioNetGen language encoding example. Figure taken from [4]
Since this reaction is reversible (<->) its kinetics is described by means of two param-eters, kp1 and km1, which respectively determine the speed of the forward and backwardreactions. Rule 2 B(b1!+,b2∼U) -> B(b1!+,b2∼P) k2 describes a typical phosphoryla-tion event. Component b2 of molecule B changes its state from ∼U to ∼P according tokinetics parameter k2. The expression b1!+ speci�es that the reaction takes place only ifsite b1 is bound to another molecule. Finally, rule 3 B(b2∼P) -> B(b2∼U) k3 describesa desphosphorylation event. Component b2 of molecules B changes its state from ∼P to∼U according to rate k3. Since nothing is specifyed about b1, the reaction takes placeindipendently from presence of bond in component b1. Starting from the seed species
27
3 Modelling biochemical systems
the rules are applied generating other new species and thus new reactions. The processcontinue iteratively until no new reactions are found or some other stopping criteria aresatis�ed creating the complete network model. Fig. 3.2(C) depicts this phase startingfrom the seed species A(a) and B(b1,b2∼U) up to the creation of a complete networkcontaining all the possible species which may populate the system according to rules 1, 2and 3. This simple but explicative example depicts some of the typical events occurringin a biological pathway. Phosphorylation and dephosphorylation of a molecular site andbinding and unbinding of two proteins are fundamental events taking place in a signalingpathway and governing its dynamics. However, this set of few rules can be extendedusing more molecules with di�erent components and components properties opening thedoor to implementation of very complex systems.A BioNetGen input �le is mainly constituted by six sections including all the informa-
tion about the biological system and they are brie�y presented here:
� (parameters) De�ne the parameters that govern the dynamics of the system suchas rate constants, the values for initial concentrations of chemical species, compart-ment volumes and physical constants used in unit conversions. The synthax of aline in the parameters block is
[index] parameter [=] value
where square brackets indicate optional elements, parameter is a string consistingof only alphanumeric characters plus the underscore character and containing atleast one nonnumeric character. value may be either a number in integer, decimalor exponential notation or a formula involving numbers and other parameters inC-style math synthax;
� (molecule types) De�ne molecules, including components and allowed componentstates. As already said, molecules are structured objects composed of componentsable of binding to each other. Components typically represent physical part of pro-teins such as domains and motives and may also be associated with a list of statelabels, which represent states or properties of the components. Examples of com-ponent states modeled using state labels may concern conformation (e. g. open orclosed), phosphorylation status and location (e. g. extracellular space, membrane,cytoplasm). The synthax of a line in the molecule types block is
[index] moleculeTypes
where moleculeTypes has the synthax for a BioNetGen species;
� (seed species) De�ne the initial state of system such as initial chemical species towhich rules are applied. The synthax of a line in the seed species block is
[index] species [initialPopulation]
28

3 Modelling biochemical systems
where species has the synthax for a BioNetGen species described above and ini-tialPopulation is a number or formula that speci�es the amount of the speciespresent at the start of the �rst simulation (default is zero);
� (observables) De�ne model outputs, which are functions of the population levels ofmultiple chemical species sharing a set of properties. The synthax of a line in theobservables block is
[index] [observableType] observableName pattern1[ ,pattern2]
where observable Type is either Molecules or Species (default is Molecules), ob-servable Name is a valid name for a BioNetGen observable, and each pattern is avalid BioNetGen pattern;
� (functions) De�ne the functions describing the kinetic rate constants which cannotbe described by a simple constant value but which show a kind of dependenciesfrom concentrations of some chemical species present in the system. The synthaxof a line in the functions block is
f() = formula
where f() is the name of the function and formula is an mathematical expressioninvolving the concentration of one or more chemical species which have to be nec-essarily listed in the observables block;
� (reaction rules) De�ne rules describing which chemical species are involved in atransformation and which are the consequences of this transformation. Each ruleis similar to a standard chemical reaction notation having four basic elements:reactant patterns, an arrow, product patterns and a rate law speci�cation. Thesynthax of a line in the reaction rules block is
[index] rPattern1 [+rPattern2] ... arrow pPattern1 [+ pPattern2] ...rateLaw1[,rateLaw2] [command1] ...
where each Pattern is a valid BioNetGen pattern, arrow is one of �->� or �<->�,each rateLaw is a parameter or a rate law function. Rules may transform a selectedset of reactant species by adding or deleting molecules or bonds and by changingcomponent state labels. An example for each case is reported below
29

3 Modelling biochemical systems
begin reaction rules#Add a bondA(a) + B(b) -> A(a!1).B(b!1) k_a#Delete a bondA(a!1).B(b!1) -> A(a) + B(b) k_d#Change a component state labelA(Y∼P) -> A(Y∼U) km3#Add a moleculeI() -> I() + A(a,Y∼U) ksynth#Delete a moleculeA() -> Trash() kdegend reaction rules
� actions) Perform two basic types of actions, generate the chemical reaction net-work implied by the model speci�cation and simulate this network using di�erentmethods. An example of actions commonly used are reported below
#actionsgenerate_network({overwrite=>1});#kineticswriteSBML({});simulate_ode({t_end=>120,n_steps=>120});resetConcentrations();simulate_ssa({su�x=>ssa,t_end=>120,n_steps=>120});
� generate_network command directs BioNetGen to generate a network of speciesand reactions through iterative application of the rules starting from the set ofseed species. This behaviour can be overridden setting the option overwrite=>1.writeSBML indicates that the network is written to an SBML �le. simulate_odecommand initiates a simulation of the dynamics implementing and numericallysolving a set of ODEs. t_end and n_steps specify respectively the end time forthe simulation and the number of steps at which the results are written to theoutput �les. reset Concentrations command restores the concentrations to theinitial values. simulate_ssa command initiates a stochastic simulation. su�x=>ssacommand appends �_ssa� to the basename for output �les of the simulation.
All the information about BioNetGen software and syntax are fully described in [4].
3.6.1 BioNetGen simulation tools
It is worthy to clear some aspects concerning the simulation tools o�ered by BioNetGensoftware. One possible method (the one presented above) entails the iterative applica-tion of rules to the set of de�ned seed species in order to generate a network before the
30

3 Modelling biochemical systems
simulation starts. Subsequently, the simulation may be carried out either by numericallysolving ODEs or by implementing a stochastic simulation algorithm (SSA). SSA impliesa kinetic Monte Carlo simulation using the Gillespie algorithm [9] and produces stochas-tic trajectories representing the concentrations of observables species. Alternatively, therules may be applied during the simulation as the set of populated species grows using aprocedure that has been called �on-the-�y� network generation and simulation. As a �rststep only the reactions involving seed species are initially generated. Then, BioNetGendetects when a reaction event occurs that populates one or more species to which ruleshave not been previously applied and automatically expands the network through ruleapplication. This method is useful when a network is potentially unrestricted such as inpolimerization processes which allows aggregates formation of any size. For this reasonto generate a complete network before prediction starts may be dangerous unless somestopping criteria are speci�ed. An example of this simulation method is reported below
#simulation on-the-�ygenerate_network({overwrite=>1,max_iter=>1});simulate_ssa({t_end=>50,n_steps=>20});
where max_iter set to 1 indicates that only the reactions involving seed species areinitially generated. For all the mentioned methods the simulation cost scales with thenetwork size, hence simulation of large-scale reaction networks may become impractical.In particular, the CPU time required for model simulation increases exponentially as thenumber of network reactions grows. In order to overcome this computational limit, net-workfree methods have been introduced such as NFsim. NFsim [10] guarantees a constantcost of simulation per reaction event and thereby implies a linear increase of the CPUtime with the number of reaction events in the system. NFsim generalized the rule-basedversion of Gillespie's stochastic simulation algorithm (SSA) and guarantees very similarresults compared with SSA but with a outstanding saving in time. An example of NFsimis reported below
#network-free simulationsimulate_nf({su�x=>nf,complex=>1,t_end=>50,n_steps=>20})
.
31

4 Mathematical model of apoptosis
4.1 Introduction
In this section we implement a model of the apoptosis pathway. As seen in the previoussection (3.4.1) there are a lot of models in literature, each of them describing a di�erentbehavior of the pathway. We decided to focus only on two models that describe withhigh accuracy two di�erent and important extrinsic apoptosis pathways: Albeck's andNeumann's model. The �rst evaluates the molecular reactions generated by stimolationof TRAIL receptors related to mitochondrion, while the second generates a series ofreactions by CD95 (FAS) receptors and takes into account both caspase (apoptotic) andNf-kB (non apoptotic) pathways.At �rst, we have realized the models separately and veri�ed the match between results
obtained and those showed in literature. Subsequently, we have integrated them creatinga single complete model including as many elements as possible of the apoptosis signal-ing pathway. The rule-based modeling approach has been prefered in order to overcomecombinatorial complexity that often limits the implementation of large models. BioNet-Gen language, as said in the previous section, is a software that allows to follow this newmodeling approach and to encode the model by means of a simple set of rules. Mod-els taken from literature were originally implemented using sets of ordinary di�erentialequations (ODEs) and thus they needed to be translated using the rule-based modelingapproach. In the following chapters there will be decribed in details Albeck's [2, 5] andNeumann's [3] model of extrinsic and intrisinc apoptosis pathway.
4.2 Albeck's model of intrinsic apoptosis with TRAIL
Albeck's model [2, 5], already introduced in section 3.4.1.5 describes the pathway gen-erated by the exposure of TRAIL ligand. They supposed that apoptotic events occurslike a biological switch. To understand how this extrinsic apoptosis switch functionsin quantitative terms, they constructed a mathematical model based on a mass-actionrepresentation of known reaction pathways. The model was trained against experimentaldata obtained by live-cell imaging, �ow cytometry, and immunoblotting of cells perturbedby protein depletion and overexpression. The trained model accurately reproduces thebehavior of normal and perturbed cells exposed to TRAIL, giving the possibility of studyswitching mechanisms in detail. In thier studies, Albeck et al. examine the relative dy-namics of initiator and e�ector caspase activation and MOMP using four experimentaltools:
1. live-cell reporters speci�c to initiator and e�ector caspases;
32

4 Mathematical model of apoptosis
2. a biologically inert reporter of MOMP;
3. �ow cytometry and immunoblot analysis of endogenous substrates;
4. perturbation of speci�c proteins using RNAi, protein over-expression and smallmolecule drugs.
To monitor caspase behavior in single living cells, they constructed three �uorescentprotein (FP) fusions (Fig. 4.1 A, B). The �rst, e�ector caspase reporter protein (EC-RP),monitors caspase-3 activity (and, to a lesser extent, caspase-7 activity) and is composedof a Forster Resonance Energy Transfer (FRET) donor-acceptor pair (CFP and YFP)connected via a �exible linker that contains the caspase cleavage sequence DEVDR (Fig.4.1 B). When the linker is cleaved, energy transfer is lost and CFP signal increases. Thisevent can be monitored by live-cell microscopy. Initiator caspase reporter protein (IC-RP) carries tandem copies of IETD in its linker, a sequence that is e�ciently cleavedby caspase-8, but poorly by caspases-3,7. IETD constitutes the site in procaspase-3 forinitiator caspase cleavage, and IC-RP cleavage is therefore a good readout of procaspase-3activation.
33

4 Mathematical model of apoptosis
Figure 4.1: Process diagram of the death receptor network modeled by Albeck et al. (A)The major features of the network are highlighted by color: gray, receptormodule; blue, direct caspase cascade; green, positive feedback loop; yellow,mitochondrial feed-forward loop. (B) A condensed alternate representationof the network.
Finally, a reporter for MOMP that localizes to the inter-membrane space (IMSRP) wascreated by fusing RFP to the mitochondrial import sequence of Smac (residues 1- 59).FP fusions to full-length cytochrome c and Smac have been described by other authors,but IMSRP di�ers from these fusions in lacking an IAP-binding motif, and it is therefore
34
4 Mathematical model of apoptosis
biochemically inactive. To validate the properties of EC-RP, IC-RP, and IMS-RP invivo, HeLa cells stably expressing the reporter proteins were treated with TRAIL andcycloheximide (CHX) and �uorescence signals monitored every 3 min over an 8-12 hrperiod.When Albeck et al. try to implement the model, three simpli�cations were made to
reduce the number of species and free parameters. The �rst concerns the details ofDISC and apoptosome assembly, both of which involve multiple copies of several proteinspecies, that are replaced by simpli�ed ``lumped parameter'' representations. The secondis refered to the omission of all mechanism involved in protein synthesis by performing theexperiments in the presence of cycloheximide (which is commonly used to sensitize cellsto the action of TNF, but which, in thier works, also simpli�es modeling by eliminatingsource terms). As third sempli�cation, proteins with similar biochemical activities wererepresented by single species: C8 and caspase-10 (C10) by C8 alone; C3 and C7 byC3 alone; and Bcl-2-like family of proteins by three prototypical examples: Bid, a pro-apoptotic ``activator,'' Bcl-2, an apoptosis inhibitor, and Bax, a pore-forming protein.The last parameters discussed are still a matter of dispute about the precise mechanismby which Bcl-2-like proteins regulate MOMP; so, they decided to implement the simplestform of ``direct activation'' of Bax molecules by t-Bid formation (see par. 2.1.4).Mathematical model of proteins was constructed using elementary reactions, repre-
sented by ODEs. All biochemical transformations were represented as unimolecular orbimolecular reactions. Transport between cellular compartments is also modeled as anelementary unimolecular reaction while the assembly of multiprotein complexes is mod-eled as a series of bimolecular reactions. Because no complex algebric forms, such asHill functions, are used in Albeck's model, ultrasensitivity and other nonlinear behaviorsarise from interactions among simple elementary reactions rather than the proprieties ofhigher-order equations.The �nal model contains 58 species corresponding to 18 gene products having nonzero
initial conditions and 40 additional species representing complexed, cleaved, or di�eren-tially localized forms of the initial species, which interact via 28 reactions described by70 nonzero rate constants (including forward, reverse, and kcat rates for each reaction).
4.2.1 Model description
The dynamics of extrinsic apoptosis made by Albeck can be summarized in a three co-operating but asynchronous processes: direct cleavage of e�ector caspases by initiators,cytosolic translocation of pro-apoptotic mitochondrial proteins, and feedback from ef-fector to initiator caspases. Activation of initiator and e�ector caspases is a de�ningcharacteristic of apoptosis. E�ector caspases cleave essential cellular substrates and di-rectly dismantle cells, while initiator caspases have a more limited range of substratesand act primarily to regulate e�ector caspases. The precise all-or-none control of caspaseactivation is critically important for control of cell fate: e�ector caspases must not turnon prematurely, but once active they must fully cleave their substrates and provoke celldeath.The chain of events that initiates extrinsic cell death begins with ligand-induced assem-
35

4 Mathematical model of apoptosis
bly of death-inducing signaling complexes (DISCs) on TNF, Fas, or TRAIL receptors.The initiator caspases-8 and -10 are activated by enforced dimerization at DISCs, afterwhich they cleave e�ector pro-caspases. The activation of procaspase-3 by proteolysis ismediated exclusively by initiator caspases. Subsequent to cleavage by initiators, e�ec-tor caspases are regulated by trans-acting factors such as Xlinked inhibitor of apoptosisprotein (XIAP), which blocks the proteolytic activity of caspase-3 by binding tightly toits active site. XIAP may also encode an E3 ubiquitin ligase that promotes caspase-3ubiquitination and its subsequent proteasome mediated degradation.In most cells (those with type-II regulation), XIAP-mediated inhibition of caspase-3
is relieved by a pathway that involves mitochondrial outer membrane permeabilization(MOMP). MOMP is regulated by the Bcl-2 family of proteins, which function either asproapoptotic (e.g. Bid or Bax) or anti-apoptotic (e.g. Bcl-2) factors. Initiator caspasesdirectly cleave Bid, which then activates Bax by altering its conformation. Activated Baxtranslocates to the mitochondria, forming pores that allow Smac/Diablo and cytochromec to translocate from their normal locations in the mitochondrial inter-membrane space tothe cytosol. Smac binds tightly to XIAP, blocking XIAP's caspase-3-inhibitory activity,while cytochrome c binds Apaf-1 and caspase-9 to form the apoptosome. Finally, in atleast some cells, active caspase-3 cleaves procaspase-6, which then generates additionalcaspase-8 in a feedback loop. In the described model is possible to recognise mainly fourinteracting cell death subcircuits (�g. 4.1) :
1. a lumped-parameter representation of receptor binding by TNF or TRAIL andthe subsequent activation of pro-C8 by receptor-bound death-inducing signalingcomplexes (DISC) to form C8* (�g. 4.1, gray);
2. an enzyme cascade in which C8* directly cleaves C3 to form active C3*, which cancleave e�ector caspase substrates (a process represented in our model by cleavageof PARP to form cPARP) but not when bound to XIAP (X-linked IAP �g. 4.1,blue);
3. a mitochondrial feed-forward pathway in which C8* cleaves Bid (into tBid) to acti-vate Bax (to Bax*) and promote formation of pores in the mitochondrial membranethrough which CyC and Smac translocate into the cytosol following MOMP; cy-tosolic CyC then binds Apaf-1 and C9 to form the apoptosome (which also cleavespro-C3 ), and Smac neutralizes XIAP, thereby de-inhibiting C3* (�g. 4.1, yellow);
4. a positive feedback loop in which pro-caspase-6 (pro-C6) is cleaved by C3* to formC6*, which then activates additional pro-C8 (�g. 4.1, green).
4.2.2 Model implementation using BioNetGen
In this paragraph is desctibed the model implementation using BioNetGen language, onthe base of what already explained on section 3.6. First, we de�ned initial parametersand kinetics of the reactions from Albeck's work. We wrote them in the 'begin parametes'section.
36

4 Mathematical model of apoptosis
pC8_init 2e4 # pro cas 8Bar_init 1e3 # Bifunctional apoptosis regulator....k1 4e-7*60k_1 1e-3 *60kc1 1e-5*60...
After that, we de�ned di�erent con�gurations of the initial species in the dedicatedsection �begin molecule types� in the command line. In the example below, procaspase3 has a binding site named B and can reach active (a), inactive (i) or ubiquinated (u)states while Bax molecule has 4 binding sites and 3 di�erent states: inactive (i), active(a)and inside the mitochondrial (m). In this command section it is possible to de�ne bothchemical and spatial di�erent conformations.
C3(B,S∼a∼i∼u)Bax(B1,B2,B3,B4,S∼i∼a∼m)
In the �begin species� section we initialized the species with the same starting values ofAlbeck's paper. We used the labels wrote in the �begin parametes� section. We have toset an initial concentration only on a single state of the molecule (e.g. we have to de�netwo initial concentrations of caspase 8 because it can be in two di�erent states: activeand inactive). In this case we de�ned only procaspase 8 concentration and the activeform value was setted automatically to 0.
C8(B,S∼i) pC8_init
In the �begin observables� section we decided which concentrations examine during theanalysis, following its evolution with a graph. We showed di�erent molecules combinationby usings �ags according to chapter 3.6. In the following example the label �DISC_Flip�is referred to the concentration of DISC molecule linked to Flip molecule in the bindingsite �Bs�.
Molecules DISC_Flip �ip(Bs!1).DISC(Bs!1)
In the last section (�begin reaction rules�) we have described the reactions present inthe system, representing the dynamic of the interactions between di�erent molecules.Now, we de�ne new di�erent molecules and complexes generated by molecule binding.This is the case, for example, of active C8 generation by binding of DISC with proC8through an unidirectional reaction, regulated by kc3 kinetic ( de�ned before in the �beginparameters� section ).
active C8 by C6 loopC3(B,S∼i) indicates the inactive form of caspase 3 (procaspase 3). In the �rst reac-tion (7) procaspase 3 binds to active caspase 8 C8(B,S∼a) producing the new moleculeC3(B!1,S∼i).C8(B!1,S∼a). Double arrows indicate that reaction is under equilibrium,so it can be reversible. In reaction (8), C3(B!1,S∼i).C8(B!1,S∼a) gives active cas-pase 3 and active C8. Considering both (7) and (8) reactions, that have in common
37

4 Mathematical model of apoptosis
C3(B!1,S∼i).C8(B!1,S∼a), is interesting observing that the only species that changes itsphysical state is caspase 3 that turns from inactive to active form. The same mechanismoccurs considering the combination of (9) and (10) reactions: procaspase 6 (C6(B,S∼i))binded to active C3, promotes active caspase 6 (C6(B,S∼a)) formation. In turn reactions(11) and (12), as �nal step, form active caspase 8 (C8(B,S∼a)) from pro caspase 8 andactive caspase 6. Summarizing, active C8 generates a positive feedback loop through aseries of reactions ending with formation of other active C8.
7 C3(B,S∼i) + C8(B,S∼a) <-> C3(B!1,S∼i).C8(B!1,S∼a) k5, k_58 C3(B!1,S∼i).C8(B!1,S∼a) -> C3(B,S∼a) + C8(B,S∼a) kc59 C6(B,S∼i) + C3(B,S∼a) <-> C6(B!1,S∼i).C3(B!1,S∼a) k6, k_610 C6(B!1,S∼i).C3(B!1,S∼a) -> C6(B,S∼a) + C3(B,S∼a) kc611 C8(B,S∼i) + C6(B,S∼a) <-> C8(B!1,S∼i).C6(B!1,S∼a) k7, k_712 C8(B!1,S∼i).C6(B!1,S∼a) -> C8(B,S∼a) + C6(B,S∼a) kc7
mythocondrial ampli�cation loopMitochondrial ampli�cation loop starts with t-Bid molecule. The latter is generated byactive C8 that binds to Bid (Bid(B,S∼i)) molecule (17) and cleaves it (Bid(B,S∼t)) (18).The mechanism behind Bax and mitochondrial activation is still unknown. Albeck et al.supposed direct molecule activation through t-Bid.
17 Bid(B,S∼i) + C8(B,S∼a) <-> Bid(B!1,S∼i).C8(B!1,S∼a) k10, k_1018 Bid(B!1,S∼i).C8(B!1,S∼a) -> Bid(B,S∼t) + C8(B,S∼a) kc10
Truncated Bid (Bid(B,S∼t)) binds to Bax inactive form (20) (Bax(B1,B2,B3,B4,S∼i)),present in the citosol, and makes it active (21) (Bax(B1,B2,B3,B4,S∼a)). In the nextstep (22) Bax translocates reversibly into the mitochondrion (Bax(B1,B2,B3,B4,S∼m)).At �rst Bax oligemerizes (24) with another molecule of Bax (Bax2) to �nally form (26)a complex composed by 4 molecules (Bax4). Bax, Bax2, Bax4 can be inhibited by mi-tochondrial Bcl2 molecule (23, 25, 27) (Bcl2(B,S∼m)), a stronger apoptotic suppressor.When four molecules of Bax bind together they start to open mythocondrial pores (28,29) that becomes active Mit(B,S∼a). Reactions (30 ,31, 34) and (32, 33, 40) repre-sent cytosolic release of apoptotic factors like cytocrome-c (cytC(B,P∼c)) and SMAC(SMAC(B,P∼c)). They change from an inactive state ( cytC(B,P∼m), SMAC(B,P∼m)), inside the mitochondrion, to an active state ( cytC(B,P∼a), SMAC(B,P∼a) ) andtranslocate into the citosol.
38

4 Mathematical model of apoptosis
20 Bax(B1,B2,B3,B4,S∼i) + Bid(B,S∼t) <-> Bax(B1!1,B2,B3,B4,S∼i).Bid(B!1,S∼t)k12, k_1221 Bax(B1!1,B2,B3,B4,S∼i).Bid(B!1,S∼t) -> Bax(B1,B2,B3,B4,S∼a) + Bid(B,S∼t) kc1222 Bax(B1,B2,B3,B4,S∼a) <-> Bax(B1,B2,B3,B4,S∼m) k13, k_1323 Bax(B1,B2,B3,B4,S∼m) + Bcl2(B,S∼m) <->Bcl2(B!1,S∼m).Bax(B1!1,B2,B3,B4,S∼m) k14, k_1424 Bax(B1,B2,B3,B4,S∼m) + Bax(B1,B2,B3,B4,S∼m) <-> Bax2(B) k15, k_15 # Bax2+ Bcl2 <�> MBax2:Bcl225 Bax2(B)+ Bcl2(B,S∼m)<-> Bax2(B!1).Bcl2(B!1,S∼m) k16, k_16 # Bax2 + Bax2<�> Bax2:Bax2 == Bax426 Bax2(B) + Bax2(B) <-> Bax4(B) k17, k_17 # Bax4 + Bcl2 <�> MBax4:Bcl227 Bax4(B) + Bcl2(B,S∼m) <-> Bax4(B!1).Bcl2(B!1,S∼m) k18, k_18 # Bax4 + Mit0<�> Bax4:Mito28 Bax4(B) + Mit(B,S∼i) <-> Bax4(B!1).Mit(B!1,S∼i) k19, k_19 # Bax4:Mito �>AMito29 Bax4(B!1).Mit(B!1,S∼i) -> Mit(B,S∼a) kc19 # AMit0 + mCtoC <�> AMito:mCytoC30 Mit(B,S∼a) + cytC(B,P∼m) <-> Mit(B!1,S∼a).cytC(B!1,P∼m) k20, k_20 #AMito:mCytoC �> AMito + ACytoC31 Mit(B!1,S∼a).cytC(B!1,P∼m) -> Mit(B,S∼a) + cytC(B,P∼a) kc20 # AMit0 + mS-Mac <�> AMito:mSmac32 Mit(B,S∼a) + SMAC(B,P∼m) <-> Mit(B!1,S∼a).SMAC(B!1,P∼m) k21, k_21 #AMito:mSmac �> AMito + ASMACC33 Mit(B!1,S∼a).SMAC(B!1,P∼m) -> Mit(B,S∼a) + SMAC(B,P∼a) kc21 # ACytoC<�> cCytoC34 cytC(B,P∼a) <-> cytC(B,P∼c) k22, k_22 # Apaf + cCytoC <�> Apaf:cCytoC
40 SMAC(B,P∼a) <-> SMAC(B,P∼c) k26, k_26
Once released, cytocrome-c binds (35, 36) to inactive Apaf complex (Apaf(B,S∼i)) ac-tivating it (Apaf(B,S∼a)). Procaspase 9 (C9(B,S∼i)) iteracts with Apaf to form Apopto-some (Apop(B)) (37). Albeck et al. sempli�cates Apoptosome formation by consideringonly a single Apaf molecule instead of seven. At last, Apoptosome (38, 39) binds pro-caspasi 3 (Apop(B!1).C3(B!1,S∼i)) and promotes its activation (C3(B,S∼a)). The newactive caspase 3 enhances, like a positive feedback loop, those just formed by active C8direct cleavage (8).
35 cytC(B,P∼c) + Apaf(B,S∼i) <-> cytC(B!1,P∼c).Apaf(B!1,S∼i) k23, k_23 #Apaf:cCytoC �> Apaf* + cCytoC36 cytC(B!1,P∼c).Apaf(B!1,S∼i) -> cytC(B,P∼c) + Apaf(B,S∼a) kc2337 Apaf(B,S∼a) + C9(B,S∼i) <-> Apop(B) k24, k_24 # Apaf*+ Procasp9 <�>Apoptosome38 Apop(B) + C3(B,S∼i) <-> Apop(B!1).C3(B!1,S∼i) k25, k_25 # Apop +pCasp3 <�> Apop:cCasp3 �> Apop + Casp339 Apop(B!1).C3(B!1,S∼i) -> Apop(B) + C3(B,S∼a) kc25
Parp degradation and apoptosisAt last active C3 (C3(B,S∼a)) binds PARP substrate (15) (C3(B!1,S∼a).PARP(B!1,S∼a))and starts to degradate it (16) (PARP(B,S∼d)). When active C3 pass a certain threshold,apoptosis occurs in a irreversible manner.
39

4 Mathematical model of apoptosis
15 C3(B,S∼a) + PARP(B,S∼a) <-> C3(B!1,S∼a).PARP(B!1,S∼a) k9, k_916 C3(B!1,S∼a).PARP(B!1,S∼a) -> C3(B,S∼a) + PARP(B,S∼d) kc9
4.3 Neumann's model of extrinsic apoptosis withFAS/APO-1
Neumann's model, already introduced in section 3.4.1.6, explores the dilemma in cellularsignaling that triggering of CD95 (Fas/APO-1) in some situations results in cell deathand in others leads to the activation of NF-kB. They established an integrated kineticmathematical model for CD95-mediated apoptotic and NF-kB signaling.
Figure 4.2: Reduced model is su�cient to explain dynamics of life/death signaling. (A)Reduced model of CD95-mediated caspase and NF-kB activation. CD95 re-ceptor and FADD are merged into one entity named RF. (B) The table liststhe consecutive reduction steps performed from models 1 to 8. (C) Modelcomparison using the relative goodness of �t, expressed in % of the values as-sociated with model 1, are labelled with black circles. Red diamonds indicatethe number of reactions of each model and squares show the correspondingnumber of parameters.
They perform a model reduction resulted in a surprisingly simple model well approx-imating experimentally observed dynamics. The model postulates a new link betweenc-FLIPL cleavage in the death-inducing signaling complex (DISC) and the NF-kB path-way.They validated experimentally that CD95 stimulation resulted in an interaction ofp43-FLIP with the IKK complex followed by its activation. Furthermore, they showedthat the apoptotic and NF-kB pathways diverge already at the DISC. Model and ex-
40

4 Mathematical model of apoptosis
perimental analysis of DISC formation showed that a subtle balance of c-FLIPL andprocaspase-8 determines life/death decisions in a nonlinear manner. Cell death can oc-cur in two di�erent ways in type I and type II cells. Type I cells are characterized byhigh levels of CD95 DISC formation and increased amounts of active caspase-8, leading tothe direct activation of downstream e�ector caspases-3 and -7 and subsequent apoptosis.Type II cells are characterized by lower levels of CD95 DISC formation, and caspase-3activation requires additional ampli�cation through the release of pro-apoptotic factorsfrom mitochondria triggered by the caspase-8-mediated cleavage of the Bcl-2 family pro-tein Bid. Recently, experiments have demonstrated that CD95L is not only a potentapoptosis inducer but can also activate multiple nonapoptotic pathways, in particularinduction of transcription factor NF-kB.The NF-kB family regulates the expression of genes crucial for innate and adaptive im-
mune responses, cell growth and apoptosis. In most cells, the NF-kB dimer is sequesteredin the cytosol by inhibitors of the kB protein (IkB), and its nuclear translocation can beinduced by a wide variety of stimuli through activation of the IkB kinase (IKK) complex.The IKK complex consists of two catalytic subunits, IKKa and IKKb, and a regulatorysubunit IKKg/NEMO. On activation of the IKK complex, IkB is phosphorylated and de-graded in an ubiquitin-dependent manner. The NF-kB dimers can then translocate intothe nucleus to induce transcription of target genes. However, the exact molecular mech-anism of NF-kB activation through CD95 remains unclear. DED-containing proteins,such as procaspase-8 and c-FLIP have a prominent role in NF-kB activation. c-FLIP N-terminal cleavage products p43-FLIP and p22-FLIP strongly induce NF-kB. p43-FLIPis generated by procaspase-8 at the DISC on CD95 stimulation. It has been shownto interact with components of the TNFR-mediated NF-kB activation pathway, TN-FRassociated factor 1 (TRAF1), TRAF2 and receptor-interacting protein (RIP), whichtogether promote NF-kB activation. Interestingly, it has been shown that c-FLIPL/S/Rform heterodimers with procaspase-8, resulting in the generation of the cleavage frag-ment p22-FLIP. This protein mediates NF-kB activation by binding directly to the IKKcomplex. p22-FLIP di�ers from p43-FLIP in that it is generated in nonapoptotic cellswithout DR stimulation. Thus, various molecules of the CD95 signaling machinery, suchas procaspase-8 and c-FLIP have a complex role in CD95-mediated apoptosis and NF-kB pathways. These �ndings motivated their systems biology approach and promptedthem to determine whether CD95- mediated signaling should be considered as a dynamicsystem resulting in life/death decisions. It has been shown repeatedly that decision mak-ing is often a process brought about by a reaction system rather than by the in�uenceof a single molecule. Neumann propose an integrated quantitative model supported byexperimental data for CD95-mediated apoptosis and NF-kB activation. A direct interac-tion between p43-FLIP and the IKK complex is postulated by the model and validatedexperimentally. The model also predicts a divergence of the two pathways at the DISCand that the cellular decision depends on the balance between the levels of c-FLIPL andcaspase-8. Experimental modulations of DISC protein amounts are all consistent withthe model predictions.For the model validation Neumann used HeLa, HeLa-CD95, HeLa-CD95�p65�mCherry
and HeLa-CD95�c-FLIPL cells. A total of 107 cells were either treated with indicated
41

4 Mathematical model of apoptosis
amounts of anti- CD95 antibody for indicated periods of time at 37◦C. They investigatedCD95 signaling by western blot analysis of HeLa cells stably overexpressing CD95�GFP(HeLa-CD95) and treated the cells with agonistic anti-CD95 antibodies at three concen-trations: 1500, 500 and 250 ng/ml. The simultaneous induction of apoptosis and NF-kBactivation and their di�erent dynamics led them to investigate the divergence point ofthe two pathways.To reduce the large number of free parameters, they simpli�ed the reactions to be irre-
versible with the exception of a reversible enzymatic scheme used for caspase activation.The model contains unknown reaction constants and concentrations that they estimatedfrom their data by least-squares optimization.
4.3.1 Model description
The CD95 protein (APO-1/Fas) is a member of the death receptor (DR) family, a sub-family of the tumor necrosis factor receptor (TNF-R) superfamily. Cross linking of CD95with its natural ligand, CD95L, or with agonistic anti-CD95 antibodies induces apop-tosis in sensitive cells. The signal transduction of CD95 starts with the formation ofthe death-inducing signaling complex (DISC) detectable within seconds after receptorstimulation. The DISC consists of CD95, the adaptor molecule FADD, procaspase-8a/b,procaspase-10 and c-FLIPL/S/R. Procaspase-8 is converted at the DISC, through a seriesof autoproteolytic cleavage steps, into p43/p41 and p18, which leads to the activation ofe�ector caspase-3. Procaspase-3 was also cleaved to the active subunit p17 showing theinduction of the apoptotic pathway. In parallel, they observed the phosphorylation ofIkBa followed by its degradation. Stimulation of CD95 caused apoptosis at all antibodyconcentrations. The quanti�ed blots demonstrate that apoptotic and NF-kB pathwayswere activated on a similar time scale. They hypothesized that p43-FLIP is the missinglink between the DISC and the IKK complex. The kinetics of phosphorylated IkBa in-dicate a temporal correlation between CD95 stimulation and IKK activity. The simplestscheme to explain this phenomenon would be through p43-FLIP generation at the DISCand subsequent interaction with the IKK complex.Neumann model assumes a trimerized ligand (L) that binds to a trimerized CD95
receptor (R) that can recruit three copies of FADD (F) leading to the DISC formation.Subsequently, DEDcontaining proteins, such as procaspase-8 (C8), c-FLIPL (FL) and c-FLIPS (FS) can bind to FADD. The order of protein binding gives rise to a combinatorialvariety of intermediates.Assembled DISCs can be categorized into three groups: the �rst group contains at
least two copies of procaspase-8 and is further processed by p43/p41 into active proteasesubunits, p18 and p10, forming an active caspase-8 heterotetramer (C8*). This apoptoticbranch of the model also includes procaspase-3 and procaspase-6 (C3 and C6), their activeforms (C3* and C6*), the inhibitor IAP and a feedback loop from caspase-6 to caspase-8.The second group of DISCs features at least one copy of procaspase-8 and one copy ofc-FLIPL giving rise to p43-FLIP. The model postulates that p43-FLIP interacts withthe IKK complex leading to phosphorylation of IkB (NF-kB IkB P), which entails itsdegradation and the translocation of p65 to the nucleus (NF-kB*). For simplicity, they
42

4 Mathematical model of apoptosis
assume that the entire pool of IkB is bound to NF-kB.In the third group of DISCs, they considered all remaining con�gurations. They do not
participate in further signaling and are merged in a terminal state (L R F F F X X X). Thekey features of the model are its partitioning into DISC formation, apoptotic and NF-kBsignaling, and the con�nement of all interactions between the two pathways to the DISC.As expected from the model structure, c-FLIPS inhibited both pathways, although p43-FLIP generation was inhibited at a lower threshold than p43/p41 generation. Low andhigh levels of c-FLIPL both inhibited p43-FLIP generation, giving rise to a bell-shapedactivation pro�le. In this model, the gene transcription induced by NF-kB was neglected.It shows that the activity of e�ector caspases is not required for reproducing the dynamicsof CD95-mediated NF-kB activation. The model was tested on wild type HeLa cellsand they found taht the increased receptor number in HeLa-CD95 cells resulted in theampli�cation of both CD95-mediated apoptosis and NF-kB signaling. Furthermore, theyobserved that the amount of CD95 receptors determines the death rate, in contrast tothe apoptotic threshold concentration that remained constant (30-100ng/ml of anti-CD95antibodies). An intresting dynamic behavior is that the peak of phosphorylated IkB-a wasreached within 1h and was rather invariant to the stimulus intensity; on the contrary, thedynamics of caspase-8 and caspase-3 activation showed a marked delay with decreasingstimulus strength.
4.3.2 Model implementation using BioNetGen
Following chapter 4.2.2 we started with the �begin parameters� section by de�ning con-centration of species and kinetics of the model. We also de�ne the three anti-CD95 dosesthat was used to valuate the model. We labelled them L01, L02 and L03: from thegreatest to the smallest.
L01 1.1322e2L02 3.7740e1L03 1.887e1pC3_init 1.4434
We wrote di�errent molecule conformations in the �begin molecules types� section.Then, we set the initial concentrations of the species in the �begin molecules species�section according to the labels de�ned before in the �begin parameters� section. Forexample: NfkB is naturally present in the cytosol as a complex, binded with IkB kinase,so, we de�ne initial concentration of the complex (NfkB(B!1,S∼i).IkB(B1!1,B2)) with�NF_kB_IkB_init� value.
NfkB(B!1,S∼i).IkB(B1!1,B2) NF_kB_IkB_initIKK(B,S∼i) iIKK_init
DISC formationDISC, represented by (L(Rb!1).Rf(B1!1,B2,B3)) molecule, could bind three di�erentmolecules: procaspase 8 (C8(B,S∼i)), cFLIP-L (FL(Bs)) and cFLIP-S (FS(Bs)). Inreaction (2), DISC binds C8 forming L(Rb!1).Rf(B1!1,B2!2,B3).C8(B!2,S∼i) complex ,
43

4 Mathematical model of apoptosis
in reaction (3) binds c-FlipL forming L(Rb!1).Rf(B1!1,B2!2,B3).FL(Bs!2) complex andin reaction (4) binds c-FlipS forming L(Rb!1).Rf(B1!1,B2!2,B3).FS(Bs!2) complex. AsDISC has two binding sites and could bind three di�erent molecules, a di�erent combi-nation of nine complexes can be found.
# DISC-C8 formation2 L(Rb!1).Rf(B1!1,B2,B3) + C8(B,S∼i) -> L(Rb!1).Rf(B1!1,B2!2,B3).C8(B!2,S∼i)k2# DISC-FL formation3 L(Rb!1).Rf(B1!1,B2,B3) + FL(Bs) -> L(Rb!1).Rf(B1!1,B2!2,B3).FL(Bs!2) k3# DISC-FS formation4 L(Rb!1).Rf(B1!1,B2,B3) + FS(Bs) -> L(Rb!1).Rf(B1!1,B2!2,B3).FS(Bs!2) k4
DISC that binds just one molecule of FS (5, 6, 7, 9, 10) or, two molecules of cFlipL (8)(L(Rb!1).Rf(B1!1,B2!2,B3!3).FL(Bs!2).FL(Bs!3)), don't generate any pathway. For thisreason, these ones, are considered inhibitors of DISC formation.
# DISC-C8-FS formation - NO signalling5 L(Rb!1).Rf(B1!1,B2!2,B3).C8(B!2,S∼i) + FS(Bs) ->L(Rb!1).Rf(B1!1,B2!2,B3!3).C8(B!2,S∼i).FS(Bs!3) k7# DISC-FS-FS formation - NO signalling6 L(Rb!1).Rf(B1!1,B2!2,B3).FS(Bs!2) + FS(Bs) ->L(Rb!1).Rf(B1!1,B2!2,B3!3).FS(Bs!2).FS(Bs!3) k7# DISC-FS-C8 formation - NO signalling7 L(Rb!1).Rf(B1!1,B2!2,B3).FS(Bs!2) + C8(B,S∼i) ->L(Rb!1).Rf(B1!1,B2!2,B3!3).C8(B!2,S∼i).FS(Bs!3) k5# DISC-FL-FL formation - NO signalling8 L(Rb!1).Rf(B1!1,B2!2,B3).FL(Bs!2) + FL(Bs) ->L(Rb!1).Rf(B1!1,B2!2,B3!3).FL(Bs!2).FL(Bs!3) k6# DISC-FS-FL formation - NO signalling9 L(Rb!1).Rf(B1!1,B2!2,B3).FS(Bs!2) + FL(Bs) ->L(Rb!1).Rf(B1!1,B2!2,B3!3).FS(Bs!2).FL(Bs!3) k6# DISC-FL-FS formation - NO signalling10 L(Rb!1).Rf(B1!1,B2!2,B3).FL(Bs!2) + FS(Bs) ->L(Rb!1).Rf(B1!1,B2!2,B3!3).FS(Bs!2).FL(Bs!3) k7
A combination of DISC, FL and C8 (18, 19) molecules, form p43-�ip (p43FLIP(B))that promotes Nf-kB pathway. DISC that links two molecules of procaspase 8 (11)(L(Rb!1).Rf(B1!1,B2!2,B3).C8(B!2,S∼i) + C8(B,S∼i)) generates two molecules of p43p41(p43p41(B) + p43p41(B)) that iniziate caspases apoptotic pathway.
44

4 Mathematical model of apoptosis
# DISC-C8 + C8 generate p43p4111 L(Rb!1).Rf(B1!1,B2!2,B3).C8(B!2,S∼i) + C8(B,S∼i) -> p43p41(B) +p43p41(B) k5# DISC-FL-C8 generate p43FLiP18 L(Rb!1).Rf(B1!1,B2!2,B3).FL(Bs!2) + C8(B,S∼i) -> p43FLIP(B) k5# DISC-C8-FL generate p43FLiP19 L(Rb!1).Rf(B1!1,B2!2,B3).C8(B!2,S∼i) + FL(Bs) -> p43FLIP(B) k6
Caspase 3 ampli�cation loopTwo molecules of p43p41, combined together (13), form one molecule of active caspase 8(C8(B,S∼a)) that promotes (15) activation of caspase 3 (C3(B,S∼a)). At last (17), activecaspases 3 iteracts with procaspase 8 and form new p43p41 molecules (p43p41(B)). Thismechanism is used (11) to create new active caspase 8 and represents a positive feedbackampli�cation loop. Reactions (14) and (16) represent natural cellular degradation ofactive caspase 8 and 3 respectively (-> Trash()).
# 2 p43p41 forms active caspase 813 p43p41(B) + p43p41(B) -> C8(B,S∼a) 2*k8# degradation of active C814 C8(B,S∼a) -> Trash() k1115 C3(B,S∼i) + C8(B,S∼a) -> C3(B,S∼a) + C8(B,S∼a) k916 C3(B,S∼a) -> Trash() k1217 C8(B,S∼i) + C3(B,S∼a) -> p43p41(B) + C3(B,S∼a) k10
Nf-kB pathwayOnce that p43Flip was activated at DISC, it leads to the activation (20) of the cytoplas-matic IKK molecule (p43FLIP(B!1).IKK(B!1,S∼a)). This one iteracts (22) with NfkB,that is linked to IkB (NfkB(B!1,S∼i).IkB(B1!1,B2)), and phosforilate it(NfkB(B!1,S∼i).IkB(B1!1,B2!2).P(B!2)). At last, the phosforilated complex (23) be-
comes active NfkB (NfkB(B,S∼a)) and translocates into the nucleus. Some degradationreactions ((21) and (24)) was also introduced.
20 p43FLIP(B) + IKK(B,S∼i) -> p43FLIP(B!1).IKK(B!1,S∼a) k1321 p43FLIP(B!1).IKK(B!1,S∼a) ->Trash() k16# NfkB phosforilation22 NfkB(B!1,S∼i).IkB(B1!1,B2) + p43FLIP(B!1).IKK(B!1,S∼a) ->NfkB(B!1,S∼i).IkB(B1!1,B2!2).P(B!2) + p43FLIP(B!1).IKK(B!1,S∼a) k1423 NfkB(B!1,S∼i).IkB(B1!1,B2!2).P(B!2) -> NfkB(B,S∼a) k15# degradation of NfkB24 NfkB(B,S∼a) -> Trash() k17
45

4 Mathematical model of apoptosis
4.4 Model integration
When we analized system biology pathways (par. 2.2.1) we found that both Trail and Fasupregulates DISC formation and Nf-kB formation in a di�erent manner [8]. Therefore, weaim to create a new model of type II cells1 that takes into account both mytochondrialactivation and Nf-kB generation from DISC. Nf-kB activation induces transcriptionalfactors (Flip,Bid,..) which may inhibit DISC formation and mitochondrial release ofapoptotic factors. This mechanism could be a way to ensure cell survival. Neumann'smodel is based on type I cells, that are caracterized by high level of DISC formation;instead, those considered by Albeck, is based on type I cells and need mytochondrialampli�cation to ensure cell death.
Figure 4.3: It represent a schematic of the overlapping parts of Neumann's and Albeck'smodel. In the middle (yellow rectangles) there are molecules present in bothmodels. Pink connections mean that the pathway belong to Albeck whileblue connections belong to Neumann.
These two models also contain several overlapping parts (�g. 4.3). They both modeledDISC formation and C8 feedback loop but in a di�erent way. Neumann et. al. considertrimerization at the DISC (section 4.3.1) that may binds di�erent combination of threemolecules: procaspase 8, c-FLIPL and c-FLIPS; while Albeck et. al. (section 4.2.1)
1Type II cells has been de�ned to be mitochondrial-dependent, they need release of mitochondrialfactors to enhance and de�nitively lead cell to apoptosis.
46

4 Mathematical model of apoptosis
modeled DISC like a dimer that may binds only two molecules: procaspase8 and FLIP (healso simpli�ed both the two isoforms of Flip in one entity). Neumann et. al. sempli�edC8 feedback loop (C8->C8*->C3*->C6*->C8*) by deleting the contribute of procaspase6, while Albeck et. al. considered the entire loop reaction.The new model will consider activation of Nf-kB and mitochondrial pathway by both
Trail and Fas receptors. We started by adding at Albeck's model, two Neumann's reac-tions: DISC complex formation and Nf-kB pathway. We kept the original mitochondrialand C6 ampli�cation loop. Before integrating the two models, we performed calibrationof the systems. We made a time conversion from seconds to minutes in Albeck's modeland we coverted concentration from nM to number of molecules/cell in Neumann's model(see 4.4.2.1).As will be de�ned in the following, As previous seen, we have performed sensitivity
analysis of both the models at DISC in order to �nd parameters that are important forthe dynamic of the systems. Then, we used a nonlinear least-squares method performedin MatLab for model merging and calibration. We used, like objective function, thedi�erence between Albeck's active C8 time concentration and that predicted by ournew model. To import the model from BioNetGen to MatLab we used the BioNetGencommand:
writeM�le();
Which generate a 'xxx.m' �le, where 'xxx' is the same name of the BioNetGen �le.Inside there will be a function structured like this:
function [err, timepoints, species_out, observables_out] = apoptosis_albeck(timepoints, species_init, parameters)
We can now simulate our model by controlling a lot of parameters. We can modify thetime samples by altering the column vector named timepoints, we can change speciesinitial values in the raw vector called species − init and change parameter values byadjusting the raw vector called parameters. The latter input vector (parameters) wasvery advantageous because permits to perform sensitivity analysis that need parameterperturbation (see below). As outputs, the function returns four di�erent vectors: errthat is 0 if the integrator exits without errors, timepoints that return a row vector oftimepoints de�ned inside of the function and generated before in BioNetGen (see 3.6.1),species− out: an array with population trajectories of the species and observable− outthat contains only observable trajectories de�ned in the �begin observable� section ofBioNetGen. Observable− out trajectories are a subset of species− out trajectories. Tosummarize, by calling this function you can simulate any concentration of the species andchange any initial value parameters in order to make some useful analysis like sensitivityanalysis or parameter calibrations.
4.4.1 Robust parametric sensitivity analysis
Parametric sensitivity analysis (PSA) has become one of the most useful tools incomputational systems biology, in which the sensitivity coe�cients are used to study
47

4 Mathematical model of apoptosis
the parametric dependence of biological models. As many of these models describedynamical behaviour of biological systems, PSA has subsequently been used toelucidate important cellular processes that regulate this dynamics. This algorithmpermits to understand what are the key molecules and the core reactions of the system.These informations may be used to make model adjustement or modi�cation. A littlevariation of sensitive parameters may cause a big perturbation of the dynamic of theentire system. In the case of programmed cell death, ligand concentration needs toexceed a certain threshold to induce a complete apoptosis. Sensitivity analysis providesa useful tool to investigate how this threshold and thus cellular susceptibility toapoptosis could be modulated pharmacologically. Moreover, sensitivity analysis hasbeen applied to identify reactions determining whether a cell dies by type I or type IIcell death, and to reduce model complexity. We use it mainly to �nd modi�cableparameters in order to perform model integration. A standard PSA consider thecontrubute of a little (local) variation of a parameter dpj compared to the di�erencebetween the old and the new outputs obtained by parameter variation: dxi. Tonormalize this comparison we divide them by their original values. Therefore, therelative sensitivity of a variable xi at time t (in min) with respect to a parameter pj isgiven by:
sij(t) =pjxi· dxidpj
(4.1)
The digital version of 4.1 is:
sij(t) =pjxi· 4xi4pj
=pjxi· xi − xoldipj − poldj
(4.2)
To implement 4.2 equation, we have �rst to decide the increment 4pj for each param-eter (e. g. 10% of the original value). Then we use it to calculate the new output iat timet : xi. If we select a positive increment, we will ignore the possible contributethat negative increment may have in our system dynamics. Therefore, we considerednot only a small positive increase of a single parameter, but a uniform distribution ofnegative and positive variation of the same parameter at a �xed percentage: pj(k). Forexample, we can select a series of N=50 variations distribuited between -10% and +10%of a single parameter pj . Once selected, the percentage increment and the length of theserie (N), we evaluate each new parameter with 4.2 formula. Hence, we obtain N of thesij coe�cent for each parameter. To �nd the total sensitive coe�cent, we perform themean:
¯sij(t) =1
N·∑N
|sij(t, pj(k))| (4.3)
We summed absolute values to rule out that positive and negative sensitivities canceleach other. Finally we calculate the time-averaged sensitivities according to:
Sij =
ˆ¯sij(t) · dt (4.4)
48

4 Mathematical model of apoptosis
Equation 4.4 was evaluated in MatLab with digital trapezoid method. This di�erentway to perform sensitivity analisis using 4.3 ,that considered local surrounding of eachparameter, make standard parametric sensitivity analisis more roboust. All of the sen-sitivity coe�cents Sij can be plotted in a 3D-bar diagram having pjparameters insteadof axis x , each xi observables instead of axis y and Sij values instead of axis z. In thisthesis another bar diagram (2D) was made by meaning all the sensitivity coe�cents Sijacross the di�erent observables:
Sj =1
M·∑i
Sij (4.5)
In this way we obtain an overall single sensitivity index for each parameter calculatedonly in a range of observables. The sensitive algorithm code performed in MatLab ispresent in Appendix section.
4.4.1.1 Neumann DISC sensitivity analysis
In Neumann's work [3] they have just performed a sensitivity analysis to further con�rmthe importance of DISC protein levels in the dynamics of apoptosis. They found thatthe initial concentrations of DISC proteins especially of c-FLIP isoforms were the mostsensitive parameters, summing up to 63% of the total sensitivities.
Figure 4.4: Sensitivity analysis. Absolute values of relative sensitivities were averagedover a time interval of 360 min. The pie chart shows the contribution ofdi�erent parameter categories to the total sensitivity. No of parameters indi-cate di�erent parameters in the model while no.proteins indicate the di�erentobservables of the system.
49

4 Mathematical model of apoptosis
The remaining 20 parameters contributed only to 37% of total sensitivities. Thisresult explains how relatively small changes in the abundance of DISC proteins mightlead to drastic changes in downstream signaling as already observed for the amount ofCD95. The decrease in procaspase-8 level resulted in a signi�cantly lower amount ofp43-FLIP after CD95 stimulation. Subsequently, it led to the abolishment of CD95-mediated phosphorylation of IkB. Furthermore, the amount of active caspase-8, p18, wasdecreased, hence leading to reduced apoptosis. Therefore, by perturbing the ratio ofprocaspase-8 to c-FLIPL at the DISC, they have in�uenced the induction of apoptosisand NF-kB activation.
4.4.1.2 Albeck DISC sensitivity analysis
Albeck et. al. did not perform a sensitivity analysis of his model. Therefore, we did itby using methods explained in previous chapter. We obtained a 2D bar diagram using,like observables, the concentrations involved in DISC formation: TRAIL-receptor, DISCreclutation, Bar, Flip, procaspase 8 and its active form. We used only observables thatrepresent a key mechanism in apoptosis propagation and cell death. Apoptosis is a cas-cade of reactions that leads to substrate degradation so, some chemical reactions are aconsequence of more important upstream reactions. For this reason, it is not good to se-lect them in sensitivity analysis. E.g: Bax activation, Smac release and all mitochondrialreactions are all regulated by a more important upstream reaction: Bid molecule trun-cated by active C8. By considering only tBid concentration we take into account almostall the reactions involved in mitochondrial propagation.If you perform a parametric sen-sitivity analysis considering, like observables, all the concentration of the species, you willobtain sensitivity coe�cents that are insubstantialy. There will be coe�cents, like Bid orprocaspase 8 initial concentration, that will outnumber all the other parameters for thefact that they regulate a large series of reactions. For these reasons, we selected activeC8 activity concentration to perform sensitivity analysis because it regulates multipleprocesses: from mythocondrial activation loop to C6 activation loop, from C3 activationto cell death. As seen in the �gure 4.5, we found intresting results. TRAIL concentra-tion (L50 in �gure) and kinetic, that activate DISC complex (kc1), are sensitive factors.They regulate both DISC concentration and C8 activity in a direct manner. A�nityof pro caspase 8 to the DISC (k3) and initial concentration of the species present inthe DISC, are other core parameters.In particular, c-Flip and procaspase 8 initial valuesplay an important role in apoptosis signal propagation. At least, activation of C8 byC6 through C3 loop (k7) is a signi�cative parameter because generates a lot of activeC8 in a short period of time. To sum up, the essential parameters that lead to initiatorcaspases activation are those involved in DISC formation, inibition and ampli�cation.
50

4 Mathematical model of apoptosis
51

4 Mathematical model of apoptosis
Figure 4.5: Figure A represents sensitivity analysis made in Albeck's model using likeobservabels: DISC reclutation, trail receptors, pro C8, its active form, Barand Flip (axis y). In axes x there are the parameters of the model. Figure Brepresents a 2D bar diagram showing the sensitivity coe�cent of active C8like. In green color there are the parameters involved in DISC formation.
4.4.2 Merging using nonlinear least-squares method
The least squares method is a standard approach to the approximate solution of overde-termined systems, i.e., sets of equations in which there are more equations than un-knowns. "Least squares" means that the overall solution minimizes the sum of thesquares of the errors made in the results of every single equation. The most importantapplication is in data �tting. The best �t in the least-squares sense minimizes the sumof squared residuals, a residual being the di�erence between an observed value and the�tted value provided by a model. Least squares problems fall into two categories: linearor ordinary least squares and non-linear least squares (NLLSQ), depending on whetheror not the residuals are linear. The linear least-squares problem occurs in statisticalregression analysis; it has a closed-form solution. A closed-form solution (or closed-formexpression) is any formula that can be evaluated in a �nite number of standard oper-ations. The non-linear problem has no closed-form solution and is usually solved byiterative re�nement; at each iteration the system is approximated by a linear one, andthus the core calculation is similar in both cases. A non linear least squares problem isan unconstrained minimization problem of the form:
minimizex f(x) =1
2
m∑i=1
fi(x)2 ≡ 1
2F (x)TF (x) (4.6)
52

4 Mathematical model of apoptosis
where F is the vector-valued function:
F (x) = ( f1(x) f2(x) . . . fm(x) )T
F is composed by a series of function (fm(x)) we want to minimize. Usually we wantto �t a model to a concentration of samples of a particular molecule (e.g: insulin or oxi-gen evoltution). Hence, f1(x) represents the di�erence between the discrete-experimentconcentration and that obtained with our parameter variation of the model. For a gooddata �tting is important to �nd a reasonable starting point. To perform parametersestimation in MatLab we used the lsqnonlin function:
options = optimset('TolFun',1e-3);[x ,resnorm, residual, exit�ag, output, lambda, jacobian] = lsqnonlin(ObjFun, x0,lb, ub, options);
WhereObjFun is the nonlinear vector function whose sum of squares you want tominimize; x0 is the initial point (vector) for the algorithm, lb and ub are the lower andupper bounds of the variables, speci�ed as a vector, and options provides the function-speci�c details for the options values. If not speci�ed, Gauss-Newton method was used toperform the algorithm. We speci�ed ObjFun as a function handle of the form @objfun,where objfun.m is an M-�le that returns a vector function value. With 'TolFun' settedto 1e − 3 the algorith run until the di�erence between the current residual and thosecalculated in the previous step is minor of 1e − 3. x represent the vector of the newparameters, x0 the initial parameters, x0lb the lower bounds and x0ub the upper bounds.
Objective functionChoosing the correct function to minimize and the right initial parameters is essentialfor a positive ending of the algorithm. Therefore, we used, like objective function, thedi�erence between Albeck's active C8 (aC8old(x, t) ) and that obtained from the newmodel ( aC8new(x, t) ). Referring to the the eq.4.6 we obtain:
F (x) = objFunc = ( f(x) )T = (aC8new(x, t)− aC8old(x, t))T
We use active C8 because it has a central role in determine both Nf-kB and active C3apoptotic pathways.The active C8 concentrations were obtained without considering the contribution of
caspase 6 positive feedback loop. For these reason, we simulated the model by notconsidering the initial value of procaspase 6 (pC6init=0). In his work, Neumann et. al.[3] asserted that NfkB was activated at the same time of active C8 and it was indipendentfrom caspase activity. This, further con�rm that C8 was the right objective function toconsider.
53

4 Mathematical model of apoptosis
4.4.2.1 Parameters calibration
Before you perform NLLSQ method for data �tting , by calibrating a set of parameters,is important to ask some questions about the model such as: what bounds can weplace on the values of the initial parameters? Does the model adeguately �t the data?How sensitive are the parameters to changes in the data? To answer these questions wepreviously performed sensitivity analisys of both models ( �g. 4.4, 4.5 ). A sensitive valueis a parameter that, with a little variation of itself, cause a big mutation of the dynamics ofthe system. Both Neumann's and Albeck's models sensitive parameters are, above all, theinitial concentrations and kinetics of the reactions and species involved in DISC formationand ampli�cation (par. 4.4.1.1, 4.4.1.2). DISC formation and its initial concentrationsplay a crucial role in controlling the downstream reactions. In particular, dynamic ofcaspase 8 formation regulates both cell death (through mithochondrial activation andC6 feedback loop) and survival (through Nf-kB activation). Understanding dynamics ofthese system is very important in order to create a new integrated model. Therefore, toobtain the best �ttings, it is important to reasonably calibrate the entire system.
Figure 4.6: Figure on top showing the di�erence between original Albeck's caspase 8concentration and those of the new model stymulated by TRAIL before pa-rameter calibration. There is a marcable delay of caspase 8 activation of thenew model. The second �gure showing the concentrations after calibration.This has a di�erence in the number of molecules per cell activated.
54

4 Mathematical model of apoptosis
We used, as most of the initial parameters, those of Albeck's model. We introduced twonew molecules involved in DISC formation: FlipS and FlipL. Since procaspase 8 and 3initial concentrations were present in both models, we set as initial value in the x0 vectorthe arithmetic mean of the two. E.g: Neumann's starting concentration of C3 moleculeswas 38000 while Albeck's was 20000. Therefore, we set procaspases 3 initial concen-tration with the mean: 29000. We decided to keep constant those parameters involvedin mitochondrial pathway and Nf-kB formation and to give down and upper bounds atthose implicated in DISC formation and C6 ampli�cation loop. The bound values wereset 100 times greater and smaller than the originals. After de�nition of starting initialparameters (x0), lower bounds (x0lb) and upper bounds (x0ub) we performed the NLLSQmethod to obtain the new vector of parameters (x). It was di�cult to �t concentrationof active C8 like the original model because we introduced di�erent dynamics in DISCformation. Therefore, we didn't obtain a perfect �t but we only reasonably reduced thedistance between the two (�g. 4.6). The NLLSQ algorithm made the new model, as soonas possible, equal to the original.In the bar diagram below (�g. 4.7) it is represented the ratio between the new estimated
parameters and their starting values in a logarithmic scale. E.g: k1 represents a�nityof Trail ligand in its receptor and it has a value of 9. So, the new obtained parameter ise9 = 8103.1 times greater than its initial value.
Figure 4.7: Bar diagram showing the ratio between the new parameters (obtained duringthe application of NLLSQ method) and the initial parameters in a logaritmicscale. E.g. the new kn3 parameter (�ip that binds DISC) is e2 = 7, 3 timesgreater than its starting value.
55

4 Mathematical model of apoptosis
For reasonably promote caspase 8 formation and activation, kc1 (invovled in DISCformation), kn2 (representing a�nity of procaspasis 8 to DISC complex) and kn8 (thatpromoted active caspasis 8 formation by two molecules of p43p41) were enhanced. For thesame reason, c-Flips molecules inhibit with a di�erent mechanism. c-FlipL a�nity to theDISC kn6 was enhanced while c-FlipS a�nity kn5 was severely reduced. Thus, cFlipLmolecule becomes more important in active C8 formation than cFlipS as con�rmed inthe next chapter by sensitivity analysis (par. 5.2.6). The initial DISC molecules concen-tration in Fas receptor (Rf_init) has a negative value, so it is e−4 = 0.0183 times smallerthan its original value. In order to reproduce the lower concentration of DISC molecules,typical of type II cells, a new �Rf_init� value was setted. Procaspasi 8 and Trail re-ceptors initial concentrations were increased while procaspasi 3, FlipS, FlipL and Fasreceptors initial concentrations were decreased. These values remain consistent becausethey are between the initial values of both the models. To sum up, the NLLSQ algorithmcalibrated the model by fastening all reactions involved in procaspase 8 activation andguarantee the number of molecules per cell predicted by Albeck's model.
Corrective factorsFirst of all, homogeneity in time units describing kinetics parameters must be guaran-tee. Neumann's models express the parameters in [min−1] whereas Albeck's model uses[sec−1]. Hence, all the parameter expressed in [sec−1] should be multiplied for 60 totransform them in [min−1]. It is worthy to discuss an essential aspect linked to BioNet-Gen implementation concerning the fact that concentrations should be expressed in unitsof copies per cell and thus bimolecular rate constants in per molecule per cell. This simplymeans that every time a quantity is expressed in M or in M−1 (unless time units) thishas to be multiplied or divided by the product (NA ∗ V ), where NA is the Avogadro'snumber and V indicates cellular volume. Since many biological systems involve ligandspresent in extracellular space, receptors spread out on the cell surface and molecules sit-uated in the cytoplasm, the value of V changes depending on molecule location. For thisreason it is important to identify where molecules are located, such as Trail that bindsto his receptor on the plasma membrane and subsequently summon DISC mechanism inintracellular space. Therefore, the computed values of volume, expressed in (L), for thethree most important cellular locations are:
� Vo = 1.0 · 10−10 for extracellular volume,
� Vm = 3.0 · 10−13 for plasmatic membrane volume, and
� V = 3.0 · 10−12 for cytoplasmic volume.
Albeck's model expresses its concentration both in #copies per cells and in M (Moles),so it's easy to pass from a unit to another. He had just trasformed all the units bymultipling kinetics and concentrations by a corrective factor F that we can obtain formdata. For example, k1 is expressed in the two di�erent units:
k1 = 4 · 10−7 in [(#
CC)−1 · sec−1] and k1 = 2.4 · 104 in [(nM)−1sec−1]
56

4 Mathematical model of apoptosis
Therefore, passing from nM to ( #CC ) can be made by multipling the concentration
expressed in ( #CC ) with the factor:
F =4 · 10−7
2, 4 · 104= 1, 667 · 10−3
For the same reason we can pass from nM−1 to ( #CC )−1by multiply the concentration
expressed in ( #CC )−1by 1
F = 5, 9999 · 103. Once F is obtained we can transform all Neu-
mann's kinetics and initial concentrations form nM to ( #CC ) in order to make congruent
with Albeck's.
4.4.2.2 Conclusion
We �nally obtained the new model. The complete scheme with all the graphic connec-tion is represented in the next chapter, �g. 5.2 and the BioNetGen code of the modelimplementation is in the Appendix. The model has 101 parameters of which 23 are ini-tial concentrations and 78 are reaction kinetics. It count 75 di�erent molecule speciescontrolled and generated with 61 reactions.
57

5 Model Analysis and validation
In this chapter, apoptosis model has been used to simulate the temporal series of themost signi�cant chemical species in order to analyse the dynamic behavior of the system.We try to probe if apoptosis robustly occurs in all-or none manner and what is the �point-of-no-return� representing irreversibility in apoptosis. Concentrations time series permitto carry out a detailed analysis of dynamic behavior of the system. This could be usedto develop a deeper understanding of network regulation processes and to characterizethe main role played by each chemical species. Moreover, we can consider the dynamicbehavior of each chemical species as a kind of �ngerprint of the system working underphysiological conditions. Network structure and type of interactions between di�erentspecies determine characteristic response of the system upon stimulation. If some of thesecharacteristic features are lost for di�erent reasons, typical dynamics may change andthen result in inappropriate actions of the system. System disregulations cause defectsin signal transduction that can bring to apoptosis. Hence, characterize physiologicalworking conditions of a signaling pathway may be a useful method to distinguish it fromthose in pathologic conditions, to investigate the origin of disregulations and, in futureperspective, to �nd a drug or combination of drugs able to prevent or to induce apoptosis.In order to do this, a detailed and rational analysis of collected data from apoptosis modelsimulations have to be done. Since the main purpose is to characterize system response,we decide to classify the obtained time series according to their dynamic behavior. Inother words, we distinguish them depending on their qualitative behavior, or patternand for each of them we calculate Hill coe�cent (par. 5.1.1.1). This help us to examinebistability1 due to positive feedbacks, and sigmoidal responses arising from competitiveinhibition. Such sigmoidal curves are frequently termed ultrasensitive (par. 3.3), assmall alterations in the stimulus can elicit large changes in the response. It is knownthat bistability can emerge from ultrasensitivity in conjunction with positive feedback,whereas adaptation, oscillations, and, surprisingly, highly linear response can arise withnegative feedback.At last we perform a local sensitivity analysis of the system in order to �nd key pa-
rameters and core mechanisms in the pathway. Comparing these �ndings to those ofthe previous models helps us to validate the new integrated model. In next sections, wepresent details about classi�cation of main patterns (section 5.1.1), results and analysisof apoptosis model simulations (section 5.1.2), and comparison with experimental dataof previous models (section 5.2).
1A bistable system is a system that exhibits two stable steady states, separated by an unstable state.(par. 3.3.2)
58

5 Model Analysis and validation
5.1 Apoptosis model simulations: results and analysis
Simulations of apoptosis were realized using a step function of 5.1 nM = 50ng/ml ofTrail as input. Trail stimulation started at 0 time and was held for 360 minutes. UsingBioNetGen language:
#actions
generate_network({overwrite=>1});# Kinetics
simulate_ode({t_end=>360,n_steps=>720});
where, as presented in Chapter 3, �generate_network� command permits to generatethe complete reactions network according to an iterative method which terminates whenno more new reactions are found. �simulate_ode command� indicates that simulationof dynamics is carried out implementing and numerically solving a set of ODEs. Sim-ulation lasts for 360 minutes (t_end=>360) and shows in output 720 time samples foreach observable species (n_steps=>720). Time series of all the observables species arereported in Appendix.
5.1.1 Pattern classi�cation
Considering the remarkable importance of negative and positive feedback loops in trans-duction networks it could be helpful to distinguish the simulated concentrations accordingto those particular features. Hence, we can divide them in two sets, one for those con-centrations characterized by overshoot, and one for those without overshoot. To classifydynamic behaviours according to their speed may also give useful information abouthow signaling system works and help in its characterization. Thus, we decide to clas-sify predicted time series obtained from apoptosis model according to these two criteria,obtaining four main pattern sets, shown in Fig.5.1:
� slow (not-overshooting) response,
� rapid (not-overshooting) response,
� slow overshooting response, and
� rapid overshooting response.
59

5 Model Analysis and validation
Figure 5.1: Representative dynamic behaviour for each pattern: slow (notovershooting)response (a), rapid (not-overshooting) response (b), slow overshooting re-sponse (c) and rapid overshooting repsonse (d).
Each pattern may be characterized by means of speci�c parameters.
5.1.1.1 Classi�cation parameters
For pattern classi�cation we de�ne mainly four parameters that may help to furtherdescribe concentration dynamics:1) C0.9 [min] which indicates the time to reach the 90% of maximum level;2) C0.1 [min].These two parameters may be particularly useful for characterization of increasing
(notovershooting) responses. For concentrations characterized by overshooting response,we can easily obtain information about:3)τ peak [min], which indicates the period of time the concentration takes to reach its
peak value.This parameter permits to distinguish concentration dynamics according to their speed.
To better characterize not-overshooting response, in particular those showing sigmoidalcurves, Hill coe�cent was calculated:4) Hill coe�cent.
Hill coe�centHill coe�cent could help to classify pattern de�nition. It quanti�es the ultrasensitivityof a stimulus-response curve globally (see chapter 3.3). At the beginning it was the �rst
60

5 Model Analysis and validation
characterization of ultrasensitivity, introduced by Hill, as an empirical description of thecooperative binding2 of oxygen to hemoglobin. Hill found that binding was well describedby the following relationship, which is now known as the Hill equation:
y =xh
Kh0.5 + xh
where y is the bound fraction of oxygen, x is the oxygen pressure,K0.5 is the oxygenpressure where half of the binding sites are occupied, and h is the Hill coe�cient. Enzy-mes exhibiting positive cooperativity, such as hemoglobin, display ultrasensitivity; thatis, their Hill coe�cients exceed unity. For example, the Hill coe�cient of hemoglobinequals 2.8, and in general, a Hill coe�cient of 4 is often thought to be an upper limitfor cooperative enzymes. The Hill coe�cient is not commonly estimated by �tting theformula to the data, but it is often calculated from the cooperativity index, which isde�ned as Ra = C0.9
C0.1where C0.9 and C0.1 are those de�ned in the previous section. To
get the relationship between Ra and the Hill coe�cient, h, the following equation needto be solved:
Ra = 811h → h =
log81
log(C0.9C0.1
)(5.1)
If the Hill coe�cient is 1, an 81-fold increase of the stimulus is needed to increaseactivation from 10% to 90%. For Hill coe�cients higher than 1, the increase of thestimulus needed is smaller and the Hill curve gets sigmoidal. In some literature models ofApoptosome formation, Bax oligomerization and other species formation were describedwith cooperative interactions between molecules. As previous said, this can generatesigmoidal curves as molecules with ultrasensitivity behavior. Therefore, calculatin Hillcoe�cent can help to understand if a speci�c molecule has ultrasensitivity behavior andif a particular system is activated in a all-or none manner.
5.1.1.2 Classi�cation rules
We decide to distinguish concentration dynamics according to their speed using theparameters introduced in section 5.1.1. τ peak was used to distinguish between over-shooting and non-overshooting response. Among the species characterized by increasing(not-overshooting) response and (overshooting) response, we classify:� as rapid those having |C0.9 − C0.1| < 1600 sec=30 min, and� as slow, all the others.At last, we further classify the dynamics by calculating Hill coe�cent (5.1) of each
pattern. This can help to distinguish those concentration that may exhibit cooperativity,or ultrasensitivity. Since some reactions belong to a cascade of reactions and are enhanced
2Cooperative binding occurs if the number of binding sites of a macromolecule, that are occupied bya speci�c type of ligand, is a non-linear function of this ligand's concentration. This can be due,for instance, to an a�nity for the ligand that depends on the amount of ligand bound. Usually asigmidal curve occurs. (par. 3.3)
61

5 Model Analysis and validation
by feedback loops, the Hill coe�cent may arise. Therefore, we decided to label theconcentrations with an Hill coe�cent more than 10 with an asterisk (*). All the detectedconcentrations classi�ed according to their pattern are reported in Tab. 5.1.
5.1.2 Classi�cation analysis and discussion
Figure 5.2: Complete apoptosis model. We integrated (red arrows and circles) Neumann'sDISC dynamics in Albeck's model in order to introduce Nf-kB pathway. Apattern classi�cation study was made to �nd network motif and to studymolecule dynamics. The di�erent dynamics response are represented by ayellow square sorrounded by a colored frame: blue for rapid non-overshooting,red for low non-overshooting , green for rapid overshooting and azure for lowovershooting. We calculated the dynamics only of the species written in redbold color. We can recognise three major pathways involved in this model: I)p43-Flip and p43p41 activation by DISC formation II) C8-C3-C6-C8 positivefeedback loop III) mitochondrial activation and C3 positive feedback loop(here is considered also the double-negative feedback loop of XIAP sequestredby SMAC) and IV) Nf-kB activation.
62

5 Model Analysis and validation
According to discussion in section 5.1.1, we decide to �rst distinguish the dynamicbehavior of observable species according to the presence or not of overshooting response.Thus, chemical species characterized by overshoot response are: DISC complex, p43Flipand p43p41 molecules, Bar linked with C8, Bcl2 linked with Bid, active form of Bax,oligomerization of Bax in the mitochondrion, Bax linked with Bcl2 in the mitochon-drion, active SMAC, active cytocrome-c, active Apaf, Apoptosome complex binded withXIAP molecules and active C3. In NfkB pathway we found: p43Flip bounded with IKKcomlpex, NfkB phosphorilated with IkB and active Nf-kB. The remaining time series de-pict increasing concentrations, which reach the steady state level without any overshoot,and are: active C8 by processing of p43p41 and C3 loop, active C6, ubiquinated C3 byXIAP, truncation of Bid by active C8, active mitochondrion pores, SMAC sequestred byXIAP, apoptosome formation and �nally PARP degradation.We expect that all the species involved in apoptosome formation and C3 activation
have an Hill coe�cent greater than 1.Resulting pattern classi�cation is also presented in Fig. 5.2. It shows the most im-
portant chemical species involved in apoptosis model which are represented as distinctcompartments. Compartments show also red asterisk indicating that the molecule is inan active form. Solid lines connecting di�erent compartments indicate the transformationbetween a chemical species to another. Dotted lines joining two di�erent species indicateinteractions with complex formation. Dotted lines are also used to indicate chemicalspecies controlling di�erent reactions.
Rapid non-overshooting Slow non-overshooting
Active cytocrome c (*) active C8 (*)
Apoptosome formation (*) tBid
Active C6 (*) #MitochondrialPores (*)
PARP (*) SMAC.XIAP (*)
C3 ubiquinated (*)
Rapid overshooting Slow overshooting
DISC.cFlipS (*) activated p43Flip.IKK
DISC.cFlipL (*) Nf-kB.IkB phosphorilated
DISC.C8 (*) active C8.BAR (*)
p43Flip active Bax
p43p41 (*) Bax4 (*)
Bid.Bcl2 (*) Bax.Bcl2 (*)
active C3 (*)
Apaf (*)
Apoptosome.XIAP (*)
Table 5.1: Concentration classi�ed according to their dynamics. Those with (*) indicatethat Hill coe�cent is higher than 10.
63

5 Model Analysis and validation
Detected quantities (observables) are indicated in red and, in their proximity, arepresent plots depicting their qualitative dynamic behaviours. Plots present colored frameswhich indicate under which pattern the detected concentration is classi�ed, and are bluefor rapid (notovershooting) response, red for slow (not-overshooting) response, green forrapid overshooting response, and cyan blue for slow overshooting response. The greenspecies represented in the circles are inhibitors of apoptosis. cFlipL and cFlipS act inDISC formation preventing formation of p41p43 and p43Flip molecules. Free cytosolicBcl-2 can inhibit Bid molecule before being truncated by active C8; instead, mitochodrialBcl-2, inhibit Bax oligomerization. Bar sequestrates active C8 and XIAP inhibits bothmitochondrial and direct active C3 pathways.Reactions involved in DISC formation are characterizided by rapid overshooting dy-
namics and high Hill coe�cents. Model calibration (par. 4.4.2.1) accelerate Neumann'sDISC dynamics that were less rapid. As a conseguence, both activation of p43p41 andp43Flip occur in rapid manner. Once p43Flip was activated, all the molecules in NfkBpathway , but the phosphorilated complex NfkB, show a slow overshooting responce andlower Hill coe�cent. Active C8 shows a slow non-overshootin responce like caspase 6in the feedback loop. By analizing graph connection of species (�g. 5.2) involved innon-overshooting, overshooting and sigmoidal responce we concluded that:
� usually complexes, generated by molecule interactions (represented in �g. 5.2 withdotted lines joining two di�erent species), show a non-overshooting responce be-cause they do not be degradeted by anyone. A molecule that exhibit this behavioris active C8 that promotes Bid truncation and C3 activation and it is only se-questred by BAR molecule in the cytosol. This kind of seqestration/degradationis not su�cient to convert concentration responce from non-overshooting to over-shooting. Another molecule is active C6, that is activated by C3, and promotesC8 activation without degrading itself. Apoptosome iteracts with C3 and makesit active, but does not link to any molecule so, its concentration reach a stablestate. We can �nd the same dynamics in mitochondrion active pores concentra-tion, active cytocrome-c formation, SMAC sequestrated by XIAP, ubiquinated C3and degradated PARP.
� There are some molecules that, once formed, bind with other molecules formingnew molecular complexes. Usually they exhibit overshooting responce. While theirconcentrations increase, the complexes formation increase at the same time butwith di�erent dynamics. This may cause an overshooting response that may reacha stable state if the startintig molecules concentrations are �nite. For example (�g.5.2 and table 5.1) , a molecule that show this behavior is the complex formed byBax and Bcl2. Once Bax is beeing active, it is sequestred at the same time by Bcl2generating an overshooting responce.
By means of pattern classi�cation we were able to characterize dynamic behaviour ofsome of the most important elements constituting apoptosis signaling system. As al-ready said, pattern classi�cation may help us to better understand the behavior of the
64

5 Model Analysis and validation
system and to characterize those concentration that exibhit sigmoidal and an all-no oneirreversibility dynamic. Activation of caspase 3 occur in a very rapid manner and itshigh Hill coe�cent (about 31) suggest that, once activated, it is di�cult to stop it. Fur-thermore, it initiate PARP degradation, that has a similar Hill coe�cent and sigmoidaldynamic. This suggest that apoptosis, when started, occurs in a all-no one manner. Ifthis does not happen the cell may reach an intermediate state (partial death) between lifeand death. During classi�cation analysis we noticed that almost all the reactions involvedin mitochondrial pathway have a high Hill coe�cent and a rapid, non-overshooting, sig-moidal responce instead several molecules show overshooting responce. This fast andrapid dynamic behavior is due to mitochordrion that, once stymulated with molecularextrernal signals (like tBid) or internal (stress, X-ray,..), starts a cascade of reactionsthat brings to apoptosis.It is important that cells, when adeguately stimulated by death receptors, undergo
rapidly to apoptosis and the system exhibit ultrasensitivity. The latter can help to �lterout noise or delay responses. Mechanisms that lead to ultrasensitive stimulus-responsecurves include cooperativity, multisite phosphorylation, feed-forward loops, and enzymesoperating under saturation. Bistability (par. 3.3.2) can occur if such an ultrasensitivecascade is equipped with a positive feedback, like apoptosis pathway is. For this reasionwe have studied below the in�uence of feedback loops in apoptosis death cascade.
Feedback loops analysisAlbeck et. al., as just described in chapter 4.2.1, found in his model three principalpositive feedbacks that we also have in our new model:
1. a positive feedback loop in which pro-caspase-6 (pro-C6) is cleaved by C3* to formC6* , which then activates additional active C8;
2. a double negative feedback loop, that act as a positivie one, with XIAP, that inhibitactive C3, that is inhibited by SMAC;
3. a positive active C3 feedback loop due to mitochondrial formation of Apoptosome(this includes also SMAC loop as part of mitochondrial reactions);
We simulated the model without considering the contribute of the loops and then weevaluated dynamic behavior of the system. Removing C6 feedback loop (by setting tozero the initial concentration of C6) do not cause sensible dynamic variation on theapoptotic dynamics. This means that cell undergo apoptosis whether with the loop ornot. We noticed only a little delay on signal propagation. On the other hand, theremoval of SMAC double-negative loop permits at XIAP molecule to inhibit more activeC3. The cell undergo the same to apoptosis, but cause an important reduction of activeC3 molecules that delay PARP degradation. By removing all the mitochondrial loop(both Apoptosome and SMAC contribute) we noticed a marcable delay on apoptosissignal propagation. After this long delay C3 starts to become active and the cell dies.This means that not even the removal of this ampli�cation loop permits at the cell tosurvive. Between the feedback loops, the last is the most important in terms of how ita�ects apoptosis dynamic.
65

5 Model Analysis and validation
5.2 Model validation
Complete apoptosis model (�g. 5.2) of type II cells is the integration of two di�erentmodels. Although the di�culties to deal with the overlapping parts of these networks,we were able to obtain a �nal model which is a counterfeit between state of art chemistryknowledge and simplicity in implementation procedure. Then, we run simulations andwe compared them with those obtained from original models [3, 2] verifying a good agree-ment. Figures show the comparison between models are presented in Appendix. Whenwe performed parameter calibrations some dynamics changed in order to �t Albeck'sconcentrations (chapter 4.4.2.1). For these reasons, the model simulate better TRAILsimulation rather than FAS.
5.2.1 DISC formation, p43Flip and p43p41 activation
We noticed very di�erent dynamics in DISC formation. Nuemann at. al. and Albecket. al. modeled it with a slow kinetic, while our new model considered it faster. Bychanging DISC parameters (see �g. 4.7) we have sped up reactions involved in ligand-receptor, DISC formation and DISC linked with cFlips or procaspase 8. The di�erentkinetics introduced in DISC formation a�ect both p43Flip and p41p43. p43Flip wasproduced faster and so reached its peak value before those on Neumann's. Since theinitial concentrations of cFlipL and cFlipS also changed, the peak values of p43Flip wasa�ected. It was 400 molecules per cell in Neumann's model and about 140 molecules percell in our new model. Therefore, we can assert that Nf-kB pathwat was less stimulatedin TRAIL receptor.
Figure 5.3: p43Flip molecule
Formation of p41p43 was modeled in a di�erent way. Neumann et. al. modelled itwith a low overshooting responce and with a peak value reached in 70 minutes while,
66

5 Model Analysis and validation
in our new model, it had an overshooting responce characterized by two peak values:one at the beginning (due to DISC activation) and the other at 160 minutes (due to C3feedback loop).
Figure 5.4: p43p41 in a logarithmic scale
Despite these di�erences in DISC formation and p41p43 activation, caspase 8 concen-tration became active in similar way as Albeck's model (Fig. 5.5). The inital concentra-tion of procaspase 8 in our model was diminished and also the initial starting dynamic.It reaches a steady state value showing a low non-overshooting responce and mantainedit until apoptosis was done.
Figure 5.5: active caspase 8 in a logarithmic scale
67

5 Model Analysis and validation
5.2.2 mitochondrial ampli�cation loop
When we performed model calibration, the initial concentrations and kinetics of themitochondrial loop remained almost constant. Little modi�cation on caspase 8 activationa�ects Bid truncation and Bax activation.
Figure 5.6: cytosolic SMAC
The last, reaches its peak value at the same time as the original (Fig. 5.9). It has apeak value of ∼9000 molecules per cell instead of ∼7000 molecules per cell.
Figure 5.7: apoptosome formation
68

5 Model Analysis and validation
Despite of this �ndings, the dynamics of cytocrome-c release (Fig. 5.8), SMAC release(Fig. 5.6) and Apoptosome formation (Fig. 5.7) show a good �t.
Figure 5.8: Cytosolic cytocrome-c
Figure 5.9: active Bax
5.2.3 C3 - C6 feedback loop
Active C3 dynamic was very similar to the original (Fig. 5.10). Since the initial con-centration of procaspase 3 changed, its peak value changed too. We noticed a di�erent
69

5 Model Analysis and validation
of ∼5000 molecules between Albeck's original value and those obtained with our model.Activation of C6 feedback loop occurs at the same time and with the same number ofmolecule as the original model (Fig. 5.11).
Figure 5.10: active caspases 3 in a logarithmic scale
Figure 5.11: active caspase 6
5.2.4 NfkB activation
To validate NfkB pathway we compared concentrations obtained with our model withthose of Neumann's.
70

5 Model Analysis and validation
Figure 5.12: p43FLIP molecule bound with IKK
The peak of IKK activated by p43Flip (Fig. 5.12) was reached faster than the original.Its peak has a value of ∼15 molecules per cell instead of ∼62 molecules per cell. Thislow concentration of molecules stimulates only a little part of Nf-kB. This one, reachesits peak value ∼40 minutes later and with less than ∼400 molecules per cell than theoriginal (Fig. 5.13).
Figure 5.13: active NfkB
71

5 Model Analysis and validation
5.2.5 FAS pathway
The new model, stymolated by Fas receptors, was compared to Albeck's model concen-trations stymolated by Trail because the original Neumann's model was of type I cells.In system biology we know that type I cells are characterized by greater DISC forma-tion in order to generate an adeguate C8 stimolation without involving mitochondrialampli�cation. This implicates that DISC formation from Fas was less strong than theoriginal (see chapter 4.4.2.1). The wew model concentrations have similar dynamics asthose stymulated by Trail, and discussed in previous chapters, but in a di�erent timescale. In fact, mitochondrial and active C8-C3 reactions seem to occur 50 minutes beforethose of Albeck's stymulated with Trail. Since Albeck et. al. conceived their model likea biological time switch, these results are a consequence.In particulare, we simulated Nf-kB pathway generated by Fas and we compared it with
those of Neumann's �nding good agreement. Phosphorilated NfkB, linked with IKK,reaches its peak value just 10 minutes before Neumann's (Fig. 5.14). NfkB was activatedin a similar time scale and reached its peak value of ∼1700 molecules per cell in ∼100minutes. By comparing the di�erent pathways stimulated with di�erent receptors, wefound that NfkB pathway seems more sensitive to Fas receptors rather than Trail.
Figure 5.14: NfkB bonded with Ikb phosphorilated
To further validate the model we perform a sensitivity analisis using the robust PSAexplained in chapter 4.4.1. In this way, we are able to compare our parameters withthose in literature.
5.2.6 Sensitivity analysis
We decided to perform PSA of the main observables involved in apoptotic pathway like:active caspase 8, active caspase 3 and Apoptosome formation. The result is showed in
72
5 Model Analysis and validation
�g. 5.15. Parameters are labeled in red while observables in blue. Starting from the left(dark blue bars), it is represented the in�uence of initial concentrations of the speciesamong all the 25 observables of the model. Since they show high values, they are themost sensitive parameters. A little variation of their values cause a big perturbation onthe entire dynamics of the system. In particular, the most sensitive parameter is theinitial concentration of Bid molecule. This is consistent with what found by Albeck et.al., that MOMP generation and stimulation plays an essential role in apoptosis. Thisfurther con�rm the importance of the mitochondrial ampli�cation pathway and provethat cell is of type I.
For these reasons, we found also that intial concentration of Bax, and the initialconcentration of Bcl2 molecules present inside and outside the mitochondrion were keyfactors. The latter, controls Bax oligomerization in the mitochondrion and, as a conse-quence, inhibit pore opening and release of apoptotic factors. De facto, it inhibit theentire positive feedback mitochondrial loop. After that, we found that initial concentra-tion of procaspase 8 (proC8) and TRAIL receptors were sensitive parameters. This isobvious, for the reason that active C8 controls both mitochondrial loop and caspase 3direct activation pathway and TRAIL receptors control all the reactions of the model.Another important molecule was cF lipL. Neumann et. al. found the same result in hismodel (see 4.4.1.1). DISC molecules and kinetics (in particular cFlipL) are decisive inthe determination of the downstream reactions. By adding Neumann's DISC complexityat Albeck's model we made the new model more sensitive to Flip molecules in particu-lar, to c-FlipL (see chapter 4.4.1.2). Since XIAP initial concentration was a powerfulinhibitor of active caspase 3 activation and positive mitochondrial feedback loop, it is akey sensitivity parameter. After the initial concentrations, we found some kinetics thathad an important role in the dynamic of the model: kn2 involved in the formation ofDISC complex with proC8, kn3 that controls DISC and FlipL a�nity, k10 that promotestruncation of Bid and activates mitochondrial reactions and k12 that encurage inibithionof Bid molecule by Bcl2.If we select an horizontal row (among all the colors) we will obtain how parameters
a�ect a single observable. Selecting a vertical column (a single color) we will get howa single parameter variation in�uences the di�erent observables/species. Since we intro-duced di�erent dynamics at DISC, it may be useful to understand what parameters a�ectmore the di�erent species. Therefore, we focused on p43Flip formation (that upregulatesNfkB formation) and active C8 (that upregulates apoptosis).
Active caspases 8 formationBy watching the horiziontal row representing active C8 (�g. 5.15) we can see that, afterprocaspase 8 and Trail receptor, the most sensitivity parameter are cF lipL and XIAPconcentrations. The �rst is due to the major a�nity that cFlipL has in DISC formation(regulated by kn3 and kn7, also sensitive parameters) while the second is due to theC3-C6-C8 ampli�cation loop that is strongly inhibited by XIAP molecule. In particular,XIAP binds active C3 and degrades it through ubiquination.
73

5 Model Analysis and validation
Figure
5.15:Robust
PSA
ofthenew
modelstimolated
withTRAIL.Thesensitivityanalysiswas
calculatedon
25di�erent
observables(bluelables).In
this3D
diagram
theparam
eters(red
labels)
wereorganized
startingfrom
initial
param
etersconcentration(thebluebarson
theleft)through
DISCform
ation(azurebars),mitochondrialpathway
(thegreen-yellowpartin
themiddle)to
C3activation
andPARPdegradation(theredbarson
theright).The
initialparam
etersinvolved
inDISCform
ationandC8activation
arethemostsensitive:procaspase8,cFlipSand
cFlipLinitialconcentration.
74

5 Model Analysis and validation
.
cFlipS and cFlipL role on pathway activationOverexpression of cFlipL and cFlipS molecules cause activation delay of both caspase8 and Nf-kB activation. cFlipL has a stronger inhibition power than cFlipS. Whenwe simulated the model, we found that these molecules only delay cell death and notprevent it. These �ndings argue with Albeck's study that apoptosis is like a biologicalswitch delayed by Flips molecules. We found that DISC plays a central role in decidingdivergence between Nf-kB and apoptosis pathway. By overexpressing cFlip molecules wefound that Nf-kB became active before apoptosis pathway. This could permit to generatetranscriptional factors, that interact with mitochondrial pathway and inhibit it. cFlipSand cFlipL inhibit apoptosis more than NfkB pathway. By varying cFlipS concentrationswe noticed that Nf-kB peak was always reached in a short time and between a little rangeof values. Thus, apoptosis inhibition may be guaranteed by iteraction between delay oncaspase activation and NfkB survival transcriptional factors. E.g: in system biology it isknown that, when active, Nf-kB produces as transcriptional factors molecules like Bcl2and XIAP. These may interact with Bax oligomerization, Apoptosome formation andactive caspase 3 cascade. If apoptotic pathway was delayed by cFlips, it would give timeto XIAP and Bcl2 to act as a negative feedback and to prevent apoptosis in a de�nitivemanner.
p43Flip formationIn order to study parameters in�uencing p43Flip molecules we selected the horizontalrow labelled as �p43Flip� in �g. 5.15. In particular, we found that parameters thatin�uence more p43Flip dynamics are: Trail concentration, Ikk initial concentration andkn13 (representig p43Flip interaction with IKK complex). Other parameters are: cF lipSconcentration at DISC, kn5 and kn7. The last two are involved rispectively in DISC.C8formation and DISC.cFlipS formation. Since p43Flip molecule generation is due to DISCcomplex linked with a combination of cFlipL and procaspase 8, sequestration of DISCby C8 and cFlipS in�uence its formation.
Role of XIAP in cascade propagationXIAP molecule is a pontent inhibitor of apoptosis. It acts on both mitochondrial pathway(by blocking Apoptosome formation) and C3 formation (by degrading it). In order to un-destand its dynamic better, we overexpessed the inital concentration of XIAP molecules.By only doubling its concetration, the peak of Apoptosome number of molecules was re-duced from 37000 to 3400 and consequently C3 active's peak was drammatically reducedfrom 6500 to 150 active molecules.
75
6 Conclusions
In this thesis we implemented a computational model of apoptosis signaling pathway.We made use of two models already published in the literature that were integrated torealize the �nal and more complete apoptosis model. The �rst model considers apoptosislike a biological switch and involves TRAIL receptor, DISC formation and mitochondrialactivation; while, the second considers both Nf-kB and caspase activation from DISC.The new model assumes that Nf-kB pathway was generated from DISC complex formedby both receptors. It was implemented using rule-based modelling approach which per-mitted a simple system description by a set of reaction rules. In particular, we usedBioNetGen software and, by means of its tools, we generated predictions of chemicalspecies populating apoptosis system. The �nal model has 101 parameters of which 23are initial concentrations and 78 are reaction kinetics. It counts 75 di�erent moleculesspecies controlled and generated by 61 reactions. Simulated time series ( describingthe concentrations of molecules) were used to characterize dynamic behavior of the sys-tem. Sensitivity analisys was used to de�ne core mechanisms of the system. We usedthese results to clear some fundamental regulation processes. First, we distinguishedconcentrations depending on overshoot presence. Then, we evaluate response time andwe distinguished between rapid, slow and sigmoidal dynamics. To further characterizenon-overshooting response, Hill coe�cent was calculated. Hence, we classi�ed dynamicsaccording to four main pattern sets: rapid (non-overshooting), slow (not-overshooting),rapid overshooting, and slow overshooting responses. Through this analysis we realizedthat rapid (not-overshooting) response characterizes those process related to mitochon-drial pathway and caspases 6 activation. They demonstrated sigmoidal curves and Hill'shigh coe�cents that indicate cooperative and ultrasensitive behavior. This means that, alittle variation of the input, produces rapid and fast growing of the output until it reachesa steady state. Three positve feedbacks were present in the model. They mainly ensurean all-or-none response but any of them is straight necessary to lead to apoptosis. Thesame sigmoidal curves was found in PARP degradation, that above all, indicates that arapid all-or none responce occurs when the cell undergoes apoptosis. Slow overshootingresponse characterizes NfkB pathway: from IKK activation to NfkB translocation. Rapidovershooting response characterizes those molecules involved in DISC, p41Flip and ac-tive caspase 3 formation. At last, slow (not-overshooting) response characterizes thosespecies that are not degraded or linked with anyone. This is the case of molecules asactive caspase 8 and Apoptosome.We found good agreement with most of our sensitive parameters and those of the previ-
ous models. We found that Bax activation, Bcl2 and procaspase 8 initial concentrationswere essential for mitochondrial signal propagation and the feedback loop. Both cFlipsand XIAP molecules play dominant roles in apoptosis inhibition. In particular, c-FlipL
76

6 Conclusions
and c-FlipS discriminate either apoptosis or survival pathway. We found that cFlipL hada stronger inhibition power than cFlipS. By varying cFlipS concentrations we noticedthat the peak of Nf-kB was always reached in a short time and between a little range ofvalues.Through overexpressing concentrations of apoptotic inhibitor we were able to introduce
signi�cative delays on apoptosis pathway. In system biology it is known that activeNf-kB translocates into the nucleus and produce transcriptional factors like Bcl2 andXIAP. These delays, in particular those of cFlips, could be used to enhance activation ofinhibitors that de�nitely interrupt apoptosis pathway.Finally, we discussed model validation comparing our predictions with those of Al-
beck's and Neumann's. Since we introduced di�erent mechanisms in DISC formation,we changed its dynamics. Anyway, we found a good agreement in caspase cascade, feed-back loops, mitochondrial propagation and PARP degradation. From the other side, wefound good agreement between Neumann's Nf-kB pathway and that generated by ourmodel with FAS. Trail generation of NfkB and apoptosis induction by FAS were nottrained against quantitative data but only evaluated with biological knowing of deadreceptor pathways.
6.1 Future plans
There are some cytokines, such as those of the tumor necrosis factor (TNF) superfamily,that induce apoptosis in many cell types. Others, such as cytokines from the epidermal,insulin-like, and nerve growth factor (EGF, IGF, and NGF) families, act as survivalcues that block or attenuate the action of TNF-family cytokines. Evaluating cross talksbetween them, can give new insigh in apoptosis mechanism. Numerous groups havereported that CD95 mediate activation of other pathways like ERK, and MAPK. Themodel could be integrated in studies that consider transcriptional factors of Nf-kB andcould help to de�nitely understand the role of these molecules.In ODE modeling it is assumed that the cell represents a well-stirred reactor, implying
that di�usion e�ects do not matter. In apoptosis networks, these assumptions are likelyto be ful�lled, as caspase and their regulators are typically expressed at the number ofseveral hundred thousand molecules per cell. Furthermore, the time scale of apoptosisinduction (hours) is slow relative to the time scale of protein di�usion within a cell(milliseconds to seconds); therefore, spatial gradients of apoptosis signaling moleculescan be considered decisive in apoptosis initiation.
77

7 Appendix
Source code of the model of apoptosis implemented in BioNetGen language.
begin parameters
# Initial amounts of cellular components (copies per cell)
FasL_01 1.1322e2*5.9999e2FasL_02 3.7740e1*5.9999e2FasL_03 1.887e1*5.9999e2Trail_sat 6e4R_Trail_WT 3e2 # TRAIL receptor (for experiments not involving siRNA)Trail_50 3e3 # baseline level of ligand for most experiments (corresponding to 50 ng/ml Su-
perKiller TRAIL)R_Trail_siRNA 1e5 # TRAIL receptor for experiments involving siRNA;Rf_init 730 # concentration of CD95-FADDFL_init 2.1064e3FS_init 1.4473e3pC8_init 3.04684e4Bar_init 1e3 # Bifunctional apoptosis regulatorpC3_init 2.01871e4 # procaspase-3 (pro-C3)pC6_init 1e4 # procaspase-6 (pro-C6)XIAP_init 1e5 # X-linked inhibitor of apoptosis proteinPARP_init 1e6 # C3* substrateBid_init 4e4 # BidBcl2c_init 2e4 # cytosolic Bcl-2Bax_init 1e5 # BaxBcl2_init 2e4 # mitochondrial Bcl-2M_init 5e5 # mitochondrial binding sites for activated BaxCytoCM_init 5e5 # mythocondrial cytochrome cSmacM_init 1e5 # mitochondrial SmacpC9_init 1e5 # procaspase-9 (pro-C9)Apaf_init 1e5 # Apaf-1delay .01 # translocate CC <�> MCNF_kB_IkB_init 4.7395*5.9999e2iIKK_init 5.7728*5.9999e2
# model kinetics
k1 0.188241k_1 39.7244kc1 4.72700kn1 1*1.6667e-3kn2 1.27772e-4*1.6667e-3 # proC8 to DISCkn3 0.0070538 # Flip long to DISCkn4 5.382766e-8 # Flip short to DISCkn5 8.987359e-4 # proC8 to DISCkn6 0.00320177 # Fl to DISCkn7 0.00748049 # Fs to DISCkn8 0.01164630 # p43/p41 to C8*
78

7 Appendix
k4 1e-6*60 k_4 1e-3*60 k5 1e-7*60k_5 1e-3*60kc5 1*60k6 1e-6*60k_6 1e-3*60kc6 1*60k7 3e-8*60k_7 1e-3*60kc7 1*60k8 2e-6*60k_8 1e-3*60kc8 .1*60k9 1e-6*60k_9 1e-2*60kc9 1*60k10 1e-7*60k_10 1e-3*60kc10 1*60k11 1e-6*60k_11 1e-3*60k12 1e-7*60k_12 1e-3*60kc12 1*60k13 delay*60k_13 delay*60k14 1e-6*60k_14 1e-3*60k15 1e-6 *60k_15 1e-3*60k16 1e-6*60k_16 1e-3*60k17 1e-6*60k_17 1e-3*60k18 1e-6*60k_18 1e-3*60k19 1e-6*60k_19 1e-3*60kc19 1*60k20 2e-6*60k_20 1e-3*60kc20 10*60k21 2e-6*60k_21 1e-3*60kc21 10*60k22 delay*60k_22 delay*60k23 5e-7*60k_23 1e-3*60kc23 1*60k24 5e-8*60k_24 1e-3*60k25 5e-9*60k_25 1e-3*60kc25 1*60
79

7 Appendix
k26 delay*60k_26 delay*60k27 2e-6*60k_27 1e-3*60k28 7e-6*60k_28 1e-3*60kn13 7.2043e-4*1.6667e-3kn14 3.5882e-1*1.6667e-3kn15 3.6842 # activationkn16 2.2299e-2 # degradationkn17 6.4182e-3 # degradation
end parameters
begin molecule typesTrail(Rb)Rp(B)C3(B,S~a~i~u)C6(B,S~a~i)C8(B,S~a~i)C9(B,S~a~i)XIAP(B)PARP(B,S~a~d)Bax(B1,B2,B3,B4,S~i~a~m)Bax2(B)Bax4(B)Bid(B,S~t~i)cytC(B,P~m~a~c)SMAC(B,P~m~c~a)Mit(B,S~i~a)Apop(B)Bcl2(B,S~m~c)Apaf(B,S~a~i)BAR(B)Trash()I()FasL(Rb)Rf(B1) # CD95 + FADD, B1,B2,B3= trimerization of FADDFL(Bs)FS(Bs)p43p41(B)P(B)p43FLIP(B)IKK(B,S~i~a)NfkB(B,S~i~a)IkB(B1,B2)DISC(B1,B2)DISC_F(B1,B2)DISC_T(B1,B2)
end molecule types
begin speciesTrail(Rb) Trail_50Rp(B) R_Trail_siRNAC8(B,S~i) pC8_initBAR(B) Bar_init
80

7 Appendix
C3(B,S~i) pC3_initC6(B,S~i) pC6_initXIAP(B) XIAP_initPARP(B,S~a) PARP_initBid(B,S~i) Bid_initBcl2(B,S~c) Bcl2c_initBax(B1,B2,B3,B4,S~i) Bax_initBcl2(B,S~m) Bcl2_initMit(B,S~i) M_initcytC(B,P~m) CytoCM_initSMAC(B,P~m) SmacM_initC9(B,S~i) pC9_initApaf(B,S~i) Apaf_initFasL(Rb) FasL_02Rf(B1) Rf_initFL(Bs) FL_initFS(Bs) FS_initNfkB(B!1,S~i).IkB(B1!1,B2) NF_kB_IkB_initIKK(B,S~i) iIKK_init
end species
begin observablesMolecules activeC8 C8(B,S~a)Molecules activeC3 C3(B,S~a)Molecules NfkB_active NfkB(B,S~a)Molecules proC8 C8(B,S~i)Molecules proC3 C3(B,S~i)Molecules Bar_C8 BAR(B!1).C8(B!1,S~a)Molecules Bid_Bcl2 Bid(B!1,S~i).Bcl2(B!1,S~c)Molecules ActiveBax Bax(B1,B2,B3,B4,S~a)Molecules MytBax_Bcl Bcl2(B!1,S~m).Bax(B1!1,B2,B3,B4,S~m)Molecules Bax2_Bcl2 Bax2(B!1).Bcl2(B!1,S~m)Molecules Bax4 Bax4(B) Molecules Apaf Apaf(B,S~a)Molecules Apopto_XIAP Apop(B!1).XIAP(B!1)Molecules Bax4_Bcl2 Bax4(B!1).Bcl2(B!1,S~m)Molecules C3_Ubiquinated C3(B,S~u)Molecules tBID Bid(B,S~t)Molecules PARP_degradation PARP(B,S~d)Molecules num_active_Holes Mit(B,S~a)Molecules activeC6 C6(B,S~a)Molecules Active_Myth_cyto cytC(B,P~a)Molecules cytocrome_Cyto cytC(B,P~c)Molecules Active_Myth_SMAC SMAC(B,P~a)Molecules SMAC_Cyto SMAC(B,P~c)Molecules smac_xiap SMAC(B!1,P~c).XIAP(B!1)Molecules Apoptosome Apop(B)Molecules DISC_TRail DISC_T(B1,B2)Molecules DISC_Fas DISC_F(B1,B2)Molecules DISC DISC(B1,B2)Molecules DISC_FS DISC(B1!1,B2).FS(Bs!1)Molecules DISC_C8 DISC(B1!1,B2).C8(B!1,S~i)Molecules DISC_FL DISC(B1!1,B2).FL(Bs!1)Molecules p43p41 p43p41(B)Molecules p43FLIP p43FLIP(B)
81

7 Appendix
Molecules p43FLIP_active_IKK p43FLIP(B!1).IKK(B!1,S~a)Molecules NfkB_IkBPhosfo NfkB(B!1�S~i).IkB(B1!1,B2!2).P(B!2)
end observables
begin reaction rules
# TRAIL receptor DISC formation
1 Trail(Rb) + Rp(B) <-> Trail(Rb!1).Rp(B!1) k1, k_12 Trail(Rb!1).Rp(B!1) -> DISC_T(B1,B2) kc13 DISC_T(B1,B2) + C8(B,S~i) -> DISC(B1!1,B2).C8(B!1,S~i) kn24 DISC_T(B1,B2) + FL(Bs) -> DISC(B1!1,B2).FL(Bs!1) kn35 DISC_T(B1,B2) + FS(Bs) -> DISC(B1!1,B2).FS(Bs!1) kn4
# FAS receptor DISC formation
6 FasL(Rb) + Rf(B1) -> DISC_F(B1,B2) kn17 DISC_F(B1,B2) + C8(B,S~i) -> DISC(B1!1,B2).C8(B!1,S~i) kn28 DISC_F(B1,B2) + FL(Bs) -> DISC(B1!1,B2).FL(Bs!1) kn39 DISC_F(B1,B2) + FS(Bs) -> DISC(B1!1,B2).FS(Bs!1) kn410 DISC(B1!1,B2).C8(B!1,S~i) + FS(Bs) -> DISC(B1!1,B2!2).C8(B!1,S~i).FS(Bs!2) kn711 DISC(B1!1,B2).FS(Bs!1) + FS(Bs) -> DISC(B1!1,B2!2).FS(Bs!1).FS(Bs!2) kn712 DISC(B1!1,B2).FS(Bs!1) + C8(B,S~i) -> DISC(B1!1,B2!2).C8(B!1,S~i).FS(Bs!2) kn513 DISC(B1!1,B2).FL(Bs!1) + FL(Bs) -> DISC(B1!1,B2!2).FL(Bs!1).FL(Bs!2) kn614 DISC(B1!1,B2).FS(Bs!1) + FL(Bs) -> DISC(B1!1,B2!2).FS(Bs!1).FL(Bs!2) kn615 DISC(B1!1,B2).FL(Bs!1) + FS(Bs) -> DISC(B1!1,B2!2).FS(Bs!1).FL(Bs!2) kn716 DISC(B1!1,B2).FL(Bs!1) + C8(B,S~i) -> p43FLIP(B) kn517 DISC(B1!1,B2).C8(B!1,S~i) + FL(Bs) -> p43FLIP(B) kn618 DISC(B1!1,B2).C8(B!1,S~i) + C8(B,S~i) -> p43p41(B) + p43p41(B) kn5
# C8 activation and apoptosis pathway
19 p43p41(B) + p43p41(B) -> C8(B,S~a) 2*kn820 C8(B,S~a) + BAR(B) <-> BAR(B!1).C8(B!1,S~a) k4, k_421 C3(B,S~i) + C8(B,S~a) <-> C3(B!1,S~i).C8(B!1,S~a) k5, k_522 C3(B!1,S~i).C8(B!1,S~a) -> C3(B,S~a) + C8(B,S~a) kc523 C6(B,S~i) + C3(B,S~a) <-> C6(B!1,S~i).C3(B!1,S~a) k6, k_624 C6(B!1,S~i).C3(B!1,S~a) -> C6(B,S~a) + C3(B,S~a) kc625 C8(B,S~i) + C6(B,S~a) <-> C8(B!1,S~i).C6(B!1,S~a) k7, k_726 C8(B!1,S~i).C6(B!1,S~a) -> p43p41(B) + p43p41(B) + C6(B,S~a) kc727 XIAP(B) + C3(B,S~a) <-> XIAP(B!1).C3(B!1,S~a) k8, k_828 XIAP(B!1).C3(B!1,S~a) -> XIAP(B) + C3(B,S~u) kc829 C3(B,S~a) + PARP(B,S~a) <-> C3(B!1,S~a).PARP(B!1,S~a) k9, k_930 C3(B!1,S~a).PARP(B!1,S~a) -> C3(B,S~a) + PARP(B,S~d) kc9
# mitochondrial pathway
31 Bid(B,S~i) + C8(B,S~a) <-> Bid(B!1,S~i).C8(B!1,S~a) k10, k_1032 Bid(B!1,S~i).C8(B!1,S~a) -> Bid(B,S~t) + C8(B,S~a) kc1033 Bid(B,S~i) + Bcl2(B,S~c) <-> Bid(B!1,S~i).Bcl2(B!1,S~c) k11, k_1134 Bax(B1,B2,B3,B4,S~i) + Bid(B,S~t) <-> Bax(B1!1,B2,B3,B4,S~i).Bid(B!1,S~t) k12, k_1235 Bax(B1!1,B2,B3,B4,S~i).Bid(B!1,S~t) -> Bax(B1,B2,B3,B4,S~a) + Bid(B,S~t) kc1236 Bax(B1,B2,B3,B4,S~a) <-> Bax(B1,B2,B3,B4,S~m) k13, k_1337 Bax(B1,B2,B3,B4,S~m) + Bcl2(B,S~m) <-> Bcl2(B!1,S~m).Bax(B1!1,B2,B3,B4,S~m) k14,
k_1438 Bax(B1,B2,B3,B4,S~m) + Bax(B1,B2,B3,B4,S~m) <-> Bax2(B) k15, k_1539 Bax2(B)+ Bcl2(B,S~m)<-> Bax2(B!1).Bcl2(B!1,S~m) k16, k_1640 Bax2(B) + Bax2(B) <-> Bax4(B) k17, k_1741 Bax4(B) + Bcl2(B,S~m) <-> Bax4(B!1).Bcl2(B!1,S~m) k18, k_1842 Bax4(B) + Mit(B,S~i) <-> Bax4(B!1).Mit(B!1,S~i) k19, k_19
82

7 Appendix
43 Bax4(B!1).Mit(B!1,S~i) -> Mit(B,S~a) kc1944 Mit(B,S~a) + cytC(B,P~m) <-> Mit(B!1,S~a).cytC(B!1,P~m) k20, k_2045 Mit(B!1,S~a).cytC(B!1,P~m) -> Mit(B,S~a) + cytC(B,P~a) kc2046 Mit(B,S~a) + SMAC(B,P~m) <-> Mit(B!1,S~a).SMAC(B!1,P~m) k21, k_2147 Mit(B!1,S~a).SMAC(B!1,P~m) -> Mit(B,S~a) + SMAC(B,P~a) kc2148 cytC(B,P~a) <-> cytC(B,P~c) k22, k_2249 cytC(B,P~c) + Apaf(B,S~i) <-> cytC(B!1,P~c).Apaf(B!1,S~i) k23, k_2350 cytC(B!1,P~c).Apaf(B!1,S~i) -> cytC(B,P~c) + Apaf(B,S~a) kc2351 Apaf(B,S~a) + C9(B,S~i) <-> Apop(B) k24, k_2452 Apop(B) + C3(B,S~i) <-> Apop(B!1).C3(B!1,S~i) k25, k_2553 Apop(B!1).C3(B!1,S~i) -> Apop(B) + C3(B,S~a) kc2554 SMAC(B,P~a) <-> SMAC(B,P~c) k26, k_2655 Apop(B) + XIAP(B) <-> Apop(B!1).XIAP(B!1) k27, k_2756 SMAC(B,P~c) + XIAP(B) <-> SMAC(B!1,P~c).XIAP(B!1) k28, k_28
# NfkB pathway
57 p43FLIP(B) + IKK(B,S~i) -> p43FLIP(B!1).IKK(B!1,S~a) kn1358 p43FLIP(B!1).IKK(B!1,S~a) ->Trash() kn1659 NfkB(B!1,S~i).IkB(B1!1,B2) + p43FLIP(B!1).IKK(B!1,S~a) -> NfkB(B!1,S~i).IkB(B1!1,B2!2).P(B!2)
+ p43FLIP(B!1).IKK(B!1,S~a) kn1460 NfkB(B!1,S~i).IkB(B1!1,B2!2).P(B!2) -> NfkB(B,S~a) kn1561 NfkB(B,S~a) -> Trash() kn17
end reaction rules
#ACTIONSgenerate_network({overwrite=>1});simulate_ode({t_end=>6*60,n_steps=>720});
Matlab source code of robust sensitivity analysis in par. 4.4.1.
function [S_int] = sensitivity(time, perc, step, pl , obs, fh, x, N)% obs=1 -> sensitivity analisis of observable output% pl=1 plot every step ov the sensitivity analisis% step = time step for the trapezoidal integral method approximation% perc = percentage of the parameter step
[err, timepoints, species_out_old, observables_out_old, param_old ] = fh( time, [], x, 1);par_new=param_old; if(obs) species_out_old=observables_out_old; end
% seleziono solo gli indici che sono diversi da 0[ r ] = �nd(species_out_old~=0);S_int2=zeros(size(param_old,2),size(species_out_old,2));for j=1:size(param_old,2)
% creo array N numeri casuali basati su probablita uniforme nell'% intervallo par*50 e par/50perc=15;casDiv= 1 - (random('unif',0,perc,1,round(N/2))./100);casPer=(random('unif',0,perc,1,round(N/2))./100) + 1;parCas=[param_old(j).*casDiv param_old(j).*casDiv];si2=zeros(1,size(S_int2,2));for i=1:length(parCas)
par_new(j)=parCas(i);[err, timepoints, species_out, observables_out ] = fh( time, [], par_new, 1);if(obs)
species_out=observables_out;end
83
7 Appendix
f=zeros(size(species_out_old,1),size(species_out_old,2));f(r)=abs( ( (species_out(r)-species_out_old(r)).*param_old(j) )./ ( species_out_old(r).*((param_old(j)
- parCas(i))) ) );si2 = si2 + ( step * ((sum(f,1)) - (f(1,:)/2) - (f(end,:)/2)));
endS_int2(j,:)=si2./N;if(pl)
pause(0.05);bar3(S_int');
endpar_new=param_old;
endS_int2=S_int2';
end
84

7 Appendix
Figure 7.1: TRAIL apoptosis
Figure 7.2: FAS apoptosis
85
Bibliography
[1] Inna N. Lavrik Editor, Springer (2013) Systems Biology of Apoptosis. DOI10.1007/978-1-4614-4009-3
[2] Albeck JG, Burke JM, Aldridge BB, Zhang M, Lau�enburger DA, Sorger PK (2008)Quantitative analysis of pathways controlling extrinsic apoptosis in single cells. MolCell 30:11�25
[3] Neumann L, Pforr C, Beaudouin J, Pappa A, Fricker N, Krammer PH, Lavrik IN,Eils R (2010) Dynamics within the CD95 death-inducing signaling complex decidelife and death of cells. Mol Syst Biol 6:352
[4] Ivan V. Maly. Methods in Molecular Biology, Systems Biology. Humana Press, vol.500 edition, 2009.
[5] Albeck JG et al (2008b) Modeling a snap-action, variable-delay switch controllingextrinsic cell death. PLoS Biol 6(12):2831�2852.
[6] Kober AMM, Legewie S, Pforr C, Fricker N, Eils R, Krammer PH, Lavrik IN (2011)Caspase- 8 activity has an essential role in CD95/Fas-mediated MAPK activation.Cell Death Dis 2:e212
[7] Fricker N, Beaudouin J, Richter P, Eils R, Krammer PH, Lavrik IN (2010) Model-based dissection of CD95 signaling dynamics reveals both a pro- and antiapoptoticrole of c-FLIPL. J Cell Biol 190:377�389
[8] Calzone L, Tournier L, Fourquet S, Thie�ry D, Zhivotovsky B, Barillot E, ZinovyevA (2010) Mathematical modeling of cell-fate decision in response to death receptorengagement. PLoS Comput Biol 6:e1000702
[9] D. T. Gillespie. Stochastic simulation of chemical kinetics. Annu. Rev. Phys. Chem.,58:35�55, October 2007.
[10] T. Emonet. E�cient modeling, simulation and coarse-graining of biological com-plexity with NFsim. Nature Methods, 8(2):177�183, February 2011.
[11] Sangdun Choi, Introduction to System Biology. Humana Press (2007), chapter 15:Nils Blüthgen, Stefan Legewie, Hanspeter Herzel, and Boris Kholodenko. Mecha-nisms Generating Ultrasensitivity, Bistability, and Oscillations in Signal Transduc-tion.
86

Bibliography
[12] Fussenegger M, Bailey JE, Varner J (2000) A m\athematical model of caspase func-tion in apoptosis. Nat Biotechnol 18:768�774. doi:10.1038/77589
[13] Eissing T, Conzelmann H, Gilles ED et al (2004) Bistability analyses of a cas-pase activation model for receptor-induced apoptosis. J Biol Chem 279:36892�36897.doi:10.1074/jbc.M404893200
[14] Pace V, Bellizzi D, Giordano F et al (2010) Experimental testing of a mathemat-ical model relevant to the extrinsic pathway of apoptosis. Cell Stress Chaperones15:13�23. doi:10.1007/s12192-009-0118-9
[15] Bagci EZ, Vodovotz Y, Billiar TR et al (2006) Bistability in apoptosis: roles of bax,bcl-2, and mitochondrial permeability transition pores. Biophys J 90:1546�1559.doi:10.1529/ biophysj.105.068122
[16] Legewie S, Bluthgen N, Herzel H (2006) Mathematical modeling identi�es inhibitorsof apoptosis as mediators of positive feedback and bistability. PLoS Comput Biol2:e120. doi:10.1371/ journal.pcbi.0020120
[17] Chen C, Cui J, Lu H et al (2007a) Modeling of the role of a Bax-activation switch in the mitochondrial apoptosis decision. Biophys J 92:4304�4315.doi:10.1529/biophysj.106.099606
[18] Cui J, Chen C, Lu H et al (2008) Two independent positive feedbacks and bistabilityin the Bcl-2 apoptotic switch. PLoS One 3:e1469. doi:10.1371/journal.pone.0001469
[19] Bentele M, Lavrik I, UlrichMet al (2004) Mathematical modeling revealsthreshold mechanism in CD95-induced apoptosis. J Cell Biol 166:839�851.doi:10.1083/jcb.200404158
[20] Stucki JW, Simon H-U (2005) Mathematical modeling of the regulation of caspase-3activation and degradation. J Theor Biol 234:123�131. doi:10.1016/j.jtbi.2004.11.011
[21] Rehm M, Huber HJ, Dussmann H, Prehn JHM (2006) Systems analysis of e�ectorcaspase activation and its control by X-linked inhibitor of apoptosis protein. EMBOJ 25:4338�4349. doi:10.1038/sj.emboj.7601295
[22] Wikipedia. Ultrasensitivity. http://en.wikipedia.org/wiki/Ultrasensitivity. 2014.
87