a mathematical model for predicting the carbon
TRANSCRIPT

Construction and Building Materials 147 (2017) 417–427
Contents lists available at ScienceDirect
Construction and Building Materials
journal homepage: www.elsevier .com/locate /conbui ldmat
A mathematical model for predicting the carbon sequestration potentialof ordinary portland cement (OPC) concrete
http://dx.doi.org/10.1016/j.conbuildmat.2017.04.1330950-0618/� 2017 Elsevier Ltd. All rights reserved.
⇑ Corresponding author.E-mail address: [email protected] (W.V. Srubar III).
Adriana Souto-Martinez, Elizabeth A. Delesky, Kyle E.O. Foster, Wil V. Srubar III ⇑Department of Civil, Environmental, and Architectural Engineering, Materials Science and Engineering Program, University of Colorado Boulder, ECOT 441 UCB 428, Boulder,CO 80309-0428, USA
h i g h l i g h t s
� Total CO2 sequestered by OPC concrete elements can be estimated (kg-CO2e).� Variables include type of amount of cement, SCMs, exposure, time, and geometry.� Low-C4AF cement, low SCM content, and high strengths increase sequesterable CO2.� High SA/V ratios, indoor environments, and time enhance in situ CO2 sequestration.
a r t i c l e i n f o
Article history:Received 9 December 2016Received in revised form 11 April 2017Accepted 15 April 2017Available online 2 May 2017
Keywords:Ordinary portland cementConcreteCarbonationCarbon dioxideModeling
a b s t r a c t
A simple mathematical model that calculates the theoretical carbon sequestration potential of exposedordinary portland cement (OPC) concrete is presented, validated, and implemented herein. OPC concretesequesters non-trivial amounts of carbon dioxide (CO2) via carbonation – a chemical reaction betweencement paste and atmospheric CO2. Formulated by the reaction chemistries of cement hydration and car-bonation, the model accounts for cement type and content, exposure, time, and type and quantity of sup-plementary cementitious materials (SCMs). Once validated with data from literature, the model isimplemented to investigate the effect of these factors and the influence of compressive strength andgeometry, namely surface-area-to-volume (SA/V) ratio, on total carbon sequestration (kg CO2) of exposedconcrete elements. Results demonstrate that (a) low tetracalcium aluminoferrite (C4AF) cements, (b)compressive strength, (c) high CO2 exposure, (d) no SCMs, (e) time, (f) high SA/V ratios, and (g) indoorenvironments enhance the in situ carbon sequestration of exposed OPC concrete.
� 2017 Elsevier Ltd. All rights reserved.
1. Introduction
Buildings are responsible for approximately 40% of total energyconsumption and 40% of carbon dioxide (CO2) emissions in theUnited States and Europe [1]. Achieving substantial reductions inthese and other environmental impacts, such as acidification,eutrophication, and ozone depletion, involves identifying andquantifying impacts during all phases of a building’s life cycle frommaterial allocation, manufacture, construction, use, and disposal.
Several environmental assessment tools and methodologies,such as whole-building lifecycle assessment (WBLCA), have beendeveloped for diverse purposes and users [2]. WBLCA has recentlyemerged as a methodological tool to help architects and structuralengineers quantify and reduce potential lifecycle environmentalimpacts during the design phases of a building. Numerous exam-
ples of WBLCA implementation case studies can be found in the lit-erature [3–8]. WBLCA can be applied, for instance, to identifyenvironmental impact reduction strategies of high-impact materi-als or manufacturing processes. Researchers have elucidated, forexample, that the manufacture of ordinary portland cement(OPC) currently accounts for 5–8% of anthropogenic global CO2
emissions [9]. Numerous studies have since identified commonbest practices and strategies for reducing the environmentalimpacts of OPC concrete, which include minimizing total cementcontent and partially replacing cement with silica-rich supplemen-tary cementitious materials (SCMs), such as fly ash, slag, silicafume, and metakaolin [10].
While the manufacture of OPC accounts for substantial CO2
emissions due to limestone calcination, OPC pastes, mortars, andconcretes also sequester small, but not trivial, amounts of CO2
throughout their service life (a positive environmental benefit)via a chemical reaction process known as carbonation. However,only the negative impacts of OPC concrete are typically included
418 A. Souto-Martinez et al. / Construction and Building Materials 147 (2017) 417–427
when implementing lifecycle assessment (LCA) methodologies.The carbon sequestration potential of reinforced concrete is, at pre-sent, largely neglected in the environmental accounting. This omis-sion is due, in part, to the complexity of predicting carbonsequestration potential and the lack of simple predictive modelsthat can be implemented by practitioners and incorporated intoLCA frameworks.
Previous research has largely addressed the mechanism of car-bonation [11–15], and several analytical models have been devel-oped to predict carbonation rates and depths in OPC concrete[16–22]. While these models emerged out of durability concernsof steel-reinforced concrete, a few recent studies have attemptedto account for the amount of CO2 sequestered during the servicelife of OPC concrete structures [23–30]. For example, Pade and Gui-maraes [23] estimated CO2 uptake due to carbonation over100 years and compared it to the amount of CO2 emitted duringOPC manufacture. Collins [24] included CO2 capture in a lifecycleassessment (LCA) of structural and crushed reinforced concrete.García-Segura et al. [26], studied the consequences of usingblended cements in terms of enhanced durability and reductionsin carbon sequestration. In addition, García-Segura et al. [31] andYepes et al. [32] integrated estimates of sequestered carbon withina structural optimization framework to simultaneously considercost and carbon emission in the design of prestressed concretehighway girders. Despite notable advances, however, these exist-ing models exhibit complexities or limitations, including a limitedcapability to accommodate any cement or SCM type, whichrestricts their generalizability and implementation in practice.
The objective of this work was to formulate and implement asimple, yet robust, theoretical model for predicting the carbonsequestration potential of OPC concrete. The model, which is basedon the hydration reaction and carbonation chemistries of OPC,accounts for variations in cement type, cement content, andcement replacement by SCMs. Only binary cements, namely OPCwith the possible addition of one type of SCM, were considered.In formulating the model, average mineral contents for six differ-ent types of OPC, standardized by ASTM C150 [33], were linkedto the carbon sequestration potential of the expected type andamount of hydration products. Anticipated reductions in carbona-tion potential due to the type and amount of SCMs were also incor-porated. The resulting model directly calculates total anticipatedcarbon sequestration potential (kg CO2) from eight input variables,namely (1) total concrete volume, (2) total exposed concrete sur-face area, (3) cement type, (4) cement content per unit mass ofconcrete, (5) SCM type, (6) percent-replacement of cement withSCMs, (7) CO2 exposure classification, and (8) time. The model isvalidated using data reported in the literature and implementedherein to demonstrate the effect of these variables, as well as theeffect of concrete compressive strength and surface-area-to-volume (SA/V) ratio, on the carbon sequestration potential ofexposed OPC concrete elements. The simplicity and generality ofthe model is preserved so that practicing architects and engineerscan implement it in practice to maximize potential CO2 sequestra-tion during early stages of design.
2. Theoretical formulation and model implementation
2.1. Theoretical formulation
To calculate total sequesterable CO2 for an exposed concreteelement, first, the type of cement in the concrete mixture is math-ematically linked to the theoretical type and amount of hydrationreaction products, including calcium hydroxide (CH), also knownas Portlandite, which is essential for the carbonation reaction.Next, the amount of CH is mathematically adjusted based on the
type and amount of SCMs present in the concrete mixture. Totalsequesterable CO2 per mass of carbonated cement paste is thencalculated based on the stoichiometry of the carbonation reaction.Given the geometry of a concrete element (namely surface areaand volume), length of time, and CO2 exposure, total volume of car-bonated concrete is calculated using a well-accepted predictivemodel for carbonation depth. Total volume of carbonated cementpaste in the carbonated concrete is estimated using the knowncement content per unit volume of concrete (kg/m3), which isobtainable from concrete mixture proportions. From these calcula-tions, total sequesterable CO2 (kg CO2) for a specific concrete ele-ment can be computed. Explicit mathematical details of themodel formulation are presented in the following sections.
2.1.1. Cement mineral contentTable 1 lists the average chemical composition and mineral con-
tent for the main classifications of OPC as specified by ASTM C150and White cement [33]. Primary oxides present in OPC, includingsilicon dioxide (S), aluminum oxide (A), ferric oxide (F), calciumoxide (C), magnesium oxide (M), sulfur trioxide (Š), and sodiumoxide (N), comprise four main cement minerals, including trical-cium silicate (C3S), dicalcium silicate (C2S), tricalcium aluminate(C3A) and tetracalcium aluminoferrite (C4AF). Tailored mineralcompositions enhance desired properties in the fresh- and hard-ened states, such as early strength, durability, or aesthetics in thecase of White cement.
2.1.2. Cement hydration reactionsThe primary hydration reactions of tricalcium silicate (C3S) and
dicalcium silicate (C2S) with water (H) produce both a calcium sil-icate hydrate (C3S2H8) phase and CH as follows:
2C3Sþ 11H ! C3S2H8 þ 3CH ð1Þ
2C2Sþ 9H ! C3S2H8 þ CH ð2ÞThe primary hydration reactions of other cement minerals,
namely tricalcium aluminate (C3A) and tetracalcium aluminofer-rite (C4AF) yields:
C3Aþ 3C�SH2 þ 26H ! C6A�S3H32 ð3Þ
C4AF þ 2CH þ 14H ! C6ðA; FÞH13 þ ðF;AÞH3 ð4Þwhere, in cement chemistry notation, CŠH2 is gypsum, C6AŠ3H32 isettringite, C6(A,F)H13 is calcium aluminoferrite hydrate and (F,A)H3 is aluminoferrite hydrate, respectively.
2.1.3. Pozzolanic reactionThe addition of siliceous SCMs effectively reduces the carbon
sequestration potential of hydrated portland cement by reactingwith available CH to produce CSH according to the followingreaction:
3CH þ 2Sþ 5H ! C3S2H8 ð5ÞTherefore, the total amount of available CH in a given concrete
mixture must be mathematically adjusted based on the type andamount of SCM in the concrete mixture (see Section 2.1.5).
2.1.4. Carbonation reactionThe process of carbonation is a chemical reaction that occurs
primarily between readily available CH and atmospheric CO2 thatprecipitates calcite, the most stable polymorph of calcium carbon-ate, CaCO3. In conventional chemistry notation, the reactions are asfollows:
CaðOHÞ2ðsÞ ! Ca2þðaqÞ þ 2OH�ðaqÞ ð6Þ

Table 1Average chemical and mineral composition of cement types by weight according to ASTM C150 [33]. Oxides and minerals are presented in cement chemistry notation.
Cement type Average oxide composition (%) Average mineral (Bogue) composition (%)
S (SiO2) A (Al2O3) F (Fe2O3) C (CaO) M (MgO) Š (SO3) N (Na2O) Other C3S C2S C3A C4AF Other
I 20.5 5.4 2.6 63.9 2.1 3.0 0.61 1.9 54 18 10 8 10II 21.2 4.6 3.5 63.8 2.1 2.7 0.51 1.6 55 19 6 11 9III 20.6 4.9 2.8 63.4 2.2 3.5 0.56 2.0 55 17 9 8 11IV 22.2 4.6 5.0 62.5 1.9 2.2 0.36 1.2 42 32 4 15 7V 21.9 3.9 4.2 63.8 2.2 2.3 0.48 1.2 54 22 4 13 7White 22.7 4.1 0.3 66.7 0.9 2.7 0.18 2.4 63 18 10 1 8
A. Souto-Martinez et al. / Construction and Building Materials 147 (2017) 417–427 419
Ca2þðaqÞ þ 2OH�ðaqÞ þ CO2ðgÞ ! CaCO3ðsÞ þ H2OðlÞ ð7ÞWhile trace amounts of magnesium and sodium are present in
cement, the precipitation of other alkali and alkaline carbonatesalts via similar carbonation reactions is not thermodynamicallyfavored.
This formulation assumes, albeit conservatively, that only avail-able CH participates in the carbon sequestration. Many researchstudies have highlighted the role of calcium silicate hydrate(CSH) in the carbonation process [34]. In addition, the ferriticphases in cement paste (e.g., AFt, AFm) have been shown to car-bonate [35]. However, to preserve simplicity, these carbonationreactions have not been included in the mathematical formulation.The formulation also assumes that no carbonation occurs after CHdepletion. However, further carbonation is likely, due to the exis-tence of calcium-containing compounds (i.e., CSH) formed via poz-zolanic reactions with siliceous SCMs. The assumption that onlyavailable CH participates in carbon sequestration, however, is con-servative, in that the model will not produce overestimations ofsequesterable carbon, but rather err on the side of underprediction.
A negative impact of carbonation is that CO2 gas, which initiallydissolves in water to form carbonic acid, H2CO3, can subsequentlyreact with alkalis in the pore solution (e.g., Ca2+). The depletion ofhydroxide ions (OH–) from the pore solution chemistry effectivelylowers the pH of the pore solution from approximately 12.5 to 9.0.This reduction can destabilize the protective passive oxide layerthat initially forms on the surface of mild steel reinforcement.Destabilization of the passive layer can lead to reinforcement cor-rosion in the presence of sufficient oxygen and water. Therefore,sufficient cover depth is required to protect steel reinforcement,especially in severe exposure conditions. Alternative reinforce-ment strategies, such as the use of epoxy-coated rebar or glassfiber-reinforced polymer (GFRP) rebar, can increase the service-life of reinforced OPC concrete that may be prone to chemical dete-rioration via carbonation.
2.1.5. Carbon sequestration potential of hydrated cement pasteFrom these equations, the theoretical amount of sequesterable
CO2 via the formation of calcium carbonate in the hydrated cementpaste on a per mass basis can be computed according to the follow-ing equation:
Cm ¼ a� b � y ð8Þwhere carbon sequestration potential, Cm, is defined as the totalmass percentage of sequesterable CO2 per kg of carbonated cementpaste (kg CO2/kg cement) in the concrete and y is the percentreplacement (by mass of cement) by SCMs in decimal form. Table 2lists values for the coefficient a, which accounts for variation incement type. Assuming a theoretical 100% hydration of cementminerals, /h ¼ 1:0, the a coefficient reported in Table 1 wasobtained by the following equation:
a ¼ /hMWCH32� BC3S
MWC3Sþ 12� BC2S
MWC2S� 21� BC4AF
MWC4AF
� �ð9Þ
where BC3S, BC2S, and BC4AF are the Bogue composition (%) of C3S, C2S,and C4AF, respectively, and MWC3S, MWC2S, MWC4AF , and MWCH arethe molecular weights of C3S (228.314 g/mol), C2S(172.237 g/mol), C4AF (485.955 g/mol), and CH (74.09 g/com). Mul-tipliers (3/2), (1/2), and (2) are stoichiometric ratios of CH producedor consumed by C3S, C2S, and C4AF, respectively, in the hydrationreactions presented in Eqs. (1), (2), and (4). The relative magnitudesof the a parameter are quantitative measures of the amount of read-ily available CH that is produced by the hydration reactions.
To validate these predictions, similar calculations wereobtained for total theoretical grams (g) of CH produced per gramof cement assuming 100% hydration. The results yield values of0.28, 0.28, 0.28, 0.23, and 0.27 kg CH per kg cement for cementTypes I-V, respectively, which align well with the empirical andtheoretical predictions of CH content as a function of hydrationdegree reported in [36].
The coefficient b accounts for the type and amount of SCMs. Ifthe total silica content of the actual SCM is known, or can beobtained via laboratory analysis prior to mixture proportioning,the coefficient b can be computed according to the generalequation:
b ¼ 1:1 � r ð10Þwhere r the is the weight percent (%) of silicon dioxide (SiO2) in theSCM in decimal form. The scalar of 1.1 was derived by dividing themolar ratio of calcium hydroxide to silica shown in Eq. (6) (3/2) bythe molecular weight of silicon dioxide (60.083 g/mol) and multi-plied by the molecular weight of CO2 (44.01 g/mol), which yieldsa final scale factor of 1.09873 � 1.1. If the total silica content is nei-ther known nor obtainable via chemical analysis, average silica con-tents for common types of SCM are listed in Table 2. However, it iscautioned that the utilization of average silica contents listed inTable 2 will impart uncertainty in the modeling prediction.
2.1.6. Carbonation depthAccurately predicting carbonation depth after a period of pro-
longed exposure is difficult because the process is complex. Thedepth of the carbonation front is affected by moisture, tempera-ture, CO2 concentration, time, and, as discussed, type and amountof cement and SCMs, which dictates the availability of reactive CH.
Despite these challenges, an empirical model for predicting thecarbonation depth, x (mm), has been proposed by the PortugueseNational Laboratory [17] and used by previous researchers:
x ¼ffiffiffiffiffiffiffiffiffiffiffiffiffiffiffiffiffiffiffiffiffi2 � c � t
R
� �s�
ffiffiffiffiffiffiffiffiffiffiffiffiffiffik0k1k2
p 1t
� �n� �ð11Þ
where c is the environmental CO2 concentration (kg/m3) (Note:1 kg/m3 CO2 = 516 ppb), t is exposure time (years), k0 is equal to3.0, k2 is equal to 1.0 for standard curing, and R is the carbonationresistance coefficient (kg year/m5) that is calculated for Type I andType II cement according to:
R ¼ 0:0016 � f 3:106c ð12Þ
Table 2Carbon sequestration potential coefficients per cement type and SCM.
Cement Type a Supplementary Cementitious Material (SCM) Average r % SiO2 b
Type I 0.165 Fly Ash (Class F) 50% 0.55Type II 0.163 Fly Ash (Class C) 25% 0.27Type III 0.166 Slag 35% 0.38Type IV 0.135 Silica Fume 90% 0.99Type V 0.161 Metakaolin 50% 0.55White 0.203
Table 4Carbonation environmental exposure classifications [17].
Class Environment Examples
XC1 Dry orpermanentlyhumid
Reinforced concrete inside buildings or structures,except areas of high humidity; Reinforcedconcrete permanently under non-aggressivewater.
420 A. Souto-Martinez et al. / Construction and Building Materials 147 (2017) 417–427
and for Types III-V and White cement according to:
R ¼ 0:0018 � f 2:862c ð13Þ
where fc is the compressive strength (MPa). The factors k1 and n,shown in Table 3, are dependent upon exposure classifications asoutlined below in Table 4.
XC2 Humid, rarelydry
Reinforced concrete under non-aggressive soil;Reinforced concrete subjected to long periods ofcontact with non-aggressive water.
XC3 Moderatelyhumid
Outer surfaces of reinforced concrete shelteredfrom wind-driven rain; Reinforced concrete insidestructures with moderate to high air humidity.
XC4 Cyclicallyhumid and dry
Reinforced concrete exposed to wetting/dryingcycles; Outer surfaces of reinforced concreteexposed to rain or outside the scope of XC2.
2.1.7. Total carbonated volumeTo calculate total carbonated volume, first, the type of cement
(Type I-V/White), design compressive strength, and mixture pro-portions, namely the total mass (kg) per unit volume (m3) of con-crete, of concrete must be known, as well as the initial exposedsurface area, SA, and total volume of all structural and non-structural exposed concrete members. Exposed concrete includesconcrete elements without coatings or paints that may inhibitingress of CO2.
The total carbonated volume at any finite point in time can becalculated by multiplying the total carbonation depth, x, computedaccording to Eq. (11), by the total surface area of exposed concretemembers:
Vc ¼ SA � x ð14Þ
with the limitation that the total carbonated concrete volume, Vc,must be less than or equal to the total volume of OPC concrete, V.The theoretical limit of sequesterable CO2 of a given volume of con-crete after an infinite amount of time can be calculated by assumingVc = V.
2.1.8. Total mass of sequestered CO2
The total mass of sequesterable CO2, Cs (kg CO2), can be calcu-lated by multiplying the total mass of carbonated cement pasteby the carbon sequestration potential, Cm, calculated according toEq. (8):
Cs ¼ /cCm � ½Vc �m� ð15Þ
where /c is the degree of carbonation,m is the total mass of cementper unit volume of concrete (kg/m3) obtained from the concretebatch mixture proportions, and the quantity in brackets is equalto the total mass of carbonated cement paste. While a theoretical100% degree of carbonation, /c ¼ 1:0, is assumed herein for modelimplementation and demonstration purposes, actual degrees of car-bonation ranging from 0.40 to 0.72 have been experimentallyobtained by previous researchers [37–41]. Lower degrees of carbon-ation are more conservative, which will result in lower estimates ofsequestered CO2.
Table 3Parameter values for k1 and n based on exposure classification [17].
Parameter XC1 XC2 XC3 XC4
k1 1.0 0.20 0.77 0.41n 0 0.183 0.02 0.085
2.2. Model validation
Experimental data related to carbonation exist in the literature,yet the majority of studies focus on validation of predictive modelsfor carbonation-induced corrosion. As previously discussed, only afew studies have used carbonation data to predict total seques-tered CO2 (kg CO2) by concrete elements in situ. Some studies pre-sent specific examples used herein for comparison. Table 5 showscomparative values reported by those authors and those predictedby the model, along with the modeling parameters and assump-tions (if any) that used for validation.
The results substantiate that predicted values for total carbonsequestration of concrete elements align well with those reportedby other studies. For example, according to results obtained byGarcía-Segura et al. [26], a 0.3 � 0.3 � 3 m (SA/V = 14 m�1) TypeI, 25 MPa concrete column sequesters up to 16.4 kg CO2 after100 years of exposure. The mathematical model presented hereinpredicts that the same Type I, 25 MPa concrete column with anidentical geometry would theoretically sequester a maximum ofapproximately 17.0 kg CO2, a difference of 3.7%. Similar resultswere obtained for the other case studies, establishing that the pro-posed generalized mathematical approach is a valid estimate oftheoretical carbon sequestration potential in OPC and blendedOPC cement concretes.
2.3. Model implementation
The model formulated in Section 2.1 was implemented to inves-tigate the effect of cement type, cement content, and time, as wellas the type and amount of SCMs on carbon sequestration potentialof exposed concrete elements. In addition, the influence of (a)design compressive strength, (b) exposure classification, and (c)structural geometry on the carbon sequestration potential of rein-forced concrete elements was investigated herein.
2.3.1. Influence of design compressive strengthTo elucidate the effects of concrete compressive strength, sam-
ple concrete mixtures of varying 28-day compressive strengthswere designed according to the Portland Cement Association con-
Table5
OPC
conc
rete
elem
entcase
stud
iesan
dpa
rametersus
edformod
elva
lidation[25,26
,28–
30].
Sample
Cem
ent
Type
Cem
entCon
tent
(kg/m
3)
Com
pressive
Strength(M
Pa)
SCM
Type
SCM
Quan
tity
(%)
/c(%
)Su
rface
Area(m
2)
Volume
(m3)
Expo
sure
Class
CO2
(ppm
)Time
(yea
rs)
Rep
orted
(kgCO2)
Mod
elpred
iction
(kgCO2)
Referen
ce
1Ty
peI*
373
>35
FlyAsh
(Class
C* )
360.75
2.21
0.22
1Outdoo
rEx
posed
300
701.8
1.3
Pomer
&Pa
de(200
6)2
Type
I*48
0>3
5–
–0.75
2.00
0.01
7Outdoo
rEx
posed
300
500.9
1.0
Pomer
&Pa
de(200
6)3
Type
I*34
9–46
324
–35
FlyAsh
(Class
C* )
12.9–1
4.9
0.75
–1.0*
14,400
–17
,800
11.743
Outdoo
r/Indo
or30
0–80
0*20
91.5
50.2–1
10.6
Lee,
etal.(20
12)
4Ty
peI
250
25–
–0.75
–1.0*
3.6
0.27
Outdoo
r/Indo
or30
0–80
0*10
016
.47.0–
16.99
García-Se
gura,
etal.(20
13)
5Ty
peII
250
25FlyAsh
(Class
C* )
200.75
–1.0*
3.6
0.27
Outdoo
r/Indo
or30
0–80
0*10
011
.42.35
–11.63
García-Se
gura,
etal.(20
13)
6Ty
peII
360
30–
–0.75
9.6
NS
Indo
or80
0*50
36.4
*27
.8La
gerblad(200
6)7
Type
I27
7NS
––
0.35
NS
NS
Indo
or80
0*10
06.1
5.8
Nilsson
&Fridh
(201
1)
*Den
otes
assu
med
mod
elingpa
rameter
orcalculatedresu
ltfrom
reference
studies.
A. Souto-Martinez et al. / Construction and Building Materials 147 (2017) 417–427 421
crete mixture design methodology [42]. In order to calculatecement content, each concrete mixture was initially designedusing a Type I ASTM C 150 cement with a relative density of3.15, maximum coarse aggregate size of 2 cm with an oven-dryrelative density of 2.68 (ATM C 33), natural sand with an oven-dry relative density of 2.64 (ASTM C33), an air-entraining mixtureof wood-resin type (ASTM C 260), and 7% air content. The result-ing sample mixtures are shown below in Table 6.
2.3.2. Influence of environmental exposureCO2 concentration depends on exposure classification. An XC1
exposure is used, for example, for cases where reinforced con-crete is located inside buildings or structures, where the CO2 con-centration is high in comparison to a XC4 exposure, where outersurfaces of concrete elements are exposed to the outdoors. Onaverage, indoor concentrations are approximately 700 ppm abovenormal outdoor CO2 concentrations, which range between 300and 500 ppm [43]. For the purposes of this study, the assumedplacement of elements (indoor vs. outdoor) is linked to XC1 andXC4 exposure classification and to CO2 concentrations of800 ppm (1.55 � 10�3 kg/m3) and 300 ppm (0.581 � 10�3 kg/m3), respectively.
2.3.3. Influence of structural geometryGiven that the carbonation process is a surface-dominated,
rate-dependent phenomenon, the total amount of sequesterableCO2 per unit time is related to the carbonation depth and totalexposed surface area in direct contact with air or water. For thisreason, the geometry, namely the surface area, SA, and total vol-ume, V, of concrete elements will directly influence total CO2
sequestration. To investigate the effect of surface-area-to-volume (SA/V) ratio on CO2 sequestration potential, severalcross-sectional geometries of concrete columns were considered.The cross-sectional area (0.25 m2), length (3 m), and volume (0.75m3) of each column were held constant. Table 7 illustrates theshape, cross-sectional dimensions, total surface area, and SA/Vratios of the concrete columns considered herein.
3. Results and discussion
3.1. Effect of cement type
Fig. 1 shows the effect of cement type on carbon sequestrationpotential of a 0.5 � 0.5 � 3 m (SA/V = 8 m�1) concrete column(Cross-Section #2, Table 7) for all types of cement after 25, 50,75, 100, 125 and 150 years in both an indoor environment(XC1) with a high concentration (800 ppm, 1.55 � 10�3 kg/m3)of CO2 and an outdoor environment (XC4) with low concentration(300 ppm, 0.581 � 10�3 kg/m3) of CO2. A compressive strength of40 MPa was assumed, and no SCMs were added to isolate theeffect of cement type on carbon sequestration potential.
Expectedly, the total amount of sequestered CO2 increaseswith both exposure time and favorable exposure conditions. Forexample, the Type I cement concrete column exhibits a 145%increase in sequesterable CO2 between 25 and 150 years in aXC1 (high-CO2) environment. A 289% increase is observed forthe same Type I cement concrete column in a XC1 versus XC4(low-CO2) environment after 150 years of exposure. All cementtypes exhibit similar time- and exposure-dependent behaviors.
White cement concrete consistently sequesters more CO2 thanother cement types due to its inherently low C4AF mineral com-position. According to Eq. (4), hydration of C4AF consumes CH,thus, low C4AF would result in more CH available for CO2 seques-tration. Similarly, the Type III cement concrete exhibits thesecond-highest CO2 sequestration potential, due to its lower

Table 7Column geometries considered in analyzing the effect of SA/V on carbon sequestration potential. Each column had a fixed cross-sectional area (0.25 m2), length (3 m), and volume(0.75 m3).
Cross-Section Geometry Dimensions (m) Total Surface Area (m2) SA/V Ratio (m�1)
1 r = 0.28 5.3 7.1
2 a = 0.5; b = 0.5 6.0 8.0
3 a = 0.6; b = 0.6; c = 0.33; d = 0.33 11.2 14.9
4 a = 0.14; b = 0.4 11.3 15.1
5 a = 0.1; b = 2.4 15.0 20.0
Fig. 1. Effect of cement type on carbon sequestration potential in (a) XC1 high-(800 ppm) and (b) XC4 low-concentration (300 ppm) CO2 environments after 25 (s), 50 ( ), 75( ), 100 ( ), 125 ( ), and 150 (d) years of exposure for a 40 MPa concrete column (0.5 � 0.5 � 3 m, SA/V = 8 m�1).
Table 6Sample mixture proportions (kg/m3) for concretes of varying compressive strengths.
Concrete Mixture Constituents Concrete Design Compressive Strength
15 MPa 25 MPa 30 MPa 40 MPa 45 MPa
Cement 281 381 451 572 641Water 102 106 110 115 118Coarse Aggregate 1013 1013 1013 1013 1013Fine Aggregate 866 1310 715 698 547
422 A. Souto-Martinez et al. / Construction and Building Materials 147 (2017) 417–427
C4AF content compared to Type I, II, IV, and V cements (Table 1).Type I and Type II cement concretes exhibit similar behaviors inboth CO2 environments. This behavior is anticipated due to simi-larities in both chemical composition and carbonation resistanceof Type I and Type II cements.
The diminishing effect of total sequestered CO2 with time isdemonstrated by all cement types in both CO2 environments. TypeI and White cement concrete columns sequester 22.4 kg CO2 and40.5 kg CO2, respectively, for this application after the first 25 yearsof exposure in a XC1 high-concentration CO2 environment. Thesecolumns only sequester an additional 32.5 kg CO2 and 46.8 kgCO2, respectively, after 125 years of further exposure (150 years).
This reduction in the rate of CO2 sequestration is attributable tothe time-dependent decay in total carbonation depth (Eq. (11)).
Fig. 1a also demonstrates that the total volume of this particularconcrete column can carbonize in its entirety while exposed in-service to a XC1 high CO2 concentration environment. For example,Type III, IV, V and White cement concrete columns reach theirmaximum theoretical carbon sequestration potential after125 years of exposure. The theoretical maximum for a Type IVcement, 40 MPa concrete column is 58 kg CO2, while, for a Whitecement, 40 MPa concrete column of identical volume, an additional50% can be sequestrated (87 kg total). These results demonstratethat reaching the theoretical carbon sequestration potential during
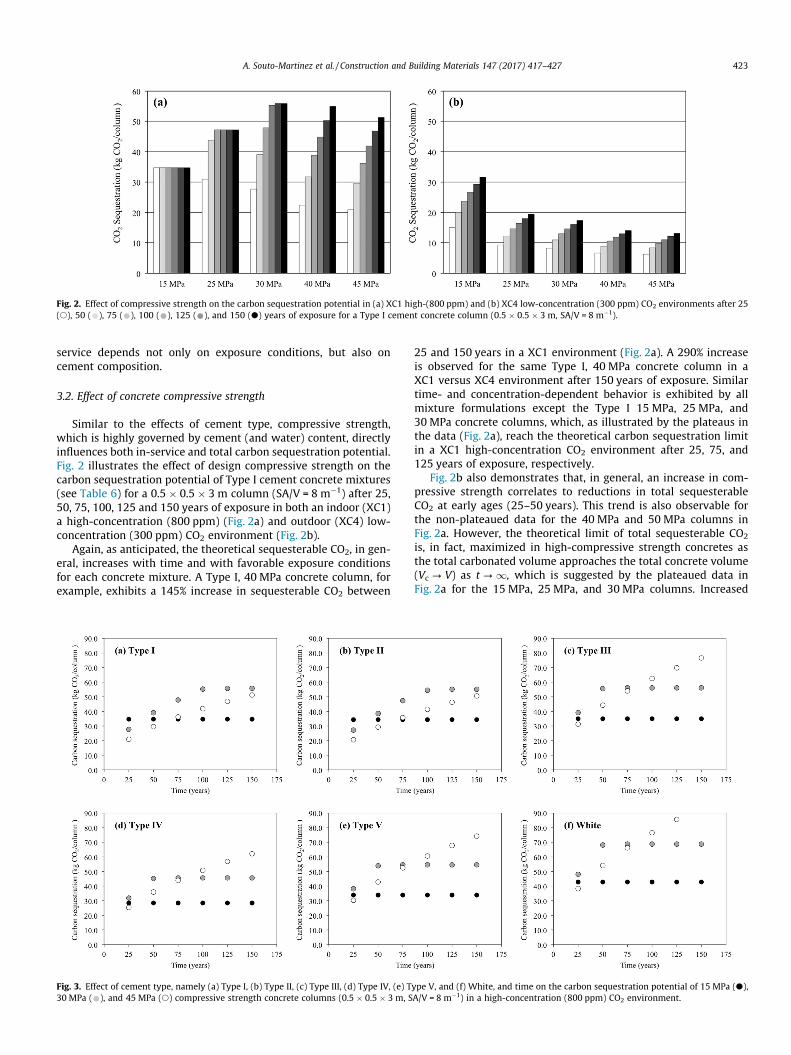
Fig. 2. Effect of compressive strength on the carbon sequestration potential in (a) XC1 high-(800 ppm) and (b) XC4 low-concentration (300 ppm) CO2 environments after 25(s), 50 ( ), 75 ( ), 100 ( ), 125 ( ), and 150 (d) years of exposure for a Type I cement concrete column (0.5 � 0.5 � 3 m, SA/V = 8 m�1).
A. Souto-Martinez et al. / Construction and Building Materials 147 (2017) 417–427 423
service depends not only on exposure conditions, but also oncement composition.
3.2. Effect of concrete compressive strength
Similar to the effects of cement type, compressive strength,which is highly governed by cement (and water) content, directlyinfluences both in-service and total carbon sequestration potential.Fig. 2 illustrates the effect of design compressive strength on thecarbon sequestration potential of Type I cement concrete mixtures(see Table 6) for a 0.5 � 0.5 � 3 m column (SA/V = 8 m�1) after 25,50, 75, 100, 125 and 150 years of exposure in both an indoor (XC1)a high-concentration (800 ppm) (Fig. 2a) and outdoor (XC4) low-concentration (300 ppm) CO2 environment (Fig. 2b).
Again, as anticipated, the theoretical sequesterable CO2, in gen-eral, increases with time and with favorable exposure conditionsfor each concrete mixture. A Type I, 40 MPa concrete column, forexample, exhibits a 145% increase in sequesterable CO2 between
Fig. 3. Effect of cement type, namely (a) Type I, (b) Type II, (c) Type III, (d) Type IV, (e) T30 MPa ( ), and 45 MPa (s) compressive strength concrete columns (0.5 � 0.5 � 3 m, S
25 and 150 years in a XC1 environment (Fig. 2a). A 290% increaseis observed for the same Type I, 40 MPa concrete column in aXC1 versus XC4 environment after 150 years of exposure. Similartime- and concentration-dependent behavior is exhibited by allmixture formulations except the Type I 15 MPa, 25 MPa, and30 MPa concrete columns, which, as illustrated by the plateaus inthe data (Fig. 2a), reach the theoretical carbon sequestration limitin a XC1 high-concentration CO2 environment after 25, 75, and125 years of exposure, respectively.
Fig. 2b also demonstrates that, in general, an increase in com-pressive strength correlates to reductions in total sequesterableCO2 at early ages (25–50 years). This trend is also observable forthe non-plateaued data for the 40 MPa and 50 MPa columns inFig. 2a. However, the theoretical limit of total sequesterable CO2
is, in fact, maximized in high-compressive strength concretes asthe total carbonated volume approaches the total concrete volume(Vc ? V) as t?1, which is suggested by the plateaued data inFig. 2a for the 15 MPa, 25 MPa, and 30 MPa columns. Increased
ype V, and (f) White, and time on the carbon sequestration potential of 15 MPa (d),A/V = 8 m�1) in a high-concentration (800 ppm) CO2 environment.
424 A. Souto-Martinez et al. / Construction and Building Materials 147 (2017) 417–427
compressive strengths require higher cement contents (seeTable 6), thus increasing the theoretical potential for CO2 seques-tration (Eq. (15)). However, the carbonation resistance factor, R,also increases with compressive strength (Eq. (12)). This increaseis attributable to denser microstructures and lower overall gasand liquid permeabilities that result from high-strength concretemixtures. In sum, the data show that lower compressive strengths,high CO2 exposure, and time increase the total sequesterable CO2
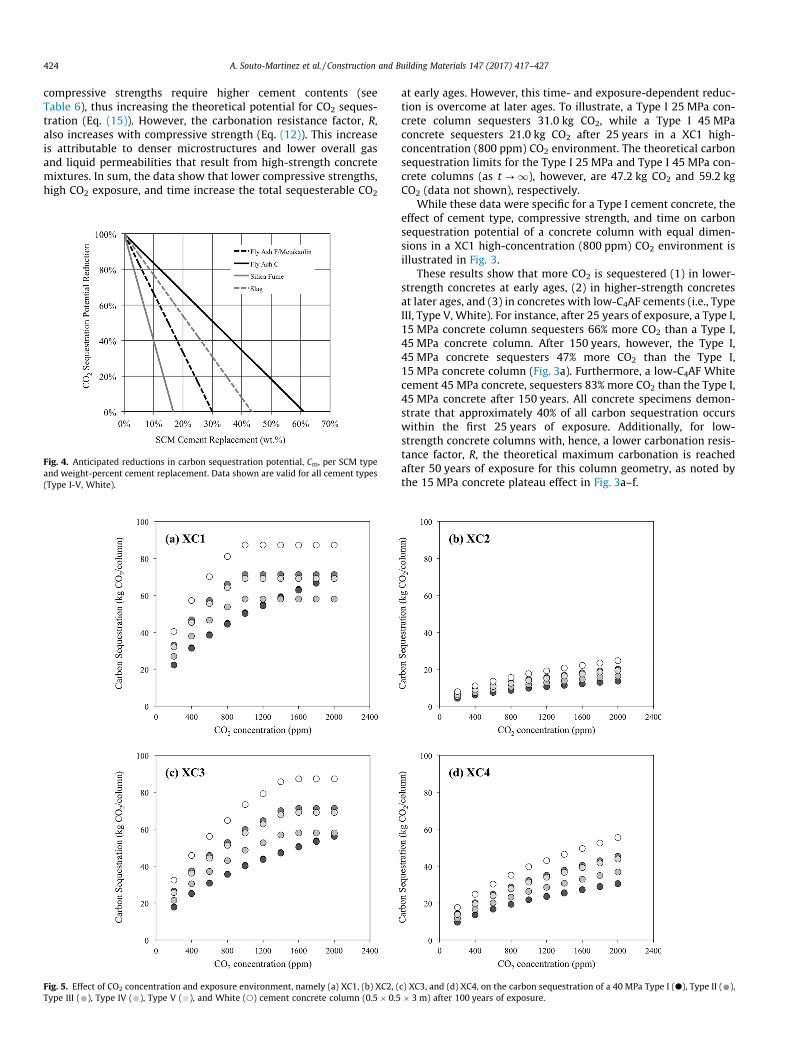
Fig. 4. Anticipated reductions in carbon sequestration potential, Cm, per SCM typeand weight-percent cement replacement. Data shown are valid for all cement types(Type I-V, White).
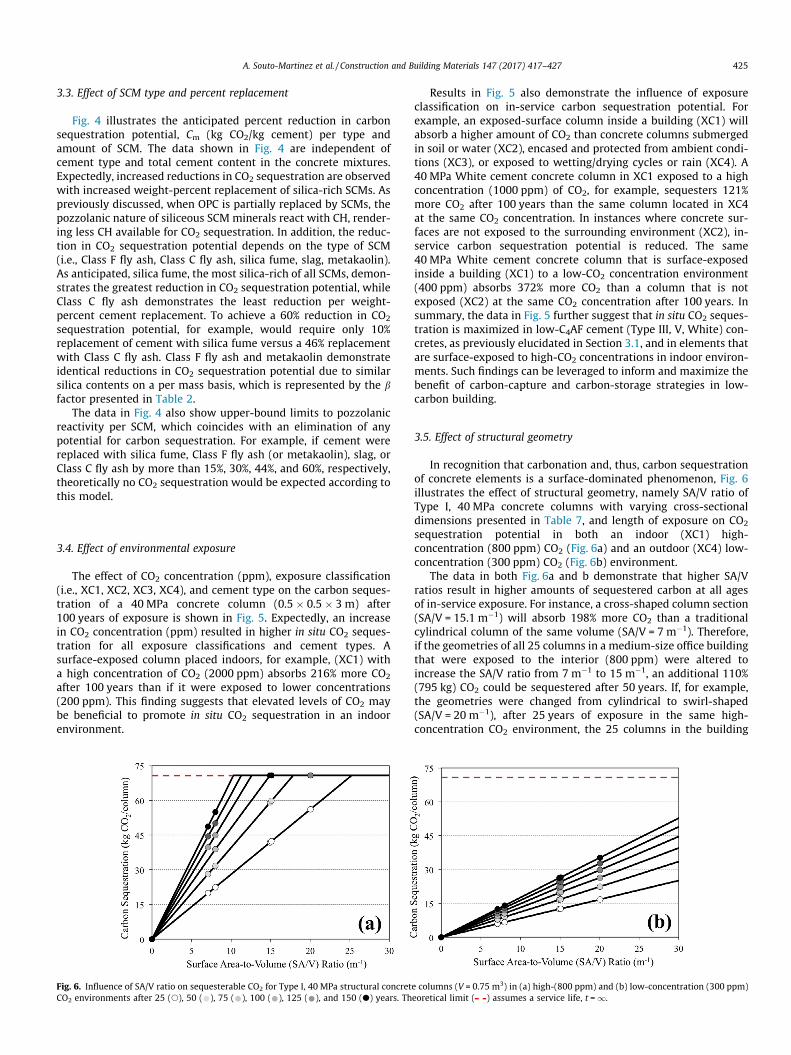
Fig. 5. Effect of CO2 concentration and exposure environment, namely (a) XC1, (b) XC2, (Type III ( ), Type IV ( ), Type V ( ), and White (s) cement concrete column (0.5 � 0.5
at early ages. However, this time- and exposure-dependent reduc-tion is overcome at later ages. To illustrate, a Type I 25 MPa con-crete column sequesters 31.0 kg CO2, while a Type I 45 MPaconcrete sequesters 21.0 kg CO2 after 25 years in a XC1 high-concentration (800 ppm) CO2 environment. The theoretical carbonsequestration limits for the Type I 25 MPa and Type I 45 MPa con-crete columns (as t?1), however, are 47.2 kg CO2 and 59.2 kgCO2 (data not shown), respectively.
While these data were specific for a Type I cement concrete, theeffect of cement type, compressive strength, and time on carbonsequestration potential of a concrete column with equal dimen-sions in a XC1 high-concentration (800 ppm) CO2 environment isillustrated in Fig. 3.
These results show that more CO2 is sequestered (1) in lower-strength concretes at early ages, (2) in higher-strength concretesat later ages, and (3) in concretes with low-C4AF cements (i.e., TypeIII, Type V, White). For instance, after 25 years of exposure, a Type I,15 MPa concrete column sequesters 66% more CO2 than a Type I,45 MPa concrete column. After 150 years, however, the Type I,45 MPa concrete sequesters 47% more CO2 than the Type I,15 MPa concrete column (Fig. 3a). Furthermore, a low-C4AF Whitecement 45 MPa concrete, sequesters 83% more CO2 than the Type I,45 MPa concrete after 150 years. All concrete specimens demon-strate that approximately 40% of all carbon sequestration occurswithin the first 25 years of exposure. Additionally, for low-strength concrete columns with, hence, a lower carbonation resis-tance factor, R, the theoretical maximum carbonation is reachedafter 50 years of exposure for this column geometry, as noted bythe 15 MPa concrete plateau effect in Fig. 3a–f.
c) XC3, and (d) XC4, on the carbon sequestration of a 40 MPa Type I (d), Type II ( ),� 3 m) after 100 years of exposure.
A. Souto-Martinez et al. / Construction and Building Materials 147 (2017) 417–427 425
3.3. Effect of SCM type and percent replacement
Fig. 4 illustrates the anticipated percent reduction in carbonsequestration potential, Cm (kg CO2/kg cement) per type andamount of SCM. The data shown in Fig. 4 are independent ofcement type and total cement content in the concrete mixtures.Expectedly, increased reductions in CO2 sequestration are observedwith increased weight-percent replacement of silica-rich SCMs. Aspreviously discussed, when OPC is partially replaced by SCMs, thepozzolanic nature of siliceous SCM minerals react with CH, render-ing less CH available for CO2 sequestration. In addition, the reduc-tion in CO2 sequestration potential depends on the type of SCM(i.e., Class F fly ash, Class C fly ash, silica fume, slag, metakaolin).As anticipated, silica fume, the most silica-rich of all SCMs, demon-strates the greatest reduction in CO2 sequestration potential, whileClass C fly ash demonstrates the least reduction per weight-percent cement replacement. To achieve a 60% reduction in CO2
sequestration potential, for example, would require only 10%replacement of cement with silica fume versus a 46% replacementwith Class C fly ash. Class F fly ash and metakaolin demonstrateidentical reductions in CO2 sequestration potential due to similarsilica contents on a per mass basis, which is represented by the bfactor presented in Table 2.
The data in Fig. 4 also show upper-bound limits to pozzolanicreactivity per SCM, which coincides with an elimination of anypotential for carbon sequestration. For example, if cement werereplaced with silica fume, Class F fly ash (or metakaolin), slag, orClass C fly ash by more than 15%, 30%, 44%, and 60%, respectively,theoretically no CO2 sequestration would be expected according tothis model.
3.4. Effect of environmental exposure
The effect of CO2 concentration (ppm), exposure classification(i.e., XC1, XC2, XC3, XC4), and cement type on the carbon seques-tration of a 40 MPa concrete column (0.5 � 0.5 � 3 m) after100 years of exposure is shown in Fig. 5. Expectedly, an increasein CO2 concentration (ppm) resulted in higher in situ CO2 seques-tration for all exposure classifications and cement types. Asurface-exposed column placed indoors, for example, (XC1) witha high concentration of CO2 (2000 ppm) absorbs 216% more CO2
after 100 years than if it were exposed to lower concentrations(200 ppm). This finding suggests that elevated levels of CO2 maybe beneficial to promote in situ CO2 sequestration in an indoorenvironment.
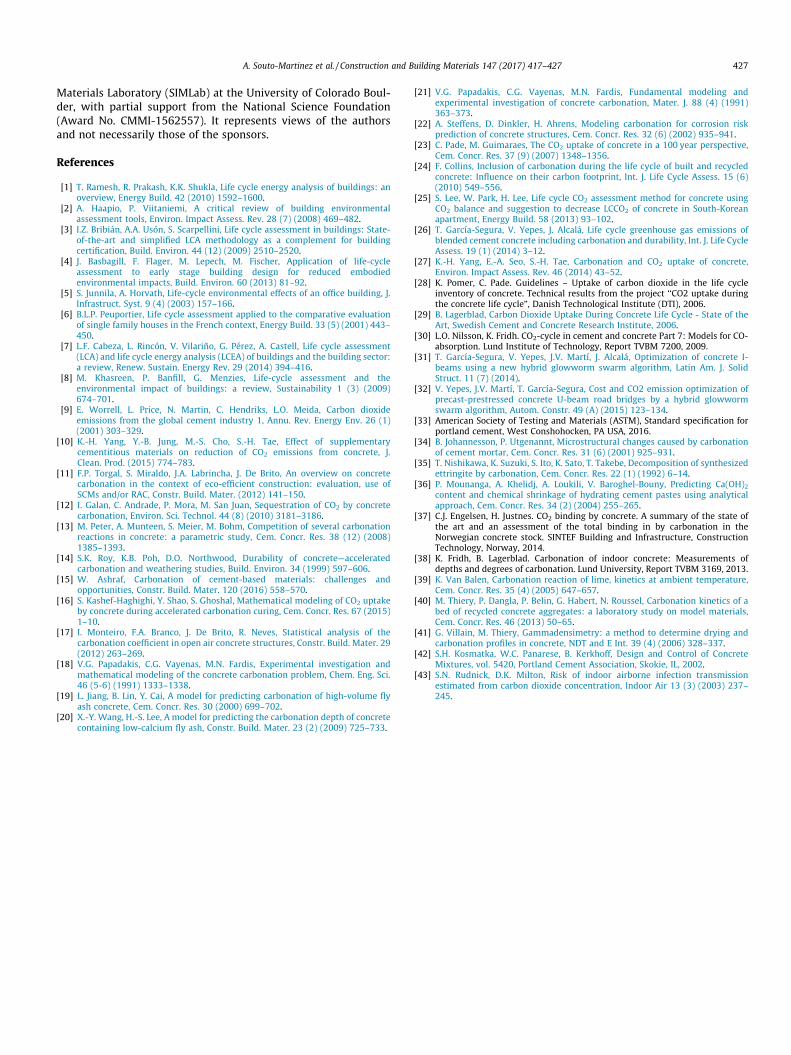
Fig. 6. Influence of SA/V ratio on sequesterable CO2 for Type I, 40 MPa structural concretCO2 environments after 25 (s), 50 ( ), 75 ( ), 100 ( ), 125 ( ), and 150 (d) years. Th
Results in Fig. 5 also demonstrate the influence of exposureclassification on in-service carbon sequestration potential. Forexample, an exposed-surface column inside a building (XC1) willabsorb a higher amount of CO2 than concrete columns submergedin soil or water (XC2), encased and protected from ambient condi-tions (XC3), or exposed to wetting/drying cycles or rain (XC4). A40 MPa White cement concrete column in XC1 exposed to a highconcentration (1000 ppm) of CO2, for example, sequesters 121%more CO2 after 100 years than the same column located in XC4at the same CO2 concentration. In instances where concrete sur-faces are not exposed to the surrounding environment (XC2), in-service carbon sequestration potential is reduced. The same40 MPa White cement concrete column that is surface-exposedinside a building (XC1) to a low-CO2 concentration environment(400 ppm) absorbs 372% more CO2 than a column that is notexposed (XC2) at the same CO2 concentration after 100 years. Insummary, the data in Fig. 5 further suggest that in situ CO2 seques-tration is maximized in low-C4AF cement (Type III, V, White) con-cretes, as previously elucidated in Section 3.1, and in elements thatare surface-exposed to high-CO2 concentrations in indoor environ-ments. Such findings can be leveraged to inform and maximize thebenefit of carbon-capture and carbon-storage strategies in low-carbon building.
3.5. Effect of structural geometry
In recognition that carbonation and, thus, carbon sequestrationof concrete elements is a surface-dominated phenomenon, Fig. 6illustrates the effect of structural geometry, namely SA/V ratio ofType I, 40 MPa concrete columns with varying cross-sectionaldimensions presented in Table 7, and length of exposure on CO2
sequestration potential in both an indoor (XC1) high-concentration (800 ppm) CO2 (Fig. 6a) and an outdoor (XC4) low-concentration (300 ppm) CO2 (Fig. 6b) environment.
The data in both Fig. 6a and b demonstrate that higher SA/Vratios result in higher amounts of sequestered carbon at all agesof in-service exposure. For instance, a cross-shaped column section(SA/V = 15.1 m�1) will absorb 198% more CO2 than a traditionalcylindrical column of the same volume (SA/V = 7 m�1). Therefore,if the geometries of all 25 columns in a medium-size office buildingthat were exposed to the interior (800 ppm) were altered toincrease the SA/V ratio from 7 m�1 to 15 m�1, an additional 110%(795 kg) CO2 could be sequestered after 50 years. If, for example,the geometries were changed from cylindrical to swirl-shaped(SA/V = 20 m�1), after 25 years of exposure in the same high-concentration CO2 environment, the 25 columns in the building
e columns (V = 0.75 m3) in (a) high-(800 ppm) and (b) low-concentration (300 ppm)eoretical limit ( ) assumes a service life, t =1.

426 A. Souto-Martinez et al. / Construction and Building Materials 147 (2017) 417–427
could sequester 185% (910 kg) more CO2. Percent increases areidentical in either a high- or low-concentration CO2 environment,rendering the SA/V-related increases in carbon sequestrationpotential independent of environmental exposure.
Fig. 6 also illustrates that, while higher SA/V ratios result inhigher amounts of sequestered carbon at all finite ages of exposure,all shapes will eventual reach the theoretical limit of 70.8 kg CO2 atinfinite ages for this particular volume (V = 0.75m3) of Type I,40 MPa concrete. In this analysis, a 100% carbonation degree hasbeen assumed, thus concrete elements with high SA/V ratio (SA/V > 15 m�1) located in high CO2 concentration environments canreach this theoretical limit after 75–100 years. However, realisticvolumes of concrete elements will not likely reach theoretical lim-its while in service. Practically, concrete structures would likelyreach their theoretical limit post-deconstruction, when concreteelements are demolished and crushed into high surface-area rub-ble. In this case, concrete may experience accelerated carbonationand, depending upon post-deconstruction exposure conditions,could reach the theoretical limit prescribed by the model proposedherein. When incorporating this particular model into WBLCA, theestimated CO2 sequestered will vary depending on the chosen sys-tem boundary. For instance, in a cradle-to-cradle study, where theeffects of post-use crushing and recycling concrete are included, itcan be immediately assumed that the volume carbonated will beequivalent to the total volume of the concrete element (i.e.,t =1). However, in cases where the system boundary of interestdoes not include end-of-life exposure (i.e., t–1), the carbonsequestration benefits of post-use carbon sequestration are notincluded in the model prediction.
The magnitude of carbon sequestration in relation to initial car-bon emissions is highly dependent upon the cradle-to-gate lifecy-cle assessment of the OPC concrete element. Recent studies haveshown that certain concrete elements can sequester anywherefrom 15 to 17% of initial CO2 emissions [27] or up to 41% [26].The results from this study indicate that the degree of recarbona-tion of any structural element will be highly dependent not onlyon the initial carbon emissions during manufacture, transport,and construction, but also on the type and amount of cement,SCMs, compressive strength, and geometry of the individual con-crete element.
It is evident from the data that, for the same volume of concrete,high SA/V-ratio geometries are preferred in terms of carbonsequestration potential for structures with less than 50 years ofexposure. In order to achieve higher SA/V ratios, however, complexstructural shapes are required. Circular and square cross-sections,which exhibit the lowest SA/V ratios, currently dominate for fast,low-cost construction. However, more complex structural shapescould be made possible by emerging technologies, such as additivemanufacturing (3D printing).
Finally, Fig. 6 illustrates that high CO2 environments enhancein situ CO2 sequestration, which, in concert with findings presentedin previous sections, indicates that a combination of (1) innova-tions in structural geometries (high SA/V ratios), (2) high CO2 expo-sure, (3) low-C4AF cements, (4) no SCMs, (5) low-compressivestrengths at early ages, (6) high-compressive strengths at laterages, and (7) interior placement would be most favorable in orderto strategically maximize the in-service CO2 sequestration poten-tial of exposed reinforced concrete elements.
4. Conclusions
A simple model for predicting the carbon sequestration poten-tial of exposed ordinary portland cement (OPC) concrete elementswas formulated and implemented in this work. The model, whichis based on OPC cement hydration and carbonation reaction chem-
istry, accounts for type and quantity of cements and weight-percent replacement of cement by supplementary cementitiousmaterials (SCMs). The effects of each of these parameters on thetheoretical carbon dioxide (CO2) sequestration of OPC concrete ele-ments were investigated for a variety of CO2 environmental expo-sure classifications. In addition, the influence of concrete designcompressive strength and structural geometry, namely the effectof increasing surface-area-to-volume (SA/V) ratio of exposed con-crete elements, on sequesterable CO2 was investigated herein.
As anticipated, the results confirm that total sequesterable CO2
increases not only with exposure time, but also with CO2 concen-tration while in service. In addition, White cement exhibited thehighest CO2 sequestration potential of all cement types, due toits low C4AF content. Results also suggest that low-strength con-cretes sequester more CO2 at early ages, but high-strength con-cretes sequester more CO2 at later ages, elucidating a time-dependent influence of compressive strength on total carbonsequestration.
The data illustrate that, when OPC is partially replaced by SCMs,the CO2 sequestration potential is reduced and that this reductiondepends upon type of SCM and weight-percent cement replace-ment. Silica-rich SCMs, such as silica fume, Class F fly ash, andmetakaolin, exhibit the most reductions in CO2 sequestrationpotential per weight-percent replacement compared to SCMs withlower silica contents (e.g., slag, Class C fly ash). Furthermore, theamount of sequesterable CO2 depends on the exposure classifica-tion of the OPC concrete element. CO2 sequestration was enhancedin permanently dry or humid conditions and reduced in cyclicallyhumid and dry conditions, suggesting that it is favorable to placeOPC concrete elements inside the building envelope rather thanoutside to enhance in situ sequestration.
Innovative structural geometries, namely increasing the SA/Vratios of concrete elements, can enhance the carbon sequestrationpotential of OPC concrete structures. By analyzing columns of sim-ilar volumes but with varying surface-area geometries, it wasfound that total, in situ sequesterable CO2 can be enhanced by upto 255% compared to round, cylindrical columns. Innovativegeometries required for high-SA/V ratio structural elements areincreasingly achievable with advancements in additive manufac-turing construction technologies.
The model presented herein can be employed to quantify car-bon sequestration potential of reinforced OPC concrete elementswhen implementing a whole-building lifecycle assessment(WBLCA). Total sequesterable carbon can be calculated for concreteelements while in service (assuming a finite lifetime) or out of ser-vice (assuming an infinite lifetime). As discussed, the model pre-sented in this paper is notably conservative, since it does notaccount for participation by other ferritic or calcium-containingcompounds (i.e., CSH) in the carbon sequestration process.
In summary, the findings suggest that novel materials designconsiderations (low C4AF cement, low compressive strength, noSCMs), structural concrete design innovations (high SA/V ratio),and new air quality strategies (minimum ppm CO2) could beimplemented to maximize in situ sequestration via exposure ofOPC concrete elements to CO2-rich environments. Given thatenhanced carbonation during service may lead to premature ser-viceability concerns with carbonation-induced corrosion of mildsteel reinforcement, design decisions related to maximizing carbonsequestration potential of exposed OPC concrete should be madewithin a more holistic lifecycle sustainability context.
Acknowledgments
This work was made possible by the Department of Civil, Envi-ronmental, and Architectural Engineering, the College of Engineer-ing and Applied Sciences, and the Sustainable Infrastructure
A. Souto-Martinez et al. / Construction and Building Materials 147 (2017) 417–427 427
Materials Laboratory (SIMLab) at the University of Colorado Boul-der, with partial support from the National Science Foundation(Award No. CMMI-1562557). It represents views of the authorsand not necessarily those of the sponsors.
References
[1] T. Ramesh, R. Prakash, K.K. Shukla, Life cycle energy analysis of buildings: anoverview, Energy Build. 42 (2010) 1592–1600.
[2] A. Haapio, P. Viitaniemi, A critical review of building environmentalassessment tools, Environ. Impact Assess. Rev. 28 (7) (2008) 469–482.
[3] I.Z. Bribián, A.A. Usón, S. Scarpellini, Life cycle assessment in buildings: State-of-the-art and simplified LCA methodology as a complement for buildingcertification, Build. Environ. 44 (12) (2009) 2510–2520.
[4] J. Basbagill, F. Flager, M. Lepech, M. Fischer, Application of life-cycleassessment to early stage building design for reduced embodiedenvironmental impacts, Build. Environ. 60 (2013) 81–92.
[5] S. Junnila, A. Horvath, Life-cycle environmental effects of an office building, J.Infrastruct. Syst. 9 (4) (2003) 157–166.
[6] B.L.P. Peuportier, Life cycle assessment applied to the comparative evaluationof single family houses in the French context, Energy Build. 33 (5) (2001) 443–450.
[7] L.F. Cabeza, L. Rincón, V. Vilariño, G. Pérez, A. Castell, Life cycle assessment(LCA) and life cycle energy analysis (LCEA) of buildings and the building sector:a review, Renew. Sustain. Energy Rev. 29 (2014) 394–416.
[8] M. Khasreen, P. Banfill, G. Menzies, Life-cycle assessment and theenvironmental impact of buildings: a review, Sustainability 1 (3) (2009)674–701.
[9] E. Worrell, L. Price, N. Martin, C. Hendriks, L.O. Meida, Carbon dioxideemissions from the global cement industry 1, Annu. Rev. Energy Env. 26 (1)(2001) 303–329.
[10] K.-H. Yang, Y.-B. Jung, M.-S. Cho, S.-H. Tae, Effect of supplementarycementitious materials on reduction of CO2 emissions from concrete, J.Clean. Prod. (2015) 774–783.
[11] F.P. Torgal, S. Miraldo, J.A. Labrincha, J. De Brito, An overview on concretecarbonation in the context of eco-efficient construction: evaluation, use ofSCMs and/or RAC, Constr. Build. Mater. (2012) 141–150.
[12] I. Galan, C. Andrade, P. Mora, M. San Juan, Sequestration of CO2 by concretecarbonation, Environ. Sci. Technol. 44 (8) (2010) 3181–3186.
[13] M. Peter, A. Munteen, S. Meier, M. Bohm, Competition of several carbonationreactions in concrete: a parametric study, Cem. Concr. Res. 38 (12) (2008)1385–1393.
[14] S.K. Roy, K.B. Poh, D.O. Northwood, Durability of concrete—acceleratedcarbonation and weathering studies, Build. Environ. 34 (1999) 597–606.
[15] W. Ashraf, Carbonation of cement-based materials: challenges andopportunities, Constr. Build. Mater. 120 (2016) 558–570.
[16] S. Kashef-Haghighi, Y. Shao, S. Ghoshal, Mathematical modeling of CO2 uptakeby concrete during accelerated carbonation curing, Cem. Concr. Res. 67 (2015)1–10.
[17] I. Monteiro, F.A. Branco, J. De Brito, R. Neves, Statistical analysis of thecarbonation coefficient in open air concrete structures, Constr. Build. Mater. 29(2012) 263–269.
[18] V.G. Papadakis, C.G. Vayenas, M.N. Fardis, Experimental investigation andmathematical modeling of the concrete carbonation problem, Chem. Eng. Sci.46 (5-6) (1991) 1333–1338.
[19] L. Jiang, B. Lin, Y. Cai, A model for predicting carbonation of high-volume flyash concrete, Cem. Concr. Res. 30 (2000) 699–702.
[20] X.-Y. Wang, H.-S. Lee, A model for predicting the carbonation depth of concretecontaining low-calcium fly ash, Constr. Build. Mater. 23 (2) (2009) 725–733.
[21] V.G. Papadakis, C.G. Vayenas, M.N. Fardis, Fundamental modeling andexperimental investigation of concrete carbonation, Mater. J. 88 (4) (1991)363–373.
[22] A. Steffens, D. Dinkler, H. Ahrens, Modeling carbonation for corrosion riskprediction of concrete structures, Cem. Concr. Res. 32 (6) (2002) 935–941.
[23] C. Pade, M. Guimaraes, The CO2 uptake of concrete in a 100 year perspective,Cem. Concr. Res. 37 (9) (2007) 1348–1356.
[24] F. Collins, Inclusion of carbonation during the life cycle of built and recycledconcrete: Influence on their carbon footprint, Int. J. Life Cycle Assess. 15 (6)(2010) 549–556.
[25] S. Lee, W. Park, H. Lee, Life cycle CO2 assessment method for concrete usingCO2 balance and suggestion to decrease LCCO2 of concrete in South-Koreanapartment, Energy Build. 58 (2013) 93–102.
[26] T. García-Segura, V. Yepes, J. Alcalá, Life cycle greenhouse gas emissions ofblended cement concrete including carbonation and durability, Int. J. Life CycleAssess. 19 (1) (2014) 3–12.
[27] K.-H. Yang, E.-A. Seo, S.-H. Tae, Carbonation and CO2 uptake of concrete,Environ. Impact Assess. Rev. 46 (2014) 43–52.
[28] K. Pomer, C. Pade. Guidelines – Uptake of carbon dioxide in the life cycleinventory of concrete. Technical results from the project ‘‘CO2 uptake duringthe concrete life cycle”, Danish Technological Institute (DTI), 2006.
[29] B. Lagerblad, Carbon Dioxide Uptake During Concrete Life Cycle - State of theArt, Swedish Cement and Concrete Research Institute, 2006.
[30] L.O. Nilsson, K. Fridh. CO2-cycle in cement and concrete Part 7: Models for CO-absorption. Lund Institute of Technology, Report TVBM 7200, 2009.
[31] T. García-Segura, V. Yepes, J.V. Martí, J. Alcalá, Optimization of concrete I-beams using a new hybrid glowworm swarm algorithm, Latin Am. J. SolidStruct. 11 (7) (2014).
[32] V. Yepes, J.V. Martí, T. García-Segura, Cost and CO2 emission optimization ofprecast-prestressed concrete U-beam road bridges by a hybrid glowwormswarm algorithm, Autom. Constr. 49 (A) (2015) 123–134.
[33] American Society of Testing and Materials (ASTM), Standard specification forportland cement, West Conshohocken, PA USA, 2016.
[34] B. Johannesson, P. Utgenannt, Microstructural changes caused by carbonationof cement mortar, Cem. Concr. Res. 31 (6) (2001) 925–931.
[35] T. Nishikawa, K. Suzuki, S. Ito, K. Sato, T. Takebe, Decomposition of synthesizedettringite by carbonation, Cem. Concr. Res. 22 (1) (1992) 6–14.
[36] P. Mounanga, A. Khelidj, A. Loukili, V. Baroghel-Bouny, Predicting Ca(OH)2content and chemical shrinkage of hydrating cement pastes using analyticalapproach, Cem. Concr. Res. 34 (2) (2004) 255–265.
[37] C.J. Engelsen, H. Justnes. CO2 binding by concrete. A summary of the state ofthe art and an assessment of the total binding in by carbonation in theNorwegian concrete stock. SINTEF Building and Infrastructure, ConstructionTechnology, Norway, 2014.
[38] K. Fridh, B. Lagerblad. Carbonation of indoor concrete: Measurements ofdepths and degrees of carbonation. Lund University, Report TVBM 3169, 2013.
[39] K. Van Balen, Carbonation reaction of lime, kinetics at ambient temperature,Cem. Concr. Res. 35 (4) (2005) 647–657.
[40] M. Thiery, P. Dangla, P. Belin, G. Habert, N. Roussel, Carbonation kinetics of abed of recycled concrete aggregates: a laboratory study on model materials,Cem. Concr. Res. 46 (2013) 50–65.
[41] G. Villain, M. Thiery, Gammadensimetry: a method to determine drying andcarbonation profiles in concrete, NDT and E Int. 39 (4) (2006) 328–337.
[42] S.H. Kosmatka, W.C. Panarese, B. Kerkhoff, Design and Control of ConcreteMixtures, vol. 5420, Portland Cement Association, Skokie, IL, 2002.
[43] S.N. Rudnick, D.K. Milton, Risk of indoor airborne infection transmissionestimated from carbon dioxide concentration, Indoor Air 13 (3) (2003) 237–245.