a mathematical model of consumer behavior - american marketing
TRANSCRIPT
A Mathematical Model of Consumer BehaviorBENJAMIN LIPSTEIN*
^ A mathematical model is presented of consumer behavior in the marketplace under advertising itimula-tion. The model relates advertising effort to attitude changes ond consumer purchases, using a nonsiationoryMarkov process. A new analytical method of handling nonstotionory jtochostic matrices is developed. Thebehavior of brand shares under different market conditions is considered along with numerical examples ofhow Ihe model operates.
The study of advertising effectiveness almost invariablyinvolves consideration of consumer attitudes, how atti-tude changes are brought about und what effect thesechanges in attitude have on consumer purchases. Thesediscussions at times tend to be vague and ambiguous,and are likely to remain that way until they are repre-sented more rigorously in symbolic form. The mathe-matization of these ideas serves to clarify the impliedrelationships, provides a formal basis for measuringthe quantities involved and may provide impetus forpositive progress in establishing relationships amongadvertising, consumer attitudes, and consumer purchases.
This paper presents a model of how changes in con-sumer attitudes affect consumer purchases. Changes inconsumer attitudes can be viewed as probabilities, andby arrangement into square arrays as Markov chains.The conventional use of Markov chains in marketingassumes that the transition probabilities are fixed, namelythat the chains are stationary [2, 4, 5]. The far moreinteresting and important case is that in which thetransition probabilities change. A new mathematicalapproach for analyzing nonstationary chains is presentedas part of the model's development. A study of the be-havior of the model through the use of theorems onmatrices suggests some interesting implications aboutchange in consumer attitudes, their effect on brand shareand the measurement of advertising effectiveness. Finally,some numerical examples are given to demonstrate theapplication of the model.
THE MODEL
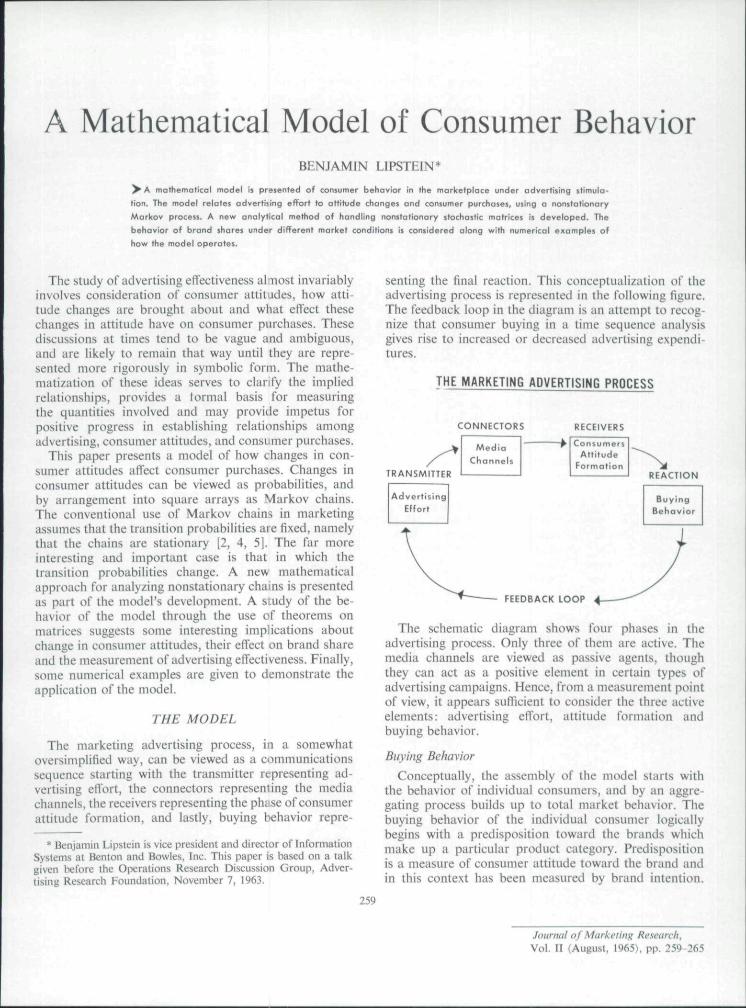
The marketing advertising process, in a somewhatoversimplified way, can be viewed as a communicationssequence starting with the transmitter representing ad-vertising effort, the connectors representing the mediachannels, the receivers representing the phase of consumerattitude formation, and lastly, buying behavior repre-
* Benjamin Lipstein is vice president and director o{ InformationSystems at Benlon and Bowles, Inc. This paper is based on a talkgiven belore Ihe Operations Research Discussion Group, Adver-tising Research Foundation, November 1, 1963.
senting the final reaction. This conceptualization of theadvertising process is represented in the following figure.The feedback loop in the diagram is an attempt to recog-nize that consumer buying in a time sequence analysisgives rise to increased or decreased advertising expendi-tures.
THE MARKETING ADVERTISING PROCESS
CONNECTORS RECEIVERS
TRANSMITTER
AdvertisingEffort
MediaCharinels
ConsumersAttitude
FormotionREACTION
BuyingBehavior
FEEDBACK tOOP
The schematic diagram shows four phases in theadvertising process. Only three of them are active. Themedia channels are viewed as passive agents, thoughthey can act as a positive element in certain types ofadvertising campaigns. Hence, from a measurement pointof view, it appears sufficient to consider the three activeelements: advertising effort, attitude formation andbuying behavior.
Bityitig Behavior
Conceptually, the assembly of the model starts withthe behavior of individual consumers, and by an aggre-gating process builds up to total market behavior. Thebuying behavior of the individual consumer logicallybegins with a predisposition toward the brands whichmake up a particular product category. Predispositionis a measure of consumer attitude toward the brand andin this context has been measured by brand intention.
259
Journat of Marketing Research,Vol. II (August, 1965), pp. 259-265

260 JOURNAL OF MARKETING RESEARCH, AUGUST 1965
For example, in a consumer survey it might be measuredby asking the following question. "If you are going tothe store right now, what brand would you buy?" It isthis predisposition which the consumer brings to theretail store when the decision to purchase a particularproduct is made.
While it has been observed that repeat buying rates forthe same brand over periods of time tend to be large,they are generally smaller than the measurement of repeatrates on preference (attitude) toward the same brand.This suggests that some interferences occur which deterconsumers from executing their brand preferences.Distribution is perhaps the most obvious. If the brandis not carried by the supermarket the consumer uses, orif the brand or a particular size is out of stock the con-sumer may not be able to execute brand choice.
Considerable attention has been given to impulsebuying. Rehtted to this is the shelf space which the par-ticular store devotes to each brand. The greater the shelfspace, the greater the ease with which the consumer cankxate the brand to be purchased. By the same token,special displays have the effect of increasing consumerability to purchase that brand, in effect, distribution, shelfspacing and displays, if fully favorable to the brand,permit execution of this predisposition to buy. Anyfailure or disadvantage which the brand may suffer in aparticular supermarket has the effect of lowering abilityto execute consumer predisposition.
Another effect oi' considerable importance is that ofprice. A consumer approaches the purchase of a particu-lar brand with a notion of how its price relates to otherbrands. If, on visiting the supermarket, the price structureis found to be essentially that which was anticipated, allother things remaining equal, purchase of the regularbrand is most likely. However, on occasion price sur-prises are encountered. A less preferred brand may befeatured at a special price. The consumer may be inclinedto try the featured brand if the price incentive is large,relative to the initial predisposition. This is identified byeconomists as cross elasticity of demand with respect toprice. For completeness, the mode! makes provision forrandom elements. A random error variable is used tocover all other factors which have not been considered.The cumulative effect of these elements is a share ofmarket for each brand.
Attitude Formation
ln spite oi^ the constant barrage of advertising to alterconsumer atliludes, there is a tendency for these attitudesto persist. More people tend to retain the same positiveattitudes toward a brand than tend to change. To be morespecific, over periods as long as one month, we haveobserved that most people are inclined to buy the sameproduct. This cleariy suggests a high level of stabilityin attitudes. As a matter of fact, if this were not the case,the market would be in constant chaos.
The heart of the advertising measurement problemlies in attitude formation. At any point in time, consumers
have a starting predisposition toward existing brands.This predisposition is made up of a variety of elements.They include the price and quality expectations towardthe preferred brand and all other brands. To some degree,a certain amount of this change in preference is of arandom nature or unaccountable from known influences.However, under controlled circumstances, it is possibleto measure the effect of exposure to advertising on con-sumer predisposition toward brands. It is the cumulativeeffect of the exposure to advertising which either rein-forces or changes consumer predisposition or attitudeup to the point of purchase.
Advertising Effort
As pointed out, the media which advertisers use arethe channels through which the information is sent. Thedecisions on the use of different channels may lead togreater or lesser efficiency in terms of reach and frequencywith which the message is directed to consumers. How-ever, the channels by themselves are passive elements. Thelast element to be considered in advertising eflbrt is thequality of the copy. Good copy magnifies the effect of thenumber of messages, poor copy detracts from it. Thissection of the model is concerned with the aggregateadvertising eflori. it can be magnified or diminished bythe quality of the copy or media selection. Briefly, themodel links share of mind, changes in attitude, share ofmarket, reduced levels of loyalty in buying verses atti-tudes, and the aggregate weight of spending in attempt-ing to provide a description of how the consumer behaves.
Mathematical Formulation
It has been demonstrated in earlier work that data onsequences of consumer purchases can be viewed as amatrix of brand loyalty and brand switching [5].
The matrix.
A =
(in
0-23
is a direct representation of consumer transactions in themarket for a specifietl period of time. The a,j elementsare probabilities, where each row sum is equal to one.Each aij term gives the probability that the consumerhaving bought Brand / in the last period will purchaseBrandy in the next period. The a,, terms are the loyaltiesor probabilities o{ the consumer repeating the purchaseof the same brand. These entries are easily derived fromconsumer purchase panel data. The sequences of pur-chases are tabulated in a two-way table where the rowsrepresent previous purchases and the columns current

A MATHEMATICAL MODEL OF CONSUMER BEHAVIOR 261
purchases. Percentagingeach ofthe rows of this frequencyUible to lOQ percent produces the Matrix A.
While the «,> terms of the A matrix are observabletacts, they are the end result of a number of forces. Mostimportantly, the tbrces that operate to create and changethem are:
1. Changes in consumer attitudes towards each of thebrands in the market.
2. The availability of the product as represented by dis-tribution, shelf space, or special displays.
3. The price of the brand relative to other brands.
Symbolically,
where r is the equivalent element in the reaction matrix,the matrix representing the probabilities of changes inpreference toward brands. The entries for this matrix arederived by asking the same consumers on two successiveoccasions for their preferred brand. As in the A matrixthis frequency count of preferences at two time periodscan be percentaged across each row to give the probabilityof preferring the same brand or switching to another.The symbol dj represents the availability in distributionof Brandy. For the moment, if rfj has a value of I equiva-lent to 100 percent distribution, all consumer intentionsconcerning the brand can be executed. A value less thanI would tend to restrict the opportunities for purchasingBrand j . The quantity dj is a constant for the entirecolumn since distribution on average is the same for allconsumers, pj is the ratio of change in probability fromrij to Qij. \i measures the degree to which price changesin Brand j will cause consumers to buy j or switch toother brands. Price surprises in the retail store are proba-bly the main cause of this change. Therefore in a sense,pj is a measure of the effect of price plus other randomdisturbances, e^ is an error component with expectationof zero.
Hence, on the average,
po = (.40 .30 .30),
Pi =
The symbol p is a row vector representing the brandshare preference at a moment in time. It has as manyelements as there are brands, and is similar to a distribu-tion of market brand shares at any point in time. Theproduct of the vector p and the switching Matrix A givesrise to the market brand share vector a. The subscriptsfor p and a refer to the time period.
In matrix notation,
Similarly,
For example, if
P\A = at
and
then = (.42 .31 .27).
Because of the switching Matrix A, the brand sharesoi^ mind are converted in brand shares of market aofavoring Brands 1 and 2.
Altitude Formation
The matrix,
1 ''is ''13 ''' r
R ='"22
''si
is the attitude or predisposition matrix and represents theprobability of consumer preference toward brands shift-ing or remaining fixed. This matrix, like the buyingbehavior matrix, is characterized by large probabilitiesdown the main diagonal. In general, the probability ofconsumer predisposition toward a brimd changing overshort periods is small.
The product of the brand share preference vector pand the R matrix gives rise to brand share preference inthe next period.
Pi,R = pi
plR ^ P2
Under stable market conditions it is anticipated that Rwould remain constant. However, the interesting situa-tion is that in which R changes for a variety of marketingreasons.
The Effect of Advertising
When y?o, the preference matrix in period zero, isdifferent from Ri, the preference matrix in period I, weintroduce a causative Matrix C such that:
RiCi = R2.
While the value of C cannot be measured directly, it canbe derived from the above relationship, namely:
c = R,r'/?i
where RIT^ is the inverse of Ri,. (The inverse operationin matrix algebra is equivalent to division in algebra.)The causative Matrix C is a measure of the etTectivenessof the marketing innovation which caused Ro to change

262 JOURNAL OF MARKETING RESEARCH, AUGUST 1965
to Ri . Most typically this would be due to new advertis-ing eflort, though it could also come about throughproduct improvement or other marketing innovations.
Since the elliciency of advertising effort will vary withthe quality o\' the copy, media plans, and total expendi-tures, it is unreasonable to expect that a simple directrelationship will exist. While the effect of a campaigncan be observed through the elements of the C matrix,it is possible to relate advertising effort to the caLisativematrix by means of the following equations:
Where Cj is theyth column of the C matrix, (/Ji a • • • n)is a vector of advertising expenditures and K\ K- etc.,are matrices of regression coellicients relating the ad-vertising expenditures to the columns of the C matrix.The 7th superscript of K' relates to the /th column of C.
ln expanded notation the equations would appear asfollows:
C21
[kl^ •-• k'-
etc.
Each of the K> coefTicient matrices can be estimatedby standard regression methods. The C, column of theC matrix represents the rate at which consumer attitudesare shifting to the /th brand, or in the case of the cjjterm the rate of improvement in loyalty to the./th brand.Hence, the K' matrix is a measure of how advertisingexpenditures bring about these rates of change in attitudefor theyth brand.
Some Additional Relationships
Using various elements of this model, several relation-ships can be derived by algebraic manipulation. Since
(0(2)
Also
(3)
PiA =
Substituting Equation (3) in Equation (2) we have
(4) poRA = ai .
Further,
(5) pi/? = p2 and P2A = a2.
By the same reasoning it follows that
(6) piRA = aa,
and
(7) poRRA = aa,
Or in general
(8) at = paR'A.
This implies that if R does not change over time, anychange in share will come from the A matrix, which inturn can he due to distribution or price. The last Equa-tion (8) can be rewritten to provide for changes in theR matrix, namely:
(9)
However,
(10)
(11)
at -
R, =
By substitution in Equation (9) we have the recurrencerelationship:
(12)
and
(13) (R,) (R^QC,)
The last equation suggests that brand share in the cur-rent period t is a function of the cumulative effects ofattitude change modified by market conditions in thecurrent period. With the use of mathematical theoremsfrom matrix algebra, it is possible to draw some inter-esting conclusions about the behavior ol' this system |3| .
Some Useful Theorems
A square matrix is said to have a dominant diagonalif the sums of the elements in each row off the maindiagonal are less than the diagonal terms.
Theorem IIf a Matrix A has a dominant diagonal, A is non-
singular (has an inverse) [6].
Theorem II
If X is an eigenvalue (root) of a Matrix A, then [6],
X I < m = Maxpi
2j-X
for j = 1, 2, «.

A MATHEMATICAL MODEL OF CONSUMER BEHAVIOR 263
Theorem III
Let A be -d n X u matrix. The sequence, A, A-, • • • A"of its powers converges, if and only if each eigenvalueX of A satisfies either [11,
| X | < 1 or X = 1 .
Theorem 1 is necessary to assure that the C matrixcan be computed, since it is derived in part from theinverse ofthe R matrix. As can be seen from the empiricaldata to follow, both the A and R matrices are charac-terized by dominant diagonals. In all of our survey in-vestigations we have never found an R matrix without adominant diagonal. Theorems II and 111 are concernedwith the behavior of the system. Theorem II places anupper bound on the value of the roots of the matrix, wbileTheorem III indicates if the system is convergent or not.
Some Analytical Conehisions
Using these theorems, some obvious and less obviousconclusions can be drawn about the behavior of thismarketing system on the basis of Equations (9), (12), and(13).
1. If ^ is constant and A is known, then co (brand share)can be estimated. Furthermore, if «,_i (brand share in period/ - ]) is diiferent from a, , the change must be due to A.
2. If R changes such that C is a constant with eigenvaluesless than 1. a, (brand share) will be dependent on the limit-ing vectors of C and A. The system tends toward equilibriumwith brand shares approaching the steady state.
3. If R changes such that C is a constant with eigenvaluesgreater than 1, the system is not likely to persist. Changes inR are likely to force the system back toward equilibriumThe consequence of C with roots greater than 1 is that one ormore brands will absorb the entire market.
4. If R changes such that C changes but the eigenvalues ofC are less than 1, the system can continue indefinitely, fluc-tuating around an equilibrium.
The conclusions given above provide the boundaryconditions for the system, or tbe likelihood that observedchanges can continue or not.
EXAMPLES
A series of examples of convergent and divergent casesare given in this section to suggest in trivial two-brandsituations, how the system would appear numerically.Following that is a real situation with purchase, attitudeand causative matrices.
Example I—Convergence
The predisposition or attitude matrices for period 0and 1 are:
.ll .23 .70 .30
) [\.4O .60/ \.4O .60/
The loyalty level for the first brand has declined from
.77 to .70, while attitudes for the second brand haveremained constant.
The inverse of Rt, is:
/ 1.62 - . 6 2 \
-1.08 2.08/.
Using the relationship:
C -
we find that:
C ='.89 . i r
,.08 .92/,
and has eigenvalues of:
= I, .811.
If the system were to continue for some length of timewith the same C matrix values, the system will convergetoward a division of brand share between the two brands,assuming that the A matrix is constant. This convergenceto a given share distribution is indicated by the eigen-values of C which are both equal to or less than one. Ineffect the magnitudes of the eigenvalues are a meastircof the stability of the system. The values oi' the maindiagonal terms of C determine the speed of convergence.In this case, if they were closer to I, it would indicatethat tbe system was almost at a point of stability.
Example 2—Convergence
The predisposition matrices for time periods zero andone are:
.88 .12
\.4O .60
The inverse of i?o is:
.80 .20
.4O .60
and
C =
with eigenvalues:
= 1,.832.
This case is similar to the first. However, the two casesdiffer in their rate of convergence; X = .832 in Example 2being larger than X = .811 in Example 1 indicates asomewhat slower rate of convergence. This is also re-flected in the main diagonal terms of the C matrices.

264 JOURNAL OF MARKETING RESEARCH, AUGUST 1965
E.xample 3—Divergence
By contrast, let us consider the predisposition matrices:
/.70 .30\ /.77 .23\
[ \ [,.40 .60, ,.40 .60;
In this situation the first brand is improving its attitudeloyalty as measured by the increase from .70 to .77 wbilethe situation remains unchanged for the second brand.
The inverse of Ro is:
/ 2.0 - 1 . 0 \
-1.33 2.33,
and
C =
The eigenvalues are:
X - I, 1.232.
If the forces at work in this system continue to operate,producing the above C matrix and related eigenvalues,we can state by Theorem 111 that the system will diverge.The C matrix describes the rate of change of the Rmatrices. Successive multiplications of the C matrix wilicause the main diagonal terms to grow in value.
However, the term in the upper left hand corner ofthe matrix will increase at a greater rate than the otherdiagonal term, indicating the dominance of the firstbrand. In effect, if the condition were to persist, the firstbrand would have 100 percent of the market. Since inmost market situations, this is unlikely, we can anticipatethat the growth pattern ofthe first brand, as representedby the increased loyalty, must slow up and even stopdue to internal resistance within the market.
Example 4—Divergence
The predisposition matrices are:
/.70 .30\ /.77 .23\
\.4O .60/ ' \.U .66/
The inverse of R^ is:
and
D —1 Di\Q I\\ -
with eigenvalues:
X = I, 1.432.
The eigenvalue of 1.432 indicates that this divergent case
is more volatile than the previous one. A major struggleis in process between the two brands. The brand loyaltiesare increasing and each brand is attempting to becomean absorbing brand, with Brand 2 having a slight advan-tage.
An Actual Product
Tables 1, 2, 3, 4, give the purchase matrix, predisposi-tion matrices and causative (C) matrices for an actualproduct category. It is interesting to note that the atti-tudes loyalties are typically higher than the purchaseloyalties. As pointed out earlier, the purchase loyaltiesare frequently depressed by promotions and price sur-prises.
Brand
ABCDE
A
,80.11.06,03.04
TablePURCHASE
B
.08
.78
.09
.04
.06
1MATRIX
C
.07
.05
.73
.02
.05
D
.01
.03
.07
.81
.11
E
.04
.03
.05
.10
.74
Table 2AniTUDE CHANGE MATRIX AT TIME /
Brand
ABCDE
Brand
ABC0E
Brand
ABCDE
A
.85
.09
.07
.03
.05
AHITUDE
A
.90
.11
.10
.05
.07
A
1.06.02.03.02.02
B
.08
.82
.09
.04
.06
Table
C
.05
.04
.74
.01
.05
3
CHANGE MATRIX AT
B
.05
.81
.08
.03
.04
TableCAUSATIVE
B
- . 0 3.99
- . 01- .01- . 0 2
c.03.03.73.01.06
4MATRIX"
C
.03
.01
.99
.00
.01
D
.01
.03
.06
.83
.12
TIME /+1
D
.01
.03
.05
.83
.11
D
.00
.00-.011.00-.01
E
.01
.02
.04
.09
.72
E
.01
.02
.04
.08
.72
E
.00
.00
.00- . 0 11,00
Derived from Tables 2 and 3.

A MATHEMATICAL MODEL OF CONSUMER BEHAVIOR
Consumers in this situation were exposed to a newadvertising campaign, resulting in an improvement forBrand A. This in turn is reflected in the C matrix withBrand A having a main diagonal term in excess of one.While Brand A is improving its position, the rate ofimprovement is small as reflected in the value of 1.06 ofthe C matrix. Over short periods of time this would haveonly moderate effects on its brand share.
REFERENCES
1 Gcraki Dcbreu, and I. N. Hersleiti, ''Noiinegative SquareMatrices," Economeiriciu. 21, No. 4 {October 1953), 597-607.
265
2. William Feller, An Ininntitciion ro Prabubility Theory anil ti.\Applications, Vol. 1 (2nd ed.) New York; John Wiley and Sons.Inc., 1957.
?. F. R. Gantmacher. T/if Theory of Matrices, Vol. 2, New York:Chelsea Publishing Company. 195V.
4. Frank Harary.and Benjamin Lipslein, "The Dynamics ol" BrandLoyalty: A Markovian Approach," Operations Research. HI. 1(February 1962). 19-40.
5. Benjamin Lipstein, "The Dynamics ol" Brand Loyally andBrand Switching," Proceeitings of the Fijih Annual Conferenceof ihe Advertising Resetirch Founditlion 1959. 101-8.
6. Lionel McKen/Je, "Matrices with Dominant Diagonals andEconomic Theory," Muiheniciiical Melhoil.s in ilw .Social Scien-ces. K. J. Arrow. S. Marlin and I*. Supties eds.. Stanford. CaliT:.Stanford University Press, i960, 47-62.
Reprints of all articles in this issue are available (as long as supply lasts) at the
Eollowiug prices:
Single reprint $ 1.00
Two reprints 1.50
Three reprints 1.80
Four to 99, each $ .50
First 100 40.00
Additional lOO's 20.00
Covers are available on orders of 100 or more at a surcharge of 15 percent.
Special prices are available for large quantities.
Send your order to:
AMERICAN MARKETING ASSOCIATION230 North Michigan Avenue
Chicago, Illinois 60601
Duplication, reprinting, or republication of any portion of the JOURNAL OF
MARKETING RESEARCH is strictly prohibited unless the written consent of
the American Marketing Association is first obtained.
