a mechanistic design for thin-bonded concrete … · performing organization n-e and addrou 10. ......
TRANSCRIPT

TECHNICAL REPORT ST ANOARO TITLE PACE
1. Report No. 2. Government Aceenlon No. 3. Recipient' • Cotolov No.
FHWA/TX-88+457-3
4. Title ond Subtitle 5. Report Dolo
A MECHANISTIC DESIGN FOR THIN-BONDED September 1987 CONCRETE OVERLAY PAVEMENTS 6. Performing Or;oniaoticm Code
7. Authors) B. Porformin; Or;oniaotion Report No. Moussa Bagate, B. Frank McCullough,
457-3 and David W. Fowler Research Report
9. Performing Organization N-e and Addrou 10. Worlr Unit No.
Center for Transportation Research The University of Texas at Austin
11. Conlroct or Grant No.
Austin, Texas 78712-1075 Research Study 3-8-86-457 13. Typo of Report ond Period Covered
12. Sponaori119 Ago11cy N-• and Addrou Interim Texas State Department of Highways andPPublic
Transportation; Transportation Planning Division P. o. Box 5051 14. Sponsoring Ago11cy Code Austin, Texas 78763-5051 15. Supplementary Notu
Study conducted in cooperation with the U. s. Department of Transportation, Federal Highway Administration
Research Study Title: "Thin-Bonded Overlay Implementation" 16. Abatroct
This report is concerned with the design of concrete overlays of old concrete pavements with some remaining fatigue life considering three criteria: (1) wheel load stresses; (2) volume change stresses; (3) interface bond stresses. The finite element method is used for the wheel load stresses and accounts for a more precise modeling of continuously reinforced concrete pavements, jointed reinforced concrete pavements, and jointed concrete pavements with various loading configurations: at edge, at joint, and at cracks.
A computer program is presented which performs the required structural analysis using ANSI standard Fortran 77 language and is fully compatible with CDC 170/75 and IBM 3081 hardwares. The structural design has been verified and calibrated using field data from a recently completed thin-bonded concrete overlay (TBCO) experimental project on South IH-610 in Houston.
Final design and construction recommendations are made based on this, and previous studies. The design method developed in this study should assist the Texas State Department of Highways and Public Transportation.
17. Koy Warda 18. Oiatrlbutlon Stot-ent
concrete overlay, pavement, fatigue No restrictions. This document is life, thin- bonded, finite element available to the public through the method, wheel load stresses, volume National Technical Information Service, change stresses, interface bond Springfield, Virginia 22161.
19. Security Clouif. (of lltla repott) 210. Security Clo .. lf. (of thia , ... 1 21. No. of P ogoa 22. Price
Unclassified Unclassified 70
Form DOT F 1700.7 ••·atl

A MECHANISTIC DESIGN FOR THIN-BONDED CONCRETE OVERLAY PAVEMENTS
by
Moussa Bagate B. Frank McCullough
David W. Fowler
Research Report 457-3
Thin-Bonded Overlay Implementation
Research Project 3-8-86-457
conducted for
Texas State Department of Highways and Public Transportation
in cooperation with the
U.S. Department of Transportation Federal Highway Administration
by the
Center for Transportation Research
Bureau of Engineering Research
The University of Texas at Austin
September 1987

The contents of this report reflect the views of the authors, who are responsible for the facts and the accuracy of the data presented herein. The contents do not necessarily reflect the official views or policies of the Federal Highway Administration. This report does not constitute a standard, specification, or regulation.
11

PREFACE
This report was developed from research conducted under project 357, "Thin-Bonded Concrete Overlays," and project 457, "Implementation of Thin-Bonded Concrete Overlays." These two projects have been conducted by the Center for Transportation Research, The University of Texas at Austin, for the Texas State Department of Highways and Public Transportation in cooperation with the Federal Highway Administration. The contributions and support of these institutions are gratefully acknowledged.
iii

LIST OF REPORTS
Report 457-1, "Preliminary Design of a Testing Facility to Subject Full Scale Pavement Sections to Static and Cyclic Loading," by Mark D. Wickham, B. Frank McCullough and D. W. Fowler, defines the problems and presents possible solutions for the design of a testing facility to cyclicly load full scale pavement sections.
Report 457-2, "A Laboratory Study of the Fatigue of Bonded PCC Overlays," by Karen Reilley, Chhote Saraf, B. Frank McCullough, and D. W. Fowler, presents the findings of laboratory fatigue experiments which simulate the field conditions ofiH-610 in Houston, Texas.
Report 457-3, "A Mechanistic Design for Thin-Bonded Concrete Overlay Pavements," by Moussa Bagate, and B. Frank McCullough, and David W. Fowler, presents a detailed procedure which can be used by the Texas SDHPT to design bonded concrete overlays of original jointed concrete pavements or continuously reinforced concrete pavements. The procedure utilizes the fmite element method and field data for the structural analysis.
iv

ABSTRACT
This report is concerned with the design of concrete overlays of old concrete pavements with some remaining fatigue life considering three criteria: (I) wheel load stresses; (2) volume change stresses; (3) interface bond stresses. The fmite element method is used for the wheel load stresses and accounts for a more precise modeling of continuously reinforced concrete pavements, jointed reinforced concrete pavements, and jointed concrete pavements with various loading configurations: at edge, at joint, and at cracks.
A computer program is presented which performs the required structural analysis using ANSI standard Fortran 77 language and is fully compatible with CDC 17on5 and IBM 3081 hardwares. The structural design has been verified and calibrated using field data from a recently completed thin-bonded concrete overlay (TBCO) experimental project on South IH-610 in Houston.
Final design and construction recommendations are made based on this, and previous studies. The design method developed in this study should assist the Texas State Department of Highways and Public Transportation.
v
SUMMARY
A mechanistic design method for bonded concrete overlay pavements used as a rehabilitation alternative for original Portland cement concrete pavements is proposed in this report. The method is intended to apply primarily at the project management level of the existing highway network in Texas.
The need for such a method is becoming acute since the emergence of bonded concrete overlays as a viable means to rehabilitate rigid pavements. Many construction projects have now been completed across the United States and many more are under construction. In general, designers of these projects rely heavily on methods which were developed for original pavements or conditions for the rigid overlay which may or may not be the same. In addition, other specific problems, such as those occurring at the interface of the two layers, are seldom adequately addressed.
The proposed method takes as its starting point a recently completed experimental bonded concrete overlay project on South IH-610 in Houston; it uses up-to-date tools available in the pavement engineering field to address structural design. These two aspects are implemented for the most part within the computer programs, TBCOL A detailed statistical analysis of shear strength data obtained from concrete cores taken on two projects in Houston (where two different surface preparation techniques were used) is conducted to assess the bonding condition at the interface and to formulate measures to evaluate the adequacy of the bond.
Finally, a framework is presented for understanding and studying reflection cracking and volume change stresses of bonded concrete overlays of rigid pavements.
The method does not seek to be defmitive on the subject and, indeed, should be added to and upgraded when field data from ongoing construction projects, research, and laboratory work become available. However, it is hoped that the methodology used and the presentation of the various aspects studied and discussed will provide valuable information for those people and agencies interested in the use of bonded concrete overlay pavements as an alternative for rehabilitating rigid pavements.
vi

IMPLEMENTATION STATEMENT
The results emanating from this study which are recommended for implementation include the following:
(1) TBCOl should be used as a design and analysis tool for when conditions (pavement suppon and traffic loading) are similar to those prevailing on South Loop 610 in Houston, Texas.
(2) Based on three years of testing concrete cores at the Center for bonded CRC overlays of CRCP interface shear (i.e., bond strength), adequacy of bond can be specified in either one of two ways: (a) as a percentage between 50 and 100 percent of shear strength calculated from the paving concrete mix
(overlay or original pavement) using ACI relations or (b) as a safety factor of 3.0 or better under the worst horizontal shear conditions anticipated in the field.
(3) A good bond is obtained as a result of proper construction practice and use of a good bonding agent; therefore the bond will develop and endure if (a) the surface of the original pavement is rough and clean and (b) the bonding agent used (e.g., cement grout) is thoroughly applied and covered promptly with the overlay
concrete mix.
These considerations should be implemented during field construction of bonded concrete overlay.
vii

TABLE OF CONTENTS
PREFACE............................................................................................................................................. iii
LIST OF REPORTS ............................................................................................................................... iv
ABSTRACT .......................................................................................................................................... v
SUMMARY .......................................................................................................................................... vi
IMPLEMENTATION STATEMENT .......................................................................................................... vii
CHAPTER!. ~ODUCTION
BACKGROUND............................................................................................................................... 1
Concrete Pavement Types and Design Considerations......................................................................... 1
Terminology .. . . .. .. .... .... .. ... . .... .. . . ... .. .... .. .. .. .... . . .. .... .. ......... .... . . .. .. .... .... .. ... .... .... . . . . .. .... . ... ............. 2
IN1EGRATION OF THE METHODOLOGY IN THE OVERALL PAVEMENT
MANAGEMENT SYSTEM................................................................................................................ 3
OBJECTIVES OF THE STUDY .......................................................................................................... 3
SCOPE AND ORGANIZATION OF THE REPORT ............................................................................... 4
CHAPTER 2. CURRENT DESIGN PRACTICES FOR THE REHABILITATION OF RIGID PAVEMENTS
GENERAL CONSIDERATIONS......................................................................................................... 6
CORPS OF ENGINEERS/FAA RIGID OVERLAY DESIGN................................................................... 6 THE AMERICAN ASSOCIATION OF STATE HIGHWAY AND TRANSPORTATION
OFFICIALS (AASHTO) GUIDE METHOD .... .. . . .... .. .. .... . . ......... .... . . .. .. .. . ...... .. .. .. .. .. .. .. . .. .. .. ...... ...... ... .. . . 8 PORTLAND CEMENT ASSOCIATION METIIOD . .. .. .. .. .. . . .. .... . .. .... .... .. . . .. .. ... .. .... .... .... ... .. .. . . .. . . ........... 8 THE NEW PCA DESIGN PROCEDURE (REF 25)................................................................................ 9 FHW A/TEXAS RIGID OVERLAY DESIGNS ....................................................................................... 10
SUMMARY AND DISCUSSION OF DESIGN PRACTICES .................................................................. 12
CHAPTER 3. DESIGN AGAINST WHEEL LOAD STRESSES
MATHEMATICAL MODELS FOR THE DETERMINATION OFPA VEMENT
RESPONSE PARAMETERS ............................................................................................................. 13 COMPARISON OF VARIOUS ALGORIT.HMS .................................................................................... 13
STRUCTURAL DESIGN ................................................................................................................... 15 CRACK MODELLING ...................................................................................................................... 16
COMPUTER PROGRAM TBC01 ...................................................................................................... 20
CHAPTER 4. DESIGN AGAINST VOLUME CHANGE STRESSES
REFLECTION CRACKING ANALYSIS .............................................................................................. 21
Horizontal Movement .................................................................................................................. 21
Vertical Movement ...................................................................................................................... 22
Data Need .................................................................................................................................. 22
BOND STRESS ANALYSIS .............................................................................................................. 22
Horizontal Movement .................................................................................................................. 22
Vertical Movement-- Peeling Off Effect .......................................................................................... 22
Data Need .................................................................................................................................. 23
SUMMARY .................................................................................................................................... 23
viii

CHAPTER 5. DESIGN AGAINST DEBONDING
INTERFACE SHEAR DUE TO 1RANSVERSE LOADING .................................................................... 24 INTERFACE SHEAR DUE TO BRAKING TIRES OR SNOW REMOVAL EQUIPMENT ........................... 25 NATURE OF THE BOND .................................................................................................................. 29
Chemical Properties ..................................................................................................................... 29 Mechanical Properties .................................................................................................................. 30
INTERFACE SHEAR MEASUREMENTS IN THE LABORATORY ........................................................ 31 Background on TBCO Construction in Harris County. Texas ............................................................... 31 Coring and Testing Methods .......................................................................................................... 31 Laboratory Results ...................................................................................................................... 32
ADEQUACY OF MEASURED BOND S1RENGTH AND DEVELOPMENT OF A SAFETY FACTOR ........ 34 Adequacy of Measured Bond Slrengths ............................................................................................. 34 Development of a Safety Factor ..................................................................................................... 37
SUMMARY OF BOND STRESSES .................................................................................................... 37
CHAP1ER 6. DISCUSSION OF RESULTS
COMPARISON WITH PREVIOUS PCC OVERLAY DESIGN METHODS ............................................... 38 ENVIRONMENTAL EFFECTS .......................................................................................................... 38 REFLECTION CRACKING ............................................................................................................... 38 INTERFACE BOND CONDffiON .................................................. :: .................................................. 39 NEED FOR AND TIMELINESS OF TBCO PAVEMENTS ..................................................................... 39
CHAPTER 7. CONCLUSIONS AND RECOMMENDATIONS
CONCLUSIONS .............................................................................................................................. 41 RECOMMENDATIONS .................................................................................................................... 42
REFERENCES ...................................................................................................................................... 43
APPENDICES
APPENDIX A. CONCEPTS OF THE FINI1E ELEMENT METHOD AND ITS IMPLEMENTATION IN COMPUTER PROGRAM I SLAB ...................................... 49
APPENDIX B. SAMPLE INPUT AND OUTPUT OF PROGRAM I SLAB .............................................. 55 APPENDIX C. PAVEMENT SURFACE DEFLECTION DATA ACQUISffiON USING
THE DYNAFLECT DEVICE, AND OPERATIONAL MODE USED AT THE SOUTH LOOP 610 EXPERIMENTAL TBCO SITE ................................................ 57
ix

CHAPTER 1. INTRODUCTION
BACKGROUND This report is concerned with defining a methodology for designing and for assessing the need and timeliness of a thin
bonded concrete overlay (TBCO) pavement on a continuously reinforced concrete pavement (CRCP), a jointed reinforced concrete pavement (JRCP), or a jointed concrete pavement (JCP) as a rehabilitation alternative. The introductory chapter provides the background to the problem, defmes the basic pavement terminology which will be used throughout, and then states the objectives and scope of the report In closing, a flow diagram showing the various steps involved in arriving at a final design of TBCO pavements is presented; these steps are developed segmentally in the report.
Concrete Pavement Types and Design Considerations Concrete pavements have been used in the United States since the turn of the century to carry vehicular traffic (Ref 1 ).
Initially, pavement engineers experimented with plain portland cement concrete, but it soon became apparent that environmental stresses and, particularly, temperature induced stresses needed to be accounted for in order to mitigate cracking, spalling, and rapid deterioration of exposed concrete on the roadways. Transverse joints and distributed steel to control temperature induced stresses were soon introduced. Jointed concrete pavements came into being in an effort to allow unrestrained contraction and expansion of the concrete. With the appearance of transverse joints, however, came a number of distress manifestations: intrusion of water into the pavement layers, which caused erosion and accelerated degradation; and intrusion of incompressibles, which soon annulled the function of the joint (i.e., allowing free end movement). Of necessity, many jointing practices emerged for sealing joints with asphaltic or plastic (e.g., neoprene) materials.
The inclusion of joints also brought structural weakness to pavement structures at the joints. Thus, various load transfer devices were invented in an attempt to distribute wheel load stresses between adjacent concrete slabs across the joints. In this regard, smooth round dowel bars were found most effective and are now in widespread use.
Still, "perfect" joints eluded researchers and practitioners for many years (Ref2). It is the inability of pavement engineers to find a perfect joint. one which would have good load transfer and which would still allow for free end movement. which prompted the question, "Why not eliminate transverse joints?"
Continuously reinforced concrete pavement is a direct result of this basic idea: a joint free concrete pavement that could sustain wheel load and temperature stresses over a given design period. Of note is a similar development in the rail industry, which, after grappling for many years with rail joints, now uses long welded rails for high speed and comfort
Rigid (concrete} pavements are particularly appropriate when resistance to wear and tear due to a high level and intensity of vehicular traffic, resistance to abrasion caused by studded tires, resistance to disintegration caused by fuel spillage, and low maintenance throughout the useful life of the pavements are all desired features. Concrete in the hardened state is a sturdy material well suited for carrying heavy and repetitive loads. As such, it has gained increased popularity as a construction material in many other public works projects. These advantages are somewhat counterbalanced by a higher initial cost than for asphalt and a more complex construction process.
However, the use of concrete pavements has steadily increased throughout the years (Ref 3). Most of these pavements were built with a theoretical 20-year design life and in many cases have outlived this period. If properly designed and constructed, concrete pavements will serve the users for 30 to 40 years at an acceptable level of serviceability with relatively low maintenance (Refs 4, 5, and 6). Such pavements are reported to be still in service even though increased maintenance and repair have now become necessary. Thus, consideration must be given at present to finding some form of rehabilitation that will make use of the remaining structural life of the rigid pavements with minimal disruption to the traveling public in terms of duration and number of occurrences. To this end, an overlay pavement will normally be used. It seems reasonable to rehabilitate a concrete pavement with a concrete overlay because of thermal and structural compatibility. However, this has not been the case in the past Instead, asphalt overlays of rigid pavements have been used quite extensively. Only in recent years was there serious consideration of using a relatively thin (i.e., 2 to 5-inch-thick) layer of portland cement concrete (PCC) properly bonded to the original PCC pavement as a rehabilitation alternative. This change came about due to a number of developments:
(1} availability of new and more efficient construction equipment (paver, cold milling machines, etc.), (2) surge of new construction materials and concrete additives, and (3) selection of rehabilitation schemes based on life-cycle costing.
These developments have led directly to the implementation of a number of thin-bonded concrete overlay projects in the field. States where TBCOs have now been built include Iowa (Green, Black Hawk, Clayton, Woodbury, and Pottawattamie counties), New York (IH-81, north of Syracuse), Louisiana (US-61, north of Baton Rouge), California (Route 80, in Nevada
I

2
county), and Texas (North and South IH-610, Houston). It is the intent of a TBCO to fully utilize the remaining load-carrying capacity of the old and cracked, but otherwise structurally adequate, original pavements. To fulfill this intent, appropriate steps must be taken to achieve a strong and durable bond between original PCC pavements and TBCO. Three main bonding agents have been used with success in experimental TBCOs (I) water-cement-sand grout, (2) water-cement grout, and (3) epoxy resin, in order of increasing unit cost. In conjunction with these bonding agents, surface preparation has ranged from cleaning (sandblasting, water blasting, air blasting) to rotomilling (1/4 inch off the surface of the original pavement), steel shot blasting (1/8-inch depth) and acid etching. Experience has proven that good surface preparation was paramount to the success of TBCOs (Ref 7).
As regards the overlay itself, it may or may not be reinforced. After a TBCO is placed on an original concrete pavement, the new pavement structure becomes a very effective combination for carrying loads safely at a high level of serviceability if the original pavement had not been allowed 1.0 deteriorate excessively before this rehabilitation measure. Also, the placement of a TBCO pavement affords an opportunity for correcting minor surface defects and grading problems and still provides added structural capacity to the original PCC pavements.
For many pavement agencies, there is a considerable potential for cost savings from efficient repair or rehabilitation of old but structurally sound concrete pavements.
Terminology
The basic terms which are used throughout this report are described in the following paragraphs. Rigid Pavement. The term is used 1.0 designate a pavement structure in which the upper portion or wearing course is made
ofPortlandcementconcrete (PCC). Although Portland cement can be used to stabilize the lower, underlying layers, the top riding layer or the main load-carrying layer must be made ofPCC for the pavement to qualify as rigid. Pavements where the load-carrying PCC layer is not the top riding layer (i.e., thin asphalt overlaid PCC pavements) are referred 1.0 as composite pavements. Rigid pavements distribute the wheclloads in bending.
Maintenance. Maintenance of pavements includes all the activities concerned with keeping the pavements safe and operational (i.e., passable). Maintenance can be both preventive and corrective.
It is usually carried out routinely and begins soon after the pavement is opened to vehicular traffic. Maintenance is not a sign of failure. It is implicit in most design methods.
Rehabilitation. Rehabilitation is a process whereby the existing condition of a pavement is significantly improved, usually by a major alteration of the pavement structure. This is in sharp contrast to (routine) maintenance. Basically, pavement rehabilitation refers 1.0 one of the following or a combination thereof:
(1) complete reconstruction, (2) overlays, and (3) recycling.
The need for rehabilitation appears when one or more of the following has occurred:
(1) the pavement has failed; i.e., reached a minimum acceptable level of service, but has not lost its structural integrity (the latter case requires reconstruction);
(2) the pavement has served its service life and is simply fatigued or worn out; (3) the increased cost of maintenance makes rehabilitation a viable alternative; and (4) the traffic projection is far below the current level or intensity and, therefore, the pavement structure is deteriorating
faster than anticipated. In order to protect the initial investment, a measure of rehabilitation is needed to upgrade the pavement structure.
However, failure is the major cause for rehabilitation. Failure. There are two broad categories of pavement failures: functional failure and structural failure. Functional failure
is reached when the pavement can no longer adequately serve its function as a smooth riding surface for the traffic imposed on it. The users of the pavement are mostly concerned with this type of failure.
Structural failure is reached when the pavement has lost its anticipated load-carrying capacity. The pavement engineer is mostly concerned with this type of failure because it will normally lead to functional failure even though the converse is not necessarily true (e.g., in rigid pavements, punch outs result in a loss of serviceability, but increased surface roughness does not necessarily lead 1.0 punchouts).
System. A system can be defined as a set of regularly interacting and interdependent items unified in a whole. The purpose of a devised system is to accomplish an "operational process" (Ref 8). A deterministic system produces the same output any number of times when operated upon by a given set of input In the development of a system, component compatibility and goal compromise are necessary.

3
Pavement Management Systems. Briefly, a pavement management system (PMS) involves those activities concerned with providing the best possible pavement at the least cost to the public. It operates at two levels: the network level and the project level. The feedback of information is an essential partofPMS: research is conducted on actual past data and the results are fed into all future activities, including design, construction, and maintenance.
Thin-Bonded Concrete Overlays (TBCOs). The term as used in this report refers to Portland cement concrete overlay pavements, 2 to 5 inches thick, used on top of an original portland cement concrete pavement. The overlay pavement is designed and constructed to be adequately bonded to the underlying original pavement.
Original Pavement. The pavement that existed before the time of overlay placement. The term is preferred to "existing" pavement because a year or so after overlay placement (when both pavements have been existing) the latter term may be confusing.
Interface. Refers to the weakened "plane" that separates the original PCC pavement from the TBCO. The interface may not be a plane in the geometric sense, but, conceivably, it is the continuum which provides a transition between the two concrete layers.
Bond. Bond is obtained by appropriate steps. The existence of a bond insures that continuity is achieved between the two concrete layers and that strains at the bottom of TBCOs are the same as strains on top of the original PCC pavement
Bonding Agent. A bonding agent is a derived product or natural material used to insure that the TBCO pavement will adhere to the original PCC pavement, for example, water-cement grout, water-cement-sand grout, or epoxy resin. This term is preferred to "bonding medium", which seems inappropriate for this application because "medium" does not carry the meaning or use of a bonding agent.
Bonding Admixture. May or may not be included in the bonding agent. A water-reducing plasticizer (e.g., DaraweldC) is considered a bonding admixture. Literally, it is mixed in to create a better bond.
INTEGRATION OF THE METHODOLOGY IN THE OVERALL PAVEMENT MANAGEMENT SYSTEM
Pavement Management is a recent technique developed to assist pavement engineers in carrying out their duties to provide pavements of acceptable level of serviceability to the traveling public at a minimum overall cost (Refs 9, 10, and 11). PMS utilizes systems engineering, which in tum encompasses the systems concept/approach and systems analysis.
Two general levels of PMS can be distinguished:
(1) project level and (2) network level.
At the project level, PMS is concerned with designing, communicating the design, implementing, constructing, maintaining, monitoring, evaluating, and rehabilitating a pavement section to provide for the required performance.
At the network level, PMS is concerned with planning, budgeting, funding, designing, constructing, monitoring, maintaining, and rehabilitating the pavement system to provide maximum benefit from available funds.
The methodology developed in this report applies primarily at the project level in the pavement management process. There is a constant flow of information between the two levels ofPMS through a data bank which constitutes an essential
part of the system. The total PMS is an ideal state which can be reached only by successive and progressive implementations of the
methodology. Currently, there is no integral working system in the pavement field, but important strides have now been made by Arizona at the network level (Ref 12) and in Texas. Working systems implemented in Texas at the project management level include Flexible Pavement System, FPS; Rigid Pavement System, RPS; Systems Analysis Method for Pavements, SAMP; Rigid Pavement Overlay Design, RPOD; and Rigid Pavements Rehabilitation Design System, RPRDS; they have been amply documented in Refs 13 through 17. These methodologies in the form of computer programs were essential tools in the design and rehabilitation processes during the past two decades.
The approach adopted in this report includes recent developments in the field of concrete pavement technology and can be integrated as a subsystem in RPOD or RPRDS. It extends the scope and completes the picture with more accurate information and modeling of the physical problems involved in the design and construction of concrete overlays of existing concrete pavements.
OBJECTIVES OF THE STUDY
This study is primarily concerned with a design methodology for thin-bonded concrete overlay pavements. Prior research on TBCO was conducted under Project 357 at the Center for Transportation Research, The University of Texas at Austin (Refs 18 and 19). Valuable information has been collected and disseminated to other interested pavement agencies

4
and engineers. Project 357 was mainly concerned with laboratory determination of construction variables, assessment of a field installation on South Interstate Highway 610 in Houston, andanalysisand interpretation of initial performance variables. The project was conducted as part of a cooperative highway research program between the Center for Transportation Research, the Texas State Department of Highways and Public Transportation, and the Federal Highway Administration.
This report is concerned with
(1) identifying significant variables for design of TBCO pavements,
(2) using a mechanistic approach for the design of TBCO pavements,
(3) determining the criteria for selection of TBCO pavements at the project level of a PMS,
(4) assessing the timeliness ofTBCO pavements,
(5) evaluating design and construction methods currently used, and
(6) estimating probable performance in the field.
SCOPE AND ORGANIZATION OF THE REPORT The primary focus of the report is on pavements carrying high traffic volumes. Such pavements are usually made of
concrete, and built to the highest standards (i.e., heavy-duty pavements). Therefore, application of a TBCO resurfacing will not usually involve integral widening, and the problems involved with that particular technique are not considered herein. Also, because of the preceding assumption, TBCO inlays and application of a TBCO on an original flexible (asphalt) pavement are not considered. The types of original pavement covered are continuously reinforced concrete pavement, jointed reinforced concrete pavement, and jointed concrete pavement The primary focus of this report is CRCP, however the techniques used are equally applicable to JRC and JC pavements.
This and other design factors with associated levels considered in this study are presented in Table 1.1; because of prior research, loading patterns, layer thicknesses, calibration, and verification of the developed models, the study applies first and
TABLE 1.1. DESIGN FACTORS WITH THEIR ASSOCIATED LEVELS WHICH COULD BE CONSIDERED IN THIS STUDY
Factors
Rehabilitation Alternatives
Overlay Types
Traffic Volume
Facility Types
Original Pavement Types
Notes:
Levels
Overlay Pavements• Recycling Surface Treatments Subsealing
ACP• PCC Plain• PCC Conventionally Reinforced* PCC Fiber*
High* Low
Highway Pavements• Airport Pavements Parking Aprons orLoading Docks
CRCP• JRCP* JCP* ACP
(1) • denotes levels considered in this report. (2) A total of384 combinations can be generated from the
above; not all of them are feasible or relevant to this study
foremost to highway pavements. Nevertheless, the principles and procedures could equally well apply to airport pavements and to original pavements that are flexible (asphalt), perhaps with slight modifications.
The approach selected is mechanistic; advantages and limitations are recognized in Chapter 2, which also reviews current rigid overlay designs for rigid pavements.
Chapter 3 uses a recently developed finite element computer program, JSLAB, to calculate wheel load stresses for a variety of conditions likely to occur in the field.
Chapter 4 is concerned with internal loads induced by temperature and moisture variation, and their effects on TBCO and the original pavements. It also addresses the problem of reflection cracking. Early age shrinkage and thermal stresses are not considered.
Chapter 5 addresses the problems associated with the weakened plane which occurs at the interface ofTBCO and original pavement
Chapter 6 discusses warrants and timeliness of TBCO pavements, expected field performance, and future perspectives.
The concluding chapter summarizes major findings of the study. delineates areas of future research, and makes recommendations to potential users and researchers of TBCO technology.
Finally. the methodology used in this study is presented in Fig 1.1; the steps involved progress sequentially from left to right and correspond to the different chapters of the report. The flow diagram also ties together the information presented herein; therefore, attention to Fig 1.1 is fundamental to understanding the subsequent information.

Review PCC r-0/L Designs Validation Materials &
r- JSLAB Construction
Assessment Requirements
Wheel Load -Stresses
Interface ~ Bond Stress Variability Verification Firal
Volume Computer Desigr & - Change Program - of r- ..... of Structural f- Recommen-Stresses TBC01 Parameters Models
~ dations Refl. Crack.
forTBCO
Field Cores Testing for 1-Bond Tolerable
I - Bond f-
Maximum Stress
Bond Stress -Analysis
Fig 1.1. Flow diagram of the report showing the methodology and various steps involved in arriving at a final design for TBCO pavements.
5

6
CHAPTER 2. CURRENT DESIGN PRACTICES FOR THE REHABILITATION OF RIGID PAVEMENTS
This chapter addresses the rehabilitation of rigid pavements by use of concrete overlays. Many agencies having responsibility for pavements do not design resurfacing of old concrete pavements (i.e., calculate the required thickness) because of economic restrictions, use of standard sections, or lack of design methodology and qualified personnel (Ref20). When design methods exist, they are influenced by local practice or particular conditions and needs of the concerned agencies. As a result, no single overlay design method has gained widespread acceptance. Thus,a cursory examination of a few methods is in order, but ftrst some general considerations are presented.
GENERAL CON SID ERA TIONS
The design of an overlay pavement is similar in many respects to that of the original pavement; however, it must accommodate and somehow account for the existing structure, including concrete slab, subbase, subgrade, shoulder, curbs, and under drains, where these various elements are present. In general, pavement design practices can be categorized as follows (Ref 21):
(1) empirical designs, (2) theoretical designs, and (3) semi-empirical designs.
Empirical designs are based on experience. The selection of construction methods, materials, and thicknesses has proven satisfactory in a particular locale, and pavements constructed with these input have given good performance. The new pavement is, therefore, seen as involving a duplicate of factors that are known to have performed well. Usually, empirical designs are derived from controlled experiments; data collected are analyzed using statistical methods, and relationships are developed to correlate desired output (e.g., pavement serviceability index, cracking, and rut depth) to a given set of input (e.g., material type, thickness, density, strength, and moisture content). Thus, empirical designs codify experience.
Theoretical designs attempt to quantify all factors that are known to have a significant effect on the performance of pavements. Typically, the theory of engineering mechanics is utilized to assess the effects of carrying loads. The derived responses (stress, strain, and deflection) of a pavement structure are used to predict fteld performance. At the present time, no completely theoretical design has emerged in pavement engineering; at some point in the design process, empirical relationships must be used. This will normally occur for example, when immediate responses are related to long term performance (i.e., use of empirically derived fatigue equations.) Thus, theoretical designs are distinguished from empirical designs in pavement engineering in that they use the theory of engineering mechanics coupled with material characterization to account for a broad range of variables which have not necessarily been tested in the field at the time the design is made.
Semi-empirical designs, also called mechanistic designs, stand. midway between these two extremes. They recognize the strengths and weaknesses of the two methods and attempt to take advantage of the strengths. Specifically, these methods recognize that pavement performance cannot be modeled in an entirely deterministic way, but that empirical methods are too limited in their approach and thus cannot safely be extrapolated to new loading conditions or new materials. For the above reasons, these methods are sometimes called "rational designs ...
CORPS OF ENGINEERS/FAA RIGID OVERLAY DESIGN
In 1958, the U. S. Army Corps of Engineers developed procedures which may be used for any rigid overlay design condition; however, these were developed primarily for the design of airport runways and taxiways. The procedures have been adopted by the U.S. Air Force for the design of military airport rigid overlays and by the Federal Aviation Administration for the design of civilian airport rigid overlays among others.
The original Corps of Engineers methods recognize three cases as follows:
(1) bonded overlays, (2) partially-bonded, and (3) unbonded.
Based on the results of accelerated test tracks, the following formulas were derived:
(1) bonded case:
h - h D 0
6

(2) partially bonded case:
ho = (hn 1.4 - Ch/-4)114
(3) unbonded case:
ho = (hn2- Ch.2)112
where
thickness of concrete overlay, h = 0
7
h n = theoretical thickness which would be required if a new pavement were to be built for the current
prevailing conditions (e.g., traffic loadings),
h. c
= =
existing rigid pavement thickness, and a coefficient between 0.35 and 1.00 which takes into account the structural value of the existing pavement. Guidelines are provided to assign values based on the amount of cracking.
Any consistent set of units (e.g., inches and centimeters) may be used in the equations above. In the unbonded case, since the existing and overlay pavements are acting independently of each other, the overlay
thickness calculated is larger than that obtained in the partially bonded case; the thinnest overlay sections result from the bonded case. Although extensively used, the Corps methods of overlay pavement design give only general ranges and guidelines for the C-factor. This qualitative factor attempts to assess the load-carrying capacity of the existing rigid pavements. The selection of C-factors is usually based on engineering judgement and therefore is subject to personal bias. However, the importance of this factor on the overlay thickness is quite significant; this is illustrated in Figs 2.1 through 2.3, which display the relationships for three thicknesses of existing rigid pavement (viz., h. = 6", 8", and 12") and seven thicknesses of pavement that would be required for new conditions.
Digital plots including the spline curve fitting feature provide insight into the sensitivity of the overlay thickness to changes in the C-factor. A measure of this sensitivity is given by the slope of the near-straight-line curves, as follows:
No Bond Partial Bond
[:: = 8" Slope "" -2.89 Slope = 4.57]
h = 6" = 10" -2.08 -3.92 • = 12" -1.65 -3.54
[ :: = 10" 4.32 ~A5]
h. = 8" = 12" -3.22 -5.62
= 15" -2.37 4.89 n
h. = 12" [ hn = 15" -6.48 -9.66]
As can be seen, for a given thickness of existing pavement, h •• the slope decreases with an increase in thickness required for new conditions, hn. In other words, as the pavement deficiency increases and a thicker overlay becomes necessary, the required overlay thickness becomes less sensitive to a variation inC-factor. This applies to both partial-bond and no-bond cases.
Overall, the slopes of the partial bond case are larger in magnitude than the slopes of the no bond case, denoting a greater sensitivity of the partial bond case to a variation inC-factor.
Finally, as existing pavement thickness increases, so do the slopes of the lines and thus, the sensitivity of overlay thickness to unit variation of C-factor.
From this analysis, it can be seen that, for thicker existing pavements and relatively small differences between existing pavement and required pavement thicknesses, every attempt should be made to ascertain more precisely the value of C-factor; for this combination of factors a wrong guess at C-factor will have a major impact on the overlay thickness and this will result in misuse of public funds.
The design equations for partial bond and no bond cases were derived for plain concrete overlays of original plain concrete pavements. Adjustment factors must be used for (1) fibrous concrete, (2) reinforced ccincrete, (3) continuously reinforced concrete, and ( 4) plain concrete overlays where the flexural strengths of the overlays differ from that of the original pavement by 100 psi or more (Ref 4). The adjustment factors are applied to the thickness of existing pavement, h •.

8
.Iii 6
::r: fli (I)
CD c ..¥ (.)
:2 1-> .!9 ... CD > 0
12
11
10
9
8
7
6
5
4
3
............ ............. .............. ---- ........ .............
.............. ..............
................
Legend PB UB hn
............. ......
~~ • ~::. a· • 0 10"
.............. ........
PB • Partialy Bonded Layers ....._
• 0 12" UB • Unbonded Layers
2 ~----~--~----~----~----~----~--0.35 0.45 0.55 0.65 0.75 0.85 0.9!:
Base Pavement Structural Value, C
Fig 2.1. Significance of the C-factor on concrete overlay thickness in the Corps method of PCC overlay design. Existing pavement thickness, h., = 6".
.s; 0
::r: ,; • CD c ..¥ .5:! .s::. 1-
> CIS -.:: CD > 7 0
8
0.35
""" ........ ................
Legend ~ PBUBhn ........ ....._ 41::.10" ........
• O 12" PB • Partialy Bon~ ........ • 0 15" Layers ......_
UB • Unbonded Layers '........_
0.45 0.55 0.85 0.75 0.85 0.95
Base Pavement Structural Value, C
THE AMERICAN ASSOCIATION OF STATEHIGHWAY AND TRANSPORTATION OFFICIALS (AASHTO) GUIDE METHOD
The design of rigid overlays of original rigid pavements is not specifically covered by the Guide; AASHTO uses the Corps method for this purpose. However, the basic AASIITO equation for the design of rigid structures has been extrapolated for this purpose by some designers. For that reason, it is included in this review of available methods.
The AASIITO guide for the design of rigid pavement (i.e., Chapter 3) was revised in 1981 (Ref 22). The design is a semi-empirical method using AASHO Road test data combined with Spangler's equation for protected comers: the number of 18-kip equivalent single axle load {ESAL) repetitions to a terminal serviceability Pt is related to slab and soil parameters. The functional form of the equation is as follows:
W"1•18 = f [D, P
1, Sc .. ' J, E, k]
where
wt-18 = number 18-kip ESAL repeti-tions to Pt for conditions other than road test conditions;
D = concrete slab thickness, inches; pt = terminal serviceability index;
s . = concrete modulus of rupture for • 1{3 point loading, psi;
J = empirical coefficient for load transfer;
E = Young's modulus of concrete slab, psi; and
k = modulus of subgrade reaction, pci.
From this equation, a design concrete slab thickness, D, can be derived; a nomograph is presented in the Guide for this purpose. Conceivably, for new conditions, another thickness, o·, can be determined. The required thickness of overlay for the new condition is then merely o· - D = Do' This methodology has been termed "component-layer analysis" elsewhere (Ref23).
PORTLAND CEMENT ASSOCIATION METHOD
Recently, the Portland Cement Association has developed new procedures for the design of concrete
Fig 2.2. Signlfrcance of the C-factor on concrete overlay thickness in the Corps method of PCC overlay design. Existing pavement thickness h.= 8".

resurfacing and for concrete overlays of asphalt pavements (Ref24).
The design for concrete resurfacing encompasses on bonded and bonded cases. In the unbonded case, the full-depth concrete pavement thickness required for new traffic conditions must first be determined. To this end, the AASHTO procedure or the new PCA method may be used. Other input include design modulus of subgrade reaction (k:-value), concrete flexural strength, and future design traffic. Three nomographs are provided for the determination of required unbonded concrete thickness resurfacing given full depth slab thickness for the new conditions, and the existing concrete pavement thickness. The three nomographs correspond to different distress levels in the existing concrete pavement. The minimum allowable unbonded resurfacing thickness is 6 inches. A special provision is made when tied shoulders are used, resulting in a downward adjustment of one inch in the resurfacing thickness.
In the case of a bonded concrete resurfacing, the normalized tensile stress at the bottom of the existing concrete pavement and bonded resurfacing structure must be less than the normalized tensile stress at the bottom of a full depth concrete pavement required for new traffic loading conditions. The normalization is with respect to concrete flexural stress in either case. Other input to the design are design flexural strength
14
13
12
. 0 11
J:
ui Ill
! 10 .X u
~ >- 9 as ;:: CD > 0 8
7
6
9
Legend
PB UB hn
0 15'
PB • Partlaly Bonded Layers
UB • Unbonded Layers
5~----~--~~--~----~----~----~--0.35 0.45 0.55 0.65 0.75 0.85 0.95
Base Pavement Structural Value, C
and critical tensile stress. A newly developed finite Fig 2.3. Significance of the C-factor on concrete overlay element computer program, JSLAB, is used to deter- thickness in the Corps method ofPCC overlay design. Eristing mine critical stress. The existing concrete pavement is pavement thickness h. = 12 ". characterized as a function of its flexural strength. Three classes are given: 425-475 psi; 476-525 psi; and 526-575 psi.
To determine the required thickness of bonded resurfacing, a design nomograph is available; inputs are full-depth slab thickness required for new conditions, and existing pavement flexural strength class and thickness. A maximum allowable thickness of 5 inches is specified.
THE NEW PCA DESIGN PROCEDURE (REF 25) In the past, the PCA has used two methods for design of concrete pavements (I) a design based on fatigue for highways
and airport pavements and (2) a design based on specific design vehicles for airport pavements. But, recently, new conditions (e.g., tridem loading) and new construction practices (e.g., tied concrete shoulders) have
prompted the development of new procedures. The procedure reviewed here pertains to the design of highway and street pavements after Ref 25.
Four design factors must be considered:
(I) design modulus of rupture (I/3 point loading),
(2) modulus of subgrade/subbase reaction (gross k-value),
(3) loading types and frequencies over design period, and
(4) design period (e.g., 20 years).
The design starts out with a trial thickness of concrete slab; it comprises two separate components: (I) fatigue analysis, and (2) erosion analysis.
The fatigue criteria used by the new PCA design are based on laboratory studies of concrete fatigue properties. Three separate curves are provided for stress ratios (1) less than 0.45, (2) between 0.45 and 0.55, and (3) over 0.55.
Miner's linear damage hypothesis is used to account for mixed traffic. A nomograph is available to the designer for fatigue analysis. ·
10
The erosion analysis is based on measured deflections at the AASHTO Road test. and calculated deflections. A correlation study, incorporating the power variable (i.e., rate of concrete slab work due to a moving load) resulted in an allowable number ofload repetititons for erosion similar to traditional fatigue curves. A nomograph is also available to carry out the required erosion analysis.
In the final PCA new design, either the cumulative fatigue damage or the cumulative erosion damage must not exceed 100 percenl Otherwise, a new concrete thickness must be tried. Note that damages from the two criteria are not added; either criterion may control the design.
Conceptually, the new PCA design procedure could be used to design TBCO of rigid pavements. A component layer analysis as defmed earlier would be applicable. Because the mechanics of such a procedure have been explained previously, no further elaboration is necessary at this point.
FHW AffEXAS RIGID OVERLAY DESIGNS
The original rigid pavement overlay design, designated RPOD-1, was developed by Austin Research Engineers (ARE, Inc.) for the FHW A (Refs 26 and 27). The method has since been revised and adapted for Texas conditions and designated RPOD-2 (Ref 28). Still more recently, the FHW A commissioned a study by Resource International, Inc., resulting in the development of the OAR procedure (Ref 29). In this report, only the Texas procedure is reviewed (Ref 28).
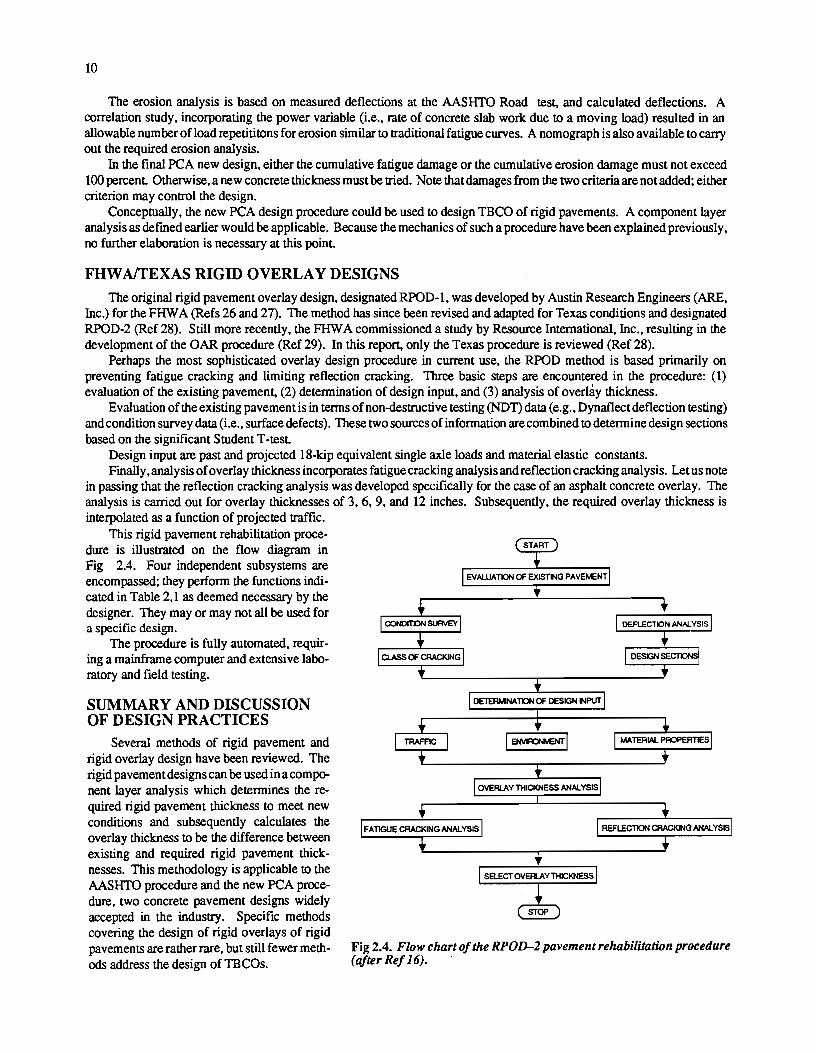
Perhaps the most sophisticated overlay design procedure in current use, the RPOD method is based primarily on preventing fatigue cracking and limiting reflection cracking. Three basic steps are encountered in the procedure: (1) evaluation of the existing pavement. (2) determination of design input, and (3) analysis of overlay thickness.
Evaluation of the existing pavement is in terms of non-destructive testing (NDT) data (e.g., Dynaflect deflection testing) and condition survey data (i.e., surface defects). These two sources of information are combined to determine design sections based on the significant Student T -tesl
Design input are past and projected 18-kip equivalent single axle loads and material elastic constants. Finally, analysis of overlay thickness incorporates fatigue cracking analysis and reflection cracking analysis. Let us note
in passing that the reflection cracking analysis was developed specifically for the case of an asphalt concrete overlay. The analysis is carried out for overlay thicknesses of 3, 6, 9, and 12 inches. Subsequently, the required overlay thickness is interpolated as a function of projected traffic.
This rigid pavement rehabilitation procedure is illustrated on the flow diagram in Fig 2.4. Four independent subsystems are encompassed; they perform the functions indicated in Table 2.1 as deemed necessary by the designer. They may or may not all be used for a specific design.
The procedure is fully automated, requiring a mainframe computer and extensive laboratory and field testing.
SUMMARY AND DISCUSSION OF DESIGN PRACTICES
Several methods of rigid pavement and rigid overlay design have been reviewed. The rigid pavement designs can be used in a component layer analysis which determines the required rigid pavement thickness to meet new conditions and subsequently calculates the overlay thickness to be the difference between existing and required rigid pavement thicknesses. This methodology is applicable to the AASHTO procedure and the new PCA procedure, two concrete pavement designs widely accepted in the industry. Specific methods covering the design of rigid overlays of rigid pavements are rather rare, but still fewer methods address the design ofTBCOs.
Fig 2.4. Flow chart of the RPOD-2 pavement rehabilitation procedure (after Ref 16). ·

In the Cotps method of overlay design, the thickness of overlay is more sensitive to the original pavement condition C-factor for conditions which would require a TBCO, i.e., thick existing pavements and relatively small differences between existing pavement and required pavement thicknesses for new conditions (thin overlays). Therefore, this method indicates that the evaluation of the original pavement must be correct before a TBCO can be applied.
The AASHTO method is a semi-empirical approach which could be used in many situations provided the field conditions are similar to those prevailing at the Road Test. Otherwise, site-specific conditions have to be accounted for in the design. In addition, this method was not intended for the design ofTBCOs-no TBCO was constructed at the Road Test-and, therefore, would require some effort for implementation and verification before it could be used with the same degree of confidence by pavement agencies using this method or a modification thereof for the design of rigid pavement structures.
The PCA method is a mechanistic approach which addresses specific
11
TABLE 2.1. COMPUTERIZED PROCEDURES A VAIIABLE IN THE FHWAITEXAS RIGID OVERLAY DESIGN METHODS
Computer Program
PLOT2
TVAL2
Function
Deflection Profiles
Statistical Analysis of Design Sections
RPOD1/RPOD2 Fatigue Cracking Analysis
RFLCRI Reflection Cracking Analysis
problems of concrete overlay pavements. Minimum and maximum thickness criteria were set by policy rather than by structural analysis, and, thus, no guidance is provided to assess the effect of exceeding these criteria for conditions where a designer cannot or chooses not to meet them. In addition, although a sophisticated analysis is used in this method to derive design nomographs, the fmal design results in an over-simplification: not many factors are accounted for and the effects of factors left out are ignored (i.e., factors were lumped together for the sake of simplicity).
The new PCA design for highway and street pavements is an empirical procedure which intends to mitigate two fonns of distress: fatigue cracking and pumping by controlling erosion of support layers. The use of the new PCA design for TBCO would also constitute an extrapolation beyond the intended purpose of the method. Final I y, let us note that, since a component layer analysis would have to be used, the conditions of application of this method need to be ascertained.
RPOD-2 uses a mechanistic approach to the design of overlays for rigid pavements. It is a thorough method which intends to prevent fatigue cracking and to minimize reflection cracking. The reflection cracking model specifically applies for flexible/asphalt overlays of rigid pavements. However, the method requires numerous field and laboratory data in order to be effective. Conditions of a TBCO were not modeled. The use of stress concentration factors derived from discrete and fmite elements analyses does not fully characterize the original pavement or specific conditions which might require a TBCO. The structural condition of an old and cracked pavement and the conditions before and after repair work are well beyond the scope of application of a stress factor or a void factor in the wheel load stress analysis.
Thus, a literature search and the review of current concrete overlay designs have revealed a lack of specific methods for designing a TBCO on a CRCP or a JCP. However, the increased use of TBCO throughout the U.S. for the rehabilitation of concrete pavements and the increased commitment to TBCO technology of pavement agencies, including the Texas SDHPT, dictate the need for a sound design method.
Such a method should address the immediate concerns about the new technology, and insofar as possible use traditional answers where applicable. At this stage of development, a mechanistic approach to the design seems appropriate. This approach has the following advantages over other methods:
(1) consideration of new paving materials, (2) assessment of the effect of new designs, (3) consideration of various rehabilitation alternatives, (4) consideration of life-cycle costs and timeliness ofTBCO placement, (5) consideration of specific distress to TBCO and original concrete pavement structures, ( 6) consideration of the amount and extent of repair work before TBCO, and (7) consideration of the effect of various TBCO surface preparations.
Three essential elements are involved in the mechanistic approach as follows:
(I) material characterization, (2) computation of pavement response to loading (internal and external), and (3) relating the response to pavement perfonnance.

12
The main thrust of the report will be the development of a mechanistic design for TBCO incorporating all these elements. Traditionally, the third element (i.e., relating response to performance) has been handled through correlation with existing performance data sets. The AASHO Road Test data, being the most complete, consistent. and accurate data set available to date to the pavement engineer, has often been used for this purpose. Again, this data set will be used until performance data of TBCO original concrete pavements become available.

CHAPTER 3. DESIGN AGAINST WHEEL LOAD STRESSES
In this chapter, wheel load stresses are considered in the design of a TBCO on either a continuously reinforced concrete pavement or a jointed concrete pavement. Realistic field conditions are modeled by use of finite element theory. Calibration of various input is made from a TBCO experiment in Houston.
MATHEMATICAL MODELS FOR THE DETERMINATION OF PAVEMENT RESPONSE PARAMETERS
The first step in a mechanistic design of overlay pavements consists of determining pavement response parameters (stresses, strains, displacements, moments, etc.) associated with loading. Various mathematical models have been used for this purpose. These include
(1) layered elastic and visco-elastic theory; (2) plate theory, closed-form solutions; and (3) plate theory, open-form solutions.
By far the most widely used method for the design of pavements, layered elastic theory permits the determination of stresses, strains, and deflections at any point within a pavement structure, including surface layer, intermediate layers, and subgrade; the principle of superposition allows still greater flexibility because multiple loads can be considered. The method has been most successful for the design of flexible pavements and airport pavements when complex gear configurations are used for design.
In 1969, McCullough and Boedecker pioneered the use of layered elastic theory for the design of CRCP overlays, and showed that reasonably good agreement was obtained with plate theory results and field tests provided the pavement support layers consisted of granular materials (Ref 30).
Visco-elastic theory has been applied to the design of flexible pavement with the intent of predicting pavement response and performance, such as rut depth. It recognizes that (flexible) pavement response is a function of rate and duration of load application, and temperature differentials. However, this is achieved at the cost of tremendous computation time and effort and prohibitively complex material characterization (e.g., creep compliance, complex modulus of elasticity, etc.). For these reasons, the visco-elastic approach is seldom used in pavement design practice.
Plate theory has long been associated with the design of rigid pavements. The ground work: for this method was laid down by H. M. Westergaard in a paper published in 1926 by the Bureau of Public Roads (Ref 31 ). Westergaard considered three loading cases (interior, edge, and comer) and concrete slabs of infinite or semi-infmite dimensions. Other investigators have modified the Westergaard solutions, especially his comer formula, to make the theory match more closely the measured pavement response parameters during road tests or various field tests.
Closed-form solutions resulting from these efforts relate stresses, strains, and deflections to pavement characteristics, such as modulus of elasticity, Poisson's Ratio, thickness, radius of relative stiffness, and modulus of subgrade reaction; pavement design engineers have used these solutions as practical tools for the rational design of rigid pavements throughout the years. The design equations are usually in the form of nomographs, design charts or tables that are easily understood. Also, because of their simple forms using analytical functions which can be evaluated exactly (e.g., power, other elementary and transcendental functions), the closed-form solutions can be derived with a pocket or desk: top calculator in various design situations.
In contrast, only approximate solutions can be found for the open-form plate theory models. Typically, iterative methods using truncated series approximation are employed to evaluate the functions involved. Open-form plate solutions can be further divided in discrete element and fmite element approaches. Table 3.1lists several computer programs available to date to the pavement design engineer, along with their characteristics. From this table, it may be seen that most open-form solutions use finite element and slab on dense liquid (Winkler) formulations.
COMPARISON OF VARIOUS ALGORITHMS
The study now proceeds with the comparison of various algorithms to determine wheel load effects on a pavement structure. The algorithm to be selected must meet the criteria of flexibility, capability to handle a wide variety of significant pavement design input variables, and favorable comparison with other familiar models.
A typical highway CRCP was selected for the comparison. The pavement characteristics are shown in Table 3.2. Based on run costs and the formulation of pavement support (i.e., Winkler dense liquid foundation), three algorithms were chosen for comparison. Figures 3.1 and 3.2 show the results of the calculations for a range of CRCP thicknesses likely to be encountered in the field. Figure 3.1 is a maximum stress plot, and Fig 3.2 a maximum deflection plot The basis for these
13

14
TABLE3.1. CURRENT RIGID PAVEMENT DESIGN COMPUTER PROGRAMS (BASED ON PLATE THEORY AND THEIR CHARACTERISTICS
Computer Mathematical Program Source Model Characteristics
SLAB-49 The University Discrete *Two-dimensional analysis of plates and beams ofTexas at Austin Element *Liquid or Winkler foundation formulation
Analysis
JSLAB Construction Finite *Design of jointed concrete pavements (JCP) Technology Element *Two-layer capability Laboratory Method *Curling behavior and wheel load stress analysis (PCA), Skokie, *Variable dowel spacing allowed Illinois *Winkler foundation
ILU-SLAB University of Finite *Structural analysis of JCP Illinois, Urbana Element *One or two layer handling capability Champaign Method *Four subgrade modelling available (1) Winkler,
(2) Boussinesq half space, (3) V alsov two parameters, (4) stress dependent
SAPIV/SOUD University of Finite *Three-dimensional analysis of structures SAP California, Element *Choice of eight element types for modelling of
Berkeley Method various structural problems *Effects of steel reinforcement and confining pressure can be modelled
*Dynamic analysis of structures feasible *No specific subgrade formulation by many
alternatives available (e.g., elastic foundation) *Tedious input; costly runs
WESUQUID Waterways Experiment Finite *Two-dimensional analysis of pavements Station. Vicksburg, Element *Variable support and temperature effect Mississippi Method can be modelled
*Liquid (Winkler) subgrade formulation
WESLAYER Waterways Experiment Finite *Two-dimensional analysis of pavements Station, Vicksburg, Element *Variable support and temperature effect Mississippi Method can be modelled
*Elastic foundation formulation
choices of response parameters is the assumption of the principal stress theory, which states that the controlling factors for damaging a specimen in fatigue is the maximum principal tensile stress (Ref 30). Also, from field observations, one of the most prevalent forms of CRCP distress was found to be pumping, which may be initiated by excessive deflection of the pavement edge and the presence of water.
As can be seen in Fig 3.1, JSLAB predicts higher stress than the SLAB49 or Westergaard solution. The shape of the stress curve is, however, the same. Figure 3.2 shows that the predicted maximum deflection curve is virtually the same for the Westergaard and SLAB49 solutions, and that the JSLAB solution lies below the above two.
In summary, JSLAB predicts much higher stresses and slightly lower deflections than either the SLAB49 or the Westergaard edge solutions over the range of pavement thicknesses and for the values of the variables indicated in Table 3.2. Overall, the shapes of the stress and deflection curves are the same for all three algorithms. Since JSLAB allows the user to specify a great many more variables associated with concrete slab, load transfer devices, and subgrade, it was selected for subsequent considerations. The ability to specify these input variables does indeed permit more flexibility during design, thus

allowing tradeoffs to be made between the variables and providing better contol over the generation of feasible design solutions.
This study makes extensive use of the fmite element method (FEM) and its implementation in the JSLAB computer program for structural design and analysis of rigid pavement rehabilitation. Therefore, some concepts ofFEM, implementation in JSLAB, and a discussion of validity and application to pavements are presented in Appendix A. This material is incorporated in the following section.
600
550
500
u; 450 Legend a. A JSiab ui 400 \ • Slab 49 U) CD
<> Westergaard ... Ci.i ' ..!
350 \\ \' u; ,,, c
Cll 300 1- ,, x ',, as
250 :i
24
23
,,,, , .. , c .2
200
150
100 5 6 7
' .. , ................ ........ ::::::-.. ................... ......__
8 9 10 11 12
Concrete Thickness, in.
13
~ 15
~ 14
" 13 .. :::1! 12
11
10
9
8
7
15
TABLE 3.2. DESIGN FACTORS USED FOR COMPARISON OF THE VARIOUS ALGORITHMS AND THEIR ASSOCIATED LEVELS
Factors
Overlay Thickness, D0
Concrete Modulus of Elasticity, E
Poisson's Ratio, v
Loading, P
Modulus of Subgrade
Reaction, k
Levels
6, 8, 10, and 13 in.
5xto6 psi
0.15
9x10³lb
(at edge of pavement)
3.0x10 2 pci
Legend
a JSiab
• Slab-49
0 Westergaard I
Fig 3.1. Maximum stress plot of a typical highway concrete paYement by Yarious algorithms; edge loading case.
8~--L-~~~--~--~--~--~--~
STRUCTURAL DESIGN
s s 7 a 9 10 11 12 13
Concrete Thlcknesa. in.
Fig 3.2. Deflection plot of a typical highway concrete paYement using Yarious algorithms; edge loading case.
Structural design of thin-bonded concrete overlay pavement considered in this study consists of determining the appropriate thickness for a given material type (e.g., conventionally reinforced concrete, steel mat reinforced concrete, fiber concretes, and superplasticized concrete) to safely carry some predetermined traffic load repetitions before a specified state of "failure" is reached. This is carried out within certain budgetary constraints. Thus, the proposed TBCO has to be satisfactory from a structural/strength standpoint This section of the report concentrates on the structural aspect
Material types available to the pavement design engineer for the purpose of concrete overlay construction are many. The choice of material types is increased even further if one considers combinations of various materials (e.g., use of a conventionally reinforced concrete overlay with or without a superplasticizer or other concrete additives). By and large, the choice depends on the local economic, environmental, manpower, and other conditions. This part of the report, although it recognizes the importance of the material type selection and mix design (especially since the quantities of material placed are, in general, far less than the original quantities of concrete and, therefore, are more susceptible to mix design flaws resulting in premature failure such as drying shrinkage cracks) does not however address this aspect directly. This is considered a separate design problem, and the structural design discussed hereinafter only requires proper material characterization

16
(modulus of elasticity, Poisson's ratio, and thermal coefficient of expansion and contraction; the latter only when a thermal stress analysis is desired). The results of the material characterization are used in the structural design.
The structural design methodology developed in this study is implemented within a computer program called TBCO 1. Details of the program operation are presented later in this chapter. Appendix D contains the input guide to TBCO 1. The program listing, too voluminous to be included in this report, can be obtained from Ref 40.
CRACK MODELLING The crack modeling scheme used in this report is based on a combined theoretical and practical approach. The theoretical
basis is the FEM through the use of the JSLAB program. The practical approach consists of using Dynaflect deflection data collected at the crack and at the midspan on the South Loop 610 experimental TBCO in Houston. A previous study (Ref 19) revealed that the crack indicator, Cl, a dummy variable used to denote the presence (CI = 1) or absence (CI = 0) of Dynaflect readings at the crack, was significant at the 95 percent confidence level. This data set comprising 410 deflection basins can therefore be used to determine the effect of a crack on the original CRCP for the South Loop 610 conditions.
The data are displayed in Table 3.3, along with a sketch of the pavement structure and characteristics used in the analysis (Fig 3.3). An approximately equal number of measurements were taken midspan and at the crack. Data showh in Table 3.3 represents the average of all readings in each category.
The various steps necessary for the analysis are explained hereafter; these are further summarized on the flow diagram presented in Fig 3.8.
The following eight steps were used for crack modeling.
(1) Back-calculate layer moduli using elastic-layered theory with at-midspan deflections. (2) Back-calculate layer moduli using elastic-layered theory with at-crack deflections. This results in "equivalent
moduli." (3) Determine the modulusofsubgradereaction (k-value) from moduli
determined in Step 1. (4) Use JSLAB to compute maximum deflections fork-value of Step 3,
a variable concrete modulus of elasticity, E1 (with E1 varying about the value determined in Step 1), pavement characteristics and Dynaflect loading configuration.
(5) Select adjusted concrete modulus based on computed maximum deflection and actual field deflection recorded at sensor No. 1 in the field for the midspan condition.
(6) Using ratio of concrete moduli from Steps 1 and 2 and adjusted modulus of Step 5, determine the concrete modulus to use at crack in JSLAB (i.e., the assumption is made that the ratio is independent of the mathematical model used); this modulus is used for soft elements.
(7) Increase the width of soft elements in JSLAB until an overlap of computed and field deflections occurs for the at-crack condition.
(8) Plot maximum deflection as a function of width of soft elements and graphically determine the zone of influence of crack on South Loop610.
TABLE 33. AVERAGE FIELD DEFLECTION DATA USED FOR CRACK MODELING (10 -2 MILS)
Sensor Reading
Wl
W2
W3
W4
W5
Load Position
At Midspan (CI = 0)
55.4
51.9
45.8
41.8
35.4
At Crack (CI -1)
57.6
52.7
45.9
41.8
35.8
Note: Each sensor reading is calculated based on410 distinct measurements taken at the South Loop 610, Houston, experim.enral TBCO paverr.ent (see Ref 19 for further statistical analysis details and treatment of the data).
E3* V•0.45
The procedure in Step 1 meets the conditions of applicability of elastic layered theory provided that the crack spacing is large enough (in the 3 to 1 ~foot range). Both geometric and boundaryvalue assumptions are meL The concrete material between two consecutive transverse cracks is assumed to be elastic and isotropic and to possess other continuous properties. At the Center for Transportation Research, three main computerprograms are available for calculating pavement layer moduli for a given set of measured Dynaflect deflection basins. Two of the programs are iterative, requiring constant input from the user in a trial and error process. The third program is self-contained and self-iterative. The program selected is called BASFT2; it is iterative and a modified version of
Nota: *•Variable; Value Is calculated by Trial and Error
Fig 3.3. Pavement structure characteristics used in the crack modeling analysis (taunfrom the South Loop 610 CRC pavement in Houston).

BAS FIT (Ref 39). The moduli obtained from this step are displayed in the frrst half of Table 3.4.
The procedure adopted in Step 2 is not technically correct; that is, elastic layered theory should not be used to calculate pavement responses at cracks in rigid pavements because the boundary-value assumptions are not met; a crack creates a zone of discontinuity at and around the crack. However, measuring deflections at the crack has been used in the past by many rigid-pavement designers and researchers for various reasons: (1) to provide an indication of the crack load transfer, (2) to help design against reflection cracking of ACP overlays, (3) to help verify the presence of voids and whether they should be subsealed, and (4) for comparison with midspan deflec-
17
TABLE 3.4. RESULTS OF BACK CALCULATING LAYER MODUU FROM COMPUTER PROGRAM BASFT2 USING LAYERED-ELASTIC THEORY
Layered-Elastic Property
E1 (Concrete Slab) E2 (Subbase) E3 (Subgrade) Calculated Deflections
Dynaflect Loading Position
At Midspan At Crack 5,300,000 psi
540,000psi 15,500 psi
2,500,000 psi 700,000 psi
16,500 psi
(mils) .54 .52 .46 .41 .35 .57 .54 .47 .41 .34 Measured Deflections
(mils) .55 .52 .46 .42 .35 .58 .53 .46 .42 .35
tions to help evaluate the in-situ condition of rigid pavements. The question of interest in this part of the study is the following: assuming an uncracked portion of pavement had the same measured deflections, what would the layer moduli have to be so that calculated deflections would match closely measured deflections?
It should be noted at this point that what could be called a convergence problem arose: a good fit could be easily found in Step 1 (only fine tuning was required), but the deflection fitting process in Step 2 proved more arduous; this can be seen in Table 3.5 where various combinations of layer moduli provided basin fits that could be acceptable. This table shows that, basically, a decrease in the upper concrete layer stiffness is traded for an increase in the underlying lower layer stiffness beyond what would nonnally be expected if material samples were collected and tested in the laboratory. It should be noted, however, that obtaining many different combinations of layer moduli when fitting deflection basins is not an uncommon occurrence, even under better field conditions.
Step 3 is an attempt to bridge the procedural gap between layered-elastic and finite element methods. The approach aims at fmding a common denominator for the support value provided by the lower layers of the pavement structure. Layered-elastic theory models this support value by layer moduli E2 and E3, assigned to the subbase and the subgrade respectively. A single value, the modulus of subgrade reaction, ~P' is required in the FEM approach. To this end, Fig 3.4 has been prepared. This figure was derived by simulating the plate loading test (which is used in the field to obtain K-values on prepared subgrades or subbases) with an elastic layered theory computer program called BISAR (Ref 40). BISAR was chosen because it gives more reliable and consistent calculated deflections in the vicinity of the loading point(s) than other programs, especially those based on the original Chevron LA YER-5 code (e.g., ELSYM5, LAYER, LA YER5, and LA YER15) (Ref 39).
The concern at Step 4 is to detennine the concrete modulus of elasticity which should be used in the uncracked portion of the slab. To this end, the concrete modulus of elasticity is varied as an input to the fmite element program, JSLAB (where variation is about the value obtained inStep 1, i.e., using midspan deflections). Other inputs to JSLAB include the soil support value (i.e., ~p) derived in Step 3, pavement geome-try and the Dynaflect loading configuration, as illustrated in Fig 3.5. Note that the contact areas of the Dynaflect loading wheels are approximately 3 square inches each. The output of interest is the maximum nodal deflection and this occurs between the emulated loading wheels. The procedure is repeated until the computed maximum deflection covers the maximum sensor no. 1 deflection of field data for the midspan condition.
In Step 5, a graphical procedure is used to obtain the concrete modulus value to use in JSLAB for uncracked portions of the concrete slab. This is illustrated in Fig 3.6 and it proceeds as follows: enter the ordinate axis with sensor no. 1 deflection and read off the abscissa of the corresponding point on the curve. It should be noted that Fig 3.6 was generated for illustrative purposes and represents a unique relationship for a specific modulus of sub grade reaction. Note that this
TABLE 3.5. ALTERNATE LAYER MODULI DERIVED FROM COMPUTER PROGRAM BASFT2 FOR THE
Items
Moduli (psi) Computed Deflection (mils) Measured Deflection (mils)
Moduli (psi) Computed Deflection (mils) Measured Deflection (mils)
Moduli (psi) Computed Deflection (mils) Measured Deflection (mils)
Moduli (psi) Computed Deflection (mils) Measured Deflection (mils)
3. 000,000 .57 .54 .58 .53
4,500, 000 .56 .53 .58 .53
3,700,000 .56 .53 .58 .53
2,500,000 .57 .54 .58 .53
Values
750,000 .48 .41 .46 .42
430,000 .47 .41 .46 .42
580,000 .47 .41 .46 .42
700,000
.47 .41
.46 .42
16,000 .35 .35
16,000 .35 .35
16,000 .35 .35
16,500 .34 .35

18
18'
Subgrade Modulus, E3, pal
Fig 3.4. Modulusojsubgrade reacdon,K-value,computed as a juncdon of subgrade moduli using layered·elasdc theory, BISAR (adapted from Ref 40).
adjusted concrete modulus is significantly different from that obtained in Step 1 from elastic layered theory. This is not surprising because different computer codes have different load-deflection characteristics (Ref 40, and also see Figs 3.1 and 3.2). However, the ratio of concrete moduli determined using elastic layer theory and FEM would not normally be 5. Nevertheless, this last modulus of elasticity of concrete should now be used to characterize uncracked portions of . concrete in all subsequent JSLAB analyses.
In Step 6, the modulus of elasticity to use at and around the cracks is sought Recall that at<rack modulus was determined from Step 2. The assumption that the ratio of moduli determined from elastic layered theory and FEM is constant does not seem unreasonable if one considers that both methods attempt to formulate a model of the physical pavement behavior which, for the purpose of analysis, is constant and independent of the models. In other words, the measuring instruments can be different, but the measured quantity can and does remain the same (in this case, at any given time): variation in the models is an attribute of the models, not of the measured physical entity. Since the moduli of concrete at midspan and at the crack were determined in Steps 1 and Step 2, respectively, and since the modulus of concrete to use for the midspan condition was determined in Step 5, the modulus of concrete to use at the crack in soft elements (i.e., elements with decreased modu-
vm 1u r--..--..--.......-.....-...H-,...,--rrf.-,-.,...,.--,.......,.-,.---,---,
120 1--1-1-++*+H-M-+H--1-f--t--+---', 96~--~~~~~~~-+~--~~+--+--~
72~-+-+--+~++#+~-
48~-+-+--+~~+T~-
24~--~+-~~+++++H-+~~t-r-t--t---r o~~~~~~~~u_~~~~-L--~-~ o 96108: ! : h.u: : i 165 r4186 210 2ee
1201 :,41 .,47 ! 159 XUI ~ ; 153
132 14i.25
• loaded Elements: #102 and #103 • Local Load Cooretnate' :
[ x, x2 v, jv2J G) ius 3.00 8 121 ®Jus 3.00 0 1 41
Fig 3.5. Pavement geometry and Dynaflect loading conjiguradon used in crack modelling procedure.
llustrative P!Jrposea Only
!! E c .2 'E ~ 41 0 41 u O.:S9 .!! :;
0.36 en :o( I'll
:::1!
1.000.000 psi
Q24~~~~----~--~--~--~--600.000 \500.000 2.400.000 3.300.000 4,200.000 5,100.000
Concrete Modulus of Elasticity, psi
Fig 3.6. Maximum deflection as a junction of concrete modulus of elasticity computed by the finite element method, }SLAB.

19
Ius of concrete used to simulate a crack) can be easily ratioed out Step 7 is concerned with determining the zone of influence of a crack. This is accomplished by matching measured and
calculated deflections; with the simulated Dynaflect load applied at the crack (see Fig 3.5), the width of soft elements is increased progressively until an overlap occurs for the maximum measured and calculated (with JSLAB) deflections.
Finally, Step 8 is a graphical determination of the zone of influence corresponding to the measured field Dynaflect maximum deflection. To this end, Fig 3.7 is plotted such that the width of soft elements is the abscissa, and the maximum calculated deflection the ordinates; the ordinate axis is entered with the measured at-erack Dynaflect maximum deflection and the corresponding zone of crack influence (i.e., the width of soft elements corresponding to the measured maximum Dynaflect deflection) is read off the abscissa axis.
In summary, the procedure outlined above permits (1) the determination of the appropriate concrete modulus of elasticity to use at crack in the FEM analysis and (2) the determination of the zone influenced by a transverse crack. It eliminates the need for stress factors or the use of layered-elastic theory beyond the conditions of applicability. Further, it is flexible enough to allow accounting for individual problem areas during evaluation or design of a rehabilitation scheme. The various steps discussed above are illustrated in the following flow diagram (Fig 3.8). The scheme is general enough to be adaptable to various designs or analysis situations, and the discussion has been primarily aimed at understanding this general aspect.
As applied to the South Loop 610 Dynaflect data, however, the proposed crack modelling scheme reveals the following:
(1) The crack could be modelled by using soft elements (i.e., fmite elements with a reduced modulus of elasticity); the reduction in modulus at the crack for the South Loop 610 TBCO experimental site in Houston should be approximately 53 percent
(2) The influence of the transverse cracks extends to about 9 inches on either side of a crack (1-l/2 feet total).
These conditions were built into the TBCO 1 computer program; because no similar Dynaflectdeflection data were collected on jointed reinforced concrete or jointed concrete pavements, no attempt was made to model the effect of transverse cracks on such pavements within TBCOl.
!! e c .2 0 ~ II> 0 II> (.)
.!! :; en x Ill ::E
0.59
0.58
0.57
0.56
0.55
0.5-4
0.53
0.51 9.0 in.
o.so~~--._~--~~--~--~~--~~-
o 2 4 6 8 ~ a M ~ ~ ~
Width of Affected Zone, in.
Fig 3.7. Modelling influence zone of a crack with Dynajlectfield data.
MATCH MAX
OEFl.ECTlONS
Fig 3.8. Flow diagram of the crack modelling procedure.

20
Finally, it should be noted that the numeric values obtained, although not directly significant in and of themselves were obtained for a CRC pavement in Houston, Texas where support conditions are basically that of a saturated clay. The CRCP was in overall good repair condition despite the FEM calculated modulus of one million psi.
Computer program TBC01 accounts for the effect of transverse cracks in CRC pavements with just one factor, crack spacing, which can have low, medium, and high levels. These are set in the program at 3, 5, and 8 feet, respectively. This formulation required precise modeling of a crack and verification with field data collected at the South Loop 610 experimental TBCO site in Houston (Ref 19). Basically, the presence of a crack in a rigid pavement results in increased flexibility of the structure which leads to an increase in surface deflections as measured by various NDT devices and a subsequent decrease in tensile stress level. A crack also has potential to create roughness (and thus a decrease in present serviceability index), or spalling. The variables which affect the assessment of PCC cracks include crack width, crack spacing, and amount of cracking. Because the Finite Element Method is used in this study, the issues involved in modeling a crack coalesce into two, namely:
(1) magnitude of the required change in constitutive properties (e.g., concrete modulus of elasticity), and (2) zone of influence of a crack (i.e., the area around the crack affected by the loss of continuity due to the presence of
a crack).
Appendix C summarizes the Dynaflect system and the operating mode selected to collect data at the South Loop 610 experimental TBCO site.
COMPUTER PROGRAM TBCOl The program was designed to do structural analysis of TBCO pavements on CRCP, original pavement This program
could be adapted to perform analysis of JRC or JC original pavements as well. TBCO 1 utilizes the JSLAB program (Ref 38) as a subroutine. Advantages of the finite element method and the flexibility afforded by it in a pavement design situation are outlined earlier in this chapter. These are mostly retained in TBCO 1. In addition, the drudgery of the discretization process is removed, and the computer program user only needs to select original pavement type and input average crack spacing.
An adaptation of TBC01 to jointed pavements would use the loading condition to distinguishes JRC pavements from JC pavements: JRCP are assumed to have protected comers and hence the critical load (a standard 18-kip SAL on dual tires) is located at the edge, whereas the critical load for a JCP (also an 18-kip SAL) is located at the comer. Selection of a tire pressure is left to the computer program user but values of75, 90, and 110psi are recommended for low, medium, and high levels for the current truck fleets. The critical loading condition for a CRCP is considered to be between cracks, for any of the crack spacing considered, and at the pavement edge.
On JRCP and JCP, three load transfer devices (L TDs) could be selected for use in the TBC01 program: (1) dowel bars, (2) aggregate interlock or keyway, and (3) a combination of the above. The effect of the LTD is assumed to be uniformly distributed along the transverse joint according to adjoining element width. Thicknesses of original and TBCO pavements can be varied in computer program TBC01; however, the value for the original pavement is usually known. By varying the thickness of the overlay or the modulus of elasticity, (in order to reflect different material types or, alternately, varied construction quality control/quality assurance levels), the program user can explore and design a TBCO pavement on original CRCP. TBC01 calculates pavement responses to loading (i.e., stress, deflections, etc.) and then select the maximum tensile stress at the bottom of the second layer (i.e., the original pavement). This variable is printed in the output, and the program then proceeds by conducting a fatigue cracking analysis based on a fatigue equation derived by Taute et al (Ref 39) from the AASHTO Road Test data. This equation, originally developed for asphalt concrete overlays of CRCP, was assumed applicable. The fmal output of the program is the number of 18-kip SAL repetitions to be expected before a failure criterion of 50 feet per 1,000 feetl is attained. From this result, and the traffic forecast, the designer may attempt another run of TBC01 such that the traffic projection figure is less than or equal to the allowable/expected number of repetitions to failure.
Candidate variables for modification at subsequent iterations include top layer thickness, T1, and modulus of elasticity of top concrete layer, E
1, on data card 5 of the input guide (see Appendix D). The latter variable would typically reflect a
change of overlay material type (e.g., the designer wants to explore the structural benefit of using synthetic fibers for secondary reinforcement of the overlay concrete mix). Three to four iterations would normally be needed for a particular structural design.

CHAPTER 4. DESIGN AGAINST VOLUME CHANGE STRESSES Volume change stresses, also called environmental stresses, significantly influence the behavior ofPCC pavements and,
hence, their long term performance; they are developed as a result of the generation of internal forces within the pavement structures. When a TBCO pavement is constructed over an original PCC pavement, the former alters the behavior of the latter due to overburden static load created by the weight of the overlay, and the insulation provided against temperature and moisture ingress.
This section of the report provides the conceptual framework to analyze further the behavior of overlaid original PCC pavements using a TBCO pavement, defines the data needed for such an analysis, and presents probable distresses which may arise if volume change stresses have not been attended to during design.
Note that a detailed study of volume change stresses is currently being conducted at the Center for Transportation Research, The University of Texas at Austin, and a report on this will be presented in the near future. Therefore, the discussion in this section is cursory and a precursor to the study mentioned above.
REFLECTION CRACKING ANALYSIS
Reflection cracking is a form of distress which occurs frequently on PCC overlaid pavements. By definition, reflection cracking results from the propagation of an existing crack in the original pavement (prior to its rehabilitation) through the new overlay pavement, surface treatment. or other form of rehabilitation. Depending on the condition of the cracks, reflection cracking may or may not be a problem for the performance of the pavement structure. Experience has shown that reflection cracking cannot be completely eliminated. However, different techniques have been tried in the field to mitigate its effects and retard its onset for the case ofPCC overlaid with asphalt concrete pavements (ACP) even though it has not been possible so far to establish conclusively the effectiveness of any given technique (Ref 41).
Although reflection cracking is expected when the overlay pavement consists of a TBCO, this distress was slow to manifest itself on two projects in Louisiana (Ref 42) and Texas (Ref 19). This would seem to indicate that even though the distress mechanism may be the same, the manifestation is different for TBCO or ACP overlays. Thus, a new analysis is called for.
Horizontal Movement
Case Where the Original Pavement is a CRCP. Horizontal movementoftheoriginal pavement can be measured directly in the field and the results used in the reflection cracking analysis. Movement of the CRCP affects average crack spacing, crack width, and the amount of steel required for proper design.
Movement of a CRCP is influenced by the subbase friction, the restraint provided by the steel (for highway CRC pavements, the percentage oflongitudinal steel is about 0.5 percent by cross-sectional area) and the thermal properties of the coarse aggregates used in the concrete mix (e.g., coefficient of thermal expansion).
When a TBCO pavement is constructed, it must have a horizontal movement compatible with that of the existing pavement; it is placed monolithically and no allowance is made for existing typical cracks occurring at regular intervals in the CRCP. The causes of Class 2 and Class 3 cracking (AASHTO definition) must be determined and Class 3 cracking sealed when appropriate as part of the pavement repair program prior to overlay placement. However, all joints in the CRCP (except maybe construction joints when these have been designed and constructed with good load transfer) must be replicated in the overlay. The joint width in the TBCO must at least equal that of the existing pavement.
Differential horizontal movements between the CRCP and TBCO create a tensile strain in the overlay and, thus, a potential for reflection cracking. Such differential movements may result from ( 1) significantly different thermal properties of the two pavements, such as those due to different coarse aggregate types in the paving concrete mixes, (2) significant uniform temperature variations, such as the temperature drop in late fall or the temperature rise in early spring, (3) loss of bond, (4) significant drying shrinkage in the TBCO, and, fmally, (5) a combination of the above conditions.
Depending on the TBCO design and material type, reflection cracking will occur at a specific rate, which must be determined by analysis and experimentation for specific conditions.
Case Where the Original Pavement is a JCP. Horizontal movements in jointed concrete pavements (to include jointed plain and jointed reinforced concrete pavements) are influenced by much the same variables as in CRCP (viz., subbase friction, steel restraint. and coarse aggregate thermal properties) with one additional variable, that is, joint spacing. Movement at the joint is accommodated by various schemes to include use of dowel bars; movement in the slab interior can be controlled by use of distributed steel. Again, when a TBCO is used, it must be constructed such that the horizontal movement of the overlay is compatible with that of the JCP. All joints must be replicated in the overlay.
Cracking in JCP does not follow a set pattern, as it does in CRCP; thus, reflection cracking in JCP overlaid TBCO, if any, would be even less predictable. The concept of"bridging over" cracks must be fully understood, and the TBCO designed
21

22
to withstand tensile strains due to the JCP movement. Every step should be taken to reduce the potential for differential movement between the two concrete pavements and, thereby, to alleviate the problem of reflection cracking.
Finally, the horizontal movement in aJCP is larger than in a CRCP, and this must be taken into account when TBCO pavements are designed for either type of original pavement.
Vertical Movement
Vertical shear strains in the TBCO pavement have potential to create reflection cracking. By and large, vertical movements are created by external wheel loading at transverse cracks. Assuming the two pavements to be fully bonded and only the original pavement cracked, the passage of a wheel load over the TBCO creates stress concentrations at existing cracks. The magnitude of this increase in stress is directly related to the total movement experienced at the crack. These movements are damped by the inertia of the overlay, and, conceivably, the problem is nonlinear. Thus, an iterative approach is required to solve the vertical shear strain in the TBCO.
Data Need
The data required to do a sensible reflection cracking analysis of CRCP or JCP overlaid TBCO include the following:
( 1) Measurement of representative strains in the original pavement in response to temperature variation in the pavement; the measurements to be taken over a statistical sample ought to be short term, such as over daily temperature variation for2 to 3 days in a given season, or long term, such as over uniform temperature changes attributable to the various seasons.
(2) Measurement of shrinkage in the TBCO for the paving concrete mix used; alternately, published literature sources can be tapped for shrinkage of concrete mixes with similar characteristics.
(3) Shear strength and load-deformation characteristics of the TBCO material (e.g., fibrous concrete). (4) Tensile properties of the TBCO. (5) Measurement to determine the existence and strength of the bond at cracks and away from cracks in order to define
boundary conditions to use in the analysis. (6) Load transfer.
BOND STRESS ANALYSIS
Loss of bond between original and TBCO pavement can occur as a result of internal loading (i.e., volume change stresses) or external loading. The case of external loading is examined in great detail in the following chapter. In this section, the conceptual mechanism and consequences of loss of bond due to volume change stresses are fust explored. In closing, the data needed for a satisfactory analysis of the problem are defined.
Horizontal Movement
Uniform horizontal movements of TBCO overlaid PCC pavements do not stress existing bond between the pavements away from cracks; however, differential movements create in-plane shear stresses which may adversely affect the bond. The five conditions cited in the previous section which may result in differential movements still hold for the bond stress analysis.
Figure 4.1 explains the bond stress mechanism which occurs when differential movements between the two pavements take place. Figure 4.1(a) shows the fully bonded case at a temperature T1; only subbase friction is considered in this case. Figure 4.1 (b) shows what configuration the two pavements would take if the restraint condition were totally removed (i.e., if there were no bond and zero subbase friction) and the temperature dropped uniformly from T 1 to T 2 or moisture were lost (i.e., drying shrinkage). Figure 4.l(c) is a representation of the actual condition, which is intermediate between the two previous ones; P1 is the force which would be required to "pull" the TBCO from condition (b) to condition (c), and P2, the force to "push" the original pavement from condition (b) to condition (c). By definition, P 2 - P 1 (in absolute value) creates shear stresses at the interface of the two pavements. This simplified model does not consider many variables, which, in practice, may influence the behavior described. For example, the restraint provided by reinforcing steel which may exist in both pavements is ignored. The model further assumes that the TBCO is more susceptible to volume change stress (e.g., higher coefficient of thermal expansion of the coarse aggregate) than the original pavement.
Vertical Movement- Peeling Off Effect
Vertical movement of a pavement results from daily temperature changes (i.e., warping) or moisture changes (i.e., curling). The difference between top and bottom temperature or moisture conditions creates a gradient which initiates pavement movement in the vertical direction. This movement is opposed by the weight of the pavement and the subgrade

friction. Concrete pavements of uniform
cross-section subjected to a uniform temperature gradient tend to warp at the surface. Warping stresses were flrst analyzed by Westergaard as reported by Yoder and Witczak (Ref 23); essentially, they are tensile stresses which add or subtract from wheel load stresses.
Figure 4.2 shows a different picture for the case of a TBCO overlaid PCC pavement when the two pavements having significantly different thermal characteristics are subjected to a temperature or a moisture gradient. The assumption in the figure is that the overlay is more sensitive to the applied gradient (e.g., through a higher coefficient of thermal expansion of coarse aggregate).
Pavement Configuration
I .... L -..I TBCO Pavement ( 1 ~----------------------------------------_, r,2
!al Originai Pavement
TBCO Pavement
Original Pavement
1/2 AX(l) Actual
Interface Stress Condition
t •0
-- --
23
The effect is more noticeable at unrestrained edges and may propagate to the slab interior. Also, fatigue theory may apply.
P, I - - -~----T_B_c_o_P_a_ve_m_e_n_t -----1-- - ,.___ t < t max -:-ir2<2l p21
Data Need Original Pavement
To assess the potential for debonding due to volume change stresses, the following data are required:
i I ---~~~------~~~---~ ~~~--~~~
Notes: (1).o.x-Total Horizontal Displacement (2) T 1 T 2"""'tlaf and Final Temperatures (1) Measurement of strains in the
TBCO and original pavement simultaneously; a stable bench mark is needed to determine rela-
Fig 4.1. Mechanistic models ofTBCO overlaid pavements subjected to a temperature drop or moisture loss.
tive slab movements. (2) Development of mathematical models and field
verification of the models to include periodic measurements of horizontal and vertical movements in response to temperature and moisture changes.
(3) Nondestructive testing data to relate loss of load transfer and loss of bond at the crack to the bond characteristics at the pavement interior.
( 4) Wave propagation and thermography data to verify the field existence of the bond.
SUMMARY
Cross-Section
Fig 4.2. Peeling off effect due to significant different temperature or moisture characteristics of the original and TBCO pavements.
In this chapter, volume change stresses were analyzed and concepts to use for field installations ofTBCO overlaid PCC pavements presented. Two types of distress which may result from excessive volume change stresses are reflection cracking and de bonding. These were analyzed separately. In either case, the controlling stresses arise from strains created when horizontal or vertical movements occur. Finally, a sensible approach to the design requires the identification of data needs and this was presented for either distress type. Further investigation and subsequent incorporation of volume change stress parameters into the design procedure is beyond the scope of this report, however work in those areas is underway at the Center for Transportation Research.

CHAPTER 5. DESIGN AGAINST DEBONDING Loss of bond between a TBCO and the underlying pavement is a mode of failure intrinsic in this rehabilitation alternative.
Thus, the design must explicitly address the problem in order to guard against complete de bonding, because, when this occurs, the two slabs act independently of each other, and performance of the structure may be significantly impaired.
In this chapter, the type of loading forces that will induce a loss of bond is first determined. Next, the nature of the bond and the actual bond strengths obtained by direct shear at the interface on several field specimens are examined. In light of this, minimum safe bond strengths, appropriate factors of safety, and construction methods that will insure these on field installations are suggested. Stresses to be considered here include those generated by: ( 1) wheel loading, (2) thermal gradients between slabs, and (3) snow removal equipment Early age stresses due to drying shrinkage, moisture loss, and rapid temperature changes have not been considered.
INTERFACE SHEAR DUE TO TRANSVERSE LOADING
Oassical pavement theory models the action of wheel loads on rigid pavements using plate bending theory. Transverse loading of beams and plates may induce significant shear stresses in horizontal planes in addition to the bending stresses (Ref 43). Within the limits of validity of some simplifying assumptions, shear stresses can be determined for rectangular cross sectional beams by using the so-called "shear (stress) formula" (VQJIT). The task at hand in designing TBCO against debonding is to investigate a range of factors in order to determine, frrst, if this mode of loading can be a controlling factor and, second, the magnitude of shear forces induced by a rolling tire at all times so that these may be kept within tolerable limits.
The factorial computation design used for this purpose is presented in Table 5.1, along with the response variable; a fixed loading configuration (i.e., an 18-kip single axle load on duals with 75 psi tire pressure each) is used throughout
As can be seen, the maximum shear stress calculated by layeredelastic theory occurs at the interface of an 8-inch pavement (a typical highway PCC pavement) on a weak support overlaid by a 2-inch TBCO. The support condition is defined by a combination of subgrade and subbase layer stiffness values. The conditions used here are like those at the South Loop 610 experiment site, where a 6-inch cement-treated subbase was placed atop the clayey subgrade; they are depicted in Figs 5.1 and 5.2. It is remarkable that a relatively narrow range of shear stresses arises from this set of calculations (i.e., approximately 16 to 27 psi) and that the general level of stresses is quite low.
The non-linear response is also displayed in the table. For instance, the decrease between 2 and 3 inches of overlay thickness is much larger than the decrease between 3 and 5 inches of overlay thickness in all cases.
ir> I
ell
~,. ~ IllS
lD
8
TABLES.!. MAXIMUM INTERFACE SHEAR STRESS (PSI) COMPUTED BY LAYERED-ELASTIC ANALYSIS FOR TWO FACTORS AT TWO LEVELS EACH AND ONE FACTOR AT THREE LEVELS
Overlay Thickness
2 inches 3 inches 5 inches
Et•4200 kat ~'1·.~5
E2·4000 ksl
1'2•.15
E3• 200 kli ~'3•.20
....... -E4• 20 kill 1'4•,45
Original Rigid Pavement Thickness
8 inches
Support Condition
Strong
23
Weak 27 17 17
18 17
;., I
N
~.., ,.~ a)
lD
""""'
8
10 inches
Support Condition
Strong Weak 19 22 19 17 17 16
E1•4200 ksi 1'1•.15
E2•4000 ksl
1'2•.15
E3•100 ksl
"3•.20
~ R'-"''- /-"'''
E4•12 ksl 1'4•.45
7
However, the calculations are based on a number of simplifying assumptions to include all layered elastic theory assumptions. and, in particular, (1) no shear on the surface of the top layer outside of the loaded area, (2) circular loads, (3) perfectly rough layer interfaces, (4) isotropic materials infmite in horizontal dimension, and (5) static wheel loads acting alone. Within the realm of these modeling assumptions and the assumed material characterization (Young's moduli, Poisson's ratios, and thicknesses) the analysis shows that there should not be much concern for bond stresses or shear stresses at the interface of original and TBCO pavements.
A second set of calculations to assess the effects of wheel loads on interface shear stress was conducted using
Fig 5.1. Pavement structure characteristics used in the analysis of interface shear stress due to wheel loads- strong support.
Fig 5.2. Pavement structure characteristics used in the analysis of interface shear stress due to wheel loads- weak support.
24

the fmite element method. The results are presented in Table 5.2. The solutions are derived for the loading configuration previous! y discussed and for a center load in the middle of a 12 x 24--foot slab. The procedure for equating a modulus of subgrade reaction, at the top of the subbase,~ to underlying layer stiffnesses (E-values) is explained in Chapter 3; this procedure is used again and yields~= 540 lb/cubic inch for weak support and k,.0 P = 900 lb/cubic inch for strong support Again, the denominations "strong" or"weak" are relative and correspond to conditions for the Houston South Loop 61 0 TBCO experiment
Values of in-plane shear stress appearing in the table are for a plain 12 x 24--footconcrete slab, and values in parentheses are for a cracked slab loaded at the crack. The procedure for modeling a crack is also presented in detail in Chapter 3. The actual figures used in the present analysis include (1) approximately 53 percent reduction in modulus of elasticity for the second layer to simulate a crack in the original pavement, (2) a 9-inch zone of influence of the crack on each side, and (3) loading located at the crack. The procedure assumes that the crack has not yet propagated through the TBCO. From Table 5.2, the following remarks can be made:
25
TABLE 5.2. MAXIMUM INTERFACE SHEAR STRESS COMPUTED BY FINITE ELEMENT METHOD FOR TWO FACTORS AT TWO LEVELS AND ONE FACTOR AT THREE LEVELS
Overlay Thickness
2 inches
3 inches
5 inches
Original Rigid Pavement Thickness
8 inches 10 inches
Support Support Condition Condition
Strong Weak Strong Weak
10 10 8 8 (12) (12) (9) (9)
6 6 5 5 (7) (7) (6) (6) 2 2 2 2
(3) (3) (3) (3)
Note: Values in parentheses incorporate a crack model-ing scheme in the original rigid pavement
(1) The general level of maximum shear stress computed at the interface is quite low, ranging between 2 and 10 psi; in most likelihood, this has to do with inherent assumptions of plate bending theory (e.g., planes of the plate initially lying normal to the middle plane of the plate remain normal after bending).
(2) The pavement support condition (k-value) has virtually no effect on the response variable. (3) The thicker the original pavement, the less shear stress at the interface. (4) The thicker the TBCO pavement, the less shear stress at the interface. (5) When a crack is modeled in the middle of the slab values of the response increase by about 20 percent.
Fmally, a brief mention must be made at this point of in-plane shear stresses induced by a vertical temperature gradient, which might cause debonding. Temperature affects a pavement slab, causing it to warp upward or downward. The weight of the pavement and the friction on the subbase tend to oppose this motion in the vertical direction. The restraint stresses thus developed through the pavement are horizontal bending stresses; they will add or subtract from the wheel load stresses depending on the position of the loads, the temperature gradient (i.e., the time of day), etc. However, since we assume the two concrete layers to be completely bonded, and since JSLAB equates a temperature gradient to a moment applied at edge nodes, the two concrete layers are subjected to pure bending and temperature effect is not estimable. This was further checked by running the program for a 3°F {Inch temperature gradient with no load applied; the value zero (except for rounding off errors in the algorithm) was returned for in-plane shear stress at all interface nodes. The same situation will certainly arise with other algorithms using plate theory.
In closing this section, one can remark that, where layered-elastic solutions apply, they are most likely to be indicative of state of shear stress in the field and that, for all practical purposes, the shear stress developed at the interface due to transverse loading is quite low. The calculations, of course, assume complete bonding of the two layers. Where this is not the case, much different results may arise. Also, the shear stresses developed within the ftrstfew days after placement due to drying shrinkage and thermal gradients may be significant when the low strength of the curing concrete is taken into account. These stresses have not been thoroughly analyzed in this report.
INTERFACE SHEAR DUE TO BRAKING TIRES OR SNOW REMOVAL EQUIPMENT
This section is concerned with the effects of a horizontal force on the bond strength. Horizontal forces on the surface of a TBCO may arise out of unusual driving conditions or special pavement maintenance operations, including the following:
(1) A fully loaded truck may apply the brakes suddenly (e.g., at the bottom of a slope); this action may cause one or more wheels to lock and slide. The study assumes standard 18-k.ip single-axle loads, SAL.
(2) During snow periods, if snow is allowed to accumulate on the pavement surface, it may form into ice and adhere strongly to the structure. Typically, a dump truck loaded with sand and/or deicing agents is used. The truck is

26
equipped with a blade mounted up front; it relies on traction exerted primarily on its front tires to remove the ice. This study assumes that the front axles of such trucks are loaded at 10 kips.
To assess the effects of braking tires on bond strength, various speeds between 20 and 60 mph are assumed; a coefficient of longitudinal friction is calculated, using an empirical formula derived from AASHTO skid resistance data, and, finally, the resulting friction force is determined. The nature of the friction between tires and pavement surface is quite complex and falls beyond the scope of the present study. AASHTO has made extensive studies and proJX>ses charts and tables to relate speed to coefficient of longitudinal friction in its "Green Book .. (Ref 44). From the charts, the following relationship can be derived:
where
{
f- 0.27 + 0.001 (80- V) 1
'7
30 < V<80 mph
f = coefficient of longitudinal friction, and V = vehicle speed in miles per hour.
(5.1)
Assuming as an approximation that the two bodies in contact (i.e., pavement surface and tire) are non-yielding, then the friction force, F, can be calculated as:
F = f(w) (5.2)
where
w = weight on the tire.
Note that f is a function of pavement surface condition (wet or dry), surface texture, tire inflation, etc., and that
Typically, f varies between 0.20 and 0.80. Table 5.3 presents values of speed, V, coefficient of longitudinal friction, f, and corresponding friction force for an 18-kip SAL.
Let us note at this point that the critical conditions for the purpose of estimating maximwn friction force, and, thus, maximum in-plane shear stress due to braking tires, result from dry conditions as opposed to wet conditions used in skid resistance studies. However, research has shown that any kind of friction measurement produces highly variable results and that this is even more true under dry conditions. Further, the data are simply not available for friction measurements under dry conditions. Therefore, a researcher faced with this problem has the choice of either using a direct approach or tapping an existing data base of friction measurements.
The first choice involves field or laboratory measurements for the physical and testing conditions at hand-which the researcher can best defme; in this endeavor, he/she has a choice of the many testing devices currently available on the market, some of which are portable such as the TRRL British Pendulum (Ref 46).
(5.3)
TABLE 5.3. HORIZONTAL FORCE IN· DUCED BY A BRAKING TIRE AS A FUNCTION OF VEHICLE SPEED
Vehicle Speed,
V (mph)
2o(l)
30 40 50 60 70
Coefficient of Longitudinal
Friction, f
0.40 0.35 0.32 0.30 0.29 0.28
(1) Value is taken from Ref 44.
Friction Force, F (lb)(l)
1,800 1,575 1,440 1,350 1,305 1,260
(2) Weight is taken from two sets of dual tires at 4,500 lb each.
Note: The value of the friction coefficient, f, represents average values over each range of speeds; they are for wet conditions.
The second choice involves using a consistent data set, such as that provided by AASHTO, and recognizing that the final values of in-plane shear stress may be as much as doubled in accord with Eq 5.3.
The latter approach was selected in this study for practicality and because of time constraints. The effects of a horizontal load at a point located in the body of a semi-infmite homogeneous, isotropic, weightless,
linearly elastic medium with a plane, horizontal surface, are determined by solving the so-called "Cerruti's problem," named after Valentino Cerruti (Ref 45). According to Todhunter and Pearson (Ref 47), solutions for stresses and deformations for this problem were first obtained by Cerruti and Boussinesq (Ref 48). More recently, D. L. Holl (Ref 49) reported solutions

27
which can be used to estimate the in-plane shear stress at the interface resulting from horizontal forces on the surface of a TBCO pavement.
For the geometry of Cerruti's problem illustrated in Fig 5.3, the shear stress in the X-Y plane is
-r.y = HLOAD • y [ 3 x2
+ 1 - 2v ( R2 _ x2 _ 2 R x2)]
2nR3 R2
(R+z)2
R+Z.J (5.4)
where
HLOAD = the horizontal force acting in the x-direction,
'\) :: Poisson's ratio for the medium, and x, y,z, R = distances as defmed in Fig 5.3.
Solutions for this equation were developed; they are presented in Figs 5.4 through 5.6 for a combination of horizontal loads, positions for evaluation of the interface shear stress, and overlay thickness, 0 1• Figure 5.7 gives an indication of the Joading placement, positions for evaluation, and other characteristics used in the analysis. Finally, Table 5.4 summarizes the maximum in-plane shear stress for Cerruti's problem, which in all cases occurred in position 2, between dual tires. Also note that the analysis uses the principle of superposition. From the table, the following remarks can be made.
(1) For any given horizontal load magnitude, the shear stress decreases significantly with an increase of overlay thick-ness.
p
y
Fig 5.3. Geometry and stresses due to a tangential surface load, HLOAD, which acts in the X-direcdon, shown in a rectangular system of coordinates (after Ref 49).
(2) For a given overlay thickness, the interface shear decreases, but at a lower rate, with a decrease in the applied horizontal load magnitude.
(3) Overall, the level of calculated shear stress is very low and probably only indicative of actual field conditions.
5.0
4.5
iii a.
4.0 .,; I Legend "' i
¢l
I 0 EvaL Poaitlon 1 ...
3.5 iii ... Ill
t:. Eval. Pollllon 2 C1) 3.0 <> Eval. Position 3
.t::. (/';
C1)
u 2.5 .! ... Gl
:5 ---_,._ __ ------- ----€> ~_...,...._.......,... __ .~---
0.0 '---.......l----'---..i-.----'"----'---..J.,200 1300 1400 1500 1600 1700 1800
Horizontal Load Magnitude, lb
Fig 5.4. Interface shear stress calculated for a combination of loads and evaluation positions; overlay thickness, Dl=2".
3.50
3.25
3.00 iii Q.
.; 2.75
.., Cl> .... 2.50
Ci)
iii Gl .t::. (/)
Gl (.)
.! Qj
:5
0.25
1200
C EvaL Position 1
: t:. Eval. Posillon 2
, <> Eval Posit.on 3
__ ...... -------.... ' ·-- -------€> -<?----
~-or--~--
1300 '1400 1500 1600 1700 1800
Horizontal Load Magnitude, lb
Fig 5.5. Interface shear stress calculated fora combination of loads and evaluation positions; overlay thickness, Dl=3".

28
As discussed earlier, snow removal equipment can apply horizontal loads to a TBCO pavemenL To assess the effects of such equipment on interface bond, one must fllSt detennine the total horizontal load which may be transmit· ted through the blade. Assuming a dump truck is used and that it travels at a slow 20 mph average speed on a wet and icy concrete pavement, a friction factor, f = 0.40, is avail· able to the truck; its front tires each carry one-half the 10-kip axle load, and, thus, can each generate a horizontal load, F1 = 2,000 lbf. Tires on the rear axle are dual tires of a standard 18-kip SAL; they carry 4,500 lb each, and, thus, can generate a horizontal load, F 2 = 1,800 lbf each. Therefore, within the realm of these assumptions, the total horizontal load, F, which may be transmitted through the blade of such a dump truck is such that F = 2F1 + 4F 2 = 11,200 lbf.
The total horizontal load, F, may be considered as a point load acting statically in the x -direction along the road. Finally assume the blade width slightly wider than the vehicle and recall that the AASHTO single unit design vehicle is 8.5 feet wide. Thus, assume the blade to be approximately 9 feet wide.
1.9
1.7 fii 0. 1.6
: 1.5 ., ::: 1.4 f/)
~ 1.1
~ 1.0 ., ] 0.5
0.4
0.3
Legend
C Eval Position 1
t:. Eva!. Position 2 0 Eval Position 3
02~----~--~----~----~----~----~ 1200 1300 1400 1500 1600 1700 1800
Horizontal Load Magnitude, lb
Fig 5.6. Interface shear stress calculated fora combination of loads and evaluation posilions; overlay thickness, Dl=S''.
The task at hand is now reduced to a special case of Cerruti's problem: the total horizontal load, F, is equated to HLOAD in Eq 4, which is used once again to estimate the maximum in-plane shear stress developed in the vertical plane of the blade (i.e., for x = 0), varying distances, y along the blade (y must be less than or equal to one-half the blade width), and three overlay thicknesses. The results are presented in Table 5.5.
From this table, the following remarks can be made:
(I) For any given overlay thickness, the shear stress first increases as the radial distance, y, increases, up to a maximum value, and then decreases with increasing values of y.
(2) The maximum shear stress values are obtained for radial distances equal to the overlay thicknesses.
A further investigation of the maxim urn shear stress due to snow removal equipment is conducted for conditions in which the radial distance in the vertical plane of the blade is equal to the overlay thickness (i.e .• y = z, in Fig 5.3) and the tangential
X
<4500# 4500#
!:} Original Rigid Pavement
Note: Numbers next to dots indicate pollition for II'Valuation used In
the interface shear stress analylli&.
Fig 5.7. Loading position for evaluation and pavement characteristics used in the analysis of braking tires.
dislanee x is varied The results of this investigation are presented in Table 5.6. Again, the maximum values of interface shear stress occur for values of the tangential distance, x, such that x = y = z.
TABLE 5.4. SUMMARY OF THE MAXIMUM INTERFACE SHEAR STRESS (PSI) DUE TO BRAK·
lNG TIRES
Overlay Thickness
Horizontal Load 2 3 s Magnitnde (lb) inches inches inches
1,800 5 4 2 1,575 4 3 2 1,440 4 3 2 1.350 4 3 1 1,305 4 3 1 1,360 3 3
Note: Braking tires are 4,500 lb inflated at 75 psi each; they are from a standard 18-lrip SAL with duals.

Note that a numerical approach is used here for the determination of maximum values of shear stress, which is a function of three variables, x, y, and z (see Eq 5.4). A more general, analytical approach is presented in Ref 50 and involves the use of partial differentials and/or Lagrange Multipliers; this avenue is not explored any further here.
NATURE OF THE BOND
A discussion of the theoretical concepts and attributes behind the nature and development of bond between old and new concrete slabs is appropriate at this stage. This will shed light on the measured field bond strengths from 4-inch-di.ameter cores taken through the overlay and original rigid pavements, on the values to be expected, on performance of . field cores, and on construction operation; ftnally, it will set the framework within which to understand the task at hand: designing and constructing TBCO pavements such that their interface bond will endure over the useful life of the pavement structure.
To obtain bonding between new and old concrete pavements, a bonding agent is normally used at their interface during construction. Thus, the various chemical reactions taking place at this location are promoted and aided by the presence of the bonding agent Bonding agents are varied and many brand name products are currently available on the market In recent years, however, TBCO construction practice has increasingly made use of either portland cement grout to which an admixture is often added or thermosetting plastics (epoxy resins).
This section concentrates exclusively on cement grout. however, since it seems the more popular of the two, partially due to its lower inplace cost However, the reader is cautioned against construing this to mean endorsement of the product or process since only a well designed factorial experiment can and should answer the question of cost effectiveness of available bonding agents for use in TBCO construction (this subject is being currently studied at the Center for Transportation Research). If a proprietary brand name product. such as an epoxy, is used, then the unfamiliar user should conform to the manufacturer's specifications and recommendations.
For ease of presentation of the material, this section is divided into two parts: chemical properties and mechanical properties. However, the reader should bear in mind that both chemical and mechanical properties coexist at the interface of a TBCO and an original pavement at all times and actually interact to provide the bonding characteristics which have been assessed in the laboratory by direct shear testing.
Chemical Propertks
29
TABLE S.S. MAGNITUDE OF INTERFACE SHEAR STRESS (PSI) INDUCED BY TYPl· CAL SNOW REMOVAL EQUIPMENT AS CALCULATED IN THE VERTICAL PLANE OF THE BLADE AND FOR VARYING RADIAL DISTANCES, Y
Radial Overlay Thickness
Distance, 2 3 5 y (Inches) inches inches inches
31 10 2 2 38 16 4 3 33 17 5 4 27 16 6 5 21 14 6 6 17 12 6 7 14 11 5 8 12 9 5 9 10 8 5
10 8 7 4
TABLE 5.6. MAGNITUDE OF INTERFACE SHEAR STRESS INDUCED BY A TYPICAL SNOW REMOVAL EQUIPMENT AS CALCULATEDINTHEDIRECTlONOF ACTION OF THE BLADE AND FOR VARYING TANGEN
TIAL DISTANCES, X
Overlay Thickness
Tangential Distance, x 2 3 5
(Inches) inches inches inches
1 69 24 7 2 92 36 10 3 77 41 12 4 54 37 14 5 36 31 15 6 25 25 14 7 17 18 13 8 12 14 12
The chemical properties of the interface bond are influenced to a large extent by the amount and characteristics of the cement paste present. either from a bonding grout or from the concrete mix of the TBCO pavement when it is placed. For this reason, the study concentrates on the elements of cement chemistry which contribute to the bond.
Cement chemistry is complex and many phenomena, such as the formation of reaction products, and other mechanisms are not quite understood. To further complicate the problem, the presence and actual amount of reaction products is dependent on the cement composition, fmeness, and fabrication. Of necessity, cement chemistry, which is a very dynamic fteld of study, uses the stochastic approach.
Unhydrated or "dry" cement (there is always some moisture present) comprises four basic constituents, sometimes called Bogue's compounds after the man who ftrst identified them (Ref 51). These are:
(1) tricalcium silicate, abbreviated as c3s' (2) dicalcium silicate, abbreviated as C~S,

30
(3) tricalcium aluminate, abbreviated as C3A, and
(4) tetracalcium alumino-ferrite, abbreviated as C4AF.
In commercial cements, these compounds do not necessarily occur in pure form (Ref 52). It is now known that C3A and c;s are the most reactive compounds initially, with C3A being so chemically active that it must be tempered with gypsum in order to prevent what is called a "flash set." The aluminum promotes greater reaction with the alkaline constituents of the cement, thereby generating hydrogen gas and subsequent expansion of the mortar (Ref 53). Early strength gain is also reported with the addition of aluminum powder, up to one percent by weight of cement C,S and C1S are primarily responsible for the strength gain of cement paste, the influence of these two compounds being from C,S primarily, up to a four-week period, and C2S thereafter. The presence of C~AF in dry cement is basically a nuisance; it creates a colloidal substance which by adhesion hinders the further reaction of other compounds (Ref 54).
Portland cement, the most widely used of all cements in modern construction practice, becomes a bonding agent in the presence of a sufficient amount of water in a process called hydration. The reactions of all compounds of cement are exothermic and produce solid hydration products with cementing properties (high adhesive and cohesive properties), lower specific gravities, and correspondingly higher specific volumes than the cement compounds themselves. The structure of hydrated cement is comprised of (1) cement gel, (2) unhydrated cement particles, and (3) pores.
There are two types of pores in the hydrated cement paste: capillary pores and gel pores. Gel pores are very small and usually associated with the cement gel. They impart specific properties to the hardened cement paste (resistance to freezethaw, permeability, thermal properties, etc.). Capillary pores are much larger voids. Their size decrease appreciably as hydration progresses (Ref 55).
In all phases of hydration, water is present in two forms: evaporable water and non-evaporable water. Evaporable water can be removed from the cement paste by drying or some other physical processes. Non-evaporable water includes all chemically bound water, itsamountincreasesas hydration progresses and, thus, it can be used to gauge the degree of hydration of the paste; however it can never exceed one-half the total amount of water in a saturated paste. Water fills all the pores of the cement paste and must be present for the hydration to progress.
Two types of force may account for the strength gain of hydrated cement:
(1) Physical attraction between the greatly increased surface area of the cement gel particles; this attraction is termed van der Waals force and it makes up between 1/4 and 1/3 of the total bonding energy (Ref 55).
(2) Chemical bonding, most likely the ionic-covalent type, which closely resembles that present in ceramic materials. These chemical forces affect only a small fraction of the boundary of the gel particles and do not seem to require a high surface area.
From the preceding discussion, it can be said that the factors which contribute to the development and strength of the bond are the same as those which contribute to other strength properties of the cement paste, and, thus, of the concrete. The use of admixtures to enhance these properties is prevalent in modem concrete construction practice. Bonding admixtures are made from natural or synthetic rubbers, organic polymer or copolymer (including polyvinyl chloride, polyvinyl acetate, acrylics, and latex) and modified epoxy resins (Ref 52). The polymer formulations may also find application as waterreducing admixtures. The polymers are characterized by high molecular weights. During hydration, they are absorbed on the surface of solid products of hydration, but attach themselves primarily on the unhydrated cement particles; since solid particles of the cement paste carry residual electrostatic charges on their surfaces, which may be positive, negative, or both for any given particle, the polymer compounds of the admixtures are formulated to alter this condition so that the solid particles will carry the same charges. Thus, there will be repulsive forces created, resulting in an increased dispersion within the mix. Increased dispersion results in faster hydration and early strength gain. Also, water which is normally trapped within the solid particles is then freed and can contribute to lowering the viscosity of the mix, therefore reducing the water requirement for workability and increasing the strength and bonding properties. Conventional water-reducing admixtures can lower the water requirement 5 to 10 percent, whereas the newer high-range water-reducing admixtures, also called superplasticizers, can lower it even further (between 15 and 30 percent) (Ref 55). Admixtures for bond or strength enhancement are added at about 1 percent by weight of cement
Mechanical Properties
This section examines the mechanical/physical properties which have a bearing on bond development and strength between original and TBCO pavements.
Besides chemical action at the interface, certain physical factors must also be present to enhance the quality of bond. Basically, the bond is now observed at the macroscopic level; in the previous section observations were made at the microscopic level. The effect of fine and coarse aggregates must be taken into account At this stage in TBCO construction,

31
the aim is to build the overlay so that the original and TBCO pavements will aetas a monolithic structure. In such a structure, aggregate gradation and dispersion throughout the cement mix must be uniform, the strength of the concrete resulting from the strength of the mortar, the strength of the aggregate particles (i.e., their ability to resist stress applied to them), and the bond between mortar and aggregates. Note that the interface between aggregate and cement is usually the weakest region in mature concrete. However, the bonding, strength, and deformation characteristics of concrete are primarily governed by the cement phase, although they will be modified by the inclusion of aggregates. The physical properties of aggregates which may influence the bond include mineralogical composition and electrostatic and surface texture conditions. Other considerations governing the bond between aggregates and cement paste are stated in Ref 54 as follows:
... Bond is due, in part, to the interlocking of the aggregate and the paste owing to the roughness of the surface of the former. A rougher surface, such as that of crushed particles, results in a better bond; better bond is also usually obtained with softer, porous, and mineralogically heterogeneous particles. Generally, texture characteristics which permit no penetration of the surface of the particles are not conductive to good bond.
Because aggregate interlock intervenes as a physical condition of the interface bond, the original pavement surface must have a rough texture before overlay placement; the new concrete overlay will then have a bearing against the old concrete pavement The structural integrity of the substrate is paramount for development of a good bond since the strength of the bond is only as good as the strength of the material to which it is attached (Ref 52). This may require careful repair work of the base slab prior to overlay placement. Another necessary property of the base slab which deserves attention is a dry and porous surface which will allow absorption of the cement paste and will result in a more intimate contact between original and overlay pavements initially, and, thus, a stronger bond after curing of the placed concrete.
Finally, other bond variables associated with proper placement of the TBCO pavement include concrete vibration, water to cement ratio in the concrete mix, and porosity (i.e., air content), many of the same factors which control other types of strength also influence bond strength.
INTERFACE SHEAR MEASUREMENTS IN THE LABORATORY
The objective of this section is to summarize the shear strength data which was obtained over the past three years on three different research projects (Projects 357, 457, and 920) conducted at the Center for Transportation Research. As far as possible, statistical inferences are made from the available information and these serve as the basis for future discussion of interface bond strength.
Background on TBCO Construction in Harris County, Texas
During the summer of 1983, a 1,000-foot-long stretch of South IH-610 in Houston, was overlaid in an experiment utilizing five distinct designs of thin-bonded concrete overlay (see Ref 19). The sequence ofTBCO construction was as shown in Table 5. 7. This sequence resulted in eight concrete pours on eight different days.
Subsequent to these experimental sections, Texas SDHPT District 12, in Harris county (Houston area), decided to proceed with use ofTBCO technology; major rehabilitation work was planned on North IH-610 (North Loop 610). For the rehabilitation work, a uniform thickness of 4 inches nominal was adopted. Again, a few experimental sections were incorporated, with the following alternate factors:
(1) CRC overlay or fiberous concrete overlay, (2) use of super plasticizer in overlay concrete mix or not, and (3) various surface distress levels of base CRCP (minor and severe as defined by the visual condition survey variables).
The surface preparation technique used on the South Loop 610 experimental project consisted of rota-milling followed by sand blasting and air blasting; on the North Loop 610 rehabilitation project, it consisted in steel-shot blasting using the self-contained Blastrac machine with recyclable steel shots of varied sizes used in the Louisiana TBCO study (Ref 42). The Blastrac machine is capable of bombarding the surface of a pavement with steel shots, vacuuming the debris along with the shots, separating the shots from the pavement material using electro-magnets, and returning the steel shots for re-use.
If the machine is left operating in place for 30 seconds, it can cut up to one inch of concrete pavement surface.
Coring and Testing Methods
Retrieving concrete cores from the overlaid pavement was usually accomplished by SDHPT personnel utilizing a coring rig such as depicted in Fig 5.8. The equipment is mounted on a truck and can be positioned at or near the exact location desired with the help of an operator; lateral and longitudinal movement of the equipment is then used for final setting. The diamond tipped cutting head is rotated by a gasoline powered motor at high speed. It will cut through concrete and steel reinforcement

32
Water is used to control temperature. It takes approximately 10 minutes to retrieve a 4-inch--diameter core. Integrity of the cores is usually not a problem except when the coring takes place at a transverse crack. In the latter case, the core is usually not fit for interface bond testing. It is felt that the amount of energy imparted to the concrete during coring, a function of the core diameter, is responsible for this, rather than an actual loss of bond at all transverse cracks where an attempt is made to retrieve a core; thus, bond strength at transverse cracks cannot be estimated in the laboratory using direct shear strength of field specimens under currently used procedures. Laboratory testing is conducted using the apparatus described in Ref 18.
The shearing load is induced in compression using MTS equipment at a constant and uniform loading rate. The load cell used is attached to an HP plotter. The plotter is calibrated to read ultimate loads in pounds per inch on the graph. During the three years of testing for bond strength, the following procedures have emerged in an attempt to refine procedures and reduce that portion of the bond strength variability which can be assigned to testing:
( 1) All cores are now moisture cured for 24 hours in the moisture chamber at constant tempera-ture. This step was taken because there was
TABLE 5.7. DETAILS OF CONSTRUCTION SEQUENCING
ADOPTED FOR THE EXPERIMENTAL TBCO PAVEMENT OF SOUTH LOOP 610 IN HOUSTON, TEXAS (SUMMER 1983)
Phase Date Section Lane Length Number Constructed Designation Number (feet)
2
July 22, 1983 July 26, 1983 July 28, 1983 August 1, 1983 August 3, 1983
August 15, 1983 August 26, 1983 August 27, 1983
2"NR (1) 1 & 2 (2) 2"R 1&2 3"R 1&2 3"F 1&2 2"F 1&2
2"NR &2"R 3 &4 3"R 3 &4 3"F&2"F 3&4
(1) NR =Non-reinforced overlay section with nominal thickness of 2 inches (i.e., plain concrete design).
200 200 200 200 200
400 200 400
(2) Lanes were numbered outwardly (i.e., the lane next to the median was labelled Lane No. 1 and the lane next to the outside shoulder, Lane No.4.
Note: Two lanes were overlaid at a time.
often a long delay between core retrieval and testing and to bring all cores to the same moisture condition. (2) Before testing, both overlay and base slab portions are encased in separate rubber sheaths. This step was deemed
appropriate because of disparities and irregularities apparent on the lateral surface of some cores. In this manner, stress concentration can be eliminated or largely reduced, and variability between cores due to testing decreases. Coating specimens before testing is a well established method aimed at reducing or eliminating stratified/assignable variation due to testing. After investigating different possibilities for coating the lateral surfaces of circular and cylindrical cores, the rubber sheath method was selected for ease of use, convenience, and effectiveness.
Lo.boratory Results
In TBCO constrUction, a positive and durable bond must be established between the base pavement and the concrete overlay in order to achieve good performance of the strUcture. The existence and strength of the bond can be verified by taking
Fig 5.8. Rear view of the coring rig used to retrieve 4-inchdiameter concrete cores for laboratory testing of bond strength.
field cores and testing them in the laboratory for direct shear strength at the interface. Other points of interest relate to the variation of bond with time, load applications, core diameters between the various design sections, and with different surface preparation techniques.
Tables 5.8 and 5.9 present the results of the shear strength test for the South Loop 610 experimental project and the North Loop 610 rehabilitation project, respectively. The data are presented with the average (usually of three or more measurements) diameter of the cores-a variable which may influence the results. The core number is an arbitrary designation used to distinguish the various specimens. The same data are subsequently rearranged in factorial Tables 5.10 and 5.11.
The study now proceeds from these last two

33
tables. All the assumptions of General Linear Statistical Mod
TABLE 5.8. LABORATORY RESULTS OF INTERFACE SHEAR/BOND STRENGTH TEST ON FlEW CORES OVER A TWO-YEAR PERIOD- SOUTH LOOP 610 TBCO
els (GLM) are in effect; the val- EXPERIMENT oosofbond stten~. X (m ..... ____________________________________________________ ...._.
pounds per square mch), appear- Core Date Date Bond fig in the tables are assumed to Core Diameter Overlay Core Strength be mdependent and identically No. (inches) Placed Tested (psi)
1 2 3 4 5 6 7 8 9
10
distributed (liD) samples from a normal/Gaussian population with mean, mx and common variance, <J1 [i.e., X - n (m
1,
sl)]. The best estimate for the overall level of bond strength on the two TBCO projects is given by the grand mean, X111 = 225 psi, with a standard deviation S 111 = 99 psi based on a sample size 11
12 n111 = 61. Themeanvaluefor the South Loop 610 experimental project is X5 Loop = 204 psi, with a corresponding standard deviation a 5 Loop = 83 psi.; and a sample size N5 Loop = 32; comparable values for the North Loop 610 rehabilitation project are XN Loop = 249 psi; <JN Loop = 111 psi; and ~Loop = 29.
As stated before, the surface preparation techniques utilized on the two projects were differ
13 14 15 16 17 18 19 20 21 22 23 24 25 26 27 28 29 30
ent We must now test the hypothesis that one project site (a substitute variable for surface 31 preparation effect) gave rise to a 32
4.006 4.015 4.015 4.011 4.011 4.013 4.011 4.000 4.006 4.021 4.014 4.020 4.014 4.016 4.008 4.012 4.010 4.019 4.015 4.010 4.012 4.046 3.985 4.014 4.015 4.012 3.985 4.014 4.015 4.017 4.011 4.005
8/15/83 7!26/83 8/15/83 7!26183 8/15/83 7/26/83 7!28/83 7!26183 7!26/83 7!22/83 7!26183 8/15183 8!27183 8!26183 8!27183 8!27183 8!27183 8!27183 8/15/83 8!27183 8!27183 8/15/83 8/15/83 8/15/83 8/15/83 8/15/83 8/26/83 8!26/83 8!27183 8!27183 8!27183 8!27183
1112/83 11/2/83 1112/83 11!2183 1112/83 11/2/83 11/2/83 11/2/83 1112/83 11/2/83 11/2/83 1112/83 11!2/83 11/2/83 1112/83 1112/83 1112/83 11/2183 11!2/83 1112/83 1112/83 1112/83 12/4/85 12/4/85 12/4/85 12/4/85 12/4/85 12/4/85 12/4185 12/4/85 12/4185 12/4/85
254 241 347 356 407 237
79 223 301 238
83 165 247 142 116 111
95 130 205
95 166 197 249 182 138 332 200 206 205 182 158 254
Comments
Tested as received Tested as received Tested as received Tested as received Tested as received Tested as received Tested as received Tested as received Tested as received Tested as received Tested as received Tested as received Tested as received Tested as received Tested as received Tested as received Tested as received Tested as received Tested as received Crack visible along core Tested as received Tested as received Moisture cure +rubber sheathing Moisture cure +rubber sheathing Moisture cure + rubber sheathing Moisture cure +rubber sheathing Broke about 1/2 in. in CRC Moisture cure + rubber sheathing Moisture cure +rubber sheathing Moisture cure + rubber sheathing Moisture cure + rubber sheathing Moisture cure +rubber sheathing
higher bond stren~ than the ------------------------------------------------------other.
In this section, the Student's t-test is used as the statistic to construct confidence mtervals and draw inferences because m most cases the sample sizes are small.
The 95 percent confidence level is deemed appropriate and used throughout; finally, all hypotheses testmg is based on the one-tail criterion when alternatives are compared.
With these assumptions, the following results were arrived at:
( 1) The North Loop 610 cores have higher bond strengths than the South Loop 610 cores; since the surface preparation factor is significant, the analysis of the two projects must now proceed separately.
(2) Within each of the two TBCO projects, the overlay type effect was not significant at the 95 percent confidence level; i.e., from our core sample tested m the laboratory, the average bond strength of the steel-remforced concrete overlay is the same as the average bond sttength for the fibrous concrete overlay. Further, on the South Loop 610 project, the average bond sttength for the steel-reinforced overlay is statistically the same as that for the plam concrete overlay.
(3) Based on cores from the South Loop project, it was determined that the 2-inch thick section exhibited greater bond strength than the 3-inch thick sections.

34
(4) The effect of grout- TABLE 5.9. LABORATORY RESULTS OF INTERFACE SHEAR/BOND STRENGTH TEST ing on the bond ON FIELD CORES OVER ONE YEAR PERIOD- NORTH WOP 610 REHABIUTATION strength is not sig- PROJECT
nificant, based on Core Date Date Bond theSouthLoop610 Core Diameter Overlay Core Strength cores. No. (inches) Placed Tested (psi) Comments
(5) The lane location, a 1 3.741 N/A 2/28/86 309 Moisture cure + rubber sheathing substitute variable
for traffic loading 2 3.749 N/A 2/28/86 50 Moisture cure + rubber sheathing
intensity if one 3 3.755 N/A 2/28186 131 Moisture cure + rubber sheathing 4 3.754 N/A 2/28/86 79 Moisture cure + rubber sheathing
considers that 5 3.741 N/A 2/28/86 205 Moisture cure + rubber sheathing heavy trucks are 6 3.750 N/A 2/28/86 111 Moisture cure + rubber sheathing more likely to use 7 3.758 N/A 2/28/86 1400 Moisture cure +rubber sheathing the right-hand lane, 8 3.717 N/A 2/28186 230 Moisture cure + rubber sheathing does not have a 9 3.750 10103/85 4/28186 462 Moisture cure + rubber sheathing significant effect 10 3.762 10/03/85 4/28/86 360 Moisture cure + rubber sheathing
on the bond 11 3.763 10/03/85 4/28/86 337 Moisture cure +rubber sheathing
strength of South 12 3.880 10/03/85 4/28186 330 Moisture cure + rubber sheathing
Loop 610 cores. 13 3.781 10/03/85 4/28/86 245 Moisture cure +rubber sheathing 14 3.774 10/03/85 4/28/86 295 Moisture cure +rubber sheathing
(6) Age of overlay 15 3.778 10103/85 4/28186 513 Moisture cure +rubber sheathing concrete as meas- 16 3.778 10/03/85 4/28/86 >476 Moisture cure +rubber sheathing ured by the differ- 17 4.012 10/03/85 4/28/86 293 Moisture cure +rubber sheathing ence in time be- 18 4.027 10/03/85 4/28/86 157 Moisture cure + rubber sheathing tween placement 19 4.018 10/03/85 4/28/86 276 Moisture cure + rubber sheathing date and testing 20 4.020 10/03/85 4/28/86 323 Moisture cure +rubber sheathing
date has a signifi- 21 4.026 5127/86 5/29/86 438 Moisture cure + rubber sheathing
cant effect; in par- 22 3.748 5/27/86 5/29/86 326 Moisture cure + rubber sheathing
ticular, the 23 4.025 5/27/86 5/29/86 138 Moisture cure + rubber sheathing
eight-month-old 24 4.020 5/27/86 5/29/86 >394 Moisture cure + rubber sheathing 25 4.027 5127/86 5/29/86 216 Moisture cure +rubber sheathing
cores exhibited 26 3.775 5/27/86 5/29/86 281 Moisture cure + rubber sheathing higher bonding 27 3.743 5/27/86 5/29/86 175 Moisture cure + rubber sheathing strength than the 28 3.787 5/27186 5/29/86 186 Moisture cure +rubber sheathing two-month-old 29 3.761 5/27/86 5/29/86 175 Moisture cure +rubber sheathing cores from the 30 3.744 5/27/86 5129/86 363 Moisture cure +rubber sheathing North Loop 610 31 3.748 5/27/86 5/29/86 168 Moisture cure +rubber sheathing project. This effect cannot be estimated for the South Loop 610 project because there has been a change in curing and testing conditions.
Table 5.12 presents a summary of the calculations from which these results were derived. In closing, it should be noted that, given the small sample sizes (in most cases) used to make statistical inferences, a significant effect is indeed significant whereas an effect.not.significant might be significant if a larger sample were collected and the effect tested again; this assertion is built into the T -probability distribution function. The issue is not explored any further here, but the reader should keep this in mind when interpreting the results in Table 5.12.
ADEQUACY OF MEASURED BOND STRENGTH AND DEVELOPMENT OF A SAFETY FACTOR
Adequacy of Measured Bond Strengths
The question of the adequacy of measured bond strength must be addressed in light of the design objectives. Since it is desired that the base pavement and the TBCO act as a monolithic structure, the development of the bond at the interface must proceed such that the measured bond strength is at least one-half the shear strength of a .. virgin" specimen, that is a specimen without the weakened interface plane or, alternately, composed of either the base slab material only or the TBCO material only. Thus, the shear strength of the overlay (or the base slab) must now be related to the interface shear strength.
Shear is difficult to measure in the laboratory because shear cannot exist without the accompanying tensile and compressive stresses (Ref 52). Pure shear can be applied only through torsion of a cylindrical specimen; yet the concrete specimen

35
subjected to torsion will fail in diagonal tension because the material is weaker in tension than shear. With this in mind, it becomes necessary to correlate shear strength with other types of strength, preferably strengths which are readily available from quality control/quality assurance records of concrete pavement construction. The American Concrete Institute (ACI) proposes the following empirical equations to estimate the shear strength and the modulus of rupture from the compressive strength (Ref 56):
TABLE 5.10. FACTORIAL TABLE OF INTERFACE SHEAR/BOND STRENGTH FOR THE SOUTH LOOP 610 EXPERIMENTAL TBCO (PSI)
Lane Location (1) (Overlay Thickness)
Overlay Type
Interface Bonding Method
Inside-Two (2 inches)
Outside-Two · (2 inches)
Inside-Two (3 inches)
Outside-Two (3 inches)
Plain Concrete
Grout+ 238 Daraweld-C (2)
347 (249) (3) 407 (182)
No Grout
Steel-Mat Grout+ Reinforced Daraweld-C Concrete
No Grout
Fibrous Urout + Concrete Daraweld-C
356 223 301
83
241 237 142
111 95
(1) Two lanes at a time were overlaid.
254 205 197
165 (138)
(332)
247 (158) 166 (254)
79
130
116 (200) 95 (206)
(205) (182)
(2) Daraweld-C is a proprietary product used as a bonding admixture in this TBCO experiment (3) Numbers in parenthesis denote test series no. 2 data.
where f'
<
v <
f.
- 7.5.Jf;
= = =
compressive strength of concrete, psi;
shear strength of concrete, psi; and
modulus of rupture or flexural strength of concrete, psi.
Note that theseequationsarevalidonlywhen U.S. Customary Units are used. The equivalent metric equations have different constants. At the South Loop 610 project site, concrete beams were molded and tested in flexure after a seven day survey period. Although the specifications called for only 700 psi, all specimens were tested at a higher strength level, ranging from 730 to 992 psi; the average flexural strength was f, = 864 psi with a standard deviation sr = 75 psi (Ref 57). Thus, substituting the value f, = 864 psi in Eq 6 and solving for R(f '.) and substituting the latter in Eq 5 yields a value of shear strength of concrete, v~. approximately equal to 230 psi. As discussed previously, this value is expected to increase with age. A measure of this increase is provided by the North Loop 610 cores which showed a 38 percent increase on average in bond strength at the interface between two months and six months of age (see Table 5.10). Therefore, a conservative estimate of the adequacy ofTBCO bond strength in the field involves comparing the general level of field core bond strength measured in the laboratory (i.e., X111 = 225 psi) against the estimated value of shear strength of the whole specimen which could be made from the overlay concrete material (i.e., v. = 230 psi).
If the measured bond strength is in the range of 50 to 100 percent of the estimated overlay concrete shear strength, then, indeed, the bond development is
(5.5)
(5.6)
TABLE 5.11. FACTORIAL TABLE OF INTERFACE SHEAR/BOND STRENGTHFORTHENORTHLOOP 610 TBCO REHABIUTATION PROJECT,PSI
Overlay Type
Steel-Mat Reinforced Concrete
Fibrous Concrete
Test Series Number
1 2 3
309 339 50 462 326
205 360 138 111 337 216
330 281 245 175 295 186 513 175 293 363
168
131 157 79 276
140 323 230

36
adequate and the design can assume that a monolithic structure is in place. This being the case for the South Loop 610 TBCO experiment, it may be concluded that adequate bond strength has been achieved and that the south Loop 610 experimental TBCO pavement is performing satisfactorily with respect to bond capacity at the interface, and that the surface preparation technique used will normally deliver the expected bond strength. Finally, a note about the approach used to assess adequacy: a probabilistic approach may have been used, which would account for not only average values of bond and shear strength of the pavement concrete but also for the spread around the averages (i.e., standard deviation) to arrive at the probability of failure. Such an approach is illustrated in Ref 58.
TABLE S.ll. SUMMARY OF THE STATISTICAL METHOD USED TO MAKE INFERENCES ON THE BOND STRENGTH OF FIELD CORES TESTED IN THE UBORATORY
Average Standard T T Significance Effect Value, Deviation, Sample Test Table at 95 (a) Tested psi psi Size Statistic Statistic Percent
.CONSTANT 225.0 98.8 61
•SURFACE PREPARATION
s. Loop 610 204.4 83.0 32 248.7 110.6 29 1.779 1.645 X
N. Loop610
•OVERLA Y TYPE
S. Loop 610
2" Plain Concrete 259.9 78.3 8 0.944 1.746
2" Reinforced Concrete 221.8 90.0 10 1.174 1.761
2" Fibrous Concrete 171.8 66.7 6
3" Reinforced Concrete 139.2 59.7 5 0.843 1.943
3" Fibrous Concrete 172.3 38.4 3
N. Loop 610
4" Reinforced Concrete 267.1 112.4 22 1.635 1.703 4" Fibrous Concrete 190.9 87.6 7
•TIDCKNESS 2" Thick Overlay 222.0 84.6 24 2.202 1.645 X 3" Thick Overlay 151.6 52.5 8
•GROUTING Grout 178.4 90.2 11 1.168 1.771 No Grout 238.0 n.6 4
•LANE LOCA TIONtrRAFFIC Inside-Two 186.3 91.9 12
0.953 1.645 Outside-Two 215.3 77.6 20
•AGE Series No.2 (About 8 months old) 326.5 97.2 11
Series no. 3 2.272 1.729 X
(About 2 months old) 236.6 82.5 10
Note: (a) X = significant effect -- = not signicant

37
Development of a Safety Factor
By defmition, a factor of safety (FS) is defmed as
FS ;;::>: (strength/maximum stress) (5.7)
where strength is the value detennined by testing under conditions which approximate actual field conditions, and maximwn stress is the maximwn anticipated stress value under service conditions.
From the previous sections, a good estimate of bond strength is provided by the overall average measured bond strength X111 = 225 psi; the interface bond stress calculated at the interface of a TBCO and original pavement was 92 psi under snow removal equipment applying a horizontal load of 11,200 lbf through the blade to a 2-inch-thick TBCO pavement Thus, the factor of safety under these conditions is approximately 2.4. This factor of safety considers only the braking and snow removal equipment induced stresses and does not consider volume change stresses which may exceed those developed due to passing vehicles.
Note that a factor of safety is normally assessed based on the consequences of the design failure and the uncertainties attached to the strength and stress components. Based on these considerations, the data presented in previous sections, and the discussions of the nature and development of the bond, a factor of safety deemed adequate for the design of a TBCO pavement in order to guard against debonding is FS = 3. Until more conclusive data are collected, this value should be used for field installations ofTBCO in Texas.
SUMMARY OF BOND STRESSES
TBCO construction must account for bond strength at the weakened plane which is built between the original and overlay pavements. In this section, the stress placed on the bond by rolling truck tires (18-kip SAL's), temperature differential between the top and bottom of the pavement structure, and typical snow removal equipment was examined. It can be concluded that
(1) shear stress at the interface due to wheel loads was very low, probably inconsequential for integrity of the bond; and (2) typical snow removal equipment could induce high stresses, up to 92 psi.
The stresses investigated here, while important, do not encompass the entire range of forces influencing the interface bond performance. In particular, early age volume change stresses at the interface may adversely affect the long term performance of the overlay.
Next, the nature and development of the bond were studied, with specific attention to chemical and mechanical properties when a bonding cement grout is used.
Finally, bond strength measurements on the South Loop 610 TBCO project in Harris county, Texas, was used to formulate a criterion for adequacy of bond strength. The methodology employed a fixed effects GLM using statistical principles and empirical ACI relations between various types of concrete strength, to assess adequacy and estimate a safety factor of about 3.0 for the South Loop 610 experiment, where roto-milling was used for surface preparation of the original CRC pavement Calculations were not made for the North Loop 610 project, however similar techniques could be used.

CHAPTER 6. DISCUSSION OF RESULTS This chapter discusses various aspects of the methodology developed to this point in the report, and related issues. It then
expands on other issues, such as the need for timeliness ofTBCO in the design and rehabilitation processes of a PMS for rigid pavements at the project level.
COMPARISON WITH PREVIOUS PCC OVERLAY DESIGN METHODS A review of several rigid overlay design practices earlier in the report indicated a need for a new method which
specifically addressed the design of TBCO pavements as a rehabilitation alternative for original rigid pavements (CRCP, JRCP and JCP). Such a design method was then proposed. It is made up of a structural model, implemented mostly in the computer program TBCO 1.
Other aspects which must be considered in practice include selection of material (e.g., concrete admixtures) and concrete mix design. Although important, these fall beyond the scope of the present study; as in other design methods, many of these issues, along with controllable construction details, are resolved by carefully written plans and specifications.
In contrast to the proposed design method, most previous methods for designing rigid overlays of rigid pavements lack specifics or do not have provisions for handling key factors adequately. For instance, the Corps of Engineers method does not take into account material characterization. Further, the C-factor, which is by-in-large obtained by estimate, was shown to impact significantly the required overlay thickness for conditions requiring a relatively thin, partially bonded concrete overlay (see Figs 2.1, 2.2, and 2.3).
Methods for the design of rigid overlay pavements rely on accepted methods used for the design of rigid original pavements; these methods use a component layer analysis whereby a deficiency in the pavement thickness required for the new conditions becomes the thickness of overlay to be added to the old and cracked original pavement structures.
ENVIRONMENTAL EFFECTS Environmental effects on TBCO pavements include temperature and moisture effects. Differential temperature and
moisture conditions can be modeled within the TBC01 computer program. A temperature gradient can be entered directly as input to TBCOl a moisture gradient must frrst be converted to an equivalent temperature gradient, g_ ("Flinch), such that
&. = 2eja.D. where
2e = total differential shrinkage between slab top and slab bottom, I
a. = coefficient of thermal expansion of slab concrete (in./in.t'F), and D = top slab thickness (inches). .
Therefore, moisture and temperature differentials are confounded and may be discussed together under temperature (or moisture) effects only.
In actuality, temperature does not act independently on PCC overlaid rigid pavements; it acts in conjunction with other loads, in which slab weights are always present. However, linear-layered-elastic-theory assumes weightless materials with isotropic properties, etc. Thus, the theory cannot precisely estimate temperature effects in terms of horizontal shear at the interface, or tensile stresses at the bottom of the second layer, unless consideration of weights (as applied uniform loads) and temperature gradients (as applied constant moments) can be included in the analysis. On the other hand, plate theory (and FEM, which utilizes it) assumes that no shear deformation occurs in planes lying normal to the plane of the plate before bending and that such planes remain normal to the plane of the plate (i.e., midsurface) after bending; as a result, temperature effects reduce to tensile stresses which can be calculated at the underside of the original concrete slab, but in-plane shear stresses such as occur at the interface are not estimable.
In summary, a rigorous analysis of environmental effects on TBCO and original pavements must account for tensile and horizontal shear stresses since these are important to the design ofTBCO pavements for strength and the design of the interface bond for durability. This objective could be obtained by combining the two models in a hybrid model (or coupled model) such as suggested in Ref 76 or by amending either method to include the necessary tools to account for detrimental wheel loads, weights of the slabs, and temperature (or moisture) gradients.
REFLECTION CRACKING The mechanism for assessing reflection cracking ofPCC overlaid TBCO pavements is not different per se from the one
for PCC overlaid A CPs. However, variation in material properties (rhelogy, elastic constants, etc.) dictates the need for field
38

39
measurements coupled with theoretical modeling of PCC and TBCO pavements subjected to environmental stresses. Only such an approach can yield tangible results in the short term. In the longer term, performance data obtained from existing projects may provide invaluable information. These must include precise mapping of cracks in the original pavement prior to TBCO construction, the referencing of these cracks to fixed objects or stable benchmarks, and, again, mapping of cracks in the TBCO when these occur. Another area of fruitful investigation relates to the onset of reflection cracking for the specific conditions at hand. Nevertheless, the short-term performance of the South Loop TBCO project (Refs 19) suggests that the manifestation of reflection cracking distress may not be as severe as previously observed on PCC overlaid with ACP. Thus, the level of effort required for assessing reflection cracking must be balanced against future performance data in the mid and long terms of these two and other TBCO projects.
INTERFACE BOND CONDITION
The condition of the bond at the interface of a TBCO and an original pavement is a specific concern for this method of PCC rehabilitation. As indicated earlier in the report, the nature of the bond is both chemical and mechanical, when cement grout is used as a bonding agent However, the properties of the cement accounting for a good and durable bond are well controlled during manufacture; thus construction procedures are key to obtaining a good bond For exam ple,letting the grout dry before applying overlay paving (such as caused by delay in delivering paving concrete mix to the job site) will result in poor performance of bond.
Another area of special interest in the effort to obtain a good bond is surface preparation of the original PCC pavement prior to overlay placement First, it must be recognized that good surface preparation is conducive to development and preservation of a good bond. Ideally the surface of the original pavement would be free of loose debris,laitance, paint, grease and motor oil, deteriorated concrete at the surface, and so on. Second, the amount of surface preparation required, together with repair work prior to TBCO placement is, in general, vastly increased as compared to other rehabilitation alternatives. Indeed, this may add considerably to the overall cost of TBCO projects. Typically, cracks would be repaired (e.g., injected with liquid asphalt, modified cement grout, or epoxy), deteriorated joints repaired or replaced in part or in full, edge drains verified and repaired as appropriate, etc., before surface preparation by cold milling or shot blasting. Therefore, efficient designs must find a way to account for these items and justify them in light of an increase in performance variables.
NEED FOR AND TIMELINESS OF TBCO PAVEMENTS
In an efficient Pavement Management System (PMS), the need for a TBCO pavement as a rehabilitation alternative can be rationally investigated With present pavement construction techniques and experience, it is possible to build TBCO pavements which will provide many years of satisfactory performance.
The State oflowa Department of Transportation has had over 15 years of experience with TBCO pavements in highway applications (Ref 82). Renewed interest in TBCO technology (Refs 19 and 42) will result in an increase of the body of knowledge gained thus far and make this pavement rehabilitation alternative a viable candidate for consideration at the project level decision-making process.
Selection criteria for TBCO at the project level of a PMS include structural, economic, and administrative components. Elements of structural evaluation of TBCO pavements have been identified throughout this report and assembled in the computer programs labelled as TBCOI. The administrative component is less tangible because it is subjective in essence and depends on the individuals and particular agencies operating a PMS. However, to gain insight into this aspect, an informal survey among highway engineers, contractors, equipment manufacturers, and so on was conducted in December 1986 at a symposium held at the Balcones Research Center of The University of Texas at Austin. This group of parties interested in TBCO technology also had expert knowledge which could be tapped for our purpose. Note at this point that this method is not only valid, but is sometimes the only one available. It has been used extensively in other areas of Transportation Engineering, and methods such as the DELPHI method have been used in planning studies and are well documented (Refs 83, 84, 85 and 86).
At the closing of the Balcones Research Center symposium, the following warrants were identified by the panel and may be used as a starting point in the quest to select criteria for TBCO pavements at the project level; these are summarized hereafter:
(I) The use of a bonded concrete overlay has the potential to reduce user cost due to minimal delay during construction (since construction and curing are relatively fast because of the small quantities of concrete put in place).
(2) A TBCO pavement placed on a PCC pavement in good condition will extend its fatigue cracking life. (3) A TBCO pavement is warranted on the basis that it is faster than complete reconstruction; the technology now exists
forTBCO pavements. However, their use has to be justified as the appropriate solution in a specillc design situation.

40
(4) The use of TBCO pavements by a particular pavement agency would result in cost savings which could be spread over other rehabilitation projects because the operation is less costly than, say, complete reconstruction.
(5) TBCO pavements can be warranted on the basis of friction/skid resistance and riding quality of the existing pavement.
(6) A TBCO pavement has the potential to correct underdesign (in cases where an unexpected increase in traffic volumes or load limit occurs).
(7) Physical facilities, such as drainage system elements, and roadway geometry such as occurs at overpass bridges, may warrant the use of TBCO pavements over unbonded (hence thicker) concrete pavements.
(8) The use of TBCO pavements is warranted if it can be shown that it is a competitive alternative from an economic standpoint. Length of pavement and total quantities that must be placed at one ti.me (e.g., total square yardage involved in a particular rehabilitation project) before the method is cost-effective must be examined.
Other considerations which may affect the decision-making process relate to the performance of TBCO field installations. The serviceability-performance concept was fust articulated by Carey and Irick (Ref 87) as a result of the AASHO Road Test, and subsequently implemented in Texas by Hudson and Scrivner (Ref 88) and others. The concept has long since been incorporated in a rating system, the Present Serviceability Index, PSI; the history of the serviceability of a given pavement over time is called its performance. The method is widely used in pavement engineering practice, especially for planning and design. The serviceability-performance concept is as applicable to PCC overlaid TBCO pavements as it is to other typeS of pavements. However, one study based on an extensive condition survey data base of CRC pavements in Texas suggests that distress indices may be more appropriate tools in planning and scheduling of rehabilitation; it found that, due to heavy maintenance of CRC pavements, which generally carry high traffic volumes, the PSI could remain high while the pavement was approaching the end of its life from a structural viewpoint (Ref 64 ). In other words, pavement distress, in contrast to riding quality, would be weighted more heavily in deciding on rehabilitation schedules. Therefore, the pavement engineer should exercise caution in using the serviceability-performance concept for CRCP overlaid TBCO pavements under Texas conditions.
Field performance of TBCO pavements is influenced mainly by the construction variables, especially since in-place quantities of materials are, in general, small; smaller quantities of concrete are more susceptible to flawed construction techniques. Because the concrete material is sturdy and durable if properly prepared, TBCO pavements are likely to provide many years of good field performance. Therefore, attention to details and good inspection are necessary on TBCO projects. For example, grade control is an area which requires special attention. Another area of special attention during construction concerns the surface preparation. Concern has been expressed in the literature about the introduction of microcracks in the original pavements as a result of surface preparation techniques such as rotomilling. Modem concrete construction and evaluation techniques now provide the means to verify, in the field, the cracking condition of pavements; techniques, such as acoustic emission, laser holography, and radiation attenuation, have now been devised for this purpose. ACI Committee 228 (Non-Destructive Testing) sponsored a session at its annual meeting, in San Antonio in March 1987, which presented findings on and applications of the new techniques. These could be put to bear on field installations ofTBCO pavements in order to ascertain better construction techniques.
In closing this chapter, a discussion of the timeliness ofTBCO placement on original PCC pavements seems appropriate. Laboratory work (Ref 89) has shown the impact of placing the TBCO before a significant deterioration of the base slab: the number of load repetitions in the laboratory before a failure condition was reached increased drastically. This is expected to apply in the field as well. Thus, it can be postulated that the maximum benefit of using TBCO pavements as PCC pavements rehabilitation alternatives is achieved when they are placed before the original pavements are allowed to deteriorate appreciably. The optimum time for placement, however, can be determined only by laboratory and field experimentation. This is being pursued by ongoing research at the Center for Transportation Research, on Projects 457 and 920 which will explore various areas of design and implementation of TBCO pavements.

CHAPTER 7. CONCLUSIONS AND RECOMMENDATIONS In this chapter, the main conclusions derived from the study are presented, followed by recommendations for further
research and implementation of TBCO technology for the rehabilitation of rigid pavements.
CONCLUSIONS
l. A method for designing and analyzing TBCO pavements at the project level of a PMS is proposed; the method specifically addresses many aspects concerning the provision ofTBCO for the rehabilitation of CRCP.
2. The proposed method is mechanistic; it allows the consideration of various factors beyond those as yet implemented on field installations (a distinct advantage over empirically based methods). Candidate factors for consideration include type of paving material for the overlay pavement (e.g., epoxy modified concrete, silicate concrete, polymer impregnated concrete, steel fiber concrete and other synthetic fiber concretes, etc.), thickness variation in any increment for the overlay pavement, alternative designs, and so on.
3. Using deflection data, it is possible to model cracks in original pavements. The same approach could be used to "quantify" repair work prior to the placing of a TBCO on a rigid pavement; this results in a more efficient design.
4. A structural design tool forTBCO pavements in the form of a computer program named TBCO 1 was developed during the course of this study. It incorporates recent developments in concrete technology, advances in modeling afforded by the FEM, and the speed and power of a mainframe digital computer.
5. A framework was set out for understanding and analyzing reflection cracking and bond stress ofTBCO subjected to environmental stresses and applied wheel loads.
6. Loss of bond between the two pavements is a form of distress which may afflict this rehabilitation alternative. It must be carefully studied in order to be able to design properly TBCOs of rigid pavements. Specifically, the pavement design engineer must keep in mind the following points: (a) the nature of the bond is both chemical and mechanical; (b) the bond is subjected to repetitive traffic loading, unusual driving conditions, such as afforded by braking tires
and snow removal equipment, and environmental stresses; and (c) laboratory work must be used in conjunction with theoretical analyses to arrive at a measure of the adequacy of
the bond strength. 7. Most of the same factors which promote other types of strength are also beneficial to development and preservation
of bond strength. 8. Bond strength increases with age after overlay placement. Thus, attention should be directed toward obtaining the bond
initially and determining early-age strength development criteria. 9. Adequacy of bond strength can be specified in either of two ways:
(a) the shear strength at the interface of cores cut through the original concrete and overlay pavements must be in the 50 to 100 percent of shear strength value measured or estimated for the overlay concrete away from the interface and
(b) a safety factor of 3.0 or more is adequate to guard against failure, based on approximately three years of field verification from the South Loop 610 TBCO project
10. In our laboratory work, a limited sample size of 61 concrete cores from two TBCO projects was tested over a three-year time period; this revealed the following: (a) The Surface Preparation Technique has a significant effect on measured bond strengths of field cores at the 95
percent confidence level; (b) Overlay thickness. a substitute variable for concrete vibration level, has a significant effect on the measured bond
strengths; and (c) Between two and eight months after overlay placement, concrete age has a significant effect on the measured bond
strengths.
41

42
RECOMMENDATIONS
I. A data base of new TBCO projects should be carefully planned and should include technical as well as economic data.
2. Crack modeling of JRC and JC pavements should be conducted as soon as the data become available from on-going TBCO projects, and the results should be incorporated in computer program TBCOI.
3. Environmental effects on bond strength should be modelled; the modeling scheme should incorporate the weights of the two slabs and the subbase friction. The modelling should take into account the range of values for these variables which has been observed in the field, along with actual data points.
4. Bond testing of TBCO cores should be standardized so that results can be compared within and between projects (see Chapter 5). The standard should include testing equipment. core sampling, and specimen preparation prior to testing.
5. Durability and fatigue testing of bond would provide clues as to the mode of failure; this should be conducted keeping in mind that fatigue results in the laboratory are usually conservative when compared with field values.
6. The laboratory work on bond strength evaluation presented in Chapter 5 has provided important results. However, the data base should now be expanded with data so that factors which turned out "not significant" could be verified and defmitely classified.
7. Finally, surface texture should be quantified in the field so that it can be included in construction specifications and so that different surface preparation techniques can be used to deliver the required texture.

REFERENCES
1. "State of the Art of Rigid Pavement Design," Special Report 95, Highway Research Board, Washington, D. C. 1968.
2. McCullough, B. F., and Gary Elkins, "CRCP- Pavement Design Manual" Continuously Reinforced Pavement Group, October 1979.
3. "Highway Statistics" Federal Highway Administration, U.S. Government Printing Office, Washington, D. C., 1980.
4. Hutchinson, Ronald L., "Resurfacing with Portland Cement Concrete" NCHRP Synthesis of Highway Practice 99, Transportation Research Board, Washington, D. C., 1982.
5. Knutson, M. J., "Introduction to Concrete Overlays" 15th Annual ICPA Workshop, Des Moines, Iowa, February 15, 1979.
6. "PCC Pavements for Low-Volume Roads and City Streets" NCHRP 27, Transportation Research Board, Washington, D.C., 1975.
7. Bergren, V. Jerry, "Bond Portland Cement Concrete Resurfacing" Division of Highways, Iowa Department of Transportation, Ames, Iowa.
8. Ellis, David 0., and Fred J. Ludwig, Systems Philosophy, Prentice Hall, Inc., Englewood Cliffs, New Jersey, 1962.
9. Haas, Ralph C., and W. R. Hudson, Pavement Management Systems, McGraw-Hill Book Co., New York, 1978.
10. "Pavement Management Guide" Roads and Transportation Association of Canada, Ottawa, Canada, 1977.
11. "Pavement Management System Development" NCHRP Report 215, Transportation Research Board, November 1979.
12. Kulkarni, R., K. Golabi, F. Finn, and E. Alviti, "Development of a Network Optimization System" Final Report, Woodward-Clyde Consultants, San Francisco, California, August 1980.
13. Hudson, W. Ronald, B. Frank McCullough, F. H. Scrivner, and James L. Brown, "A Systems Approach to Pavement Design and Research" Research Report 123-1, Texas Highway Department, Texas Transportation Institute, and the Center for Highway Research, The University of Texas at Austin, March 1970.
14. Kher, Ramesh K., W. Ronald Hudson, and B. Frank McCullough, "A Systems Analysis of Rigid Pavement Design" Research Report 123-5, Texas Highway Department, Texas Transportation Institute, and the Center for Highway Research, January 1971.
15. Hudson, W. R., F. N. Bums, B. F. McCullough, K. Nair, and B. A. Valerga, "Systems Approach to Pavement Design, System Formulation, Performance Definition, and Material Characterization" Final Report, NCHRP Project 1-10, Materials research and Development, Inc., Oakland, California, March 1%8.
16. Schnitter, Otto, W. R. Hudson, and B. F. McCullough, "A Rigid Pavement Overlay Design Procedure for Texas SDHPT'' Research Report 177-13, Center for Highway Research, The University of Texas at Austin, May 1978.
17. Seeds, Stephen B., W. R. Hudson, and B. F. McCullough, "A Design System for Rigid Pavement Rehabilitation" Research Report 249-2, Center for Transportation Research, The University of Texas at Austin, January 1982.
18. Kandiah, Kailasananthan, B. Frank McCullough, and D. W. Fowler, "A Study of the Effects oflnterface Condition on Thin Bonded PCC Overlays" Research Report 357-1, Center for Transportation Research, The University of Texas at Austin, October 1984.
19. Bagate, Moussa, B. Frank McCullough, D. W. Fowler, and M. Muthu, "An Experimental Thin-Bonded Concrete Overlay Pavement" Research Report357-2F, Center for Transportation Research, The University ofTexas at Austin, November 1985.
20. Smith, Roger E., Michael!. Darter, and Robert L. Lytton, "Mechanistic Overlay Design Procedures Available to the Design Engineer" a paper presented at the 65th Annual Meeting of the Transportation Research Board, January 1986.
21. Luhr, David R., "Development of an Improved Pavement Design and Management System (PDMS)" Ph.D. Dissertation, The University of Texas at Austin, August 1983.
43

44
22. "AASHTO Interim Guide for the Design of Pavement Structures 1972. Chapter III Revised, 1981" American Association of State Highway and Transportation Officials, Washington, D.C., 1981.
23. Yoder, E. J ., and M. W. Witczak, Principles of Pavement Design, Second Edition, John Wiley & Sons, Inc., New York, 1975.
24. Tayabji, Shiraz D., and Paul A. Okamoto, ''Thickness Design of Concrete Resurfacing" Third International Conference on Concrete Pavement Design and Rehabilitation, Purdue University, West Lafayette, Indiana, April 23-25, 1985.
25. Packard, Robert G., and Shiraz D. Tayabji, "New PCA Thickness Design Procedure for Concrete Highway and Street Pavements" Third International Conference on Concrete Pavement Design and Rehabilitation, Purdue University, West Lafayette, Indiana, April23-25, 1985.
26. Treybig, Harvey J., B. F. McCullough, Phil Smith, and Harold von Quintus, "Overlay Design and Reflection Cracking Analysis for Rigid Pavements, Volume 1 -Development of New Design Criteria" Research Report No. FHW A-RD-77-66, Federal Highway Administration, Washington, D. C., August 1977.
27. Trey big, Harvey J., B. F. McCullough, Phil Smith, and Harold von Quintus, "Overlay Design and Reflection Cracking Analysis for Rigid Pavements, Volume 2- Design Procedures" Research Report No. FHW A-RD-77-66, Federal Highway Administration, Washington, D. C., August 1977.
28. Majid.zadeh, K., and G. lives, "Evaluation of Rigid Pavement Overlay Design Procedure, Development of the OAR Procedure" FHW A/RD-83-090, Worthington, Ohio, 1983.
29. McCullough, B. F., and K. J. Boedecker, "Use of Linear-Elastic Layered Theory for Design of CRCP Overlays" Highway Research Record Number 291. Highway Research Board, National Academy of Sciences, Washington, D. C., 1969.
30. Westergaard, H. M., "Stress in Concrete Pavements Computed by Theoretical Analysis" Public Roads, Vol. 7, No. 2, April1926.
31. McCullough, B. F., "A Pavement Overlay Design System Considering Wheel Loads, Temperature Changes, and Performance" Dissertation, University of California at Berkeley, July1969.
32. Desai, Chandrakant S., and John F. Abel, Introduction to the Finite Element Method, A Numerical Method for Engineering Analysis, Van Nostrand Reinhold Company, New York, 1972.
33. Merritt, FrederickS., "Structural Theory" Section G, Standard Handbook for Civil Engineers, Third Edition, McGrawHill Book Company, Inc., New York, 1983.
34. Gerstle, Kurt H., "Structural Analysis" Chapter 25, Handbook of Concrete Engineering, Van Nostrand Reinhold Company, New York, 1974.
35. Bathe, Klaus-Jtirgen, Edward L. Wilson, and Fred E. Peterson, "SAP IV, A Structural Analysis Program for Static and Dynamic Response of Linear Systems" Earthquake Engineering Research Center, University of California at Berkeley, April 1974.
36. Zienkiewicz, Olgierd C., The Finite Element Method, 3rd Edition, McGraw-Hill Book Company, Inc., London, 1977.
37. Timoshenko, Stephen P., and S. Woinowsky-Krieger, Theory of Plates and Shells, 2nd Edition, McGraw-Hill Book Company, Inc., 1959.
38. Tayabji, Shiraz D., and Bert E. Colley, "Analysis of Jointed Concrete Pavements" Portland Cement Association and Federal Highway Administration, Washington, D.C., October 1981.
39. Taute, Arthur, B. F. McCullough, and W. R. Hudson, "Improvements to the Materials Characterization and Fatigue Life Prediction Methods of the Texas Rigid Pavement Overlay Design Procedure" Research Report 249-1, Center for Transportation Research, The University of Texas at Austin, November 1981.
40. Programmer's Office, Center for Transportation Research, The University of Texas at Austin, ECJ Hall, Suite 6.10, Austin, Texas 78712
41. S. B. Seeds, B. F. McCullough, and R. F. Carmichael, "Arkansas Reflection Cracking Analysis and Overlay Design Procedure" Report No. US-3/1, Austin Research Enginers, Inc., 1983.

45
42. Temple, William H., and Steven L. Cumbaa, "Thin Bonded FCC Resurfacing" Final Report, Research Report 181, Louisiana Department of Transportation and Development, Baton Rouge, LA, July 1985.
43. Beer,FerdinandP.,andE.RusselJohnston,Jr.,MechanicsofMateria/s,Chapter5,McGraw-HillBookCompany,New York, 1981.
44. A Policy on Geometric Design of Highways and Streets, American Association of State Highway and Transportation Officials, Washington, D. C., 1984.
45. Cerruti, Valentino, "Ricerche intemo all' equilibria de' corpi elastici isotropi" Academia del Lincei Roma Memorie della Classe di Scienze Fisiche, Matematiche et Naturali, Ser. 3a, Vol13, pp 8-122, Roma, 1882.
46. "Skid Resistance" NCHRP Synbthesis of Highway Practice 14, Highway Research Board, Washington, D. C., 1972.
47. Todhunter, Isaac and Karl Pearson, A History of the Theory of Elasticity and the Strength of Materials .. From Galilei to the Present Time ... Volume II, Saint-Venantto Lord Kelvin, Part II, Cambridge University Press, 1893.
48. Boussinesq, M. Joseph, "Application des Potentiels a l'Equilibre et du Mouvement des Solides Elastiques, etc." Gauthier-Villars, Paris, 1885.
49. Holl, D. L. "Plane-S train Distribution of Stress in Elastic Media" Iowa Engineering Station, Bulletin 148, Ames, Iowa, 1941.
50. Kaplan, Wilfred, Advanced Calculus, Second Edition, Addison-Wesley Publishing Co., Massachusetts, 1973.
51. Orchard, Dennis Frank,Concrete Technology, Volume 1: Properties of Materials, Fourth Edition, Applied Science Publishers Ltd., London, 1979.
52. Troxell, George Earl, Harmer E. DAvis, and Joe W. Kelly, Composition and Properties of Concrete, Second Edition, McGaw-Hill Book Company, New York, 1968.
53. Concrete Manual, Bureau of Reclamation, U. S. Department of the Interior, Eighth Edition, Government Printing Office, Washington, D. C., 1975.
54. Neville, Adam M., Properties of Concrete, Third Edition, Pitman Publishing Ltd., London, 1981.
55. Mindess, Sidney and J. Francis Young, Concrete, Prentice-Hall, Inc., Englewoods Cliffs, New Jersey, 1981.
56. Leet, Kenneth, Reinforced Concrete Design, McGraw-Hill Book Company, New York, 1982.
57. Bagate, Moussa, B. Frank McCullough, and David Fowler, "Construction and Performance of an Experimental ThinBonded Concrete Overlay Pavement in Houston" Transportation Research Record 1040, Transportation Research Board, Washington, D. C., 1985.
58. Bagate, Moussa, "A Theoretical Study of Added Fatigue Life and Shear Stress" Technical Memorandum 357-22, Center for Transportation Research, The University of Texas at Austin, May 1984.
59. Clough, Richard H., Construction Contracting, Chapter V, Third Edition, John Wiley and Sons, Inc., New York, 1975.
60. Daniel, James Inman, "A Methodology to Determine and Optimum Time to Overlay" Master's Thesis, The University of Texas at Austin, December 1979.
61. Scrivner, F. H., W. H. Moore, W.F. McFarland,andG.R. Carey, "A Systems Approach to the Flexible Pavement Design Problem" Research Report 32-11, Texas Transportation Institute, Texas A & M University, College Station, Texas, October 1968.
62. Carmichael, Robert F., and B. Frank McCullough, "Modification and Implementation of the Rigid Pavement Design System" Research Report 123-26, published jointly by Texas Highway Department, Center for Highway Research, The University of Texas at Austin, and Texas Transportation Institute, Texas A & M University, January 1975.
63. Seeds, Stephen B., and B. Frank McCullough," A Design System for Rigid Pavement Rehabilitation" Research Report 249-2, Center for Transportation Research, The University of Texas at Austin, January 1982.
64. Gutierrez de Velasco, Manuel, "Rigid Pavement Network Rehabilitation Scheduling Using Distress Quantities" Doctoral Dissertation, The University of Texas at Austin, August ·1982.

46
65. Winfrey, Robley and Carl Zellner, "Summary and Evaluation of Economic Consequences of Highway Improvements'WCHRP Report 122, Highway Research Board, Washington, D. C. 1971.
66. Winfrey, Robley, "Motor Vehicle Running Costs for Highway Economy Studies" Arlington, Virginia, November 1963.
67. "A Manual on User Benefit Analysis of Highway and Bus· Transit Improvements, 1977" American Association of State Highway and Transportation Officials, Washington, D. C. 1978.
68. "Estimated Consumer Price Index, Central Texas Area" (vertical files), Bureau of Business and Economic Research, Hankamer School of Business, Baylor University, Waco, Texas, 1986.
69. Blet, Pierre, ''L 'Evaluation Economique des Pro jets Routiers" ENSTP, Ministere des Travaux Publics etdes Transports, Abidjan, Republique de C6te D'Ivoire, 1977.
70. Lindeburg, Michael R., "Engineer-in· Training Review Manual" Sixth Edition, Chapter II, Professional Publications, San Carlos, California, 1982.
71. Riggs, James L., Engineering Economics, McGraw-Hill Book Company, New York, 1982.
72. "Consumer Price Index Detailed Report" U. S. Department of Labor, Bureau of Labor Statistics, June 1986.
73. Smith, Roger E., and Robert L. Lytton, "Operating Characteristics and User Satisfaction of Commercially Available NDT Equipment" Transportation Research Record 1007, Transportation Research Board, National Research Council, Washington, D. C., 1985.
74. Liddle, W. D., and Dale E. Peterson, "Utah's UseofDynaflectData for Pavement Rehabilitation" Highway Research Record 300, Highway Research Board, National Academy of Sciences, Washington, D. C., 1969.
75. Kinchen, Richard W., and William H. Temple, "Asphaltic Concrete Overlays of Rigid and Flexible Pavements" Final Report, Research Report No. FHW A/LA-80/147, Louisiana Department of Transportation and Development, October 1980.
76. Majizadeh, Kamran, George J. lives, and Henry Sklynt, "RISC- A Mechanistic Method of Rigid Pavement Design" Proceedings, Third International Conference on Concrete Pavement Design and Rehabilitation, Purdue University, West Lafayette, Indiana, April 23·25, 1985.
77. Zaniewski, John P., B. C. Butler, Jr., G. Cunningham, G. E. Elkins, R. Machemehl, "Vehicle Operating Costs, Fuel Consumption, and Pavement Type and Condition Factors" Interim Report, Texas Research and Development Foundation, Austin, Texas, June 1980.
78. Curry, D. A., and D. G. Anderson, "Procedure for Estimating Highway User Costs, Air Pollution, and Noise Effects" NCHRP Report 133, Highway Research Board, Washington, D. C., 1972.
79. Claffey, P. J., and Associates, "Running Costs of Motor Vehicles as Affected by Road Design and Traffic" NCHRP Report 111, Highway Research Board, Washington, D. C., 1971.
80. Winfrey, Robley, Economic Analysis for Highways, International Company, Pennsylvania, 1969.
81. Knutson, M. J ., "Thin·Bonded Concrete Overlays" Fifty-eighth Annual Highway Short Course, College Station, Texas, 1984.
82. Boyer, Robert E., Paul T. Foxworthy, and William H. Higher, "Performance of Thin Bonded Portland Cement Concrete Overlays on Military Airfields" Second International Conference on Concrete Pavement Design, Purdue University, West Lafayette, Indiana, April14·16, 1981.
83. Dickey, John W. and Thomas M. Watts, Analytic Techniques in Urban and Regional Planning, McGraw-Hill Book Company, New York, 1978.
84. Dalkey, N. and 0. Helmer, "An Experimental Application of the Delphi Method to the Use of Experts" Management Science, Vol9, No.3, 1963.
85. Gordon, T. J., and 0. Helmer, "Report on a Long Range Forecasting Study" Report P·2982, The Rand Corportation, Santa Monica, California, September 1964.
86. Schneider, J. B., "Policy Delphi: A Regional Planning Application" Meeting Preprint 1454, Joint ASCI·ASME Meeting, Seattle, Washington, July 1971.

47
87. Carey, W. N., Jr., and P. E. Irick, "The Pavement Serviceability-Performance Concept" Bulletin 250, Highway Research Board, Washington, D. C., 1960.
88. Hudson, W. Ronald, and Frank H. Scrivner, "A Modification of the AASHO Road Test Serviceability Index to Include Surface Texture" Research Report 32-1, Texas Transportation Institute, Texas A & M University, College Station, Texas, May 1963.
89. Nayak, B. C., W. Ronald Hudson, and B. Frank McCullough, "A Sensitivity Analysis of Rigid Pavement Overlay Design Procedure" Research Report 177-ll,CenterforHighway Research, The UniversityofTexas at Austin, June 1977.
90. McLean, Robert A., and Virgil Anderson, Applied Facto rial and Fractional Designs, Marcel Dekker, Inc., New York, 1984.


APPENDIX A. CONCEPTS OF THE FINITE ELEMENT METHOD AND ITS IMPLEMENTATION IN COMPUTER PROGRAM JSLAB
The original program JSLAB was developed at the Construction Technology Laboratories, a Division of the PCA in Skokie, Illinois. The program used at The University ofTexas at Austin was obtained from the FHW A, the sponsoring agency, in the fall of 1984 and underwent minor changes during implementation on the Control Data Corporation's Dual Cyber 170/ 750 computer system, which provides the most computing capability for scientific applications at the University. JSLAB uses the Finite Element Method (FEM) to estimate (jointed) pavement response to loading, temperature gradient. moisture gradient, and any externally applied moment or displacement Before reviewing the capabilities and implication of JSLAB in a design situation, a brief description of the FEM is appropriate.
CONCEPTS OF THE FINITE ELEMENT METHOD
Introduction
Finite Element Methods (FEM) have been used for a variety of purposes in engineering and scientific applications. In many of these applications, complex phenomena are modeled when no simple analytical formulation available. Usually, one must resort to numerical approximations. FEM is one such technique. As compared to problems which have an analytical solution (following some simplifying assumptions as needed) valid for an infinite number of points in the continuum, theFEM solutions are initially obtained only at discrete nodal points of the continuum. The method was originally developed for structural mechanics but has since grown with the advent of high-speed electronic digital computers to cover such diverse fields as heat flow, seepage, hydrodynamics, fluid mechanics, rock mechanics, and electrical engineering.
FEM has been sucessfully used for a wide variety of "boundary value problems" in engineering. In such problems, a solution is sought in the region of the body for a dependent variable quantity while on the boundaries (or edges) of the region, the values of the dependent variable (or its derivatives) are prescribed (Ref 33). There are three major categories of boundary value problems:
(I) equilibrium or steady-state problems, (2) eigenvalue problems (e.g., determination of natural frequencies and modes of vibration of structures), and (3) propagation or transient-state problems.
This report concentrates on the structural analysis of pavement structures which falls in the first category of boundary value problems described above. There are basically two methods of structural analysis available to design engineers:
(I) the displacement (or stiffness) method, and (2) the force (or flexibility) method.
In the displacement method, nodal displacements are chosen as unknowns (or redundants ). The choice is made such that geometric compatibility is satisfied. Subsequently, the displacements are determined from a set of equations insuring equilibrium of applied forces at each node.
For the given displacements, forces, stresses and strains can now be determined at every node throughout the structure (Refs 34 and 35) using stress-strains relations (constitutive equations) and equilibrium relations.
Historically, the displacement method was the latest to come into use. It uses strain energy indirectly and stiffness coefficients. A stiffness coefficient. 111i' is defmed as the force required at node i in order to induce a unit displacement at node j, and node j only (Ref 35). Many simultaneous equations arise from this method. They are easy to formulate (but tedious) and tedious to solve. The displacement method is readily adapted to computers.
In the force analysis method for indeterminate structures, forces are chosen as redundants. The choice is made so that static equilibrium is satisfied. These forces are then determined from a set of equations which insure geometric compatibility of all displacements at each node. For the calculated forces, displacements, stresses and strains can now be determined at each node throughout the structure using stress-strain and equilibrium relations.
Historically, the force method was the first used to analyze statistically indeterminate structure. It uses strain energy directly and flexibility coefficients. The flexibility, fii' of a structural element can be defined as the displacement (linear or angular) due to an applied unit force (load or moment) at node j. Note that the flexibility is a property of the element, not of the loading. Usually, few equations will arise from this method. They are difficult to formulate but easy to solve. The force method is difficult to program for computers.
When choosing between the two methods, it is important to keep in mind that the number of unknowns in the displacement method is equal to the number of degrees of freedom at nodes, whereas it is equal to the degree of indeterminacy in the force
49

50
method; the fewer the number of unknowns, the faster and more accurate the analysis. Also, the availability of computer programs may direct the choice of the method of analysis, and most computer programs are now written for the displacement method.
The Mechanics
The Finite Element Method (FEM) for structural analysis consist of six basic steps:
(1) discretization of continuum,
(2) selection of shape/displacement models,
(3) derivation of element stiffness matrix,
(4) assembly of overall stiffness matrix for the discretized continuum,
(5) resolution for unknown displacements, and
(6) computation of element stresses and strains.
These steps are expounded hereinafter. Discretization of the continuum is that process of decomposing in a purely intellectual way the continuum or physical
entity (e.g., deformable body, fluid mass flowing per unit time, etc.) in a number of parts called finite elements. These elements are assumed to be interconnected only at discrete points, called nodes or nodal points. The discretized continuum must be analogous to the initial continuum and retain the same material properties. Depending on the analysis and the geometry of the initial continuum, the finite elements used can be one-dimensional, two-dimensional, or three-dimensional. Typical elements used in FEM are shown in Fig A. I along with their characteristic nodal arrangements after Refs 33 and 36. The discretization process is mainly one of engineering judgement in which and element's shape, size, and number must be carefully chosen for the problem at hand.
Selection of the displacement or shape model encompasses selection of a function (usually a linear polynomial but also trigonometric and other elementary functions) to describe the magnitude and type of variation of the displacements for each element The displacements are usually considered to be nodal displacements and no rigid-body displacement is allowed. The displacements may also involve derivatives at some or all nodes. At this stage of the analysis, some ingenuity is required.
Derivation of an element's stiffness matrix is accomplished using the principle of virtual work, strain energy considerations, or some other variational principle. A variational principle, according to Zienkiewicz (Ref 37), specifies a scalar quantity, p, such that
7t = I F(u.u· .... )dn+ I G(u.u· •... )dr (A.1) n r
where F and G are specified operators and U is an unknown function which is sought so that the functional p will be stationary with respect to small changes, dU. A trial function, U, is used such that
(A.2)
where
Ni = a shape function prescribed in terms of independent variables (e.g., coordinates X, Y, ... )at node i and
ai = parameters associated with Ni at node i.
If a solution, U, can be found, then the variational approach to discretization will always yield symmetric matrices; this is a key advantage in that calculations and computer storage requirements are eased tremendously. Two general types of variational principles can be distinguished:
(1) "natural" variational principles and
(2) "contrived" or "constrained" variational principles.
Natural variational principles include minimization of total potential energy in a mechanical system to achieve equilibrium, least energy dissipation in viscous flows, etc. "Contrived" variational principles can always be found whenever a problem can be specified in differential form by extending the number of unknown functions, U, either by adding Lagrange

(a) One-dimensional element.
Triangular Element Rectangular Element
C] 4~3
,L __ ~~L O:.Jad:-ilateral :lement
Quadrilateral Formed by Four Triangles
Quadrilateral Formed by Two Triangles
2
(b) Plane stress, plane strain, two dimensional elements.
2 Three-Dimensional Solid "Brick" Element
2 Tetrahedron
3
5 ,L-: -/?l____,.s 2
Hexahedron (Cu::>oid) Eiame~:
1~? ~-
P1oe Element
(c) Three dimensional elements.
Fig A.l. Various element characteristics used in FEM (after Refs 33 and 36).
51
multipliers or by adding a higher degree of continuity requirements in a way similar to least squares and penalty functions problems.
The next step after derivation of the element's stiffness matrix is assembling these in the overall stiffness matrix for the discretized continuum. In this process, an important aspect is compatibility of nodal displacement with that of adjoining elements. A set of simultaneous equilibrium equations must now be established. How~ver, these will be solved only after boundary conditions have been taken into account
Subsequently, the equilibrium equations are solved for unknown displacements. In general, this step is a direct application of linear algebra techniques for solving large number of simultaneous equations. For nonlinear problems, a recursive technique must be used involving modification of the overall stiffness matrix and a loads/ applied forces vector at each step until convergence is achieved.
Finally, given the displacements detennined in the previous step, stresses and strains can now be computed for each element by combining constitutive equations, material properties, and displacements.
Validity and Application to Pavements
In the classical bending theory of plates Ti-moshenko et al (Ref 37) distinguishes three cases:
(1) thin plates with small deflections,
(2) thin plates with large deflections, and
(3) thick plates.
Pavements fall into the frrst category. Deflections are small with respect to pavement dimensions so that they do not alter the effects of applied loads during bending; thus, energy conservation and load superposition principles can be applied. The classical theory further assumes:
(1) No defonnation occurs in the mid-plane of the plate during bending.
(2) Planes initially nonnal to the mid-plane remain nonnal after bending. Therefore, nonnal stresses in a direction transverse to the plate can be disregarded for bending analysis.
The application of FEM to pavement structures takes as its starting point the same considerations inherent to the classical bending theory of plates. Thus, the results obtained from FEM are valid if and only if the inherent assumptions listed above hold true. During bending, the state of defonnation (and hence of stress) of a pavement

52
slab can be described entirely by the lateral displacement of the mid-plane, W. Timoshenko et al (Ref 37) have derived a differential equation, which relates W to the applied transverse load and pavement, and support medium characteristics; this equation reduces to the well known biharmonic equation in the case of an isotropic slab with constant thickness, as follows:
0 --+2 +-( il'w a'w a'w) ax4 ax2av2 av4 q-kW (A.3)
where
w = deflection of the middle plane of the plate, X,Y = local coordinates system,
q = applied lateral load, and
k = modulus of subgrade reaction.
and
0-E t
3
, stiffness of slab 12(1-V')
(A.4)
where
E = Young's modulus of the plate,
v = Poisson's ratio of the plate, and
= thickness of the plate.
This equation is attributed to Lagrange, 1811. It has been solved by many investigators using various approximation techniques. Any consistent set of units can be used in Eqs A.3 and A.4 (e.g .. psi, inch, pound and pci).
The approach used in FEM is to set W as the unknown shape fWtction which is sought so that the total potential energy of the plate subjected to transverse loading, q will be stationary with respect to small changes. Continuity requirements are specified not only on W between adjacent elements, but also on its slopes. By definition, this is the case for a C1 continuity problem (Ref 37).
Rectangular elements lend themselves readily to modeling pavement structures. These have been used in Refs 33, 37, and 39. Trial functions have been formulated as polynomials. The formulation used in JSLAB after Zienkiewicz (Ref 36) is a partial fourth order polynomial in the plane coordinates X andY (only the quartic terms X4 , ~.and Y4 are missing from the trial shape function). C1 continuity is required for engineering problems formulated in fourth order differential equation form; however, this must sometimes be relaxed. The resulting shape function is denoted non-conforming and is justified on the basis of the patch test The patch test is a test to ascertain whether a patch of elements subject to constant strain reproduces exactly the constitutive behavior of the material and results in correct stresses when it becomes infinitesimally small. The test is an indicator of convergence order which is to be expected; it is also a necessary and sufficient condition for convergence.
Summary and Discussion of FEM as it Applies to Pavements
FEM is a numerical technique which was developed with the advent of electronic digital computers. It represents a continuum as an assembly of subdivisions called fmite elements interconnected at discrete points called nodes (or nodal points). Elementary fWtctions called shape/displacement fWtctions are used to describe the displacement of each finite element, and hence of the continuum subjected to varied forces or loading conditions. A variational principle is then used to obtain a set of equilibrium equations for each element and thus derive the element stiffness matrix. From the element stiffness matrix, the overall stiffness matrix is assembled using displacement compatibility criteria between adjoining elements, and boundary value considerations. The overall stiffness matrix and the resulting equilibrium equations system are solved for the unknown displacements. Finally, displacements are used together with constitutive equations to determine response variables, such as stresses and strains, throughout the continuum.

53
Because it proceeds "from part to whole,. in a way similar to the human brain, FEM is intuitively appealing for analyzing complex systems. On the other hand, the procedures used can be interpreted from a rigorous mathematical view point (e.g., minimization of total potential energy).
Manipulation of large amounts of data and the need to solve numerous simultaneous equations in most cases dictate the use of a mainframe computer facility. The mathematics involved are usually simpler and more compact in matrix form. FEM takes advantage of successive approximations made available by computers to accommodate ( 1) nonhomogeneous material properties, (2) nonlinear stress-strain behavior, and (3) complex boundary conditions.
As applied to pavementstructures,FEM provides much flexibility arising out of the discretization process. As such, loads can be input at any location on the pavement; complex loading gear assembly can be accounted for, variable material properties can be accommodated, and hence realistic modeling of cmcks can be accomplished. Varying support conditions such as the presence of voids underneath pavements, can also be modeled. Uniform temperature distribution, such as temperature drop or rise, can be accounted for. Differential tempemture between top and bottom causing the slab to warp can be accounted for. Equally, differential moisture conditions causing a slab to curl can be accounted for. Finally, load transfer devices, such as dowel bars, can be modeled as beam elements, and their effects can be accounted for.
INPUT TO JSLAB Input to program JSLAB can be categorized as follows:
(1) title, (2) discretization (viz, X and Y coordinates of all nodes), (3) material properties, (4) loading, (5) load transfer devices, (6) applied moments, and (7) initial displacement
The input is arranged in a total of 24 possible cards. However, these are not all required for specific runs. JSLAB can handle up to nine sepamte slabs resting on a Winkler foundation. The slabs can be composed of a single or
double layer with no bond or full bond between layers. This feature allows a stabilized subbase or an overlay to be considered in the analysis.
At joints, three types of load transfer mechanism can be specified in JSLAB as input: (I) dowel action, (2) aggregate interlock, and (3) keyway. Loads on the pavement can be input at any point as pressure loads, and at nodes they can be input as concentrated loads. Initial moments and displacements can be input at specific locations.
Inherent to the discretization process, variable material properties (e.g., concrete modulus of elasticity for one or two layers), variable pavement support (including loss of support), and variable element thicknesses can be input to JSLAB. Finally, warping behavior due to vertical temperature differential, and curling differential due to vertical moisture differential can be analyzed by specifying an appropriate initial moment along the pavement edges.
A few possibilities offered by the capability and flexibility of JSLAB in a design situation are the following:
(1) mechanistic design of overlay pavements resulting from the two-layer analysis feature. (2) selection of appropriate Load Transfer Devices (LTD), dowel spacing, etc., based on stress analysis, (3) consideration of tied shoulders by specifying the appropriate longitudinal load transfer mechanism, (4) consideration of thickened edge pavements by varying edge elements thicknesses, (5) simulation of voids underneath pavement slabs by specifying no support under adjoining elements, the number of
which can be varied to simulate void size, (6) simulation of maintenance effects by specifying a different modulus of elasticity (e.g., asphalt or polymer concrete
patching) for elements corresponding to the patched areas, and (7) determination of material properties based on deflection data using an itemtive scheme where either or both
deflection at cmck and at midspan positions can be utilized.
An input deck used to calculate theresponseof a typical highway CRCP to a standard 18-kip single-axle load is presented in Appendix B.

54
OUTPUT OF JSLAB
Output of program JSLAB consists of an echo print of input variables followed by the results of the structural analysis as follows.
First, dowel shear and dowel moment at each node along each joint is given when applicable. Second, stresses, deformations (i.e., deflections and rotations), applied loads and moments are shown at each node. The
stresses are indicated separately for the top layer and the bottom layer in two positions: layer top and layer bottom. In-plane shear stresses are output as is the vertical deflection at each node.
Finally, the program echo prints the modulus of subgrade reaction for each element of the discretized pavement. A sample output resulting from the input mentioned above is presented in Appendix B.

VI VI
APPENDIX Bl. SAMPLE INPUT OF PROGRAM JSLAB
This is a sample of input to computer program JSLAB used to simulate a CRC pavement with a longitudinal joint at a 12-foot width overlaid by a TBCO; a two-layer analysis is considered. The loading is a standard 18-lcip SAL with dual tires inflated at 75 psi each. This run uses "soft" elements at 8-foot intervals in the CRCP to simulate a crack. Note the flexibility afforded by the program, resulting in realistic design conditions.
r 1 I( 1
l Ff. tNf.l_\'~q;~ OF 'I Cf•CP II/ r_ JI'Ct1 P.AV'I-',[!lT. Bl DACfT[ ~.-t~R ~~ 198~ , _,
' ('.
1 :-r;. ~ ~ ( ..
~·. 1 " If •
u 0
"· 1 ~B • ::_~(·.~ .
r.. 144.
2 fl2 • ?:tH •
·-- ~
:'';. l ~) (l •
? A:? •
2". l'lO.
,., ,, ~.
1 (Pl.
2 f' 11 •
It?. lf;R.
52GODUC. 470JOaO. .~ .2 2. R. r o o n ~4 o o o
5~.
llif...
£,(,.
18£..
300. 1. 0 0
72. 19P..
102. 2lla
.oa
1 r.orc5 2 7.aro~ J 7.oro5 ~ 7.0E05 5 9 7.~F05 10 7.~ro~ 11 7.oro~ 12 7.0E05 13
7.0E05 r. 7.0[05 1 7.DE05 14 7.oro5 15 7.0[05102 7.0£05103 l.Of.05110 7.0[05lll 7.0[05198 7.0[05199 7.0[0520(. 7.0[05207 7.0[05294 7.0[05295 7.0E05J02 7.oro5J03
'H 7.0r115 'JH 7.:;1~05 '19 J.QFO!:ilfiO 7.0[05101 105 7.0f05106 7.~fr~1U1 7.J[0510R 7.0[05109 J93 7.0EG519~ 7.0[0~195 7.0E05l~L 7.0[05197 2r1 1.orcs2o2 7.oco5203 7.0E052Q~ 7.0E0~205 789 l.PEG5290 7.0[05291 J.OE052q2 l.OE05293 r97 7.0[t529P 7.0[0~299 7.0[053~0 7.0[0~3Cl
H lfO ]3."i 18. ll.'5 17.8 181 13.5 lB. 0 .(, 6.9 lfl3 13 .,!;, lt~. 4.6 10.9 1 J13 13.5 111. 17.7 18. l fl~ 13. ~~ 111 • o. 6. l% 0. 6. 11.5 17.R l'J7 o. "· .6 r..9 199 o. (,. 4.6 10.1 199 o. u:. 11.7 18. 2 I'() IJ. ( .. o. 6.
1'\
1!5· 75. 75. 75. 75. 75. 75. 75. 75. 75.
0.023
90. 21£..
12 (). 246.
1. Or.'05 B l.OE05 16 7.0[05104 7.0[05112 7.0[05200 7.0[05208 7.-0EO 52'? C. 7.0[05304
192. 2~4.
UP.. 264.
7.0[05 7.0[05 7.0[05 le0[05 7.0[05 7.0[05 7.0[95 7.0[05
4.0[06

~
APPENDIX B2. SAMPLE OUTPUT OF PROGRAM JSLAB
Output of program JSLAB produced by the input in Appendix B I. The response variables are calculated at every node of the discretized pavement structure.
ANALYSIS OF JOINTED CONCRETE PAVEMENTS NO. OF PROBLEMS= 1
****FE ANALYSIS OF A CRCP W/ A TBCO PAVEMENT. BY BAGATE H.-APR 22 1985 ****
X( I)= 0. 6. 24. 42. 54. 72. 90. 102. 120. 138. 150. 168. 186. 198. 216. 234. 246. 264. 282. 288. Y( I)= 0. 6. 24. 42. 66. 102. 120. 138. 144. 144. 150. 168. 186. 210. 246. 264. 282. NO. OF ELEMENTS= 304 NO. OF NODES= 340
UPPER AND LOWER LAVER MODULUS= 5200000.00 4700000.00 UPPER AND LOWER LAVER POISSONS RATIO= .20 .20 UPPER AND LOWER LAVER THICKNESS= 2.0 8.0 SUBGRADE MODULUS= 300.0 COMPOSITE ACTION FACTOR=1.0 LAVER ONE UNIT WEIGHT= .1 COEFFICIENT OF THERMAL EXPANSION= .00000000 TOP LAVER TEMPERATURE GRADIENT= .0
NUMT1= 0 NUME1= 0 NUMSUB= 0 NUHT2= 0 NUME2= 64 ITEHP= 0 IPLOD= 0 IMOMX= 0 IMOMY= 0 IDISP= 0
NO. OF LOADS SPECIFIED= 1D NEL Xl X2 Vl V2 PRS
180 13.50 18.00 11.50 17.80 75.00 181 13.50 18.00 .60 6.90 75.00 183 13.50 18.00 4.60 10.90 75.00 183 13.50 18.00 17.70 18.00 75.00 184 13.50 18.00 .oo 6.00 75.00 196 .00 6.00 11.50 17.80 75.00 197 .00 6.00 .60 6.90 75.00 199 .oo 6.00 4.60 10.90 75.00 199 .00 18.00 17.70 18.00 75.00 200 .oo 6.00 .oo 6.00 75.00
LTDX= 0 DINX= .000 DOUTX= .000 DEX= .o DSX= .o SHAX= .00000 DIX= .00000
. 0 AGGX= 0 .
LTDY= 0 DINV= . 000 DOUTY= .000 DEY= .o DSV= .o DJWX= .000 DPRX= .00 OCIX=
OJWV= .023 DPRY= .00 OCIY=
.4679E+Ol
.0 AGGY= 4000000 . SHAY= .00000 DIY= .00000
UN( DETERMINANT) .2014D+05 EIG. RATIO .GT.
NO. OF NODES NOT IN CONTACT,NSUBZ= 1
UN( DETERMINANT) .20140+05 EIG. RATIO .GT. .1.1679E+Ot

APPENDIX C. PAVEMENT SURFACE DEFLECTION DATA ACQUISITION USING THE DYNAFLECT DEVICE, AND OPERATIONAL MODE USED
AT THE SOUTH LOOP 610 EXPERIMENTAL TBCO SITE
Perhaps the most widely used pavement surface deflection data acquisition system in North America, the Dynaflect device provides the engineer rapid and accurate (in the sense of repeatable) data for the evaluation of pavement structures. Dynaflectis a brand name which was first put forth by Lane-Wells, the manufacturer, and subsequently preserved by DresserAtlas, the offspring company.
Non-destructive testing, and especially Dynaflect, has been used for various reasons, including material characterization, crack/joint load transfer estimation, and void detection.
THE DYNAFLECT SYSTEM
The Dynaflect system consists of a small trailer towed behind a standard automobile, and the control unit, which is located inside the vehicle. Cables between the trailer and the tow vehicle provide power and allow control of the unit from the driver's seat Therefore, a crew of two is necessary to make Dynaflect measurements in the field. The trailer can be towed at highway speeds to a test site. At that point the operator hydraulically lowers two steel loading/force wheels 20 inches apart; the Dynaflect weight, approximately 1,600 lb (726 kg), is entirely supported by the loading wheels. This applies a static preload to the pavement; a dynamic load is then added to this preload such that its peak-to-peak magnitude does not exceed twice the static preload. This condition ensures that the trailer does not bounce off the pavement as the test proceeds (Ref 73). The dynamic load varies sinusoidally from 500 lb upward to 500 lb downward at a driving frequency of 8 cycles per second (i.e., 8Hz). The resulting 1,000-lb peak-to-peak load is generated by two counter-rotating unbalanced flywheels (rotation speed at 480 rpm) and is transmitted vertically through the loading wheels. Due to the counter rotation, all horizontal reactions cancel themselves out It can be reasonably assumed that the loading wheels each carry one-half the total peak-to-peak dynamic load, of 500 lb. The estimated applied pressure is 167 psi. The steel loading wheels are normally covered with rubber; they measure 15 inches outside diameter and are 4 inches wide.
The pavement deflections induced by the Dynaflectdevice are expressed in milli-inches or mils (thousandth of an inch) and range from O.Ql to 30 mils (Ref 74.). They are measured between the loading wheels by five velocity transducers or geophones (sometimes called sensors). The geophones are suspended from a placement bar and normally spaced at 12-inch intervals, with the first geophone located midway between the loading wheels. To take a set of readings, the operator lowers the geophone placement baron to the pavement and operates the force generator. The newer types ofDynaflect provide digital readouts of all 5 geophones simultaneously and have an optional terminal to record the data (Ref 73).
After a set of readingsis made, the Dynaflect can be towed to the next location on the loading wheels at a speed of between 5 and 10 mph. Depending on the specific requirement the tests take about one minute to run, thus upwards of 50 sets of readings per hour can be achieved Figure C.1 presents the Texas SDHPT' s Dynaflect in operation. Figure C.2 is a layout of the system, which shows the geometry and other physical features of the equipment and the pavement structure. Note that the loading wheels create two basins which are superimposed to yield the typical basin subsequently illustrated (Fig C.3). In most likelihood, the spacing between the loading wheels was selected to match the spacing between duals of a standard 18-kip
-• 0 0
441" §
Fig C.l. The Texas SDHPT's Dynajlect in operation at the South Loop 610 TBCO experiment site. Note raised trailer wheels and geophones lowered onto pavement surface.
57
single axle load by the designers of the Dynaflect at the time it was developed. Also, recall that the precursor of the Dynaflect is the widely-used Benkelman Beam, which for decades was solely used to measure pavement deflections and that this apparatus was used in conjunction with a dump truck with 18-kip rear axle loading; the Benkelman Beam deflection measurements were made between duals.
Figure C.3 exhibits a typical Dynaflect deflection basin along with the parameters used by various researchers in an attempt to correlate deflection measurements with pavement evaluation schemes and performance. The fJISt Dynaflect sensor reading, W1, is an indication of the overall strength of the pavement structure (all layers contributing). It has qeen called Dynaflect Maxi-

58
mum Deflection, DMD. The fifth Dynaflect sensor reading, W ~· gauges the strength of the subgrade. Large values of W~ indicate weak subgrade. In the pavement design process, large variations of W~ may dictate selection of different design sections, whereby areas of large W~ would require thicker overlays or special treatments. The intermediate sensor readings, W 2 to W 4, help define the deflection basins and are seldom used singly. The surface curvature index, SCI, provides an indication of the relative strength of the upper layers of the pavement structure. Everything else being equal (e.g., subgrade materials and strength, traffic conditions, pavement construction variables, etc.), of two pavement sections with differing SCI values, the section with the lower value is assumed to outlast the other and therefore is better (i.e., stronger). The base curvature index, BCI, is an indication of the relative strength of the intermediate layers (base
Oynaflect Algid Loading Wheels----,."--,..
. b . . . . . .
. . ·. I CRCP:
• - • 0 • : • J
Subbase
Sub grade
. ·. ·~ ....
Fig C.2. lAyout of Dynqflect system for measuring deflections on a CRCP (adapted from Re/61).
or subbase) of subgrade. Basin slope, BS, has been used in much the same way as SCI, especially for rigid pavements which display a relatively flat basin; BS is also an indicator of the upper layer's strength. Finally, spreadability, or percent spread, SP, represents an attempt to garner as much information as possible from all five sensor readings jointly, in a single parameter. Spreadability provides an indication of the overall strength (i.e., load carrying ability) of the pavement structure. The higher the SP value, the better.
DYNAFLECT OPERATING MODE USED AT THE SOUTH LOOP 610 EXPERIMENT SITE
The Dynaflect device used was the newer digital display type of the Texas SDHPT; it was operated by a crew of two. The Dynaflect test points were first located with respect to an expansion joint at the approach slab of an overpass bridge. The expansion joint was a fixed and stable reference point which was conveniently available at the end of the TBCO sections. Test points were selected at transverse cracks on the CRCP and at midspan (i.e., between two consecutive transverse cracks).
The choice of the test points was essentially random. After selection, the test points were marked and labeled with white paint, and a rolling tape was used to determine their distance to the expansion joint. Approximately ten such points were selected within each of five TBCO design sections at transverse cracks and ten additional at midspans. For testing, the Dynaflect sensor one was made to correspond to the marked points.
Notes:
••Dynafiect Deflection Parameters
Ws
• Only 1/2 deflection basin is measured; the second half is assumed to be a mirror image.
•• Dynaflect deflection parameters include (1) Wi;j-1,5
(2) Surface Curvature Index, SCI
(3) Base Curvature Index, BCI
(4) Basin Slope, BS r.w.
(5) Spreadability, SP(%) a i:vf x 100.0 1
Fig C.3. Typical pavement deflection basin reconstructed/rom Dynaflect deflection measurements (adapted from Refs 61 and 75).

59
One of the operators walked the Dynaflect trailer and directed the driver of the tow-vehicle in placing sensor one onto the
marked points (longitudinal and lateral placement). The driver of the tow-vehicle was also the operator of the loading and
"' G) c: aJ
...J
....
Concrete Median Barrier
. ·:·: .. :··.
Lane 1
Lane 2
1------Direction of Travel
Lane 3
Lane 4
.. ·. ··.'.·· .. . ··· ... . :_· .. :
_:....:..,_.:......:..:_;_;:...:.+-:~L..,_:...:..:....:.,_,..J \· : . . :-;-:. :: . .:_.;
N. Midspan Deflections N. Crack Deflections
Fig C.4. Plan l'iew of Dynajlect operation mode adopted at the South Loop 610 TBCO experiment site.
C.T. Subbase
(a) At-midspan case.
Direction ~~~------------C-.T~."-S~u~bb~a_s_e ________________ ~~~~ of Travel
(b) At-crack case.
Fig C.S. Longitudinal profile of Dynajlect operation mode along the pal'ement (South Loop 610 TBCO experiment). Note that only the loading wheels are represented on the sketches.
measuring gears; fmally, he was responsible for recording the results of the tests on standard SDHPT Dynaflect data sheets. (Note that optional an data terminal or any other automatic data storage facility was not yet available on the Department's Dynaflect).
Figure C.4 presents a plan view of the operational mode used. and Fig C.5. a longitudinal profile along the pavement Note that only the downstream side with respect to traffic flow was both loaded and measured for the "at-crack" condition. The implications of this for crack modeling are examined later.
Because an interior loading condition was used and Dynaflect testing was usually finished before the hottest part of the day, no temperature correction was applied to the data (thus, the assumption is made that the pavement slab is at full contact with the underlying subbase, at least in the center of the lanes where deflection measurements were made). The methodology adopted calls for repeat measurements of the same test points before and after overlay construction. Some of the objectives of this approach were the following:
(1) Assessment of load-carrying capacity of the base CRCP,
(2) Assessment of load transfer at transverse cracks with the CRCP,
(3) Evaluation of elastic constants (modulus of elasticity and Poisson's ratio) of layers by using deflection fitting techniques on the midspan Dynaflect deflection data.
(4) Comparison of the five TBCO designs for overall structural improvement, and
(5) Effect of TBCO pavement on load transfer of base CRCP cracks.
The methodology adopted brought insight in these and other questions of interest in relation to the South Loop 610 experiment.