a merican a irlines (aal) american airlines (aal)
TRANSCRIPT
AMERICAN AIRLINES (AAL)American Airlines (AAL)
AGENDA
Industry Analysis
Company Analysis
Company Fundamentals
Chart Analysis
Competitors
Competitive Analysis
Final Recommendation
2
INDUSTRY ANALYSIS (AIRLINE INDUSTRY)
http://www.nasdaq.com/article/airline-industry-stock-outlook-dec-2013-industry-outlook-cm310424
3
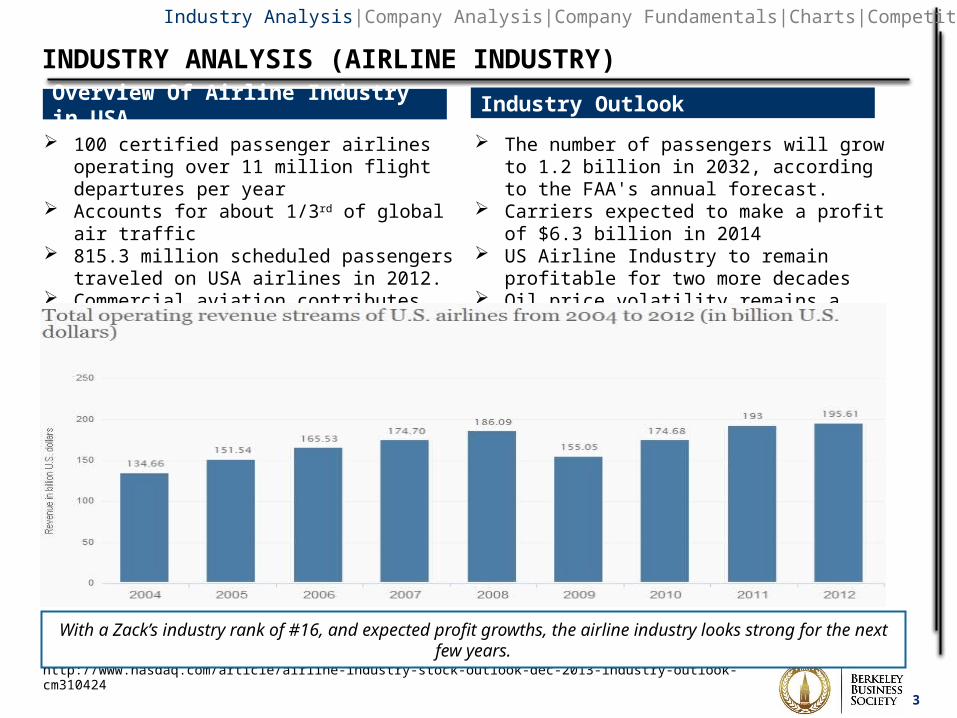
Overview Of Airline Industry in USA
With a Zack’s industry rank of #16, and expected profit growths, the airline industry looks strong for the next few years.
Industry Analysis|Company Analysis|Company Fundamentals|Charts|Competitors|Recommendation
100 certified passenger airlines operating over 11 million flight departures per year
Accounts for about 1/3rd of global air traffic 815.3 million scheduled passengers traveled on
USA airlines in 2012. Commercial aviation contributes more than 8% of
USA’s GDP.
The number of passengers will grow to 1.2 billion in 2032, according to the FAA's annual forecast.
Carriers expected to make a profit of $6.3 billion in 2014
US Airline Industry to remain profitable for two more decades
Oil price volatility remains a significant challenge
http://www.nasdaq.com/article/airline-industry-stock-outlook-dec-2013-industry-outlook-cm310424#ixzz2vEkdMZEL
Industry Outlook
COMPANY ANALYSIS (AMERICAN AIRLINES)
http://en.wikipedia.org/wiki/American_Airlineshttp://hub.aa.com/en/nr/pressrelease/american-airlines-group-reports-december-traffic-resultshttp://hub.aa.com/en/nr/pressrelease/american-airlines-group-reports-fourth-quarter-and-full-year-2013-financial-results 4
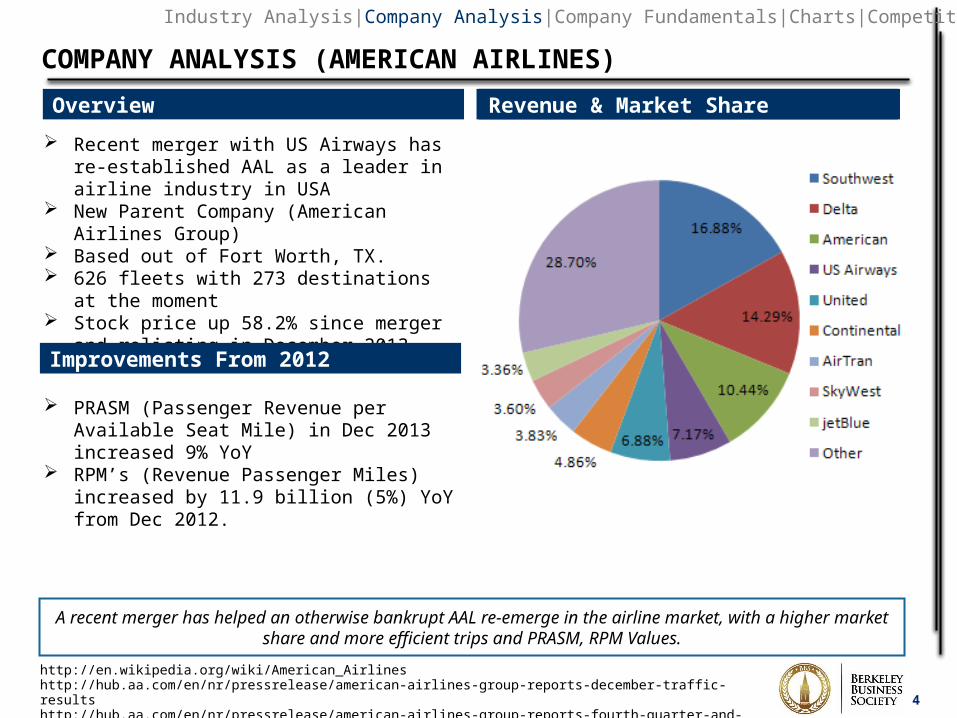
Overview
A recent merger has helped an otherwise bankrupt AAL re-emerge in the airline market, with a higher market share and more efficient trips and PRASM, RPM Values.
eBay
PRASM (Passenger Revenue per Available Seat Mile) in Dec 2013 increased 9% YoY
RPM’s (Revenue Passenger Miles) increased by 11.9 billion (5%) YoY from Dec 2012.
Industry Analysis|Company Analysis|Company Fundamentals|Charts|Competitors|Recommendation
Revenue & Market Share
Recent merger with US Airways has re-established AAL as a leader in airline industry in USA
New Parent Company (American Airlines Group) Based out of Fort Worth, TX. 626 fleets with 273 destinations at the moment Stock price up 58.2% since merger and relisting in
December 2013
Improvements From 2012

COMPANY FUNDAMENTALS
5
Essential Statistics
Consistently Rising Revenues, but negative net profit margin.
Beta: 2.91 Current Ratio: 1.04 Quarterly Revenue YoY Growth: 24.1% Forward P/E: 7.38 Market Cap: $18.4 billion (Large Company) Average Volume: 8.7m/ 10 days
Industry Analysis|Company Analysis|Company Fundamentals|Charts|Competitors|Recommendation
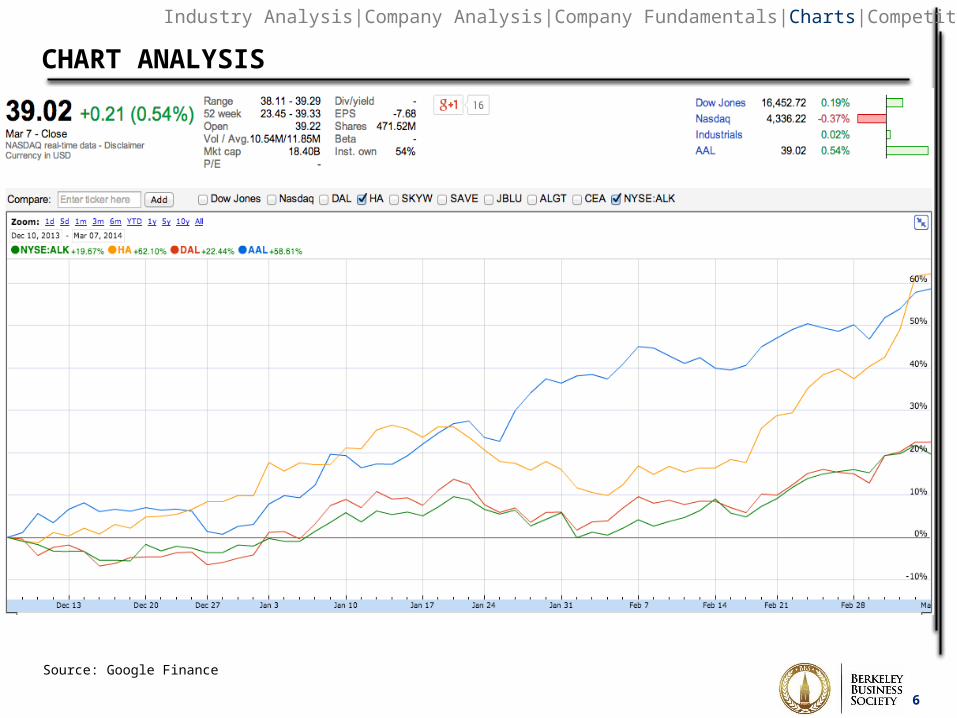
CHART ANALYSIS
6
Industry Analysis|Company Analysis|Company Fundamentals|Charts|Competitors|Recommendation
Source: Google Finance
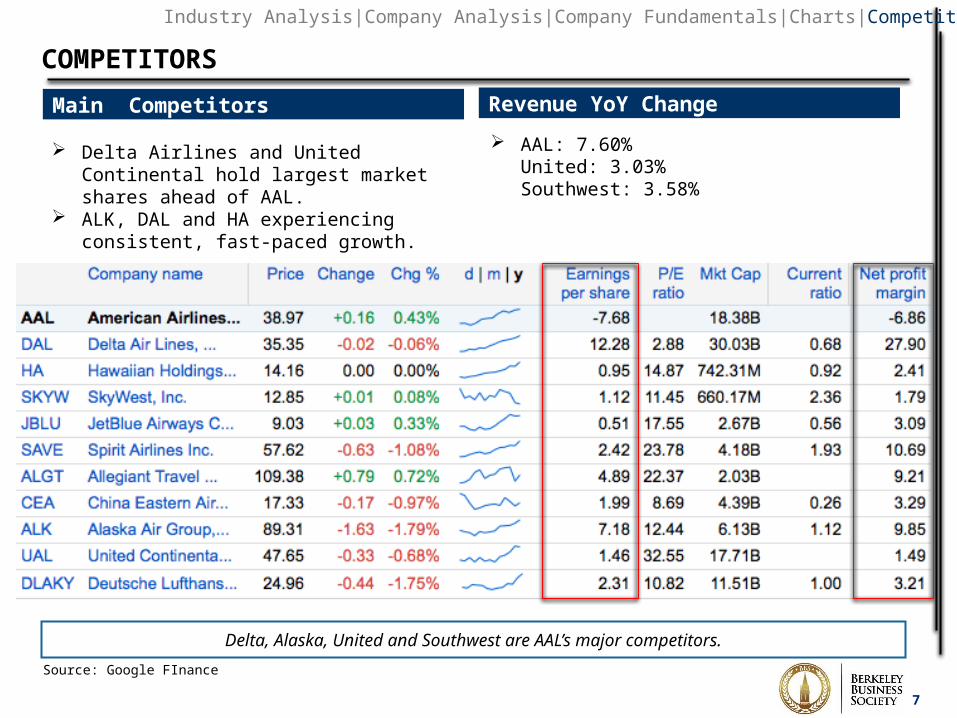
COMPETITORS
Source: Google FInance
7
Main Competitors
Delta, Alaska, United and Southwest are AAL’s major competitors.
Revenue YoY Change
Delta Airlines and United Continental hold largest market shares ahead of AAL.
ALK, DAL and HA experiencing consistent, fast-paced growth.
Industry Analysis|Company Analysis|Company Fundamentals|Charts|Competitors|Recommendation
AAL: 7.60%United: 3.03%Southwest: 3.58%
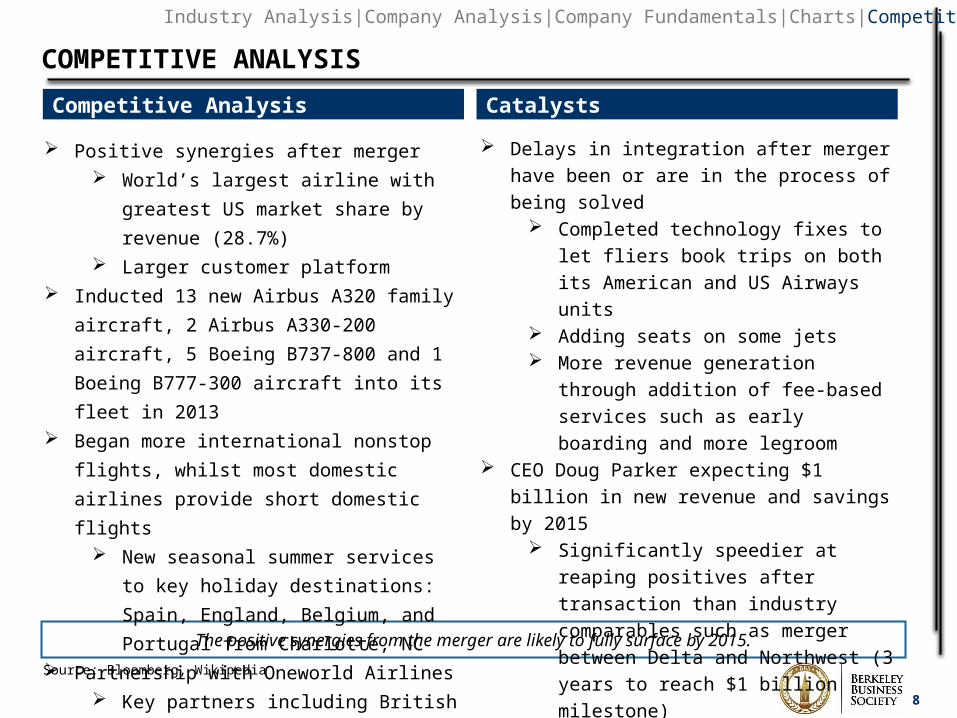
COMPETITIVE ANALYSIS
Source: Bloomberg, Wikipedia
8
Competitive Analysis
The positive synergies from the merger are likely to fully surface by 2015.
Catalysts
Positive synergies after merger World’s largest airline with greatest US
market share by revenue (28.7%) Larger customer platform
Inducted 13 new Airbus A320 family aircraft, 2
Airbus A330-200 aircraft, 5 Boeing B737-800 and 1
Boeing B777-300 aircraft into its fleet in 2013 Began more international nonstop flights, whilst
most domestic airlines provide short domestic
flights New seasonal summer services to key
holiday destinations: Spain, England,
Belgium, and Portugal from Charlotte, NC Partnership with Oneworld Airlines
Key partners including British Airways,
Malaysia Airlines, Qatar Airways
Delays in integration after merger have been or are in the process of being solved
Completed technology fixes to let fliers book trips on both its American and US Airways units
Adding seats on some jets More revenue generation through addition
of fee-based services such as early boarding and more legroom
CEO Doug Parker expecting $1 billion in new revenue and savings by 2015
Significantly speedier at reaping positives after transaction than industry comparables such as merger between Delta and Northwest (3 years to reach $1 billion milestone)
2014E annual profit at $3.5 billion (Bloomberg analysts)
Industry Analysis|Company Analysis|Company Fundamentals|Charts|Competitors|Recommendation
FINAL RECOMMENDATION
9
Recommendation for AAL
Considering the positive outlooks for the US airlines industry and AAL in particular, the final recommendation is BUY.
Positive synergies, in particular breaking the $1 billion milestone in revenue and costs synergies, are
expected to fully surface by 2015
Hence, steady long term revenue growth to be expected during integration process
Although AAL’s forward P/E ratio is at 7.38 which is considerably lower than its competitors, investors are
gaining more confidence in positive analysts’ estimates, and the stock’s P/E is expected to increase
Expectations for US airlines as a whole are high for 2014 as the economy improves
Final recommendation for AAL: BUY
Industry Analysis|Company Analysis|Company Fundamentals|Charts|Competitors|Recommendation