a message on media from the future (well 2015)
TRANSCRIPT
A MESSAGE ON MEDIA FROM THE FUTURE
2015

WE ARE PIVOTIING ON THE MOST EXCITING AND TRANSITIONAL TIME OF THE LAST 20 YEARS

CHANGE IS THE ORDER OF THE DAY
YoY % Change
Google -1%
Facebook 34%
Microsoft 4%
Yahoo -12%
Twitter 58%

WHAT WE LEARNT IN 2014

BEST CAMPAIGNS
‘The Scarecrow’ - Chipotle
#lookup – British Airways
‘World’s Toughest Job’ – Cardstore
‘Winner Stays’ – Nike

BEST MEDIA STUNTS

BEST BRAND STORIES
Greenpeace vs Shell & Lego
Richard Branson-zilla – Virgin Media Big
Kahuna Bundle
Walking Dead – Times Square
Vinnie Chief Biscuit Officer – Fox’s Biscuits

BEST BRAND BEHAVIOUR

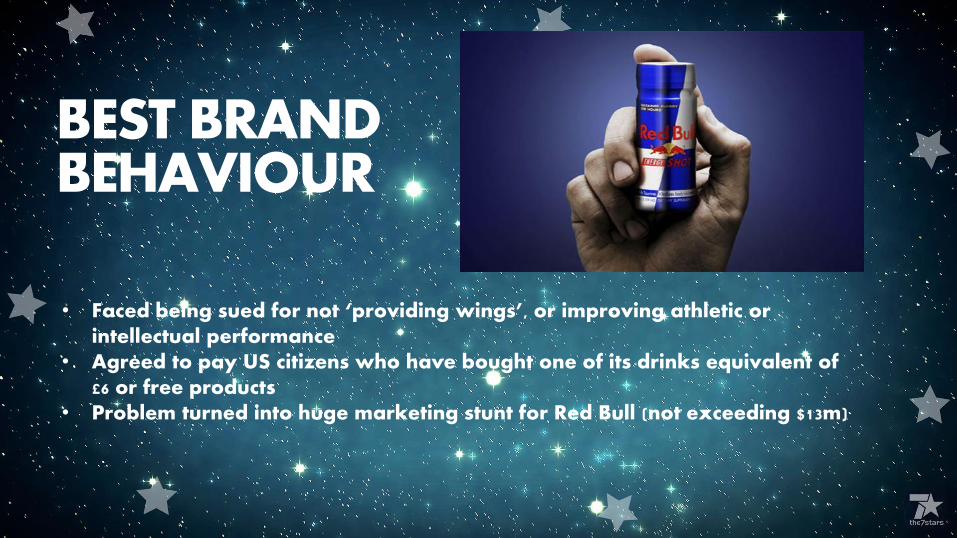
BEST BRAND BEHAVIOUR
• Faced being sued for not ‘providing wings’, or improving athletic or intellectual performance
• Agreed to pay US citizens who have bought one of its drinks equivalent of £6 or free products
• Problem turned into huge marketing stunt for Red Bull (not exceeding $13m)
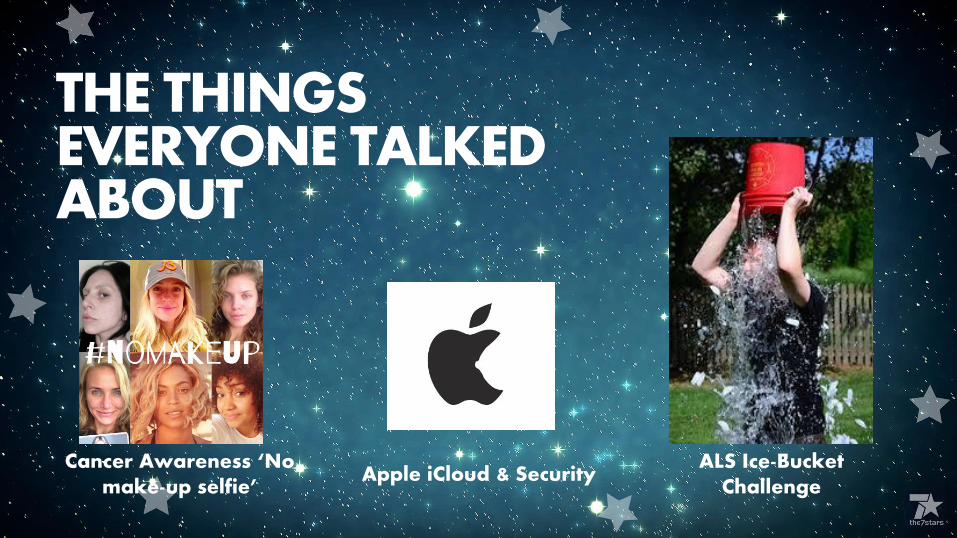
THE THINGS EVERYONE TALKED ABOUT
ALS Ice-Bucket Challenge
Cancer Awareness ‘No make-up selfie’
Apple iCloud & Security

PIZZA HUT WON THE SOCIAL PRIZE

Bellwether forecasts 7.0% increase in adspend for 2014, before growth cools to 3.8% in 2015

DIGITAL ADVERTISING KEPT GROWING, WITH MOBILE LEADING THE CHARGE

AT ITS EXPENSE PRESS CONTINUES TO SUFFER
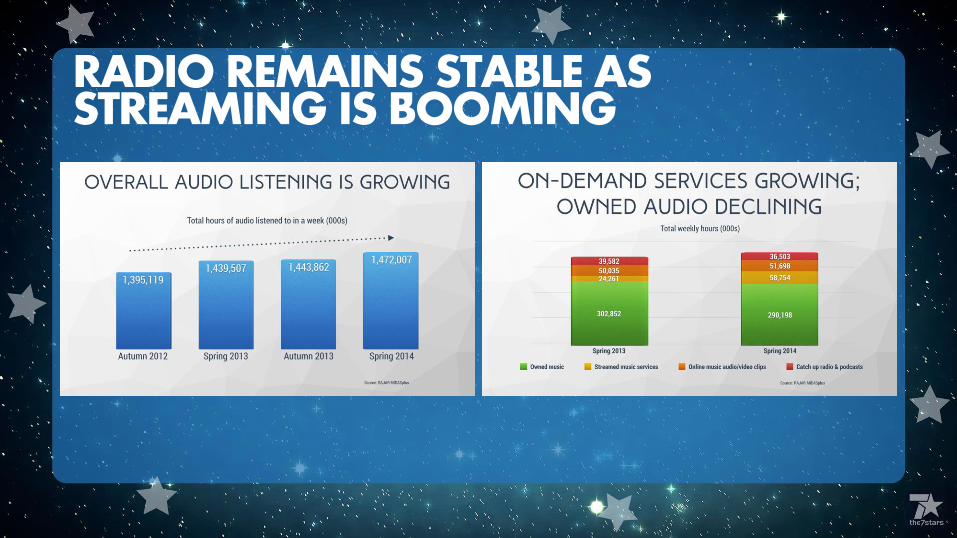
RADIO REMAINS STABLE AS STREAMING IS BOOMING
175M CINEMA ADMISSIONS PER YEAR 75% OF ADULTS GO AT LEAST ONCE A YEAR UP 28% FROM 2008

TIME SPENT WATCHING TV IS GOING DOWN
0.00
0.50
1.00
1.50
2.00
2.50
3.00
3.50
4.00
4.50
5.00
Q1 2010 Q1 2011 Q1 2012 Q1 2013 Q1 2014No
. o
f h
ou
rs o
f T
V v
iew
ed
pe
r d
ay
Non-commercial viewing Commercial viewing
4 hours 12 min 4 hours 8 mins 4 hours 14 mins 4 hours 18mins 3 hours 54 min
2 hours 30 mins
2 hours 43 mins
2 hours 41 mins
2 hours 42 mins
2 hours 40 mins
1 hour 24 mins
1 hour 29 mins
1 hour 27 mins
1 hour 32 mins
1 hour 38 mins
Source: BARB Jan-Mar 2010-2014, individuals

GOOD WEATHER AND CHANGING HABITS ARE HITTING VIEWING ACROSS THE BOARD
0
50
100
150
200
250
300
Individuals ABC1 adults Adults 16-34s Men hwch
Imp
acts
(m
illi
on
s)
Q1 2013
Q1 2014
-5.9%
-5.1%
-5.6%
-7.7%
-5.9%
-5.0%

1 MILLION HOMES NOW WITHOUT A TV

SCREEN WARS OR SCREEN LOVE?

MULTISCREENING IS BECOMING THE NORM
Of which

THE TRUTH IS, IT REALLY DEPENDS ON CONTEXT AND MOOD
Multi-Task Viewing Personal Viewing Session Viewing Clan Viewing
Sacrifice Viewing Partnership Viewing Feet-up Viewing
Source: Thinkbox Screen Life Oct 2014
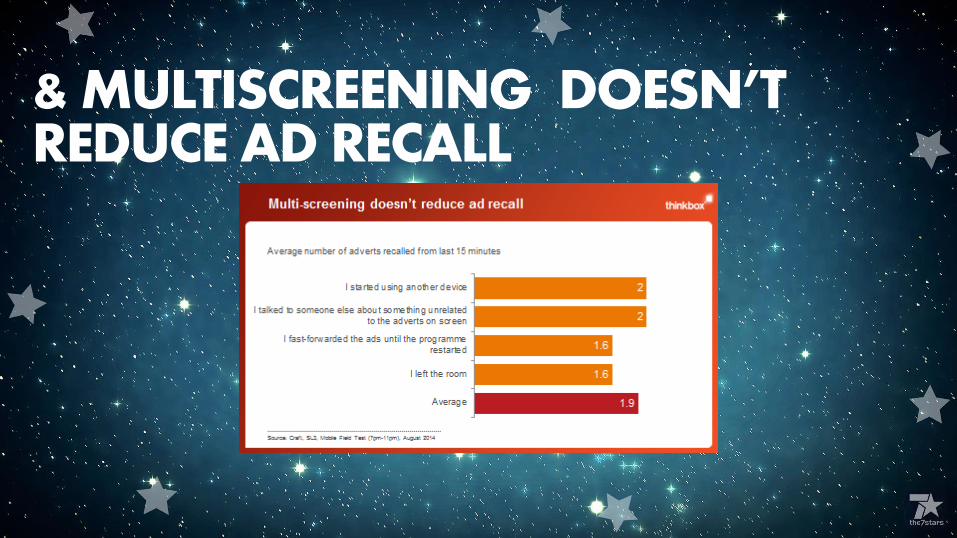
& MULTISCREENING DOESN’T REDUCE AD RECALL

THE EMPIRE STRIKES BACK

Source: BARB 2014 UK data, eMarketer April 2014 data; includes time spent multi-tasking across platforms
TV >3hrs 52mins
Digital 55 minutes

SESSION LENGTH MATTERS
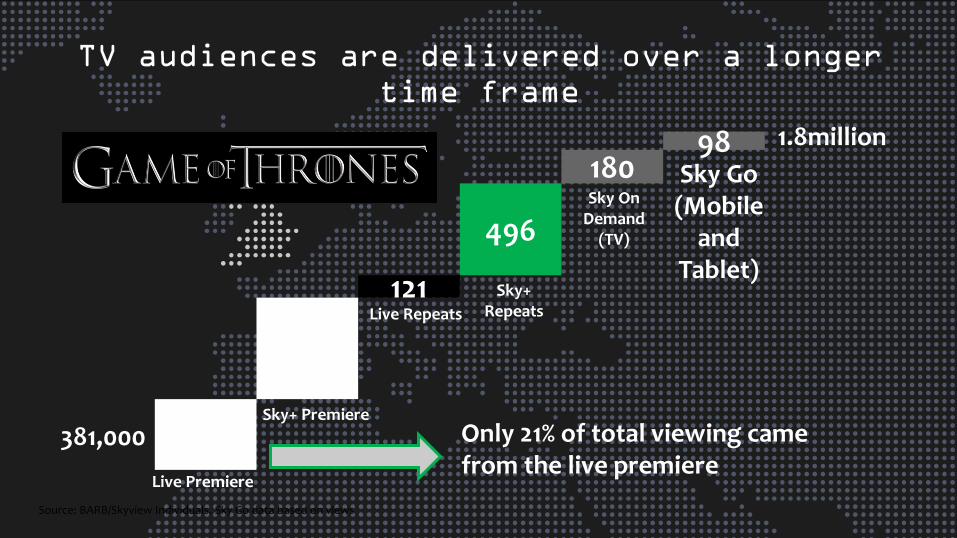
381
547
121
496
180 98
Sky Go (Mobile
and Tablet)
1.8million
Live Premiere
Sky+ Premiere
Live Repeats
Sky+ Repeats
Sky On Demand
(TV)
Only 21% of total viewing came from the live premiere
Source: BARB/Skyview Individuals. Sky Go data based on views
381,000
TV audiences are delivered over a longer
time frame

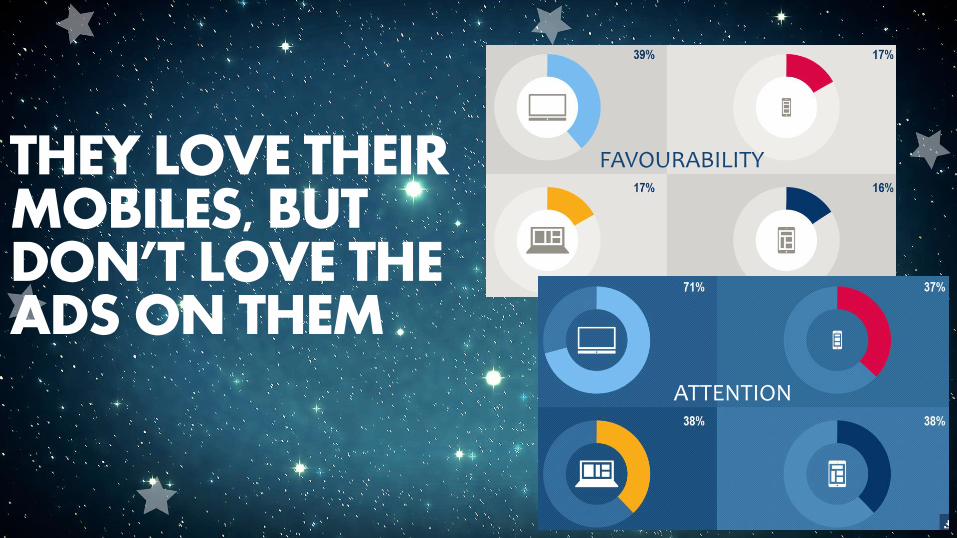
THEY LOVE THEIR MOBILES, BUT DON’T LOVE THE ADS ON THEM
FAVOURABILITY
ATTENTION
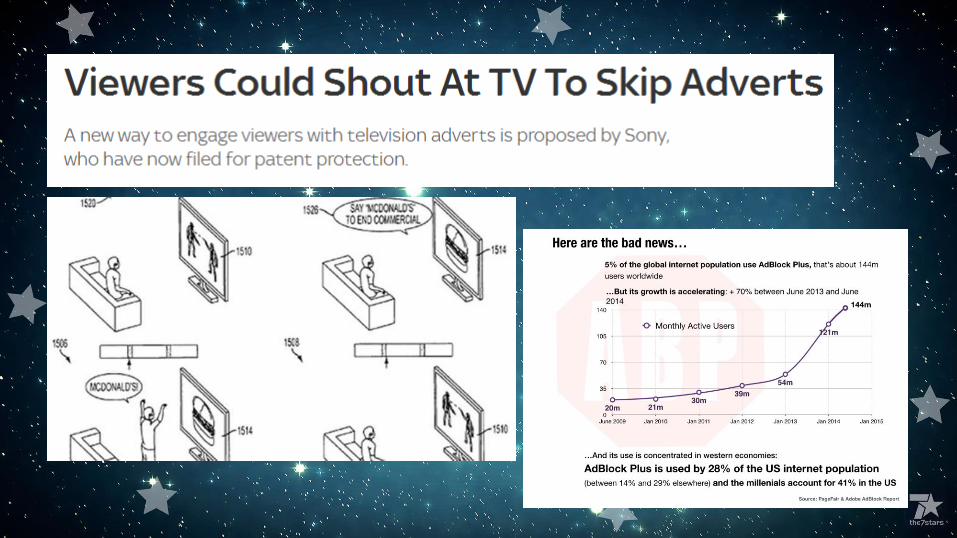
ONE FIFTH OF USERS USE AD BLOCKING SOFTWARE 85 PERCENT OF ALL CLICKS ARE DERIVED FROM 8 PERCENT OF USERS
One fifth of users use ad blocking software 85 percent of all clicks are derived from 8 percent of users Ads that win awards are 11 times more effective.
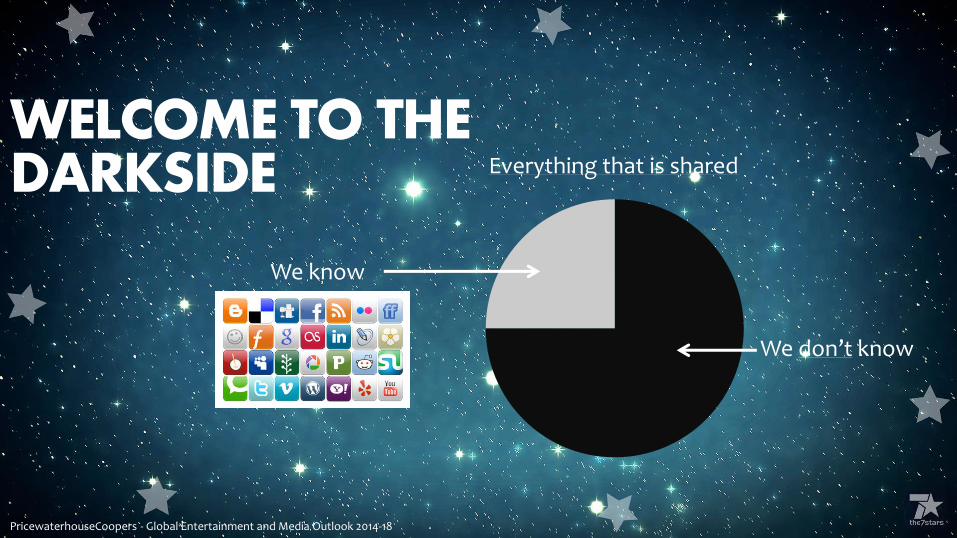
WELCOME TO THE DARKSIDE
PricewaterhouseCoopers - Global Entertainment and Media Outlook 2014-18
We know
Everything that is shared
We don’t know

HOW PEOPLE HAVE CHANGED IN 2014

Change in impacts over the last five
Source: BARB Jan-Mar 2010-2014 Base: 30” reweighted impacts
Men +3.2% Kids -4.7%
Individuals +0.9% ABC1 Adults +4.8% 16-34s Adults -2.3%
Adults +1.5%

MAJORITY OF VIEWING IS STILL LIVE
Source: BARB Jan-Mar 2014 – Individuals, Individuals with DTRs
Individuals Individuals with DTRs
88%
6%
6%
Individuals Individuals with DTRs
83%
8%
9%
Live Viewed on the same day as live (VOSDAL) Timeshifted viewing within 7 days

THE AVERAGE VIEWER WATCHED 47 ADS A DAY IN Q1 2014
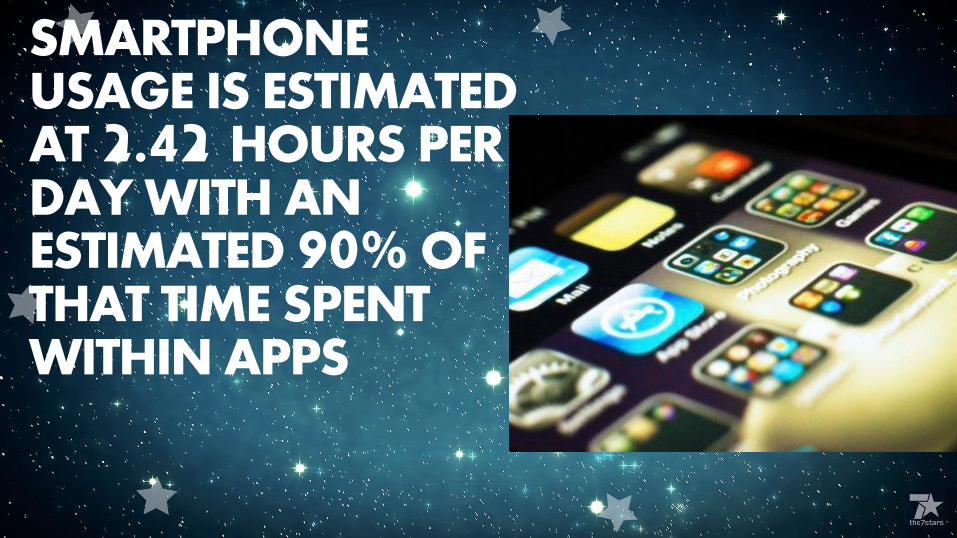
SMARTPHONE USAGE IS ESTIMATED AT 2.42 HOURS PER DAY WITH AN ESTIMATED 90% OF THAT TIME SPENT WITHIN APPS
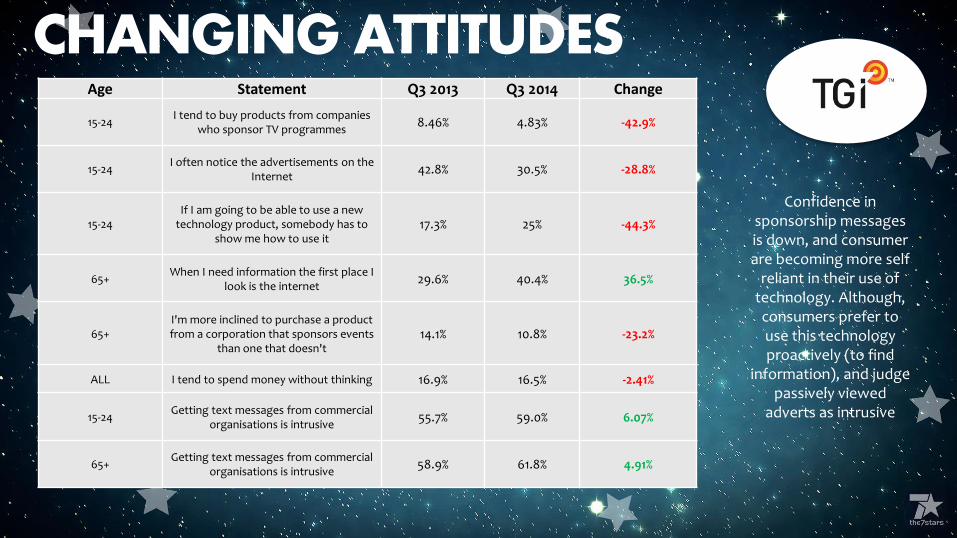
CHANGING ATTITUDES Age Statement Q3 2013 Q3 2014 Change
15-24 I tend to buy products from companies
who sponsor TV programmes 8.46% 4.83% -42.9%
15-24 I often notice the advertisements on the
Internet 42.8% 30.5% -28.8%
15-24 If I am going to be able to use a new
technology product, somebody has to show me how to use it
17.3% 25% -44.3%
65+ When I need information the first place I
look is the internet 29.6% 40.4% 36.5%
65+ I'm more inclined to purchase a product from a corporation that sponsors events
than one that doesn't 14.1% 10.8% -23.2%
ALL I tend to spend money without thinking 16.9% 16.5% -2.41%
15-24 Getting text messages from commercial
organisations is intrusive 55.7% 59.0% 6.07%
65+ Getting text messages from commercial
organisations is intrusive 58.9% 61.8% 4.91%
Confidence in sponsorship messages is down, and consumer are becoming more self
reliant in their use of technology. Although, consumers prefer to use this technology proactively (to find
information), and judge passively viewed
adverts as intrusive

CONFIDENCE IS RISING
0
10
20
30
40
50
60
I feel pretty confident that I’ll be ok
I’m concerned, but should be fine
I’m really worried Things are already really bad – They can’t get a lot
worse
Sep-11
Sep-14
Source: Lightspeed GMI/Mintel

CONFIDENCE IS RISING

CONFIDENCE IS RISING

BIGGEST ADVERTISING QUESTIONS IN
2014

BUT HOW DO YOU MEASURE IT?

FACEBOOK STRIKES FIRST

SEARCH WARS • Search will retain its dominant
position • In spite of increase in market
share for video and mobile advertising

TRULY UNIQUE AUDIENCE’S ARE BECOMING THE PREMIUM

LOOKING TO THE FUTURE
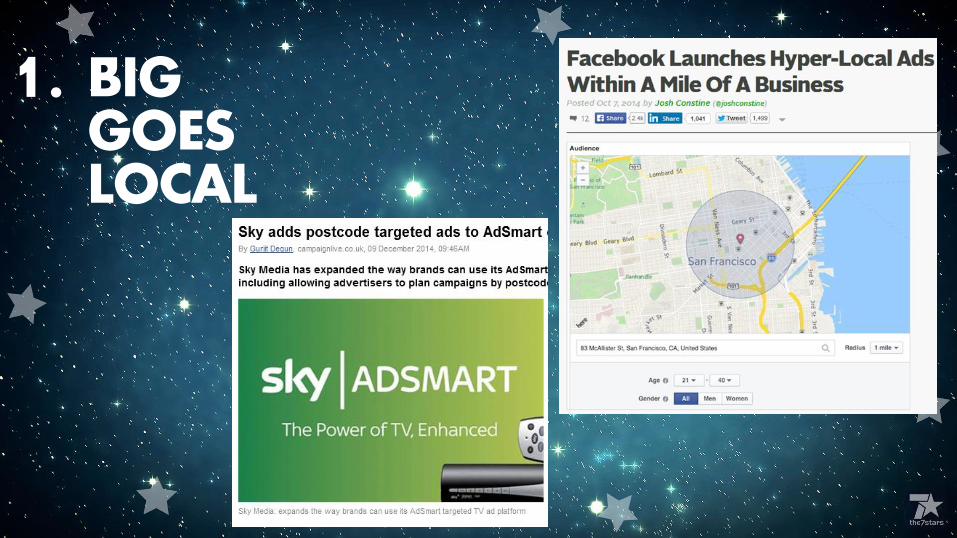
BIG GOES LOCAL
1.

& AGGRESSIVELY DIVERSIFYS

PROGRAMMATIC & NATIVE BECOME COMMONPLACE
2.

3. MOBILE FINALLY BECOMES A REAL GAME CHANGER
Source: Ooyala Global Video Index Report, Q1 2014. Study measured the anonymized viewing habits of viewers in 239 countries and territories, and data from Ooyala’s video publishers, which include hundreds of video publishers, brands and operators.
532% growth in mobile and tablet viewing from
2012 to 2014
25%
20%
15%
10%
5%
0% Aug 2011
Mo
bile
sh
are
of
on
line
vid
eo
(%
)
Share of mobile and tablet video plays
Apr 2012
Dec 2012
Aug 2013
Mar 2014

VIDEO AND MOBILE WILL CONTINUE TO DOMINATE
Source: PWC – global Entertainment outlook 2014-2018

MOBILE PAYMENTS

INTEREST IN CONTACTLESS PAYMENTS ARE GROWING
Source: Kinetic Panel June 2014
65%
81%
62%
25%
AllAdults
18-34 35-54 55+
% of aware that have used the
functionality
• 27% feel comfortable with mobile to mobile payments
• 37% feel comfortable with contactless payment cards

MOBILE - NEW WAYS TO SEARCH

NEW FORMATS WILL AIM TO PROVIDE BETTER SOLUTIONS

4. PHYSICAL MEETS DIGITAL

VIRTUAL VACATION

5. BRAND ANNOYANCE


PRIVACY
• Whisper the ‘Anonymous’ app used for sharing secrets • Recently come to light that users have been tracked & monitored • User data collated and stored indefinitely • Some information shared by company with US Department of Defense

Every day. Everywhere. 17M videos shared
10B views
440M people
by
Source: NY Times, September 9, 2014

6. CLOUD POWER

THE AGE OF GIGABIT CONNECTIVITY
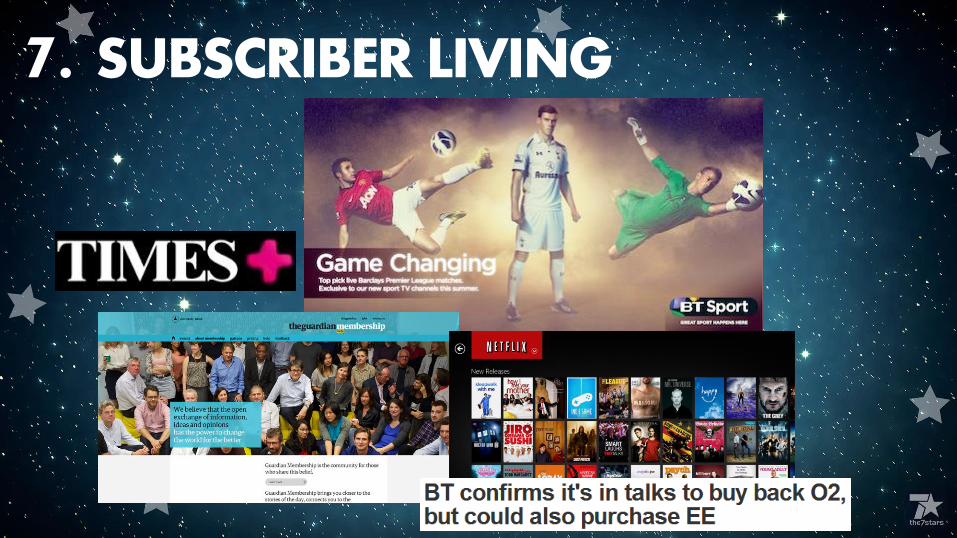
7. SUBSCRIBER LIVING

WE WILL HEAR MORE FROM…

AND OF COURSE…