a meta-analysis of 87,040 individuals identifies 23 new susceptibility loci for prostate cancer
TRANSCRIPT
Nature GeNetics VOLUME 46 | NUMBER 10 | OCTOBER 2014 1103
Genome-wide association studies (GWAS) have identified 76 variants associated with prostate cancer risk predominantly in populations of European ancestry. To identify additional susceptibility loci for this common cancer, we conducted a meta-analysis of >10 million SNPs in 43,303 prostate cancer cases and 43,737 controls from studies in populations of European, African, Japanese and Latino ancestry. Twenty-three new susceptibility loci were identified at association P < 5 × 10⁻⁸; 15 variants were identified among men of European ancestry, 7 were identified in multi-ancestry analyses and 1 was associated with early-onset prostate cancer. These 23 variants, in combination with known prostate cancer risk variants, explain 33% of the familial risk for this disease in European-ancestry populations. These findings provide new regions for investigation into the pathogenesis of prostate cancer and demonstrate the usefulness of combining ancestrally diverse populations to discover risk loci for disease.
Prostate cancer is the most common non-skin cancer in men in the Western world, and epidemiological studies have shown strong evi-dence for genetic predisposition to prostate cancer, based on two of the most important factors—ancestry and family history. GWAS have identified 76 common risk loci (reviewed in ref. 1); however, over 1,000 additional common SNPs are estimated to contribute prostate cancer risk2,3. Previous prostate cancer GWAS have been conducted primarily in populations of European ancestry2,4–7, with the majority of risk loci that have been discovered also found to be associated with prostate cancer risk in other populations8,9. The generalizability of risk associations for a large fraction of loci suggests that combining GWAS across ancestral populations could increase power to detect risk loci that are shared among diverse populations.
To search for additional genetic risk factors for prostate cancer, we combined data from studies with existing high-density SNP genotyp-ing in prostate cancer GWAS discovery or replication efforts in the following populations: European ancestry (34,379 cases and 33,164 controls from UK/Australia4, Cancer of the Prostate in Sweden (CAPS)10, the Breast and Prostate Cancer Cohort Consortium (BPC3)6, PEGASUS and iCOGS/PRACTICAL2); African ancestry (5,327 cases and 5,136 controls from the African Ancestry Prostate Cancer GWAS Consortium (AAPC)11 and the Ghana Prostate Study12); Japanese ancestry (2,563 cases and 4,391 controls from a GWAS in the Japanese in the Multiethnic Cohort (MEC)8 and Biobank Japan13,14); and Latino ancestry (1,034 cases and 1,046 controls from the MEC8).
Imputation was performed in each study using a cosmopolitan refer-ence panel from the 1000 Genomes Project (March 2012). Across the various studies, 5.8–16.8 million genotyped and imputed SNPs, as well as insertion-deletion variants with a frequency of ≥1%, were examined in association with prostate cancer risk (Online Methods, Supplementary Tables 1–3 and Supplementary Note).
We first conducted ancestry-specific meta-analyses, with the large European-ancestry sample providing the strongest statistical power for the discovery of new loci, followed by a multi-ancestry meta-analysis of all populations, to identify additional loci with pan-ancestry effects. For these primary analyses, we employed a P-value threshold of 5 × 10⁻⁸ to define genome-wide significance. Secondary meta-analyses focused on (i) aggressive disease in the large European-ancestry sample; (ii) aggressive disease in the com-bined multi-ancestry sample; and (iii) prostate cancer diagnosed at ≤55 years of age in the European-ancestry sample only. Aggressive prostate cancer was defined by a Gleason score of ≥8, a disease stage of ‘distant’, a prostate-specific antigen (PSA) level of >100 ng/ml or death from prostate cancer. For these two secondary phenotypes, we used a more stringent P-value threshold of 5 × 10⁻⁸/2 = 2.5 × 10⁻⁸ for genome-wide significance. In each study, we tested for gene dosage effects via a 1-degree-of-freedom test for trend from logistic regres-sion models adjusted for genetic ancestry (principal components). We observed little evidence of inflation in the test statistics in any single study or population (λ/λ1,000 values: European ancestry, 1.14/1.00; African ancestry, 1.03/1.01; Japanese ancestry, 1.06/1.02; Latino ancestry, 1.00/1.00) or in the multi-ancestry analysis (λ = 1.08 and λ1,000 = 1.00; Online Methods, Supplementary Fig. 1 and Supplementary Table 4).
In the meta-analysis of the European-ancestry studies, 20 new sig-nals in 18 regions at least 500 kb away from previously associated loci were observed to be associated with prostate cancer risk at P < 5 × 10⁻⁸ (Fig. 1 and Supplementary Figs. 2 and 3). The most significant associations in each region were observed with imputed variants, and we were able to confirm the imputed genotypes for 15 variants that had high imputation information scores (r2 range of 0.76–1) through direct genotyping or sequencing across multiple studies (Table 1, Online Methods and Supplementary Tables 5–8). Two of the variants were located within 370 kb of each other on chromosome Xq13 and were determined to be independent signals on the basis of conditional analyses (rs6625711, P = 6.1 × 10⁻¹⁰ and rs4844289, P = 2.0 × 10⁻⁸; linkage disequilibrium (LD) r2 < 0.01 in the European-ancestry (EUR) 1000 Genomes Project populations; Supplementary Table 9).
A meta-analysis of 87,040 individuals identifies 23 new susceptibility loci for prostate cancer
A full list of authors and affiliations appears at the end of the paper.
Received 26 March; accepted 19 August; published online 14 September 2014; doi:10.1038/ng.3094
l e t t e r snp
g©
2014
Nat
ure
Am
eric
a, In
c. A
ll rig
hts
rese
rved
.

1104 VOLUME 46 | NUMBER 10 | OCTOBER 2014 Nature GeNetics
l e t t e r s
All 15 variants were common, with minor allele frequencies (MAFs) of ≥0.09 in the European-ancestry population, and all but 3 (rs80130819 at 12q13, rs76939039 at 10q11 and rs17694493 at 9p21) were also common (MAF ≥ 0.05) in populations of African, Japanese and Latino ancestry. Evidence of heterogeneity in the per-allele odds ratio (OR) was noted with four variants (Phet = 0.01 to 8.4 × 10⁻⁶; rs17599629 at 1q21, rs115306967 at 6p21, rs17694493 at 9p21 and rs6625711 at Xq13). Four of the 15 variants (rs10009409 at 4q13, rs4713266 at 6p24, rs80130819 at 12q13 and rs2807031 at Xp11) had directional effects that were consistent with those for men of European ancestry and were nominally statistically significant (P < 0.05) in at least one other population (Table 1), and, for three SNPs, combining data across populations strengthened the statistical significance of the associa-tion (Table 1). In the large European-ancestry sample, we also con-firmed the reported signal at 22q13 represented by variant rs58133635 (P = 5.8 × 10⁻⁹; r2 = 0.74 with rs9623117 in 1000 Genomes Project EUR populations; Supplementary Figs. 2 and 3)15.
No new risk loci were identified in ancestry-specific analyses within the populations of African, Japanese or Latino ancestry, possibly owing to a lack of power (Supplementary Fig. 2). However, in combining results across populations in a multi-ancestry meta-analysis (43,303 cases and 43,737 controls), 11 additional variants were identified in association with prostate cancer risk in new risk regions at P < 5 × 10⁻⁸ (Fig. 2, Table 1 and Supplementary Table 5). We confirmed the imputed genotypes for seven variants that had high imputation infor-mation scores (r2 range of 0.81–1) through additional genotyping and sequencing (Online Methods and Supplementary Tables 6–8). All seven variants were nominally associated with risk (P < 0.05) in at least one of the non-European-ancestry populations, and per-allele effects were directionally consistent across all four populations for six of the seven variants. All variants had MAF ≥ 0.05 in all four popula-tions, and no significant evidence of population heterogeneity was noted with any of these seven variants (Table 1).
In secondary GWAS analyses, we detected an association with vari-ant rs636291 at 1p36 (risk allele frequency = 0.16; OR = 1.18; P = 2.1 × 10⁻⁸; Table 1) and early-onset disease among men of European ancestry (4,147 cases ≤55 years of age versus all controls, n = 27,212). The association with this variant was weaker for cases diagnosed at >55 years of age (23,564 cases versus all controls, n = 27,212: OR = 1.04; P = 0.004; Phet = 2.2 × 10⁻⁴; Supplementary Table 10). We did not detect any genome-wide significant associations with aggressive disease in the European-ancestry population (n = 7,903 cases) or in the combined multi-ancestry sample (n = 10,209 cases; Supplementary Fig. 4).
For the 23 new risk variants (15 from the European-ancestry analysis, 7 from the multi-ancestry analysis and 1 from the early-onset analysis), the per-allele effects ranged from 1.06 to 1.14 and were consistent with log-additive effects (Supplementary Table 11). The association of each variant was noted for both aggressive and non-aggressive prostate cancer (Supplementary Table 12); for only one variant, rs7153648 at 14q23, there was suggestive evidence of a difference by disease severity (OR = 1.17 for aggressive disease and OR = 1.09 for non-aggressive disease; Phet = 0.03). These results con-firm what has been observed in prostate cancer GWAS thus far; risk loci seem to confer risk for prostate cancer overall and do not discrim-inate between aggressive and indolent disease. In analyses stratified by age, 17 of the 23 variants demonstrated larger effects at younger ages (≤55 versus >55 years), although only 6 had evidence of a significant difference (P < 0.05) (Supplementary Table 10). Only 2 of the 23 variants were modestly associated with PSA levels among controls (rs9287719 at 2p25, P = 0.03 and rs115306967 at 6p21, P = 0.05; Supplementary Table 13).
Of the 23 new risk variants, 13 were located in intronic regions of genes and 2 were correlated with nonsynonymous variants in adja-cent genes (rs12051443 at 16q22, r2 = 0.98 with rs4788821 (encod-ing p.Glu60Lys) in MARVELD3 and rs2238776 at 22q11, r2 = 0.67
12
10
8
6
–log
10 (P
)
4
2
0
1 2 3 4 5 6 7 8 9 10 11
Chromosome
12 131415 17 19 21 x
Figure 1 Manhattan plot of genotyped and imputed results from the European-ancestry meta-analysis of overall prostate cancer risk. All SNPs within 500 kb of known GWAS SNPs are omitted. The green line represents P = 5 × 10⁻⁸. This figure shows all new variants with P < 5 × 10⁻⁸, regardless of confirmation results (one signal on chromosome 1, one signal on chromosome 4, one signal on chromosome 17 and two signals on the X chromosome were not confirmed). Many of the new signals are in close proximity to one another on the same chromosome (supplementary table 6).
10
8
6
4
2
0
–log
10 (P
)
1 2 3 4 5 6 7 8 9 10 11 12 131415 17 19 21 xChromosome
Figure 2 Manhattan plot of the results from the multi-ancestry meta-analysis of overall prostate cancer risk. All SNPs within 500 kb of known GWAS SNPs are omitted. The green line represents P = 5 × 10⁻⁸. This figure shows all new variants with P < 5 × 10⁻⁸, regardless of the confirmation results, as well as signals that were reported in the European-ancestry meta-analysis that also reached P = 5 × 10⁻⁸ in the multi-ancestry meta-analysis (table 1 and supplementary table 6).
npg
© 2
014
Nat
ure
Am
eric
a, In
c. A
ll rig
hts
rese
rved
.

Nature GeNetics VOLUME 46 | NUMBER 10 | OCTOBER 2014 1105
l e t t e r s
tabl
e 1
Ass
ocia
tion
res
ults
for
23
new
ris
k va
rian
ts f
or p
rost
ate
canc
er
SN
P I
DC
hrom
osom
e, p
osit
ionb
Nea
rby
gene
Alle
lesc
Eur
opea
n (3
5,0
93
cas
es,
34
,59
9 c
ontr
ols)
Afr
ican
(5
,32
7 c
ases
, 5
,13
6
cont
rols
)Ja
pane
se (
2,5
63
cas
es,
4,3
91
con
trol
s)La
tino
(1
,03
4 c
ases
, 1
,04
6 c
ontr
ols)
Mul
ti-a
nces
try
(44
,10
7 c
ases
, 4
5,1
72
con
trol
s)
P het
dO
RP
RA
FaO
RP
RA
FaO
RP
RA
FaO
RP
RA
FaO
RP
ris
k lo
ci id
enti
fied
in e
urop
ean-
ance
stry
met
a-an
alys
isrs
17
59
96
29
1q2
1, 1
50
,65
8,2
87
GO
LPH
3LG
/A1
.10
5.9
× 1
0−1
10
.22
1.0
90
.13
0.0
80
.97
0.4
80
.18
0.9
20
.23
0.2
61
.08
2.6
× 1
0−9
8.6
× 1
0−3
rs9
28
77
19
2p2
5, 1
0,7
10
,73
0N
OL1
0C
/T1
.07
1.8
× 1
0−8
0.4
61
.00
0.9
80
.26
1.0
70
.06
0.4
21
.00
0.9
90
.45
1.0
62
.8 ×
10
−8
0.2
1
rs1
00
09
40
94
q13
, 7
3,8
55
,25
3CO
X18
T/C
1.0
92
.1 ×
10
−1
00
.32
1.0
20
.56
0.3
51
.10
0.0
20
.56
1.0
00
.96
0.5
01
.08
2.3
× 1
0−1
00
.12
rs4
71
32
66
6p2
4, 1
1,2
19
,03
0N
EDD
9C
/T1
.07
3.9
× 1
0−8
0.5
21
.07
0.0
30
.78
1.0
60
.21
0.2
31
.02
0.8
10
.40
1.0
62
.9 ×
10
−9
0.8
9
rs1
15
45
71
35
6p2
2, 3
0,0
73
,77
6TR
IM31
A/G
1.0
81
.9 ×
10
−8
0.2
21
.01
0.9
10
.15
1.0
10
.87
0.2
71
.03
0.6
90
.26
1.0
71
.4 ×
10
−7
0.2
5
rs1
15
30
69
67
6p2
1, 3
2,4
00
,93
9H
LA-D
RB
6G
/C1
.08
2.7
× 1
0−9
0.6
50
.92
0.0
20
.81
1.0
90
.29
0.8
11
.01
0.8
60
.76
1.0
68
.7 ×
10
−7
5.2
× 1
0−4
rs5
62
32
50
67
p12
, 4
7,4
37
,24
4TN
S3A
/G1
.07
1.8
× 1
0−9
0.4
50
.99
0.7
60
.13
1.0
00
.99
0.3
11
.11
0.1
20
.52
1.0
68
.9 ×
10
−9
0.1
3
rs1
76
94
49
39
p21
, 2
2,0
41
,99
8CD
KN
2B-A
S1G
/C1
.10
4.0
× 1
0−8
0.1
41
.00
0.9
70
.11
1.0
40
.78
0.0
20
.78
0.0
40
.08
1.0
81
.1 ×
10
−6
0.0
1
rs7
69
34
03
41
0q1
1, 4
6,0
82
,98
5M
ARCH
8T/
C1
.14
4.8
× 1
0−9
0.9
10
.98
0.8
80
.98
e1
.06
0.6
40
.92
1.1
31
.1 ×
10
−8
0.3
9
rs1
12
14
77
51
1q2
3, 1
13
,80
7,1
81
HTR
3BG
/A1
.08
3.0
× 1
0−8
0.7
11
.04
0.2
20
.71
1.0
20
.70
0.7
11
.06
0.4
70
.81
1.0
74
.5 ×
10
−8
0.3
9
rs8
01
30
81
91
2q1
3, 4
8,4
19
,61
8R
P1-2
28P1
6.4
A/C
1.1
34
.3 ×
10
−8
0.9
11
.28
0.0
20
.98
e1
.22
0.1
70
.94
1.1
42
.2 ×
10
−9
0.4
4
rs8
01
46
71
14
q24
, 7
1,0
92
,25
6TT
C9G
/A1
.07
1.3
× 1
0−8
0.5
91
.00
0.8
50
.46
1.0
30
.40
0.3
60
.98
0.7
50
.60
1.0
62
.5 ×
10
−7
0.0
9
rs2
80
70
31
Xp1
1,
52
,89
6,9
49
XAG
E3C
/T1
.07
8.5
× 1
0−1
00
.18
1.0
60
.02
0.2
21
.17
0.1
60
.05
1.0
20
.82
0.0
91
.07
2.7
× 1
0−1
10
.77
rs6
62
57
11
Xq1
3,
70
,13
9,8
50
SLC7
AA
/T1
.07
6.3
× 1
0−1
20
.41
0.9
20
.00
40
.83
0.9
90
.86
0.4
80
.97
0.5
20
.61
1.0
46
.4 ×
10
−7
8.4
× 1
0−6
rs4
84
42
89
Xq1
3,
70
,40
7,9
83
NLG
N3-
BCY
RN
1G
/A1
.05
1.3
× 1
0−9
0.3
90
.99
0.5
80
.68
1.0
00
.99
0.7
21
.09
0.0
50
.59
1.0
48
.9 ×
10
−8
0.0
4
ris
k lo
ci id
enti
fied
in m
ulti
-anc
estr
y m
eta-
anal
ysis
rs1
77
51
48
1q3
2, 2
05
,75
7,8
24
SLC4
1A1
C/T
1.0
61
.0 ×
10
−5
0.2
71
.06
0.0
40
.63
1.1
22
.0 ×
10
−3
0.5
21
.02
0.8
20
.66
1.0
63
.8 ×
10
−8
0.4
0
rs9
44
31
89
6q1
4, 7
6,4
95
,88
2M
YO6
G/A
1.0
75
.2 ×
10
−5
0.1
41
.11
4.5
× 1
0−4
0.5
31
.07
0.0
80
.32
1.0
10
.93
0.1
41
.08
3.9
× 1
0−8
0.6
4
rs7
15
36
48
14
q23
, 6
1,1
22
,52
6SI
X1C
/G1
.09
6.8
× 1
0−4
0.0
61
.11
8.8
× 1
0−4
0.3
41
.17
1.4
× 1
0−4
0.3
01
.12
0.2
70
.10
1.1
12
.0 ×
10
−9
0.5
0
rs1
20
51
44
31
6q2
2, 7
1,6
91
,32
9PH
LPP2
A/G
1.0
61
.1 ×
10
−5
0.3
41
.09
0.0
10
.25
1.1
00
.02
0.6
51
.06
0.3
40
.50
1.0
63
.0 ×
10
−8
0.6
9
rs1
24
80
32
82
0q1
3, 4
9,5
27
,92
2AD
NP
T/C
1.1
31
.6 ×
10
−7
0.9
31
.14
2.3
× 1
0−3
0.8
71
.30
7.7
× 1
0−4
0.9
40
.97
0.8
10
.93
1.1
34
.6 ×
10
−1
10
.18
rs1
04
14
49
21
q22
, 4
2,9
01
,42
1TM
PRSS
2G
/A1
.06
2.6
× 1
0−7
0.4
41
.07
0.0
30
.39
1.0
20
.79
0.1
21
.03
0.6
50
.44
1.0
62
.8 ×
10
−8
0.8
4
rs2
23
87
76
22
q11
, 1
9,7
57
,89
2TB
X1G
/A1
.09
1.6
× 1
0−7
0.8
00
.98
0.8
10
.95
1.0
80
.03
0.6
01
.09
0.2
20
.73
1.0
81
.8 ×
10
−8
0.6
0
ris
k lo
ci id
enti
fied
in e
arly
-ons
et m
eta-
anal
ysis
f
rs6
36
29
11
p35
, 1
0,5
56
,09
7PE
X14
A/G
1.1
82
.1 ×
10
−8
0.1
6a R
isk
alle
le f
requ
ency
. b G
enom
e B
uild
37
. c R
isk
alle
le/o
ther
alle
le.
d P v
alue
for
eff
ect
hete
roge
neit
y ac
ross
pop
ulat
ions
. e M
AF
of <
1%
. f A
naly
sis
was
lim
ited
to
Eur
opea
n-an
cest
ry p
opul
atio
ns a
s on
ly s
mal
l num
bers
of
earl
y-on
set
case
s (≤
55
yea
rs o
f ag
e) w
ere
avai
labl
e in
the
oth
er p
opul
atio
ns.
npg
© 2
014
Nat
ure
Am
eric
a, In
c. A
ll rig
hts
rese
rved
.
1106 VOLUME 46 | NUMBER 10 | OCTOBER 2014 Nature GeNetics
l e t t e r s
with rs72646967 (encoding p.Asn397His) in TBX1). On the basis of functional annotations of transcription factor occupancy, response element disruption, histone marks and DNase I–sensitive regions in prostate cancer cell lines (Online Methods), 12 of the risk variants were found to be either directly located within putative functional elements or were correlated (at r2 > 0.9 in 1000 Genomes Project EUR populations) with such variants (Supplementary Table 14). Using gene expression data for 145 prostate cancer tumor samples from The Cancer Genome Atlas (TCGA) (Online Methods), we also examined the cis associations between the index SNPs and the expression of gene transcripts within the 1-Mb region centered on each SNP. Among the 23 loci, 5 cis associations were observed, albeit the associations were modest (Online Methods and Supplementary Table 14).
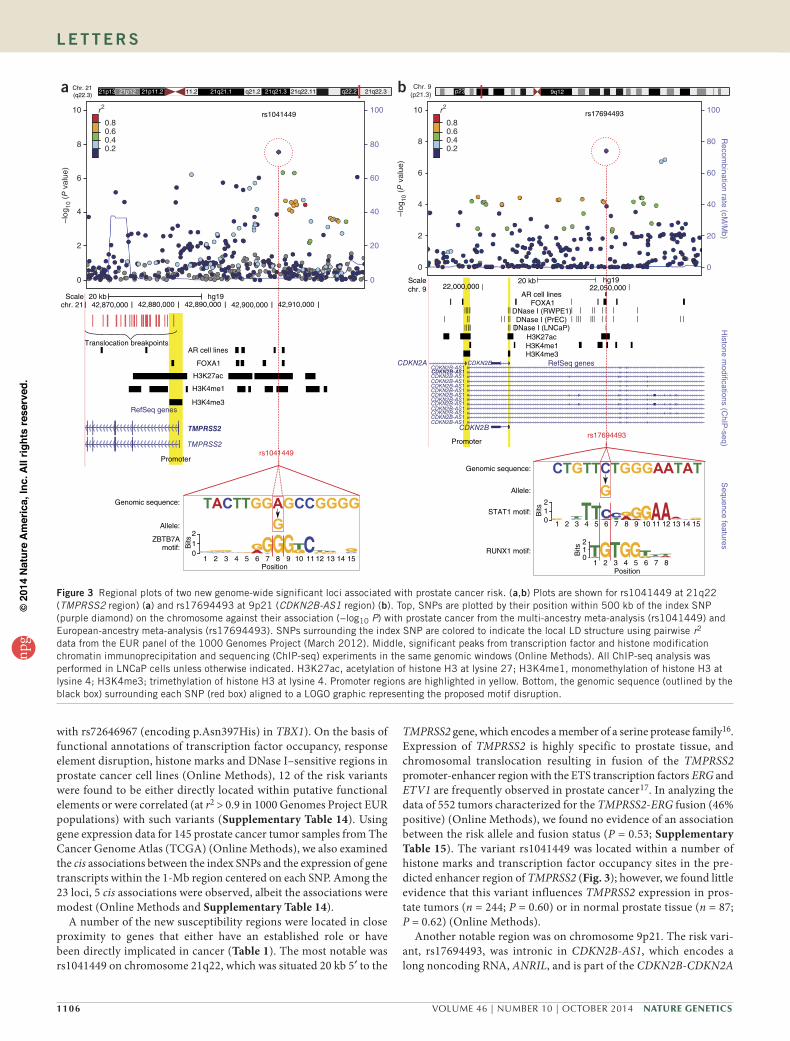
A number of the new susceptibility regions were located in close proximity to genes that either have an established role or have been directly implicated in cancer (Table 1). The most notable was rs1041449 on chromosome 21q22, which was situated 20 kb 5′ to the
TMPRSS2 gene, which encodes a member of a serine protease family16. Expression of TMPRSS2 is highly specific to prostate tissue, and chromosomal translocation resulting in fusion of the TMPRSS2 promoter-enhancer region with the ETS transcription factors ERG and ETV1 are frequently observed in prostate cancer17. In analyzing the data of 552 tumors characterized for the TMPRSS2-ERG fusion (46% positive) (Online Methods), we found no evidence of an association between the risk allele and fusion status (P = 0.53; Supplementary Table 15). The variant rs1041449 was located within a number of histone marks and transcription factor occupancy sites in the pre-dicted enhancer region of TMPRSS2 (Fig. 3); however, we found little evidence that this variant influences TMPRSS2 expression in pros-tate tumors (n = 244; P = 0.60) or in normal prostate tissue (n = 87; P = 0.62) (Online Methods).
Another notable region was on chromosome 9p21. The risk vari-ant, rs17694493, was intronic in CDKN2B-AS1, which encodes a long noncoding RNA, ANRIL, and is part of the CDKN2B-CDKN2A
Chr. 21(q22.3)
11.2 q21.2 21q22.11 21q22.3
rs1041449
Scalechr. 9
42,900,000 42,910,000
22,000,000 22,050,000hg1920 kb
AR cell linesFOXA1
DNase I (RWPE1)DNase I (PrEC)
DNase I (LNCaP)H3K27acH3K4me1H3K4me3
42,890,000
AR cell lines
FOXA1
H3K27ac
H3K4me1
H3K4me3
rs1041449
rs17694493
Promoter
Promoter
Genomic sequence:
Genomic sequence:
Allele:
ZBTB7A
Bits
PositionPosition
210
Bits
210
Bits
2101 15141312111098765432
1 15141312111098765432
1 8765432
motif:
Allele:
STAT1 motif:
RUNX1 motif:
RefSeq genes
RefSeq genesCDKN2A
CDKN2B
CDKN2BCDKN2B-AS1CDKN2B-AS1CDKN2B-AS1CDKN2B-AS1CDKN2B-AS1CDKN2B-AS1CDKN2B-AS1CDKN2B-AS1CDKN2B-AS1CDKN2B-AS1CDKN2B-AS1CDKN2B-AS1CDKN2B-AS1
TMPRSS2
TMPRSS2
42,880,00042,870,000
Translocation breakpoints
chr. 21Scale 20 kb hg19
21p13 21p12 21p11.2 21q21.1 21q21.3 q22.2 p23 9q12
10
0.8
a br2
0.60.40.28
6
–log
10 (P
val
ue)
4
2
0
100
80
60
40
20
0
rs1769449310
0.8
r2
0.60.40.2
8
6
–log
10 (P
val
ue)
4
2
0
100
80
60
Recom
bination rate (cM/M
b)H
istone modifications (C
hIP-seq)
Sequence features
40
20
0
Chr. 9(p21.3)
Figure 3 Regional plots of two new genome-wide significant loci associated with prostate cancer risk. (a,b) Plots are shown for rs1041449 at 21q22 (TMPRSS2 region) (a) and rs17694493 at 9p21 (CDKN2B-AS1 region) (b). Top, SNPs are plotted by their position within 500 kb of the index SNP (purple diamond) on the chromosome against their association (−log10 P) with prostate cancer from the multi-ancestry meta-analysis (rs1041449) and European-ancestry meta-analysis (rs17694493). SNPs surrounding the index SNP are colored to indicate the local LD structure using pairwise r2 data from the EUR panel of the 1000 Genomes Project (March 2012). Middle, significant peaks from transcription factor and histone modification chromatin immunoprecipitation and sequencing (ChIP-seq) experiments in the same genomic windows (Online Methods). All ChIP-seq analysis was performed in LNCaP cells unless otherwise indicated. H3K27ac, acetylation of histone H3 at lysine 27; H3K4me1, monomethylation of histone H3 at lysine 4; H3K4me3; trimethylation of histone H3 at lysine 4. Promoter regions are highlighted in yellow. Bottom, the genomic sequence (outlined by the black box) surrounding each SNP (red box) aligned to a LOGO graphic representing the proposed motif disruption.
npg
© 2
014
Nat
ure
Am
eric
a, In
c. A
ll rig
hts
rese
rved
.
Nature GeNetics VOLUME 46 | NUMBER 10 | OCTOBER 2014 1107
l e t t e r s
gene cluster (Fig. 3). The region contains highly penetrant alleles for familial melanoma and common susceptibility alleles for melanoma, breast cancer, basal cell carcinoma, lung cancer and glioma18–24. The index SNP, rs17694493, fell within chromatin biofeatures and was predicted to disrupt two transcription factor motifs (STAT1 and RUNX1), suggesting that it might have a functional effect on the regu-lation of the CDKN2B-AS1 or CDKN2B-CDKN2A genes (Fig. 3 and Supplementary Table 14); however, the variant was not found to be strongly associated with the expression of either CDKN2A (P = 0.19) or CDKN2B (P = 0.40) in the 145 TCGA prostate tumors.
Variant rs4713266 on chromosome 6p25 was located in intron 1 of NEDD9, a gene that participates in cell adhesion, motility, the cell cycle and apoptosis and has been implicated in the progres-sion and metastasis of several cancer types25. Variant rs9443189 on chromosome 6q14 was intronic in MYO6, a modulator of androgen-dependent gene expression that has been found to be overexpressed in prostate cancer tumors and to enhance prostate tumor growth and metastasis26–28. Variant rs636291 on chromosome 1p36, which we found in association with early-onset prostate cancer, was located in intron 2 of PEX14 and was correlated with rs616488 (r2 = 0.66 in 1000 Genomes Project EUR populations), a variant reported in a GWAS of breast cancer29.
The identification of new risk loci for prostate cancer through a multi-ancestry analysis demonstrates the value of combining genetic data across populations to increase statistical power for discovery. As further support for conducting multi-ancestry analyses, we examined the genome-wide evidence for consistency in the direction of the allelic associations between populations. Excluding SNPs within 500 kb of index signals at known loci (n = 77), we defined independent signals (r2 < 0.2) for the European-ancestry population of nominal significance at various P-value thresholds between <1 × 10⁻² and 1 × 10⁻⁵. For the sets of SNPs defined for men of European ances-try, 53–64% had ORs that were directionally concordant for African (P = 0.04–0.003, dependent on the P-value threshold bin), Asian (P = 0.31–0.02) or Latino (P = 0.04–0.002) men with the ORs in Europeans. This same observation remained once we removed the 23 risk loci identified by the current study (Supplementary Fig. 5). The excess of directionally consistent associations between popula-tions implies that additional common risk loci for prostate cancer may be identified through discovery efforts in multi-ancestry studies.
These 23 new loci (including rs58133635 at 22q13)15 bring the total number of susceptibility variants for prostate cancer to 100 (Supplementary Table 16). In total, we estimate that these 100 risk loci account for ~33% of the familial risk of prostate cancer in popula-tions of European ancestry, with these additional 23 loci, with effect sizes ranging from 1.06 to 1.14, explaining ~3.1% of the familial risk (Online Methods). On the basis of a polygenic risk score comprising these 100 variants for men of European ancestry (Online Methods), the top 10% of men in the highest risk stratum have a 2.9-fold (95% confidence interval (CI) = 2.8- to 3.1-fold) increase in relative risk of prostate cancer and the top 1% of men have a 5.7-fold (95% CI = 4.8- to 6.6-fold) increase in relative risk in comparison with the population average (Supplementary Table 17). The top 10% of men are at a relative risk compared with the average of the population where it will be important to examine whether targeted screening based on family history genetic risk might reduce the overdiagnosis of indolent disease, which is a main limitation of screening by PSA. Our findings demonstrate the importance of conducting large-scale genetic studies in diverse populations for the discovery of new risk loci that continue to provide new insights into disease mechanisms for complex traits.
METhodSMethods and any associated references are available in the online version of the paper.
Note: Any Supplementary Information and Source Data files are available in the online version of the paper.
AcknowledgmentsA full list of acknowledgments is detailed in the Supplementary Note.
AUtHoR contRIBUtIonsA.H., R.A.E., Z.K.-J., D.F.E., B.E.H., S.J.C., S.I.B., P. Kraft, F.W., H.N. and M.B.C. designed the study. C.A.H., Z.K.-J., A.A.A.O. and R.A.E. wrote the manuscript. A.A.A.O., F.S., Y.H., Z.W., P.W., C. Chen, E.S., D.L., K.R., T.D., S.J.-L. and K.L.P. performed the statistical analysis. D.O.S. and D.V.C. provided statistical support. D.J. Hazelett, A. Stram, K.P., X.S., G.A.C., Q.L. and M.L.F. provided bioinformatics support as well as functional annotation and QTL data. L.C.P., K.P., L.X., L.B. and M.T. conducted the genotyping and sequencing. S.B., C.G. and M. Ahmed managed the PRACTICAL and COGS database. K.G. and M.G. managed the UKGPCS database. The following authors provided samples and/or data to the study and commented on the manuscript: J.T., T.V., K.A.L., K.-T.K., S.K.M., D.J.S., S.H., B.K., A.H.C., A.P.C., D.W., W.K., A.W.P. and E.M.G. L.N.K., L.L.M. and B.E.H. are principal investigators of the MEC. J.X. and S.L.Z. are principal investigators of NCPCS. R.C.T., T.J.K., A. Siddiq and F.C. are EPIC investigators. E.R. is the principal investigator of EPIC. A. Takahashi, M.K. and H.N. are principal investigators of BBJ. J.L.S. is the principal investigator of KCPCS; S.K. coordinated data collection. V.L.S. and W.R.D. are investigators and S.M.G. is the principal investigator of CPSII. S.S.S. and C.P. are principal investigators of the MDA prostate cancer studies. S.L., D.J. Hunter, P. Kraft, L.M., E.L.G., J.M. and M. Stampfer are coinvestigators of the Harvard cohorts and BPC3. H.G. is principal investigator of CAPS and STHLM1. M. Aly and F.W. are investigators of CAPS. W.B.I. is the principal investigator of the IPCG study. A.S.K. is the principal investigator of WUGS. E.M.J. is the principal investigator of SFPCS. S.A.I. is the principal investigator of LAAPC. R.A.K. and A.B.M. are investigators of DCPC. W.B., L.B.S. and W.Z. are principal investigators of SCCS. D.A. and J.V. are principal investigators and S.W. is the study coordinator of ATBC. B.N., J. Carpten, C.L., S.-Y.W. and A. Hennis are principal investigators of PCBP. B.A.R. and C.N.-D. are principal investigators of GECAP. J.S.W. and G.C. are principal investigators of CaP Genes. D.S. is the program officer of GAME-ON. P.J.G., E.A.K., A.W.H. and L.C. are investigators of SELECT. F.C.H., J.D. and D.E.N. are principal investigators of ProtecT. E.D.Y., Y.T., R.B.B., A.A.A., E.T., A. Truelove, S.N. and A.W.H. are investigators of the Ghana Prostate Study. S.J.C., S.I.B., R.N.H., M.J.M., M.Y., C.C.C., A. Hutchinson and K.Y. are investigators of PLCO. M.R.T. is the principal investigator and P. Paulo and S.M. are investigators of IPO-Porto. J.B., J. Clements and A. Spurdle are principal investigators of QLD. R.K. and C. Slavov are the principal investigators and V.M. is an investigator of PCMUS. J.P., T.S. and H.-Y.L. are the investigators of the MOFFITT study. L.C.-A. is the principal investigator of the Utah study. C. Cybulski is the principal investigator of the Poland study. S.N.T. is the principal investigator of the Mayo study. P. Pharoah and N.P. are investigators of SEARCH. C.M. is the principal investigator of ULM; M.L., K.H. and A.E.R. are investigators of ULM. M.W., S.F.N., B.G.N., P. Klarskov, M.A.R. and P.I. are the principal investigators of CPCS1 and CPCS2. T.W., A.A. and T.L.J.T. are investigators and J.S. is the principal investigator of TAMPERE. K.M. is a UKGPCS investigator. H.B. is the principal investigator, A.K.D. prepared the data and C. Stegmaier coordinated the data collection of the ESTHER study. G.G.G. and G.S. are the principal investigators of MCCS; M. Southey is an investigator and H.P., A.M. and A.M.K. are principal investigators of the PPF-UNIS study.
comPetIng FInAncIAl InteRestsThe authors declare no competing financial interests.
Reprints and permissions information is available online at http://www.nature.com/reprints/index.html.
1. Eeles, R. et al. The genetic epidemiology of prostate cancer and its clinical implications. Nat. Rev. Urol. 11, 18–31 (2014).
2. Eeles, R.A. et al. Identification of 23 new prostate cancer susceptibility loci using the iCOGS custom genotyping array. Nat. Genet. 45, 385–391 (2013).
3. Park, J.H. et al. Estimation of effect size distribution from genome-wide association studies and implications for future discoveries. Nat. Genet. 42, 570–575 (2010).
4. Eeles, R.A. et al. Multiple newly identified loci associated with prostate cancer susceptibility. Nat. Genet. 40, 316–321 (2008).
5. Gudmundsson, J. et al. Genome-wide association and replication studies identify four variants associated with prostate cancer susceptibility. Nat. Genet. 41, 1122–1126 (2009).
npg
© 2
014
Nat
ure
Am
eric
a, In
c. A
ll rig
hts
rese
rved
.

1108 VOLUME 46 | NUMBER 10 | OCTOBER 2014 Nature GeNetics
l e t t e r s
6. Schumacher, F.R. et al. Genome-wide association study identifies new prostate cancer susceptibility loci. Hum. Mol. Genet. 20, 3867–3875 (2011).
7. Thomas, G. et al. Multiple loci identified in a genome-wide association study of prostate cancer. Nat. Genet. 40, 310–315 (2008).
8. Cheng, I. et al. Evaluating genetic risk for prostate cancer among Japanese and Latinos. Cancer Epidemiol. Biomarkers Prev. 21, 2048–2058 (2012).
9. Haiman, C.A. et al. Characterizing genetic risk at known prostate cancer susceptibility loci in African Americans. PLoS Genet. 7, e1001387 (2011).
10. Duggan, D. et al. Two genome-wide association studies of aggressive prostate cancer implicate putative prostate tumor suppressor gene DAB2IP. J. Natl. Cancer Inst. 99, 1836–1844 (2007).
11. Haiman, C.A. et al. Genome-wide association study of prostate cancer in men of African ancestry identifies a susceptibility locus at 17q21. Nat. Genet. 43, 570–573 (2011).
12. Cook, M.B. et al. A genome-wide association study of prostate cancer in West African men. Hum. Genet. 133, 509–521 (2014).
13. Akamatsu, S. et al. Common variants at 11q12, 10q26 and 3p11.2 are associated with prostate cancer susceptibility in Japanese. Nat. Genet. 44, 426–429 (2012).
14. Takata, R. et al. Genome-wide association study identifies five new susceptibility loci for prostate cancer in the Japanese population. Nat. Genet. 42, 751–754 (2010).
15. Sun, J. et al. Sequence variants at 22q13 are associated with prostate cancer risk. Cancer Res. 69, 10–15 (2009).
16. Hedstrom, L. Serine protease mechanism and specificity. Chem. Rev. 102, 4501–4524 (2002).
17. Morris, D.S., Tomlins, S.A., Montie, J.E. & Chinnaiyan, A.M. The discovery and application of gene fusions in prostate cancer. BJU Int. 102, 276–282 (2008).
18. Falchi, M. et al. Genome-wide association study identifies variants at 9p21 and 22q13 associated with development of cutaneous nevi. Nat. Genet. 41, 915–919 (2009).
19. Hussussian, C.J. et al. Germline p16 mutations in familial melanoma. Nat. Genet. 8, 15–21 (1994).
20. Shete, S. et al. Genome-wide association study identifies five susceptibility loci for glioma. Nat. Genet. 41, 899–904 (2009).
21. Stacey, S.N. et al. New common variants affecting susceptibility to basal cell carcinoma. Nat. Genet. 41, 909–914 (2009).
22. Turnbull, C. et al. Genome-wide association study identifies five new breast cancer susceptibility loci. Nat. Genet. 42, 504–507 (2010).
23. Wrensch, M. et al. Variants in the CDKN2B and RTEL1 regions are associated with high-grade glioma susceptibility. Nat. Genet. 41, 905–908 (2009).
24. Timofeeva, M.N. et al. Influence of common genetic variation on lung cancer risk: meta-analysis of 14 900 cases and 29 485 controls. Hum. Mol. Genet. 21, 4980–4995 (2012).
25. Tikhmyanova, N., Little, J.L. & Golemis, E.A. CAS proteins in normal and pathological cell growth control. Cell. Mol. Life Sci. 67, 1025–1048 (2010).
26. Loikkanen, I. et al. Myosin VI is a modulator of androgen-dependent gene expression. Oncol. Rep. 22, 991–995 (2009).
27. Puri, C. et al. Overexpression of myosin VI in prostate cancer cells enhances PSA and VEGF secretion, but has no effect on endocytosis. Oncogene 29, 188–200 (2010).
28. Wei, S., Dunn, T.A., Isaacs, W.B., De Marzo, A.M. & Luo, J. GOLPH2 and MYO6: putative prostate cancer markers localized to the Golgi apparatus. Prostate 68, 1387–1395 (2008).
29. Michailidou, K. et al. Large-scale genotyping identifies 41 new loci associated with breast cancer risk. Nat. Genet. 45, 353–361 (2013).
Ali Amin Al olama1,96, Zsofia kote-Jarai2,96, sonja I Berndt3, david V conti4,5, Fredrick schumacher4,5, Ying Han4, sara Benlloch1, dennis J Hazelett4,5, Zhaoming wang3,6, ed saunders2, daniel leongamornlert2, sara lindstrom7, sara Jugurnauth-little2, tokhir dadaev2, malgorzata tymrakiewicz2, daniel o stram4,5, kristin Rand4, Peggy wan4, Alex stram4, Xin sheng4, loreall c Pooler4, karen Park4, lucy Xia4, Jonathan tyrer1, laurence n kolonel8, loic le marchand8, Robert n Hoover3, mitchell J machiela3, merideth Yeager3, laurie Burdette3, charles c chung3, Amy Hutchinson3, kai Yu3, chee goh2, mahbubl Ahmed2, koveela govindasami2, michelle guy2, teuvo l J tammela9, Anssi Auvinen10, tiina wahlfors11, Johanna schleutker11,12, tapio Visakorpi13, katri A leinonen13, Jianfeng Xu14, markus Aly15,16, Jenny donovan17, Ruth c travis18, tim J key18, Afshan siddiq19, Federico canzian20, kay-tee khaw21, Atsushi takahashi22, michiaki kubo23, Paul Pharoah24, nora Pashayan24, maren weischer25, Borge g nordestgaard25,26, sune F nielsen25,26, Peter klarskov27, martin Andreas Røder28, Peter Iversen28, stephen n thibodeau29, shannon k mcdonnell29, daniel J schaid29, Janet l stanford30,31, suzanne kolb30, sarah Holt32, Beatrice knudsen33, Antonio Hurtado coll34, susan m gapstur35, w Ryan diver35, Victoria l stevens35, christiane maier36, manuel luedeke36, kathleen Herkommer37, Antje e Rinckleb36, sara s strom38, curtis Pettaway39, edward d Yeboah40,41, Yao tettey40,41, Richard B Biritwum40,41, Andrew A Adjei40,41, evelyn tay40,41, Ann truelove42, shelley niwa42, Anand P chokkalingam43, lisa cannon-Albright44,45, cezary cybulski46, dominika wokołorczyk46, wojciech kluźniak46, Jong Park47, thomas sellers47, Hui-Yi lin48, william B Isaacs49, Alan w Partin49, Hermann Brenner50,51, Aida karina dieffenbach50,51, christa stegmaier52, constance chen7, edward l giovannucci53,54, Jing ma55, meir stampfer53–55, kathryn l Penney53,55, lorelei mucci53,55, esther m John56,57, sue A Ingles4,5, Rick A kittles58, Adam B murphy59, Hardev Pandha60, Agnieszka michael60, Andrzej m kierzek60, william Blot61,62, lisa B signorello53,55, wei Zheng62, demetrius Albanes63, Jarmo Virtamo64, stephanie weinstein63, Barbara nemesure65, John carpten66, cristina leske65, suh-Yuh wu65, Anselm Hennis65,67, Adam s kibel68, Benjamin A Rybicki69, christine neslund-dudas69, Ann w Hsing56,57, lisa chu56,57, Phyllis J goodman70, eric A klein71, s lilly Zheng14, Jyotsna Batra72, Judith clements72, Amanda spurdle73, manuel R teixeira74,75, Paula Paulo74, sofia maia74, chavdar slavov76, Radka kaneva77, Vanio mitev77, John s witte78,79, graham casey4,5, elizabeth m gillanders80, daniella seminara80, elio Riboli81, Freddie c Hamdy82, gerhard A coetzee4,5, Qiyuan li83, matthew l Freedman83, david J Hunter7, kenneth muir84,85, Henrik gronberg15, david e neal86,87, melissa southey88, graham g giles89,90, gianluca severi89–91, the Breast and Prostate cancer cohort consortium (BPc3)92, the PRActIcAl (Prostate cancer Association group to Investigate cancer-Associated Alterations in the genome) consortium92, the cogs (collaborative oncological gene-environment study) consortium92, the gAme-on/ellIPse consortium92, michael B cook3,97, Hidewaki nakagawa93,97, Fredrik wiklund15,97, Peter kraft7,94,97, stephen J chanock3,97, Brian e Henderson4,5,97, douglas F easton1,97, Rosalind A eeles2,95,97 & christopher A Haiman4,5,97
npg
© 2
014
Nat
ure
Am
eric
a, In
c. A
ll rig
hts
rese
rved
.

Nature GeNetics VOLUME 46 | NUMBER 10 | OCTOBER 2014 1109
l e t t e r s
1Centre for Cancer Genetic Epidemiology, Department of Public Health and Primary Care, University of Cambridge, Cambridge, UK. 2Institute of Cancer Research, London, UK. 3Division of Cancer Epidemiology and Genetics, National Cancer Institute, US National Institute of Health, Bethesda, Maryland, USA. 4Department of Preventive Medicine, Keck School of Medicine, University of Southern California, Los Angeles, California, USA. 5Norris Comprehensive Cancer Center, University of Southern California, Los Angeles, California, USA. 6Cancer Genomics Research Laboratory, National Cancer Institute, Division of Cancer Epidemiology and Genetics, SAIC-Frederick, Inc., Frederick, Maryland, USA. 7Program in Genetic Epidemiology and Statistical Genetics, Department of Epidemiology, Harvard School of Public Health, Boston, Massachusetts, USA. 8Epidemiology Program, University of Hawaii Cancer Center, Honolulu, Hawaii, USA. 9Department of Urology, Tampere University Hospital and Medical School, University of Tampere, Tampere, Finland. 10Department of Epidemiology, School of Health Sciences, University of Tampere, Tampere, Finland. 11BioMediTech, University of Tampere and FimLab Laboratories, Tampere, Finland. 12Department of Medical Biochemistry, Institute of Biomedicine, University of Turku, Turku, Finland. 13Institute of Biomedical Technology/BioMediTech, University of Tampere and Tampere University Hospital, Tampere, Finland. 14Center for Cancer Genomics, Wake Forest School of Medicine, Winston-Salem, North Carolina, USA. 15Department of Medical Epidemiology and Biostatistics, Karolinska Institute, Stockholm, Sweden. 16Department of Clinical Sciences at Danderyds Hospital, Stockholm, Sweden. 17School of Social and Community Medicine, University of Bristol, Bristol, UK. 18Cancer Epidemiology Unit, Nuffield Department of Population Health, University of Oxford, Oxford, UK. 19Department of Genomics of Common Disease, School of Public Health, Imperial College London, London, UK. 20Genomic Epidemiology Group, German Cancer Research Center (DKFZ), Heidelberg, Germany. 21Clinical Gerontology Unit, University of Cambridge, Cambridge, UK. 22Laboratory for Statistical Analysis, RIKEN Center for Integrative Medical Sciences, Yokohama, Japan. 23Laboratory for Genotyping Development, RIKEN Center for Integrative Medical Sciences, Yokohama, Japan. 24Centre for Cancer Genetic Epidemiology, Department of Oncology, University of Cambridge, Cambridge, UK. 25Department of Clinical Biochemistry, Herlev Hospital, Copenhagen University Hospital, Herlev, Denmark. 26Faculty of Healthy and Medical Sciences, University of Copenhagen, Herlev, Denmark. 27Department of Urology, Herlev Hospital, Copenhagen University Hospital, Herlev, Denmark. 28Copenhagen Prostate Cancer Center, Department of Urology, Rigshospitalet, Copenhagen University Hospital, Copenhagen, Denmark. 29Mayo Clinic, Rochester, Minnesota, USA. 30Division of Public Health Sciences, Fred Hutchinson Cancer Research Center, Seattle, Washington, USA. 31Department of Epidemiology, School of Public Health, University of Washington, Seattle, Washington, USA. 32Fred Hutchinson Cancer Research Center, Seattle, Washington, USA. 33Translational Pathology, Cedars-Sinai, Los Angeles, California, USA. 34Prostate Center, Vancouver, British Columbia, Canada. 35Epidemiology Research Program, American Cancer Society, Atlanta, Georgia, USA. 36Department of Urology, University Hospital Ulm, Ulm, Germany. 37Department of Urology, Klinikum Rechts der Isar der Technischen Universität München, Munich, Germany. 38Department of Epidemiology, University of Texas MD Anderson Cancer Center, Houston, Texas, USA. 39Department of Urology, University of Texas MD Anderson Cancer Center, Houston, Texas, USA. 40University of Ghana Medical School, Accra, Ghana. 41Korle Bu Teaching Hospital, Accra, Ghana. 42Westat, Rockville, Maryland, USA. 43School of Public Health, University of California, Berkeley, Berkeley, California, USA. 44Division of Genetic Epidemiology, Department of Medicine, University of Utah School of Medicine, Salt Lake City, Utah, USA. 45George E. Wahlen Department of Veterans Affairs Medical Center, Salt Lake City, Utah, USA. 46International Hereditary Cancer Center, Department of Genetics and Pathology, Pomeranian Medical University, Szczecin, Poland. 47Department of Cancer Epidemiology, Moffitt Cancer Center, Tampa, Florida, USA. 48Department of Biostatistics and Bioinformatics, Moffitt Cancer Center, Tampa, Florida, USA. 49James Buchanan Brady Urological Institute, Johns Hopkins Hospital and Medical Institution, Baltimore, Maryland, USA. 50Division of Clinical Epidemiology and Aging Research, German Cancer Research Center (DKFZ), Heidelberg, Germany. 51German Cancer Consortium, Heidelberg, Germany. 52Saarland Cancer Registry, Saarbrücken, Germany. 53Department of Epidemiology, Harvard School of Public Health, Boston, Massachusetts, USA. 54Department of Nutrition, Harvard School of Public Health, Boston, Massachusetts, USA. 55Channing Division of Network Medicine, Department of Medicine, Brigham and Women’s Hospital, Harvard Medical School, Boston, Massachusetts, USA. 56Cancer Prevention Institute of California, Fremont, California, USA. 57Stanford Cancer Institute, Stanford University School of Medicine, Stanford, California, USA. 58Department of Medicine, University of Illinois at Chicago, Chicago, Illinois, USA. 59Department of Urology, Northwestern University, Chicago, Illinois, USA. 60Faculty of Health and Medical Sciences, University of Surrey, Guildford, UK. 61International Epidemiology Institute, Rockville, Maryland, USA. 62Division of Epidemiology, Department of Medicine, Vanderbilt Epidemiology Center, Vanderbilt University School of Medicine, Nashville, Tennessee, USA. 63Nutritional Epidemiology Branch, Division of Cancer Epidemiology and Genetics, National Cancer Institute, US National Institute of Health, Bethesda, Maryland, USA. 64Department of Chronic Disease Prevention, National Institute for Health and Welfare, Helsinki, Finland. 65Department of Preventive Medicine, Stony Brook University, Stony Brook, New York, USA. 66Translational Genomics Research Institute, Phoenix, Arizona, USA. 67Chronic Disease Research Centre, University of the West Indies, Bridgetown, Barbados. 68Division of Urologic Surgery, Brigham and Women’s Hospital, Dana-Farber Cancer Institute, Boston, Massachusetts, USA. 69Department of Public Health Sciences, Henry Ford Hospital, Detroit, Michigan, USA. 70Southwest Oncology Group Statistical Center, Fred Hutchinson Cancer Research Center, Seattle, Washington, USA. 71Department of Urology, Glickman Urological and Kidney Institute, Cleveland Clinic, Cleveland, Ohio, USA. 72Australian Prostate Cancer Research Centre–Queensland, Institute of Health and Biomedical Innovation and School of Biomedical Science, Queensland University of Technology, Translational Research Institute, Brisbane, Queensland, Australia. 73Molecular Cancer Epidemiology Laboratory, QIMR Berghofer Medical Research Institute, Brisbane, Queensland, Australia. 74Department of Genetics, Portuguese Oncology Institute, Porto, Portugal. 75Biomedical Sciences Institute, University of Porto, Porto, Portugal. 76Department of Urology, Medical University–Sofia, Sofia, Bulgaria. 77Department of Medical Chemistry and Biochemistry, Molecular Medicine Center, Medical University–Sofia, Sofia, Bulgaria. 78Institute for Human Genetics, University of California, San Francisco, San Francisco, California, USA. 79Department of Epidemiology and Biostatistics, University of California, San Francisco, San Francisco, California, USA. 80Division of Cancer Control and Population Sciences, National Cancer Institute, Bethesda, Maryland, USA. 81Department of Epidemiology and Biostatistics, School of Public Health, Imperial College London, London, UK. 82Nuffield Department of Surgical Sciences, University of Oxford, Oxford, UK. 83Department of Medical Oncology, Dana-Farber Cancer Institute, Boston, Massachusetts, USA. 84Institute of Population Health, University of Manchester, Manchester, UK. 85Warwick Medical School, University of Warwick, Coventry, UK. 86Cancer Research UK, Cambridge Research Institute, Li Ka Shing Centre, Cambridge, UK. 87Department of Oncology, University of Cambridge, Addenbrooke’s Hospital, Cambridge, UK. 88Genetic Epidemiology Laboratory, Department of Pathology, University of Melbourne, Parkville, Victoria, Australia. 89Cancer Epidemiology Centre, Cancer Council Victoria, Melbourne, Victoria, Australia. 90Centre for Epidemiology and Biostatistics, Melbourne School of Population and Global Health, University of Melbourne, Melbourne, Victoria, Australia. 91Human Genetics Foundation, Torino, Italy. 92A full list of members and affiliations appears in the Supplementary Note. 93Laboratory for Genome Sequencing Analysis, RIKEN Center for Integrative Medical Sciences, Tokyo, Japan. 94Department of Biostatistics, Harvard School of Public Health, Boston, Massachusetts, USA. 95Royal Marsden National Health Service (NHS) Foundation Trust, London and Sutton, UK. 96These authors contributed equally to this work. 97These authors jointly directed this work. Correspondence should be addressed to C.A.H. ([email protected]) or R.A.E. ([email protected]).
npg
© 2
014
Nat
ure
Am
eric
a, In
c. A
ll rig
hts
rese
rved
.
Nature GeNetics doi:10.1038/ng.3094
oNLINE METhodSPrimary genotype data were used from 4 prostate cancer GWAS in men of European ancestry (UK/Australia stages 1 and 2; CAPS 1 and 2; BPC3; and Pegasus) and a custom replication array with ~200,000 markers (iCOGS), 2 GWAS in men of African ancestry (AAPC and Ghana Prostate Study), 2 GWAS in Japanese men (JAPC and BBJ) and a single scan in Latinos (LABC)2,4–8,10–14 (Supplementary Tables 1–3 and Supplementary Note). Genotypes in all scans were imputed for ~17 million SNPs/indels using the 1000 Genomes Project (March 2012 release) as a reference panel. UK/Australia stages 1 and 2, CAPS 1 and 2, PEGASUS, iCOGS, AAPC, Ghana Prostate Study, LABC and JAPC were imputed using IMPUTE V2 (ref. 30). BPC3, BBJ and PEGASUS were imputed using Minimac. β values and standard errors for each SNP were estimated with stratification by study adjusting for principal components. In addition to analyses of overall prostate cancer risk, we performed secondary analyses of aggressive and early-onset disease (age at diagnosis of ≤55). Aggressive pros-tate cancer was defined by a Gleason score of ≥8, a disease stage of ‘distant’, a PSA level of >100 ng/ml or death from prostate cancer. We included imputed data for SNPs with quality information scores of >0.3 (IMPUTE V2) or with estimated correlation between the genotype scores and the true genotypes (r2) of >0.3 (Minimac). We limited the analysis to SNPs/indels on chromosomes 1–22 as well as the X chromosome with MAF greater than 1%, except in iCOGS and PEGASUS, which used arrays with coverage of less common alleles, where the MAF threshold was reduced to 0.5%.
Tests of homogeneity of the ORs across populations and studies were assessed using likelihood ratio tests. Risk heterogeneity by disease aggres-siveness and age was assessed using a case-only analysis. Associations between SNP genotypes and PSA levels were assessed using linear regression, after log transformation of PSA levels to correct for skewness. Analyses were performed using SNPTEST, ProbABEL31, PLINK, Stata and an in-house C++ program (Supplementary Table 2). METAL was used to perform fixed-effect ancestry-specific and multi-ancestry meta-analyses for overall prostate cancer, as well as secondary meta-analyses of aggressive and early-onset disease32.
Inflation. We excluded SNPs within 500 kb of any previously known prostate cancer risk locus and estimated the inflation for each study on the basis of the 45th percentile of the test statistic. Inflation was estimated to be 1.00 in the Latino-ancestry study, 1.03 in the African-ancestry study, 1.06 in the Japanese-ancestry study and 1.14 in the European-ancestry study and was estimated to be 1.07 in the European-ancestry studies when SNPs at known risk loci and the iCOGS and UK2 studies were removed (Supplementary Table 4). The inflation factor was converted to an equivalent inflation factor for a study with 1,000 cases and 1,000 controls (λ1,000) by adjusting by effective study size, namely:
l l1 000 11 500 1
1 1,
( )= + −
+
−
∑ n mk kk
where nk and mk were the number of cases and controls, respectively, for study k. Following the conversion, the study-specific λ values ranged from 0.995 to 1.083.
Genotyping and concordance. The most significant associations in the meta-analyses were observed with imputed SNPs. To validate the accuracy of the imputed genotypes, we genotyped each variant in ≥1,847 samples (except rs9443189 and rs12051443, which were sequenced in 183 and 265 samples, respectively) that were included in the meta-analysis, and esti-mated the correlation between imputed and genotyped alleles. A correla-tion of ≥0.75 was used as the confidence threshold for imputation quality (Supplementary Table 6).
Functional annotation. We used a number of publicly available prostate epi-thelium and prostate cancer Encyclopedia of DNA Elements (ENCODE) data sets of chromatin features to identify putative enhancer and regulatory regions at each risk locus33,34. Integration of chromatin biofeature annotations with the index SNPs and correlated markers (r2 > 0.9) from the 1000 Genomes Project EUR populations was performed using FunciSNP35. These data sets
included LNCaP and RWPEI DNase I–hypersensitive sites (Gene Expression Omnibus (GEO), GSE32970) from ENCODE; PrEC DNase I–hypersensitive sites (GSE29692) from ENCODE; LNCaP CTCF ChIP-seq peaks (GSE33213) from ENCODE; LNCaP H3K27ac and TCF7L2 ChIP-seq peaks (GSE51621)33; LNCaP H3K4me3 and H3K4me1 histone modification ChIP-seq peaks (GSE27823)36; FOXA1 ChIP-seq peaks (GSE28264)37; androgen receptor (AR) ChIP-seq peaks38 and AR-binding sites (GSE28219)39; and NKX3-1 ChIP-seq peaks (GSE28264)37. We also used the highly conserved set of pre-dicted microRNA targets (miRcode 11, June 2012 release)40. To determine whether any of the putative functional SNPs potentially affected the binding of known transcription factors, position-specific frequency matrices were employed from Factorbook33,41.
Cis expression quantitative trait locus analysis. Each risk locus was repre-sented by an index SNP. For each index SNP, we retrieved all the correlated (r2 ≥ 0.9) variants from the EUR populations of the 1000 Genomes Project. The genotypes of the correlated variants in 145 prostate tumor samples and 33 normal tissue samples were downloaded from the TCGA database (February 2013). If a variant was not represented in the TCGA data, the genotypes were imputed using IMPUTE2 (ref. 30). A cis expression quantitative trait locus (eQTL) analysis was performed for these variants and any transcript within a 1-Mb interval (500 kb on either side). Gene expression values were adjusted for somatic copy number and CpG methylation as previously described42. Each risk variant was corrected for the number of transcripts in the interval. Significant associations were defined as having a nominal P value of <0.05 and a false discovery rate of <0.05 on the basis of the Benjamini-Hochberg method.
For the TMPRSS2 locus, we also used gene expression data generated from formalin-fixed, paraffin-embedded tissue in the Physicians’ Health Study cohort43. RNA was extracted with the Agencourt FormaPure FFPE kit (Beckman Coulter) and amplified using the WT-Ovation FFPE System V2 (NuGEN). cDNA was hybridized to the GeneChip Human Exon 1.0 ST microarray (Affymetrix). The residuals were shifted to have the original mean expression values and were normalized using the RMA method44,45. The SNP (rs1041449) was available in the BPC3 GWAS samples6; 99 participants had both tumor expression and genotype data; 54 had both normal prostate expres-sion and genotype data.
Determination of TMPRSS2-ERG fusion status. The TMPRSS2-ERG fusion was assessed in a subset of 552 cases from study samples of FHCRC, UKGPCS, TAMPERE, ULM and IPO-PORTO. The majority of cases were typed for TMPRSS2-ERG rearrangements on formalin-fixed, paraffin-embedded tumor materials using FISH techniques according to Summersgill et al.46 (for UKGPCS and FHCRC), Perner et al.47 (for ULM) or Saramaki et al.48 (for TAMPERE). The IPO-PORTO group applied quantitative RT-PCR to RNA from fresh- frozen tumor tissues using a TaqMan gene expression assay (Hs03063375_ft, Life Technologies) for the fusion transcript T1G4, which is present in approximately 90% of all TMPRSS2-ERG–positive prostate cancers.
Comparison of the number of associated loci among populations. We used the meta-analysis results from each population to evaluate the excess fraction of directionally consistent effect estimates (ORs) across popula-tions, as evidence for additional shared susceptibility loci. We excluded the previously known prostate cancer risk regions as well as those identi-fied in the current study (within 500 kb of index SNP) and compared the direction of association of SNPs defined in the European-ancestry popula-tion with those in the other populations for several P-value thresholds. The P values provided are based on a χ2 binomial test for comparing propor-tions versus the 50% chance that the effects are in the same direction for each P-value cutoff.
Contribution to familial risk and risk stratification. The contribution of the known SNPs to the familial risk of prostate cancer, under a multiplicative model, was computed using the formula:
k k∑ (log )(log )
ll0
npg
© 2
014
Nat
ure
Am
eric
a, In
c. A
ll rig
hts
rese
rved
.

Nature GeNeticsdoi:10.1038/ng.3094
where λ0 is the observed familial risk to the first-degree relatives of prostate cancer cases, assumed to be 2, and λk is the familial relative risk due to locus k, given by:
lkk k k
k k k
p r q
p r q=
+
+( )
2
2
where pk is the frequency of the risk allele for locus k, qk = 1 – pk and rk is the estimated per-allele OR (ref. 2).
On the basis of the assumption of a log-additive model, we constructed a polygenic risk score (PRS) from the summed genotypes weighted by the per-allele log OR (ref. 3). Thus, for each individual j we derived:
Score j ii
Nijg=
=∑ b
1
where N is the number of SNPs, gij is the allele dosage at SNP i (0, 1 or 2) for individual j and βi is the per-allele log OR of SNP i.
The risk of prostate cancer was estimated for percentiles of the distribution of the PRS (<1%, 1–10%, 10–25%, 25–57%, 75–90%, 90–99% and >99%). We used effect sizes obtained from the meta-analysis of the European-ancestry population and used the data from the iCOGS study for this estimation.
33. Hazelett, D.J. et al. Comprehensive functional annotation of 77 prostate cancer risk loci. PLoS Genet. 10, e1004102 (2014).
34. Thurman, R.E. et al. The accessible chromatin landscape of the human genome. Nature 489, 75–82 (2012).
35. Coetzee, S.G., Rhie, S.K., Berman, B.P., Coetzee, G.A. & Noushmehr, H. FunciSNP: an R/bioconductor tool integrating functional non-coding data sets with genetic association studies to identify candidate regulatory SNPs. Nucleic Acids Res. 40, e139 (2012).
36. Wang, D. et al. Reprogramming transcription by distinct classes of enhancers functionally defined by eRNA. Nature 474, 390–394 (2011).
37. Tan, P.Y. et al. Integration of regulatory networks by NKX3-1 promotes androgen-dependent prostate cancer survival. Mol. Cell. Biol. 32, 399–414 (2012).
38. Andreu-Vieyra, C. et al. Dynamic nucleosome-depleted regions at androgen receptor enhancers in the absence of ligand in prostate cancer cells. Mol. Cell. Biol. 31, 4648–4662 (2011).
39. Sharma, N.L. et al. The androgen receptor induces a distinct transcriptional program in castration-resistant prostate cancer in man. Cancer Cell 23, 35–47 (2013).
40. Jeggari, A., Marks, D.S. & Larsson, E. miRcode: a map of putative microRNA target sites in the long non-coding transcriptome. Bioinformatics 28, 2062–2063 (2012).
41. Wang, J. et al. Sequence features and chromatin structure around the genomic regions bound by 119 human transcription factors. Genome Res. 22, 1798–1812 (2012).
42. Li, Q. et al. Integrative eQTL-based analyses reveal the biology of breast cancer risk loci. Cell 152, 633–641 (2013).
43. Physicians’ Health Study Research Group. Final report on the aspirin component of the ongoing Physicians’ Health Study. Steering Committee of the Physicians’ Health Study Research Group. N. Engl. J. Med. 321, 129–135 (1989).
44. Irizarry, R.A. et al. Summaries of Affymetrix GeneChip probe level data. Nucleic Acids Res. 31, e15 (2003).
45. Irizarry, R.A. et al. Exploration, normalization, and summaries of high density oligonucleotide array probe level data. Biostatistics 4, 249–264 (2003).
46. Summersgill, B., Clark, J. & Shipley, J. Fluorescence and chromogenic in situ hybridization to detect genetic aberrations in formalin-fixed paraffin embedded material, including tissue microarrays. Nat. Protoc. 3, 220–234 (2008).
47. Perner, S. et al. TMPRSS2-ERG fusion prostate cancer: an early molecular event associated with invasion. Am. J. Surg. Pathol. 31, 882–888 (2007).
48. Saramäki, O.R. et al. TMPRSS2:ERG fusion identifies a subgroup of prostate cancers with a favorable prognosis. Clin. Cancer Res. 14, 3395–3400 (2008).
30. Howie, B.N., Donnelly, P. & Marchini, J. A flexible and accurate genotype imputation method for the next generation of genome-wide association studies. PLoS Genet. 5, e1000529 (2009).
31. Aulchenko, Y.S., Struchalin, M.V. & van Duijn, C.M. ProbABEL package for genome-wide association analysis of imputed data. BMC Bioinformatics 11, 134 (2010).
32. Willer, C.J., Li, Y. & Abecasis, G.R. METAL: fast and efficient meta-analysis of genomewide association scans. Bioinformatics 26, 2190–2191 (2010).
npg
© 2
014
Nat
ure
Am
eric
a, In
c. A
ll rig
hts
rese
rved
.