a method for clustering gene expression data based … · a method for clustering gene ......
TRANSCRIPT
Genome Informatics 15(2): 151–160 (2004) 151
A Method for Clustering Gene Expression Data
Based on Graph Structure
Shigeto Seno1 Reiji Teramoto2
[email protected] [email protected]
Yoichi Takenaka1 Hideo Matsuda1
[email protected] [email protected] Department of Bioinformatic Engineering, Graduate School of Information Science
and Technology, Osaka University, 1-3 Machikaneyama, Toyonaka, Osaka 560-8531,Japan
2 Genomic Science Laboratories, Research Division, Sumitomo Pharmaceuticals Co.,Ltd., 3-1-98 Kasugade Naka, Konohana-ku, Osaka 554-0022, Japan
AbstractRecently, gene expression data under various conditions have largely been obtained by the
utilization of the DNA microarrays and oligonucleotide arrays. There have been emerging demandsto analyze the function of genes from the gene expression profiles. For clustering genes from theirexpression profiles, hierarchical clustering has been widely used. The clustering method representsthe relationships of genes as a tree structure by connecting genes using their similarity scores basedon the Pearson correlation coefficient. But the clustering method is sensitive to experimental noise.
To cope with the problem, we propose another type of clustering method (the p-quasi completelinkage clustering). We apply this method to the gene expression data of yeast cell-cycles andhuman lung cancer. The effectiveness of our method is demonstrated by comparing clusteringresults with other methods.
Keywords: gene expression profile, clustering, graph structure
1 Introduction
The complete sequences of more than 100 genomes have been determined and publicly available [14].This tremendous amount of data is forcing a paradigm shift toward new data-intensive analysis in thepost-genomic era.
DNA microarray is one of the most powerful tools, which enables the expression profiling of thou-sands of genes simultaneously [3]. Data from microarray experiments are both quantitative (expressionlevel) and qualitative (the gene is expressed or not). Those data are denoted as a matrix of genes byexperimental conditions, where the conditions are usually either a set of tissues or consecutive timepoints in some environmental changes.
The amount of microarray data is very large (multiple of thousands of genes by tens or hundredsof conditions) and mostly very redundant since many genes do not work alone but are expressedtogether and interact to each other. Thus, it is important to classify genes with similar patterns oftheir expressions. This cluster analysis is particularly useful for observing comprehensive repertoireof gene expressions. The clustering result is often combined with some graphical representation (suchas, hierarchical tree representation [4]).
Clustering methods can be divided into two general classes, supervised and unsupervised clustering.In supervised clustering, each data is classified with respect to known reference data, i.e., existingbiological knowledge about specific genes. In unsupervised clustering, no predefined reference dataare used. Since we have little existing knowledge of the complete repertoire of expected gene expressiondata for any condition, most methods currently used are unsupervised and these are dealt with first [7].
152 Seno et al.
Cluster A Cluster BCluster A Cluster B Cluster A’? Cluster B’?mixed
Gene Set A
Gene Set B
(a)
(c)
Experimental Noise
Low High
Gene Set A’
Gene Set B’
(b)
(d)
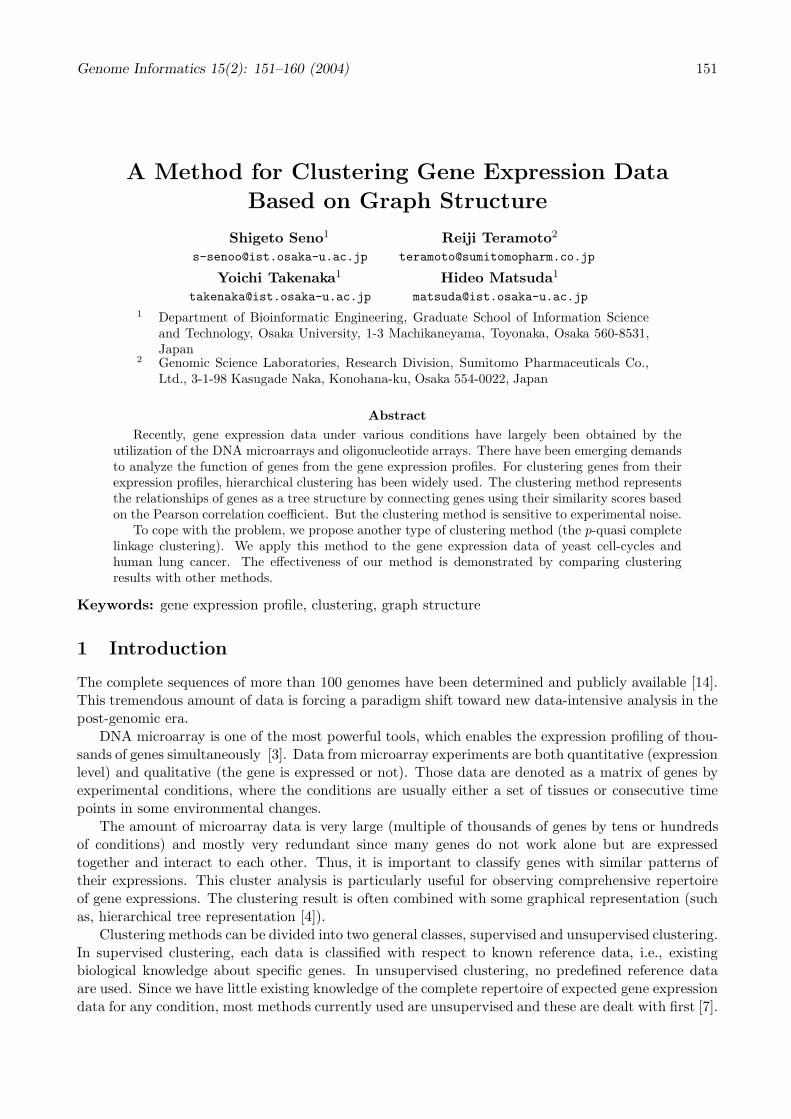
Figure 1: Problems of hierarchical clustering for gene expression data. If the ratio of noise is low (asdescribed in Fig. 1 (a)), the average-linkage clustering can construct a tree that reflects the originalrelatedness of genes (Fig. 1 (c)). But, if the ratio of noise increase (Fig. 1 (b)), it affects the clusteringresults (Fig. 1 (d)).
2 Clustering Method
2.1 Similarity between Gene Expression Data
As the first step to the cluster analysis, we need to choice a measure for representing similarity betweengene expression data. For this purpose, the most commonly-used similarity measure is the Pearsoncorrelation coefficient [4, 7], r, given by Eq. (1).
r =∑
i(ui − u)(vi − v)√∑
i(ui − u)2∑
i(vi − v)2. (1)
Here, ui and vi denote the expression levels of gene expression data u and v at condition i,respectively. u and v are the means of the expression levels of u and v, respectively.
2.2 Clustering of Gene Expression Data
Various clustering methods have been applied to the classification of gene expression data [7]. Mostof the methods are hierarchical; the resulting classification has an increasing number of nested classesand the result is represented as a tree-like shape. If there is advanced knowledge about the numberof clusters that should be represented in the data, k−means clustering [12] is a good alternative tohierarchical method. In addition, following methods are commonly used: self-organizing maps [11],principal component analysis [8] and support vector machines [2].
Hierarchical clustering has the advantage that it is simple and the result can be easily visualized.It has become one of the most widely used techniques for the analysis of gene expression data. In thehierarchical clustering methods, average-linkage clustering is widely used [4]. This method repeatsthe two steps: (1) calculate the similarity score between every two clusters using average values ofsimilarity scores between every member in a cluster and all other members in another cluster, and (2)the two clusters with the highest average similarity score are joined together to form a new cluster.
If all the similarity scores between gene expression data are measured ideally, the hierarchicalclustering method gives clear classification according to the degree of relatedness.
A Method for Clustering Gene Expression Data 153
(a) (b)
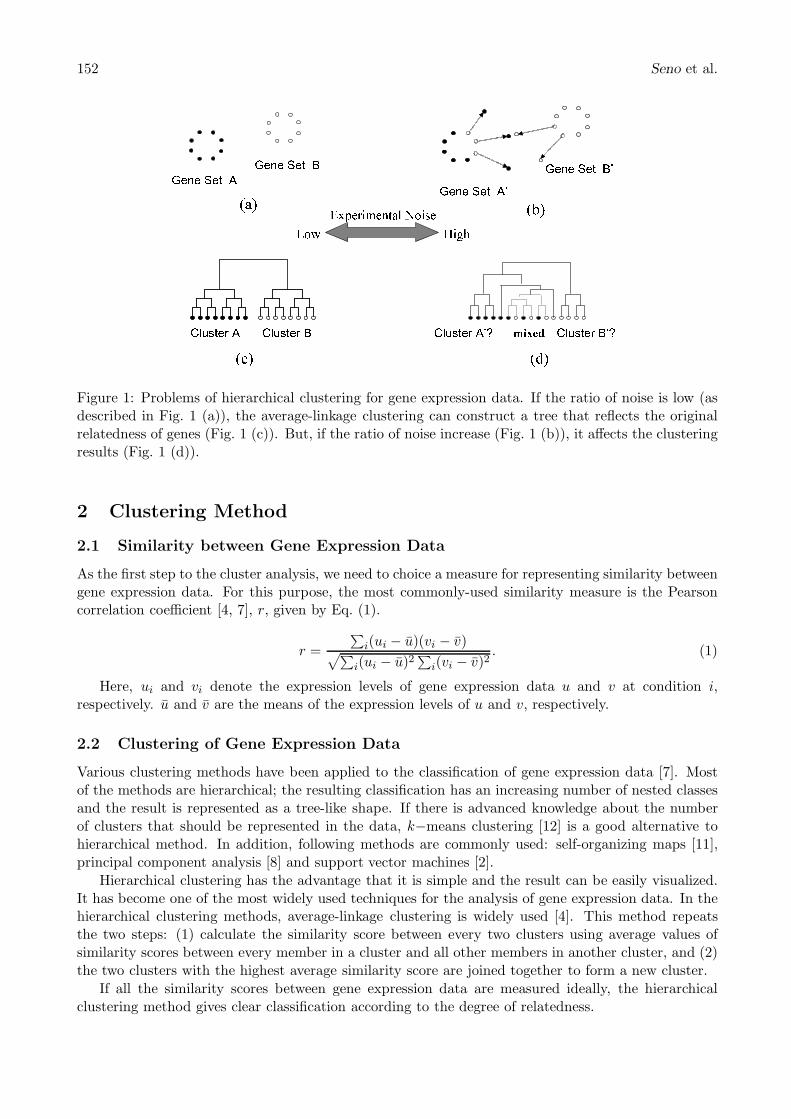
Figure 2: P -quasi complete graph. (a)An example of 0.5-quasi complete graph. The number of verticesis 8 and each vertex is connected to at least 4 vertices in the graph. (b)1-quasi complete graph isequal to a complete graph.
However, the values of gene expression data include various types of experimental noises [13].In the average-linkage clustering, the average similarity score is affected by the noises cumulatively.Thus, the resulting cluster is sensitive to the noises and may not reflect the relatedness between genes.Consequently, as clustering progress, the actual expression patterns of the genes themselves becomeless relevant. Furthermore, if a bad assignment is made early in the process, it cannot be corrected.
Figure 1 shows a schematic representation that explains the effect of noise. The gene set A (shownby filled circles) and the gene set B (open circles) have some functional relationships and similarexpression profiles, respectively. If the ratio of noise is low (as described in Fig. 1 (a)), the average-linkage clustering can construct a tree that reflects the original relatedness of genes (Fig. 1 (c)). But,if the ratio of noise increase (Fig. 1 (b)), it affects the clustering results (Fig. 1 (d)).
2.3 P -Quasi Complete Linkage Clustering
To cope with this problem, we employed the p-quasi complete linkage clustering to the grouping ofgene expression data. The clustering method was originally proposed for the classification of proteinsequences with their sequence similarities [6]. Later it was applied to the cluster analysis of geneexpression data [9].
In the clustering method, the problem space is represented as a graph. The vertices of the graphdenote genes, and the edges are drawn between the vertices where the similarity scores between thegenes are greater or equal to a user-predefined cutoff score. In the graph, the method explores tightly-connected components (p-quasi complete subgraph) based on the p-quasi complete linkage algorithmfor describing clusters. The p-quasi complete subgraph satisfies the condition that any member inone group has edges to ratio p of all the members within the group. When p = 1 each member isconnected to all other members in the group, which is equivalent to the complete linkage clustering.In contrast, single linkage requires only one edge to any member in the group and p is virtually zerowhen the number of members in the group is large. Fig. 2 (a) shows an example of p-quasi completegraph where p is 0.5. Each vertex is connected to at least half of the vertices in the graph. And Fig. 2(b) shows a 1-quasi complete graph.
We proved that a restricted version of p-quasi complete graph problem (given positive integer k,whether a graph contains 0.5-quasi complete subgraph of which size ≥ k or not) is NP-complete [6].Thus, we developed an approximate algorithm for finding maximal p-quasi complete subgraphs. Thealgorithm initially starts clustering from each vertex as a cluster, and repeatedly adds adjacent verticesto the existing subgraphs while the p-quasi completeness condition holds. After all the maximal p-quasi complete subgraphs are found, the algorithm repeatedly covers the original graph by the obtainedsubgraphs one by one in descending order of their sizes (i.e., the number of vertices) of the subgraphs.
154 Seno et al.
A
H
G
F
B
C
D
E
H
G
BA
F
B
C
D
E
H
G
F
B
C
E
A
D
(a) (b) (c)
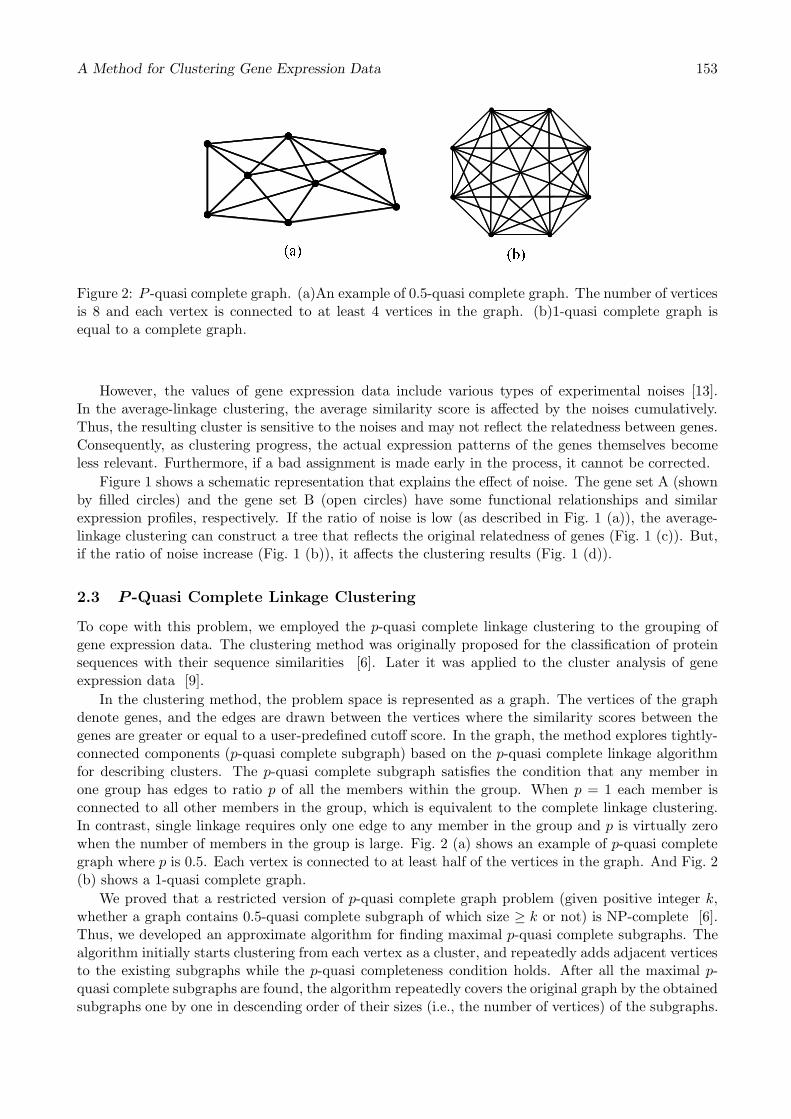
Figure 3: Clustering with p-quasi complete graphs. (a)Step.1. Convert expression profile into graph.In this graph, vertices represent genes. Edges are drawn when the genes have similar expressionprofiles. (b)Step.2. Extract p−quasi complete subgraphs from the graph converted from expressionprofile in Step.1. (c)Step.3. Regard them as clusters.
Cluster A
Cluster B
Gene Set A
Gene Set B
(a)
(c)
Experimental Noise
Low High
Gene Set A’
Gene Set B’
Cluster A’
Cluster B’
(b)
(d)
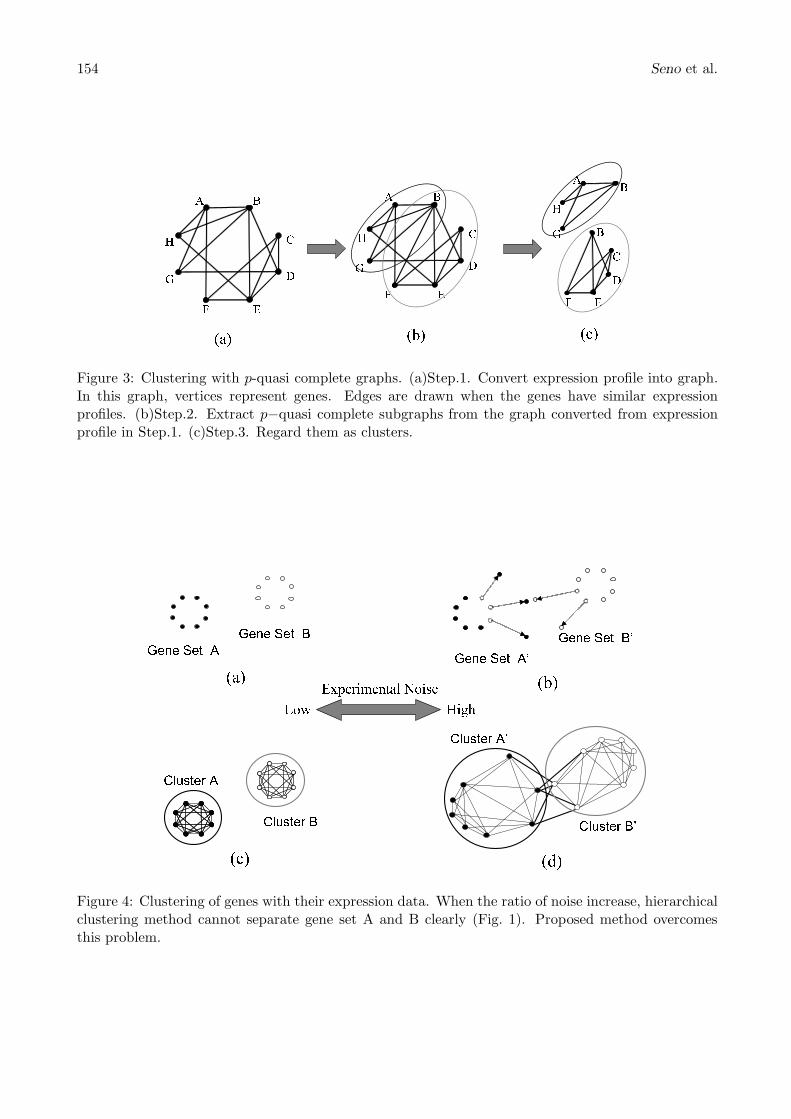
Figure 4: Clustering of genes with their expression data. When the ratio of noise increase, hierarchicalclustering method cannot separate gene set A and B clearly (Fig. 1). Proposed method overcomesthis problem.
A Method for Clustering Gene Expression Data 155
The algorithm terminates if all the vertices are covered by the subgraphs (we assume the originalgraph is a connected graph). The outline of the steps of the algorithm is shown in Fig. 3.
Figure 4 shows a schematic representation of the application of the method to the clustering ofgene expression data having noise. When the ratio of noise is low (as described in Fig. 4 (a)), thep-quasi complete linkage clustering can clearly separate the clusters of related genes (Fig. 4 (c)). Also,when the ratio of noise increase (Fig. 4 (b)), spurious edges occur but the clusters are not changedsince the new edges are ignored by the p-quasi completeness (Fig. 4 (d)).
3 Results and Discussion
We applied the p-quasi clustering method to the gene expression data of yeast cell cycle [10] andhuman lung cancer [1].
3.1 Yeast Cell Cycle
There exist four phases, namely G1, S, G2 and M, in the cell-division cycle. In the cell cycle data, 92genes are known to be regulated at the specific points G1, S, S/G2, G2/M, and M/G1.
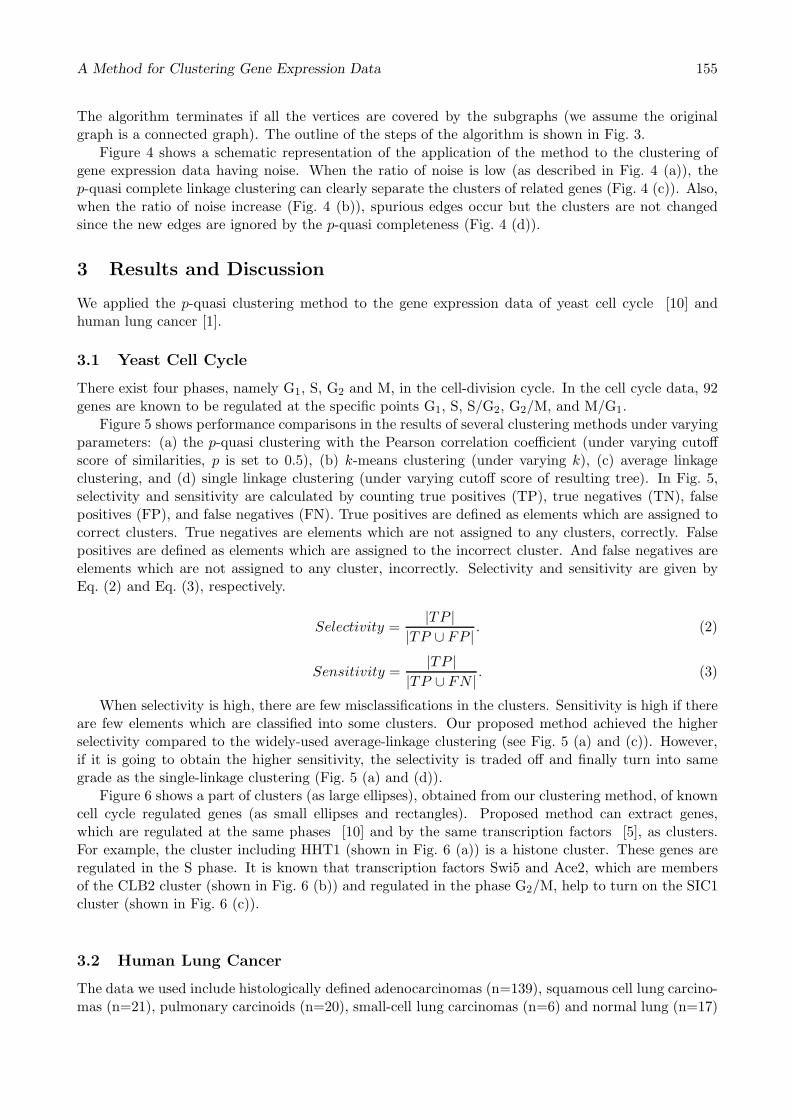
Figure 5 shows performance comparisons in the results of several clustering methods under varyingparameters: (a) the p-quasi clustering with the Pearson correlation coefficient (under varying cutoffscore of similarities, p is set to 0.5), (b) k-means clustering (under varying k), (c) average linkageclustering, and (d) single linkage clustering (under varying cutoff score of resulting tree). In Fig. 5,selectivity and sensitivity are calculated by counting true positives (TP), true negatives (TN), falsepositives (FP), and false negatives (FN). True positives are defined as elements which are assigned tocorrect clusters. True negatives are elements which are not assigned to any clusters, correctly. Falsepositives are defined as elements which are assigned to the incorrect cluster. And false negatives areelements which are not assigned to any cluster, incorrectly. Selectivity and sensitivity are given byEq. (2) and Eq. (3), respectively.
Selectivity =|TP |
|TP ∪ FP | . (2)
Sensitivity =|TP |
|TP ∪ FN | . (3)
When selectivity is high, there are few misclassifications in the clusters. Sensitivity is high if thereare few elements which are classified into some clusters. Our proposed method achieved the higherselectivity compared to the widely-used average-linkage clustering (see Fig. 5 (a) and (c)). However,if it is going to obtain the higher sensitivity, the selectivity is traded off and finally turn into samegrade as the single-linkage clustering (Fig. 5 (a) and (d)).
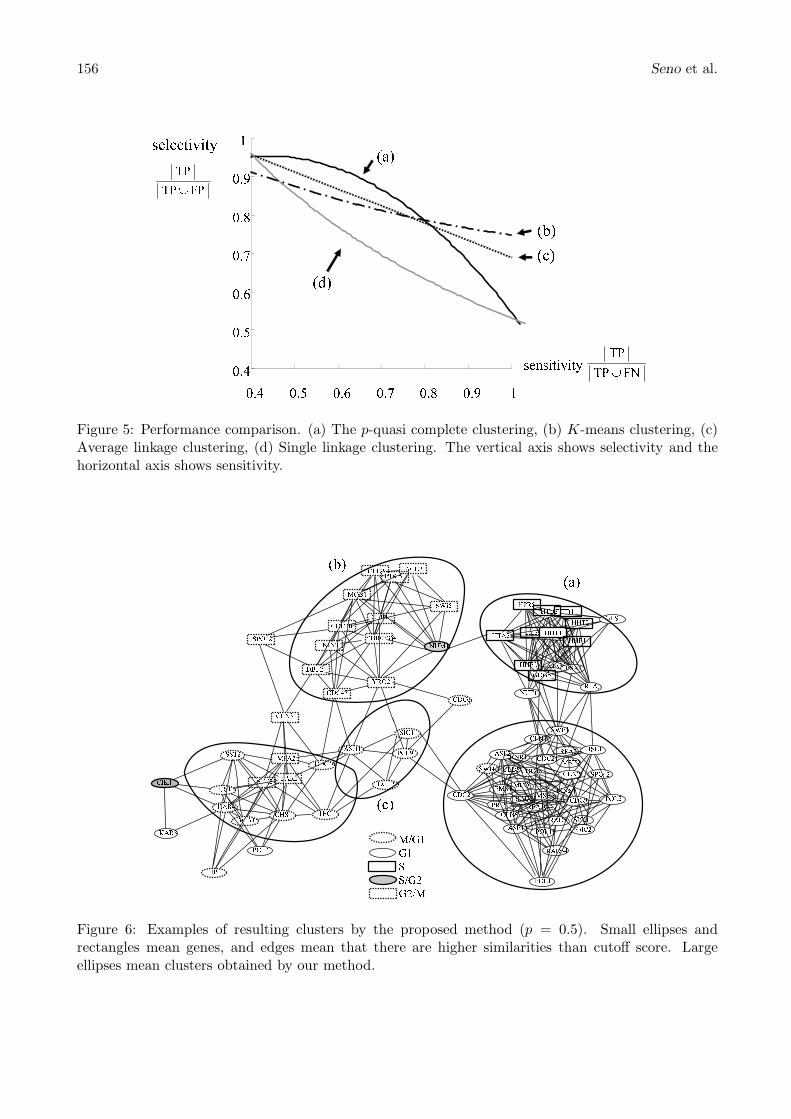
Figure 6 shows a part of clusters (as large ellipses), obtained from our clustering method, of knowncell cycle regulated genes (as small ellipses and rectangles). Proposed method can extract genes,which are regulated at the same phases [10] and by the same transcription factors [5], as clusters.For example, the cluster including HHT1 (shown in Fig. 6 (a)) is a histone cluster. These genes areregulated in the S phase. It is known that transcription factors Swi5 and Ace2, which are membersof the CLB2 cluster (shown in Fig. 6 (b)) and regulated in the phase G2/M, help to turn on the SIC1cluster (shown in Fig. 6 (c)).
3.2 Human Lung Cancer
The data we used include histologically defined adenocarcinomas (n=139), squamous cell lung carcino-mas (n=21), pulmonary carcinoids (n=20), small-cell lung carcinomas (n=6) and normal lung (n=17)
156 Seno et al.
sensitivity FNTP
TP
∪
(a)
(d)
(c)
(b)
0.4 0.5 0.6 0.7 0.8 0.9 1
0.4
0.5
0.6
0.7
selectivity
FPTP
TP
∪
0.8
0.9
1
Figure 5: Performance comparison. (a) The p-quasi complete clustering, (b) K-means clustering, (c)Average linkage clustering, (d) Single linkage clustering. The vertical axis shows selectivity and thehorizontal axis shows sensitivity.
CLN3
STE2
DBF2
SPO12
FAR1
CDC46MFA2
TIP1
FUS1
KAR4
CHS1AGA1
TEC1
SST2
KIN3
YRO2
CDC47
YDR033W
CDC20
MOB1
ASH1
PCL2
RFA1C
POL12
MCD1
CDC2CDC9
ASF2
MSH6
GIC2
MNN1
RNR1
RAD51
SWI4
CLB6
ASF1
SWE1
PRI2
HSL1
RAD27
CDC45
CLN1
PMS1
POL2
MSH2CDC21
SPK1
CLB5
RAD54
SPC42
PCL9
SIC1
POL1
PSA1
GOG5
RFA3
GAS1HHF2
NUF1
CLB1
NUM1
SWI5
CDC6
ACE2
CDC5CLB2
HTB2
HTA2HHF1
HTB1
HTA1
HPR5
GLS1HHT2
EGT2CIK1
KAR3
M/G1
G1
S
S/G2
G2/M
CLN2
RFA2
(a)
(b)
(c)
HHT1
Figure 6: Examples of resulting clusters by the proposed method (p = 0.5). Small ellipses andrectangles mean genes, and edges mean that there are higher similarities than cutoff score. Largeellipses mean clusters obtained by our method.
A Method for Clustering Gene Expression Data 157
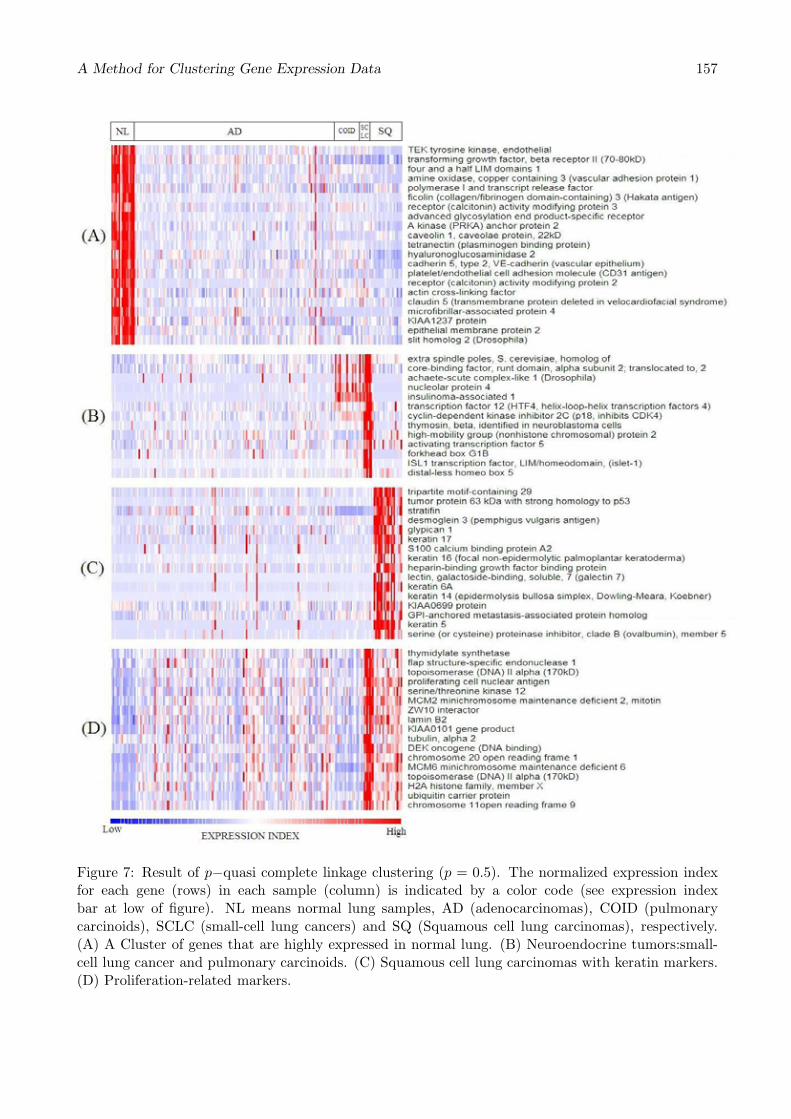
Figure 7: Result of p−quasi complete linkage clustering (p = 0.5). The normalized expression indexfor each gene (rows) in each sample (column) is indicated by a color code (see expression indexbar at low of figure). NL means normal lung samples, AD (adenocarcinomas), COID (pulmonarycarcinoids), SCLC (small-cell lung cancers) and SQ (Squamous cell lung carcinomas), respectively.(A) A Cluster of genes that are highly expressed in normal lung. (B) Neuroendocrine tumors:small-cell lung cancer and pulmonary carcinoids. (C) Squamous cell lung carcinomas with keratin markers.(D) Proliferation-related markers.

158 Seno et al.
specimens. The number of genes is 3, 312, which are the most variable transcript sequences selectedby a standard deviation threshold of 50.
3.2.1 Clustering of Genes
Figure 7 shows that our method could extract clusters of high expressed genes at known histologicalclasses of lung tumor. Cluster (A) is the cluster of highly expressed genes at normal lung. Cluster(B) and Cluster (C) are corresponding to small-cell lung cancer and squamous cell lung carcinomas,respectively. Proliferation-related markers are in (D).
These clusters are similar to the gene groups listed in [1]. Cluster (A) includes 16/17 genes shownin [1] and other 5 genes. Cluster (B) includes 10/14 genes and another gene, (C) includes 16/17 genesand other 5 genes, and (D) includes 9/10 genes and other 10 genes.
3.2.2 Clustering of Samples
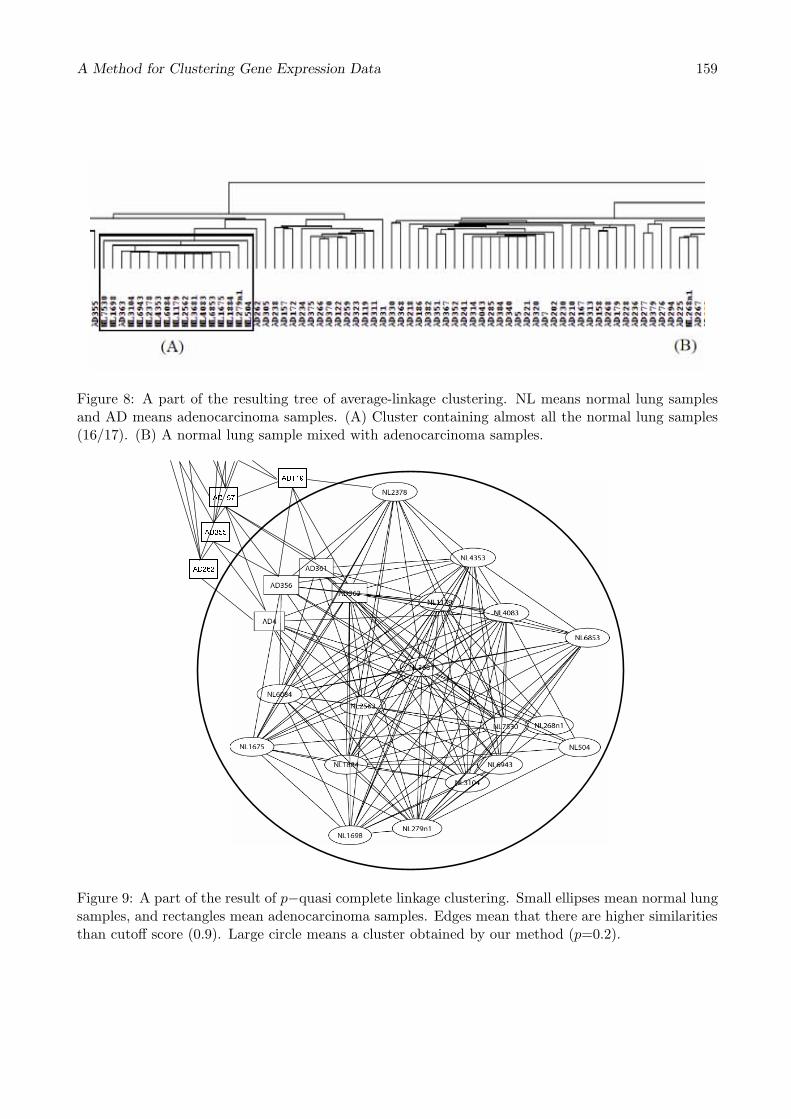
Figure 8 shows a part of the result of average-linkage clustering. In the Fig. 8, Cluster (A) is thecluster containing almost all the normal lung samples. But, a normal lung sample (B) is mixed withadenocarcinoma samples. As mentioned in Section 2.2, the average similarity score might be affectedby the noises or elements irrelevant to classification cumulatively.
Figure 9 shows a part of the result of 0.2-quasi complete linkage clustering with Pearson correlationcoefficient. Small ellipses mean normal lung samples, and rectangles mean adenocarcinoma samples.Edges mean that there are higher similarities than cutoff score (0.9). Large circle means a cluster, andthe cluster includes all 17 normal lung samples with only 4 adenocarcinoma samples. If the normallung cluster of the hierarchical clustering is extend for including all the normal lung samples, it has87 adenocarcinoma samples (Fig. 8).
4 Conclusion
We proposed a clustering method for gene expression data. The method classifies the data using agraph-theoretic algorithm, namely, the p-quasi complete linkage clustering. By applying the methodto the yeast cell cycle data, we obtained better selectivity compared to the other methods. And,to the human lung cancer data, our method could extract clusters of genes related to histologicallydefined classes. The experimental results show that the proposed method can not only avoid the effectsby the noises or irrelevant elements, but also give the better biological results than the hierarchicalclustering. Especially for clustering of human lung samples, we succeeded to obtain the cluster that isdrastically reduced the mixture between normal lung samples and lung cancer ones. Thus, our methodis potentially useful to discover the unknown disease classes in more detail with the results of clustering.In this paper, because parameter setting is needed, application of our method is limited in the casethat prior knowledge is available. We are still looking for a method of parameter determination in thecase that prior knowledge is not available.
Acknowledgments
This work was supported by the IT-program of Ministry of Education, Culture, Sports, Science andTechnology of Japan (MEXT), and by Grant-in-Aid for Scientific Research on Priority Areas “GenomeScience” from MEXT.
A Method for Clustering Gene Expression Data 159
Figure 8: A part of the resulting tree of average-linkage clustering. NL means normal lung samplesand AD means adenocarcinoma samples. (A) Cluster containing almost all the normal lung samples(16/17). (B) A normal lung sample mixed with adenocarcinoma samples.
AD355
AD157
AD119
AD262
Figure 9: A part of the result of p−quasi complete linkage clustering. Small ellipses mean normal lungsamples, and rectangles mean adenocarcinoma samples. Edges mean that there are higher similaritiesthan cutoff score (0.9). Large circle means a cluster obtained by our method (p=0.2).
160 Seno et al.
References
[1] Bhattacharjee, A., Richards, W.G., Staunton, J., Li, C., Monti, S., Vasa, P., Ladd, C., Beheshti,J., Bueno, R., Gillette, M., Loda, M., Weber, G., Mark, E.J., Lander, E.S., Wong, W., Johnson,B.E., Golub, T.R., Sugarbaker, D.J., and Meyerson, M., Classification of human lung carcinomasby mRNA expression profiling reveals distinct adenocarcinoma subclasses, Proc. Natl Acad. Sci.USA, 98:13790–13795, 2001.
[2] Brown, M.P., Grundy, W.N., Lin, D., Cristianini, N., Sugnet, C.W., Furey, T.S., Ares, M. Jr.,and Haussler, D., Knowledge-based analysis of microarray gene expression data by using supportvector machines, Proc. Natl Acad. Sci. USA, 97:262–267, 2000.
[3] DeRisi, J.L., Iyer, V.R., and Brown, P.O., Exploring the metabolic and genetic control of geneexpression on a genome scale, Science, 278:680–686, 1997.
[4] Eisen, M.B., Spellman, P.T., Brown, P.O., and Botstein, D., Cluster analysis and display ofgenome-wide expression patterns, Proc. Natl Acad. Sci. USA, 95:14863–14868, 1998.
[5] Futcher, B., Transcriptional regulatory networks and the yeast cell cycle, Current Opinion in CellBiology, 14:676–683, 2002.
[6] Matsuda, H., Ishihara, T., and Hashimoto, A., Classifying molecular sequences using a linkagegraph with their pairwise similarities, Theor. Comput. Sci., 210:305–325, 1999.
[7] Quackenbush, J., Computational analysis of microarray data, Nature Reviews Genetics, 2:418–427, 2001.
[8] Raychaudhuri, S., Stuart, J.M., and Altman, R.B., Principal component analysis to summarizemicroarray experiments: Application to sporulation time series, Pac. Symp. Biocomput., 455–466,2000.
[9] Seno, S., Teramoto, R., and Matsuda, H., P-quasi complete linkage analysis for gene expressiondata, Proc. 1st IEEE Computer Society Bioinformatics Conf., 342, 2002.
[10] Spellman, P.T., Sherlock, G., Zhang, M.Q., Iyer, V.R., Anders, K., Eisen, M.B., Brown, P.O., Bot-stein, D., and Futcher, B., Comprehensive identification of cell cycle-regulated genes of the yeastSaccharomyces cerevisiae by microarray hybridization, Molecular Biology of the Cell, 9:3273–3297,1998.
[11] Tamayo, P., Slonim, D., Mesirov, J., Zhu, Q., Kitareewan, S., Dmitrovsky, E., Lander, E.S., andGolub, T.R., Interpreting patterns of gene expression with self-organizing maps: Methods andapplication to hematopoietic differentiation, Proc. Natl Acad. Sci. USA, 96:2907–2912, 1999.
[12] Tavazoie, S., Hughes, J.D., Campbell, M.J., Cho, R.J., and Church, G.M., Systematic determi-nation of genetic network architecture, Nature Genetics, 22:281–285, 1999.
[13] Yang, M.C., Ruan, Q.G., Yang, J.J., Eckenrode, S., Wu, S., McIndoe, R.A., and She, J.X., A sta-tistical method for flagging weak spots improves normalization and ratio estimates in microarrays,Physiol. Genomics, 7:45–53, 2001.
[14] http://www.ncbi.nlm.nih.gov/entrez/query.fcgi?db=Genome/