a method for phenomenological and chemical kinetics study
TRANSCRIPT

EPJ Nuclear Sci. Technol. 4, 2 (2018)© P. Marc et al., published by EDP Sciences, 2018https://doi.org/10.1051/epjn/2017026/olm
NuclearSciences& Technologies
Available online at:https://www.epj-n.org
REGULAR ARTICLE
A method for phenomenological and chemical kinetics study ofautocatalytic reactive dissolution by optical microscopy. The caseof uranium dioxide dissolution in nitric acid mediaPhilippe Marc1, Alastair Magnaldo1,*, Jérémy Godard1, and Éric Schaer2
1 CEA, Nuclear Energy Division, Research Department on Mining and Fuel Recycling Processes, Research Service forDissolution and Separation Processes, Laboratory of Dissolution Studies, 30207 Bagnols-sur-Cèze, France
2 Laboratoire Réactions et Génie des Procédés, UMR CNRS 7274, University of Lorraine, 54001 Nancy, France
* e-mail: a
This is an O
Received: 14 December 2016 / Received in final form: 4 October 2017 / Accepted: 10 October 2017
Abstract. Dissolution is a milestone of the head-end of hydrometallurgical processes, as the stabilization ratesof the chemical elements determine the process performance and hold-up. This study aims at betterunderstanding the chemical and physico-chemical phenomena of uranium dioxide dissolution reactions in nitricacid media in the Purex process, which separates the reusable materials and the final wastes of the spent nuclearfuels. It has been documented that the attack of sintering-manufactured uranium dioxide solids occurs throughpreferential attack sites, which leads to the development of cracks in the solids. Optical microscopy observationsshow that in some cases, the development of these cracks leads to the solid cleavage. It is shown here that thedissolution of the detached fragments is much slower than the process of the complete cleavage of the solid, andoccurs with no disturbing phenomena, like gas bubbling. This fact hasmotivated themeasurement of dissolutionkinetics using optical microscopy and image processing. By further discriminating between external resistanceand chemical reaction, the “true” chemical kinetics of the reaction have been measured, and the highlyautocatalytic nature of the reaction confirmed. Based on these results, the constants of the chemical reactionskinetic laws have also been evaluated.
1 Introduction
Dissolution is a key phenomenon encountered in variousprocesses, for example for drug delivery, quality control inpharmacology [1] or in the food-processing industry [2,3].Dissolution also takes part inmany chemical processes in themining industry [4–7], batteries [8,9], fertilizer production[10], or the recycling industry [11]. Among these chemicalprocesses, the Purex process is a hydrometallurgical processinvolving the dissolution of spent nuclear fuels in nitric acidin the head-end steps, before carrying out solvent extractionstepsallowingtherecoveryofuraniumandplutonium[12]. Inan optimization approach of this dissolution step, itsmodeling has recently become a source of interest. Giventhat currently recycled spent nuclear fuels aremade of about95% of uranium dioxide [13], the modeling of the dissolutionof this chemical specie in nitric acid media represents a stepwhich cannot be overlooked.
An analysis of the state of knowledge of the dissolutionreaction of uranium dioxide in nitric acid media [14] showsthat despite the importance of this reaction in the
pen Access article distributed under the terms of the Creative Comwhich permits unrestricted use, distribution, and reproduction
hydrometallurgical reprocessing of spent nuclear fuels, itschemical and physico-chemical mechanisms remain poorlyunderstood. The relationship between the fraction ofdissolved solid, which can be linked more or less simplywith the bulk concentration of the chemical elementscomposing it, and the chemical reaction kinetics requiresthe accurate knowledge of the surface of the dissolving solidand the reactivity of each element of this surface over time.As a result of the physico-chemical phenomena occurringduring thedissolution of uraniumdioxidemacroscopic solidsin nitric acid media, like the complex reactions and speciesproduced in nitric acid, the chemical reaction kinetics aretoday impossible to relate to the evolution of the concentra-tion of dissolved materials in the bulk.
However, a recent trend in dissolution mechanisms andkinetics study is the use of optical microscopy. This technichas already been used in several dissolution studies. Steigeret al. used it for general observation of the growth anddissolution of lithiummosses and needles in 1mol l�1 LiPF6[8] and during lithium electrodeposition on tungsten andcopper substrates [9]. Boetker et al. [15] studied theconcentrationgradients anddiffusion layer thicknessaroundamlodipine besylate dissolving in water, as well as
mons Attribution License (http://creativecommons.org/licenses/by/4.0),in any medium, provided the original work is properly cited.

Fig. 1. Microscopy installation in the glove box.
2 P. Marc et al.: EPJ Nuclear Sci. Technol. 4, 2 (2018)
Østergaard et al. [16] for lidocaine dissolution in water andDelwaulle et al. [17,18] for copper and uranium dioxidedissolving in nitric acid.Mgaidi et al. [4] and Singh et al. [19]used it for monitoring the evolution of the morphology ofsand and succinic acid crystals during dissolution. Thetemporal studies vary from the measurement of totaldissolution time of sucrose crystals in melted sorbitol byBhandari et al. [2] to more complex studies which usedoptical microscopy for measuring the dissolution rates ofseveral solids, such as those from Marabi et al. [3] for thedissolution rates of pure sucrose spherical particles inwater, ethylene glycol, and polyethylene glycol, Fornyet al. [20] for those of milk powder particles in water, andDorozhkin [10,21] for single crystals of the natural Khibin(Kola) fluorapatite. Prasad et al. [22] and Raghavan et al.[23,24] have even measured the dependency of dissolutionrates of paracetamol and a lactose monohydrate crystalsin water depending on the crystal faces considered.
More recently, Svanbäck et al. [25–27] have addressedpapers summarizing the advantages of optical microscopyas a method for dissolution kinetics measurements over themacroscopic methods, and presenting interesting designsfor the cells and methods for the monitoring of suchreactions. Part of these advantages are the reduction of theamounts of reagents required, the simpler experimentalpreparation (no compound-specific method development,calibration or evaluation is required for image analysis),which reduced the time required for analysis and the inter-operator variability error sources, and the low cost of theoptical microscopy equipment compared to other technicssuch as HPLC-MS or GC-MS. However, the application ofthe presented cells in the dissolution conditions used foruranium dioxide (i.e. warm and concentrated nitric acid,implying strong acidic and oxidizing conditions) has notbeen possible as such, and dissolution cells fitting theseconditions have been developed and will be presented inthis paper.
It will also be shown that, during the dissolution of auranium dioxide pellet, fragments can detach from it. Evenif these fragments dissolved in amuch simpler way than thepellet itself, two issues make them remain unsuitable formacroscopic chemical reaction rates studies. The first oneis that even at this scale, non-uniform attack occurs, asdocumented by Briggs [28,29], Shabbir and Robbins [30]and Zhao and Chen [31–33], and thus that the surface andassociated reactivity remain practically impossible to knowprecisely over time. The second issue is that themeasurement of dissolving elements released in solutionwould require the use of several fragments, and of a largervolume of dissolution solution, thus rising the question ofthe accumulation of dissolution products, and theirautocatalytic effect.
On the other hand, these fragments offer a goodopportunity to measure the dissolution rates in situ byusing optical microscopy and image processing. Thedetermination of the rate determining step during thesemeasurements allows to discriminate diffusion controlledfrom chemically controlled dissolutions. The study of therates corresponding to the chemical reaction has shown that,without doubt, it occurs through a strongly autocatalyzedmechanism. Optical microscopy has also allowed measuring
specifically the chemical reaction rates for the non-catalyzedreaction, leading to the proposal of reactivity ratios betweenthe non- and the autocatalyzed reactions.
2 Experimental section
2.1 Microscope
The microscope used for this study is a reversed opticalmicroscope Zeiss .Z1m equipped with three lenses offeringmagnification ratios of 5, 20 and 40. The reverse positionof the lenses is required by the production of nitrogenoxides bubbles during the attack of uranium dioxide bynitric acid: when these bubbles rise to the top of the liquid,they hide the solid and make any observation by the topimpossible.
The microscope has been installed in a depressurizedglove box, in order to confine radioactive materials (Fig. 1).
2.2 Dissolution cells
A first continuous dissolution cell is presented in Figure 2.It is composed of a central well where the solid and thesolution are introduced. It is closed bottom-side by aquartz pothole in order to ensure observation. The upperpart can be closed by rings system, which can be changeddepending on the kind of experiments. The dissolutionvolume is 15ml. This central well is surrounded by ajacket in which water can flow to maintain a stationarytemperature in the central well. A coil, guaranteeing anoptional continuous feed of the well with dissolutionsolution, circulates in this jacket so as to heat the solutioninflow at the working temperature. Another pipe crossesthe jacket in a straight line, allowing outflow and alsoplacing a temperature sensor in the well. This device iswell

Fig. 2. Pictures of the continuous dissolution cell.
Fig. 3. Thermoelectric device for the observation of the dissolution of microscopic solids.
P. Marc et al.: EPJ Nuclear Sci. Technol. 4, 2 (2018) 3
adapted for dissolution of macroscopic solids, dissolutionunder continuous flow, or batch dissolution of microscopicsolids requiring important liquid/solid ratios.
The solution feed is controlled by a KD Scientific Legato270 Push/Pull Syringe Pump coupled with a Gemini 88Valve Box for long time ranging experiments.
A second device is presented in Figure 3. It consists in aquartz disc at the center of which a well has beenmanufactured. Around the well, a groove receives an O-ring seal, and a quartz disk placed over the system closes it.This device is placed on a thermoelectric heating stageLinkam PE100 adapted for the microscope. The control ofthe temperature is realized by a Linkam T95 systemcontroller. In order to insulate the system, a polydime-thylsiloxane cover designed to fit the heating stage has beenmanufactured by moulding.
Temperature stabilizing is more difficult with this non-circulating device, due to the configuration of the thermo-electric system: the time require for stabilizing thetemperature is long (several hours), and there are importantdifferences between the temperature set and the effectivelyreached temperature once the system is stabilized.
2.3 Reagents
Uranium dioxide powder was provided byCEACadarache.The uranium dioxide purity of the powder is 99.6%, anddetailed analysis of the powder is given in Table 4 in theSupplementary Material.
This powder is also used for the manufacturing of theuranium dioxide pellets. The pellets have been pressed at apressure of 518MPa before being sintered at 1100 °C during4 h under Ar-H2 (4%) atmosphere. Resulting sinteredpellets have an average diameter of 4.66mm, height of4mm and mass of 0.5 g.
Nitric acid solutions have been prepared by dilution of68% HNO3 provided by VWR (ref. 20422.297). Eachdiluted solution have been titrated three times bymean of a848 Titrino Plus, fed with 1mol l�1 sodium hydroxideTitrinorm provided by Prolabo (ref. 180.031627.60).
2.4 Dissolutions in solutions containing reactionproducts
The autocatalytic component of the dissolution reaction ofuranium dioxide in nitric acid media has been widelydocumented in the literature [14]. The ratio of the volumeof dissolution solution over dissolved amount of solid in thedissolution cells is an advantageous condition for studyingthis component under well known dissolution productsconcentrations and temperature conditions.
The solutions for the measurement of dissolutionkinetics in presence of various amounts of reaction productshave been prepared by pre-dissolving uranium dioxidepowder in fresh nitric acid (Fig. 4). The dissolution isrealized in a bottle containing a known volume of freshnitric acid initially at room temperature, with a knownmass of uranium dioxide powder introduced in the bottle,

Fig. 4. Diagram of the experimental protocol for the study of theautocatalyzed reaction kinetics.
Fig. 5. Evolution of the projected area and associated perimeterof a uniformly dissolving particle.
4 P. Marc et al.: EPJ Nuclear Sci. Technol. 4, 2 (2018)
whose opening is immediately covered with a cork after theintroduction of the powder, in order to limit the evacuationof gaseous reaction products. The bottle is not hermeticallyclosed to avoid overpressure troubles during the reaction.Four solutions with a pre-dissolved amount of uraniumdioxide of 0.1, 10, 50, and 100 g l�1 have been prepared infresh 4.73mol l�1 nitric acid.
The time required (about 10min) for the transfer of thesolution to the microscope glove box insures thatpotentially remaining undissolved uranium dioxide getscompletely dissolved. The solution is then continuouslypumped at a 5ml h�1
flow rate into the dissolution cell, andthe dissolution of the uranium dioxide fragments under themicroscope starts. Even if this continuous flow contributesto guarantee the stability of the concentrations of thereagents and products in the cell at the values of the pre-dissolved uranium diocide solutions, it is primarily used, inthe absence of a consolidated knowledge on the autocata-lytic species and their stabilities, to counter as much aspossible a potential degradation of the autocatalyticspecies.
2.5 Measurement of dissolution kinetics by opticalmicroscopy observation and image processing
The methodologies used in previous dissolution kineticsmeasurement studies for calculating the dissolution ratesfrom a set of images are usually not detailed [3,10,21].These methods consist in measuring the distance betweenthe profiles of one dissolving solid at different times. Thisdistance corresponds to Dl on Figure 5, without stating ifonly one or several measurements are done along theprofile.
A different method, based on the measurement of theprojected area and the associated perimeter of a dissolvingparticle on each image, is developed here and detailed in thefollowing paragraphs. The geometric evolution of theprojected area of a uniformly dissolving solid is representedin Figure 5.
In the particular case of a weak dissolution of theparticle, and in the absence of neo-formed phases at thesolid/liquid interface, a mathematical link can be drawnbetween the variation of its projected area (A) betweentimes t and tþ Dt, the perimeter (P) of its projected area att, and the progression of the dissolution front (Dl), whichcorresponds to the apparent dissolution rate (r) over Dt,considered as constant over Dt (Eq. (1)) :
Aðtþ DtÞ � AðtÞ≈ � PðtÞDl� PðtÞrDt: ð1ÞThus, one of the advantages of this method is to focus
on the measurement of the external perimeter of the solid,and to be able to make dissolution rates measurementwithout the issue of the internal porosity disturbance.equation (1) leads to the expression of the variation of thearea at a time t (Eq. (2)) :
DA
DtðtÞ≈ � PðtÞr: ð2Þ
Therefore, it is possible to extract the dissolution rate ofa dissolving solid by measuring its area and perimeter oneach image of a time sequence set of images. In practice, theintegrated form of equation (2) (Eq. (3)) will be used on thesets of images, since this form allows smoothing thevariations which can appear in the case of images with apoor quality, for example when the images are acquiredunder reflected light conditions.
A tð Þ≈Að0Þ �Xt�Dt
t ¼ 0
PðtÞrDt: ð3Þ
Considering the dissolution of the solid as uniform, andtaking place under stationary conditions, it comes that thedissolution rate is constant over the time, and can beextracted from the sum sign, as well as the time interval Dtbetween two images, since this value is fixed by theexperimenter, and thus is also constant over the acquisi-tion. This leads to express the projected area of the particleat a time t as a linear function of the sum of the perimeters

Fig. 6. Example of image thresholding and holes filling: original image (a), binarised image (b), and binarised image with holes filled (c).
1 This code was written in Scilab 5.5.0, free open source softwaredistributed under CeCILL license (GPL compatible), developedby Scilab Enterprises. Available on http://www.scilab.orggr17.
P. Marc et al.: EPJ Nuclear Sci. Technol. 4, 2 (2018) 5
of the projected area from t=0 to t� Dt (Eq. (4)).
AðtÞ≈Að0Þ � rDtXt�Dt
t¼0
PðtÞ: ð4Þ
It is important to insist on the fact that these equationsare practicable in the case of a uniform attack of thefragments. Nevertheless, it is not impossible that, even if noporosity development was detected at the scale of thegrains we have been working with, microporosity develop-ment occurs at a smaller scale than the resolution of themicroscope. It should be noted that in this case, if micro-porosity were created, it would also disappear at the samerate during dissolution: the dissolution would fatallyappear non-uniform in the other case. Thus, the dissolutionfront moves globally uniformly at the resolution of themicroscope.
In this case, the dissolution kinetics is given as a speed,in distance per time units. Assuming the density is known,the relationship between the reactive surface and themeasured surface is linear, and equation (5) enables toconvert these kinetics into more common units system fordissolution kinetics.
r ½ms�1� ¼ 1
rir ½kg m�2 s�1� ¼ Mi
rir ½molm�2 s�1�: ð5Þ
The measurement of area and perimeter used in thismethod raises the issue of the relevance of the dissolutionkinetics measured in the case of a non-uniform attack of thesolid. Once more, the problematic of the evolution of therugosity and porosity of the surface is one of the mainproblem which has to be dealt with when measuring thechemical dissolution reaction kinetics, whatever themethod applied [34–37], since there is no method for in-situ measurement of the surface evolution on such a shortperiod of time.
A first fact to take into consideration is that in any case,porosity appears, but also disappears. This results in astabilizationof surface roughness after a givenperiodof time.Inthecaseofmicroscopicobservationsandimageprocessing,twodifferentcasesmustbeconsidereddependingonthescalethey occurred at, and regarding the resolution of the images.
The first case applies when the surface roughness evolvesat a smaller scale than the resolution of the microscope. Inthis case, the effect of the development of surface roughness
on themeasuredareaandperimeter of a givenparticle isnull,orat leastweak.What ismore important is thecasewheretheevolution of the surface roughness of the solid is detectablewith the microscopic observations. In this case, the initialdissolution ratemeasuredbythismethodwill begreater thanthe average of the different reaction kinetics. Nevertheless,while the surface roughness will stabilize, the measureddissolution rateswill get closer to the expected average of thedissolution rates.
Thus, concerning the method presented in this paper,one can draw the conclusions that the dissolution ratesmeasured with this method are at least as good as thosemeasured by classical macroscopic method, and in manycases even better since they only take under considerationthe external surface, and not the complex and disruptingcontribution of internal porosity.
2.6 Image processing for the extraction of the areaand perimeter of the particles
The analysis of the images is realized through a three-stepprocess which consists of image binarisation, extraction ofthe area and perimeter of the particle, compilation of thedata, and linear regression to calculate the dissolution rate.
The processing of a series of images is realized by themean of a program developed in-house1 for the automationof this process.
2.6.1 Image binarisation
After turning the images from colored to 8-bits grayscaleimages, the luminosityof eachpixelof the imagevaries from0(black) to 255 (white). The histogram representing thenumber of pixels composing the image as a function of theirluminosity is a bimodal curve. One of the two peakscorresponds to thepixels of the background (black onFig. 6),and the other to the pixels of the object (white on Fig. 6).
In order to measure the area and perimeter of a particle,it is first required to clearly separate the pixels of the imagein two categories: object and background. This issue is
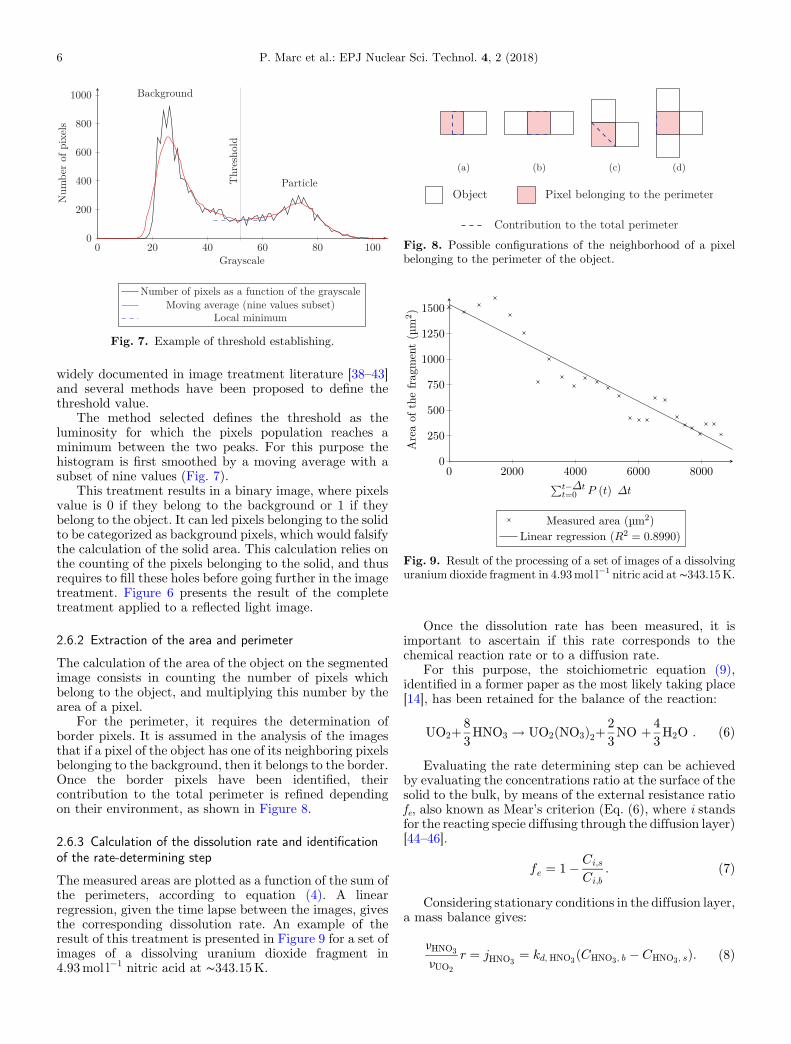
Fig. 7. Example of threshold establishing.
Fig. 8. Possible configurations of the neighborhood of a pixelbelonging to the perimeter of the object.
Fig. 9. Result of the processing of a set of images of a dissolvinguranium dioxide fragment in 4.93mol l�1 nitric acid at ∼343.15K.
6 P. Marc et al.: EPJ Nuclear Sci. Technol. 4, 2 (2018)
widely documented in image treatment literature [38–43]and several methods have been proposed to define thethreshold value.
The method selected defines the threshold as theluminosity for which the pixels population reaches aminimum between the two peaks. For this purpose thehistogram is first smoothed by a moving average with asubset of nine values (Fig. 7).
This treatment results in a binary image, where pixelsvalue is 0 if they belong to the background or 1 if theybelong to the object. It can led pixels belonging to the solidto be categorized as background pixels, which would falsifythe calculation of the solid area. This calculation relies onthe counting of the pixels belonging to the solid, and thusrequires to fill these holes before going further in the imagetreatment. Figure 6 presents the result of the completetreatment applied to a reflected light image.
2.6.2 Extraction of the area and perimeter
The calculation of the area of the object on the segmentedimage consists in counting the number of pixels whichbelong to the object, and multiplying this number by thearea of a pixel.
For the perimeter, it requires the determination ofborder pixels. It is assumed in the analysis of the imagesthat if a pixel of the object has one of its neighboring pixelsbelonging to the background, then it belongs to the border.Once the border pixels have been identified, theircontribution to the total perimeter is refined dependingon their environment, as shown in Figure 8.
2.6.3 Calculation of the dissolution rate and identificationof the rate-determining step
The measured areas are plotted as a function of the sum ofthe perimeters, according to equation (4). A linearregression, given the time lapse between the images, givesthe corresponding dissolution rate. An example of theresult of this treatment is presented in Figure 9 for a set ofimages of a dissolving uranium dioxide fragment in4.93mol l�1 nitric acid at ∼343.15K.
Once the dissolution rate has been measured, it isimportant to ascertain if this rate corresponds to thechemical reaction rate or to a diffusion rate.
For this purpose, the stoichiometric equation (9),identified in a former paper as the most likely taking place[14], has been retained for the balance of the reaction:
UO2þ 8
3HNO3 ! UO2ðNO3Þ2þ
2
3NO þ 4
3H2O : ð6Þ
Evaluating the rate determining step can be achievedby evaluating the concentrations ratio at the surface of thesolid to the bulk, by means of the external resistance ratiofe, also known as Mear’s criterion (Eq. (6), where i standsfor the reacting specie diffusing through the diffusion layer)[44–46].
fe ¼ 1� Ci;s
Ci;b: ð7Þ
Considering stationary conditions in the diffusion layer,a mass balance gives:
nHNO3
nUO2
r ¼ jHNO3¼ kd; HNO3
ðCHNO3; b � CHNO3; sÞ: ð8Þ
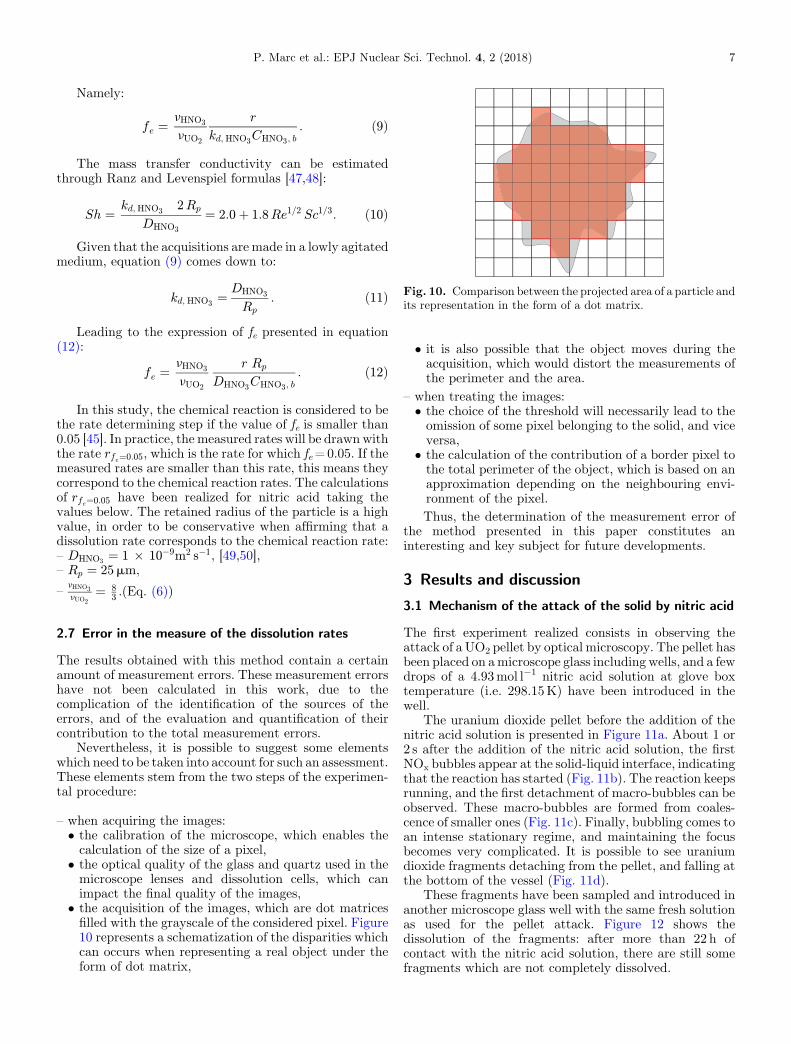
Fig. 10. Comparison between the projected area of a particle andits representation in the form of a dot matrix.
P. Marc et al.: EPJ Nuclear Sci. Technol. 4, 2 (2018) 7
Namely:
fe ¼nHNO3
nUO2
r
kd; HNO3CHNO3; b
: ð9Þ
The mass transfer conductivity can be estimatedthrough Ranz and Levenspiel formulas [47,48]:
Sh ¼ kd; HNO32Rp
DHNO3
¼ 2:0þ 1:8Re1=2 Sc1=3: ð10Þ
Given that the acquisitions are made in a lowly agitatedmedium, equation (9) comes down to:
kd; HNO3¼ DHNO3
Rp: ð11Þ
Leading to the expression of fe presented in equation(12):
fe ¼nHNO3
nUO2
r Rp
DHNO3CHNO3; b
: ð12Þ
In this study, the chemical reaction is considered to bethe rate determining step if the value of fe is smaller than0.05 [45]. In practice, the measured rates will be drawn withthe rate rfe¼0:05, which is the rate for which fe=0.05. If themeasured rates are smaller than this rate, this means theycorrespond to the chemical reaction rates. The calculationsof rfe¼0:05 have been realized for nitric acid taking thevalues below. The retained radius of the particle is a highvalue, in order to be conservative when affirming that adissolution rate corresponds to the chemical reaction rate:
– DHNO3¼ 1 � 10�9m2 s�1; [49,50],
– Rp ¼ 25mm;–
nHNO3nUO2¼ 8
3 :(Eq. (6))
2.7 Error in the measure of the dissolution rates
The results obtained with this method contain a certainamount of measurement errors. These measurement errorshave not been calculated in this work, due to thecomplication of the identification of the sources of theerrors, and of the evaluation and quantification of theircontribution to the total measurement errors.
Nevertheless, it is possible to suggest some elementswhich need to be taken into account for such an assessment.These elements stem from the two steps of the experimen-tal procedure:
–
when acquiring the images:• the calibration of the microscope, which enables thecalculation of the size of a pixel,• the optical quality of the glass and quartz used in themicroscope lenses and dissolution cells, which canimpact the final quality of the images,
• the acquisition of the images, which are dot matricesfilled with the grayscale of the considered pixel. Figure10 represents a schematization of the disparities whichcan occurs when representing a real object under theform of dot matrix,
• it is also possible that the object moves during theacquisition, which would distort the measurements ofthe perimeter and the area.
when treating the images:
– • the choice of the threshold will necessarily lead to theomission of some pixel belonging to the solid, and viceversa,• the calculation of the contribution of a border pixel tothe total perimeter of the object, which is based on anapproximation depending on the neighbouring envi-ronment of the pixel.
Thus, the determination of the measurement error ofthe method presented in this paper constitutes aninteresting and key subject for future developments.
3 Results and discussion
3.1 Mechanism of the attack of the solid by nitric acid
The first experiment realized consists in observing theattack of a UO2 pellet by optical microscopy. The pellet hasbeen placed on amicroscope glass including wells, and a fewdrops of a 4.93mol l�1 nitric acid solution at glove boxtemperature (i.e. 298.15K) have been introduced in thewell.
The uranium dioxide pellet before the addition of thenitric acid solution is presented in Figure 11a. About 1 or2 s after the addition of the nitric acid solution, the firstNOx bubbles appear at the solid-liquid interface, indicatingthat the reaction has started (Fig. 11b). The reaction keepsrunning, and the first detachment of macro-bubbles can beobserved. These macro-bubbles are formed from coales-cence of smaller ones (Fig. 11c). Finally, bubbling comes toan intense stationary regime, and maintaining the focusbecomes very complicated. It is possible to see uraniumdioxide fragments detaching from the pellet, and falling atthe bottom of the vessel (Fig. 11d).
These fragments have been sampled and introduced inanother microscope glass well with the same fresh solutionas used for the pellet attack. Figure 12 shows thedissolution of the fragments: after more than 22 h ofcontact with the nitric acid solution, there are still somefragments which are not completely dissolved.

Fig. 11. Microscopic observations of the dissolution of a uranium dioxide pellet in nitric acid (corresponding times are indicated on topright of the images).
Fig. 12. Microscopic observations of the dissolution of the uranium dioxide detached fragments in nitric acid (corresponding times areindicated on top right of the images).
8 P. Marc et al.: EPJ Nuclear Sci. Technol. 4, 2 (2018)
These two series of observations highlight at least atwo-steps mechanism for the dissolution of uraniumdioxide sintered solids by nitric acid solutions. Based onthe observations documented in former articles [30–33,51,52], it is likely that the first step of the attackconsists in the formation and development of preferentialattack sites. As the result of the development of the biggestsites, as observed in particular in Uriarte and Raineytechnical report [52], fragments detached from the solid,which disintegrates. These fragments dissolve much moreslowly in the solution, and through a much simplerdissolution mechanism than the pellet one. Indeed, thefragments dissolve without the production of bubbles,
likely because of the absence of compatible nucleation sites,and seemingly through a uniform attack. Nevertheless, it islikely that preferential attack sites are formed at thesurface of the fragments, and would be closer from theetching pits already reported in previous articles [28,30–33,51]. Thus, these sites cannot be observed by opticalmicroscopy, and do not interfere with the dissolutionkinetics measurements.
This last point is of primary importance: one of themain defaults which can be noticed concerning themeasurements of dissolution kinetics of uranium dioxidein nitric acid media found in the literature is that they aremade at amacroscopic scale, using pellets. At this scale, the

P. Marc et al.: EPJ Nuclear Sci. Technol. 4, 2 (2018) 9
evolution of the concentration of dissolving materials in thebulk is practically impossible to relate to the chemicalreaction kinetic. Indeed, it results from the complexcoupled phenomena of the chemical reaction and masstransport, complicated by others elements such as thereactive surface area evolution during dissolution andbubbling at the surface of the solid [34–37,53–56].
Fig. 13. Dissolution rates as a function of the pre-dissolved massof uranium dioxide.
3.2 Chemical kinetics measurement
The knowledge of the chemical kinetic laws of thedissolution reaction of uranium dioxide in nitric acidmedia is necessary for determining dissolution residencetimes at industrial scales. Regarding the complication ofthe dissolution mechanism at the microscopic scale, thepreviously reported data, measured at a macroscopic scale[14], seem to be questionable.
The uniform attack and absence of bubbling during thedissolution of the fragments, as well as the possibility ofascertaining the rate determining step during the dissolu-tion rates measurements, encourage their use for chemicalkinetics measurements.
3.2.1 Autocatalysis
As presented earlier [14], several experimental observationsseem to indicate that the mechanism of the chemicalreaction between uranium dioxide and nitric acid isautocatalytic. Nevertheless, the scale at which theseobservations were made implies that the conclusionsdrawn could result from the disturbance of other importantphenomena like transport phenomena or bubbling [4]. Asfragments dissolve in the absence of these potentiallydisturbing phenomena, the measurements of dissolutionrates in solutions containing various amounts of dissolutionproducts allow to conclude on the existence, or not, of anautocatalyzed mechanism. Moreover, the important liq-uid/solid ratios during these experiments limit catalyzeraccumulation, enabling the measurement of the effect ofthe concentration of dissolution products on the dissolutionrates.
Figure 13 shows the dissolution rates of uraniumdioxide fragments as a function of the pre-dissolved mass ofuranium dioxide, for a 4.73mol l�1 fresh nitric acid solutionat 343.15K. The nitric acid concentration drawn on thisfigure corresponds to the initial nitric acid concentration inthe solution containing the pre-dissolved mass of uraniumdioxide. Thus, its variation is due to the consumption ofthis reagent by the pre-dissolution of uranium dioxide. Dueto the large excess of solution relative to the mass of solidused, the concentration of nitric acid and reaction productscan be considered as constant over the time.
It can be seen on this figure that the dissolution ratesstrongly increase with the increase of the amount of pre-dissolved uranium dioxide, and rapidly reach the limitimposed by mass-transport. Thus, it can be concludedwithout doubt that the reaction is strongly autocatalyzed.Indeed, considering the global balance equation presentedin equation (9), it can be concluded that the total amountof uranium dioxide which can be dissolved in a 4.73mol l�1
nitric acid solution is about 479 g l�1. This concentrationmakes any saturation issue hypothetic, since the solubilityof uranyl nitrate in water is about 1.27 kg l�1 at 25 °C. Theobservations of nitric acid gradients around dissolvingcopper and uranium dioxide particles in this media madeby Delwaulle et al. [17,18] also consolidate the conclusionthat the slowdown of the increase of the dissolution rates isrelated to a mass-transport limitation of the nitric acid.
These experiments show that the dissolution rateincreases from 2.87 nm s�1 to 70.43 nm s�1, representingabout a 25 times increase, while only 10 g l�1 out of thepossible 479 g l�1 of uranium dioxide have been pre-dissolved in one liter of a 4.73mol l�1 nitric acid solution.
The evidence of the existence of an autocatalyzedmechanism also reinforces the interest in measuringdissolution kinetics using microscopic fragments andoptical microscopy: the possibility of working with a largeexcess of solution allows considering that the concen-trations of the species, including the products, remainconstant over the experiment. Additionally, when thechemical reaction is the rate determining step, theconcentrations at the solid/liquid interface can be consid-ered as equal to the concentrations in the bulk. This impliesthat this method allows, for the first time, measuring therates of the non-catalyzed reaction and the rates of thecatalyzed one separately for various reaction productsamounts.
3.2.2 Chemical kinetics of the non-catalyzed reaction
Dissolution rates measurements have been realized incondition of large excess of fresh nitric acid solution atseveral temperatures and nitric acid concentrations(Fig. 14). The large excess of nitric acid solution isguaranteed by the volume of nitric acid in the well of thedissolution cell, which is about 5, and the fact that theuranium dioxide fragments dissolved for each measure-ment represent few micrograms of uranium dioxide. Thevolumetric liquid/solid ratio of these experiments iscalculated as presented in equation (12).
S
L¼ mUO2
rUO2
1
V l: ð13Þ
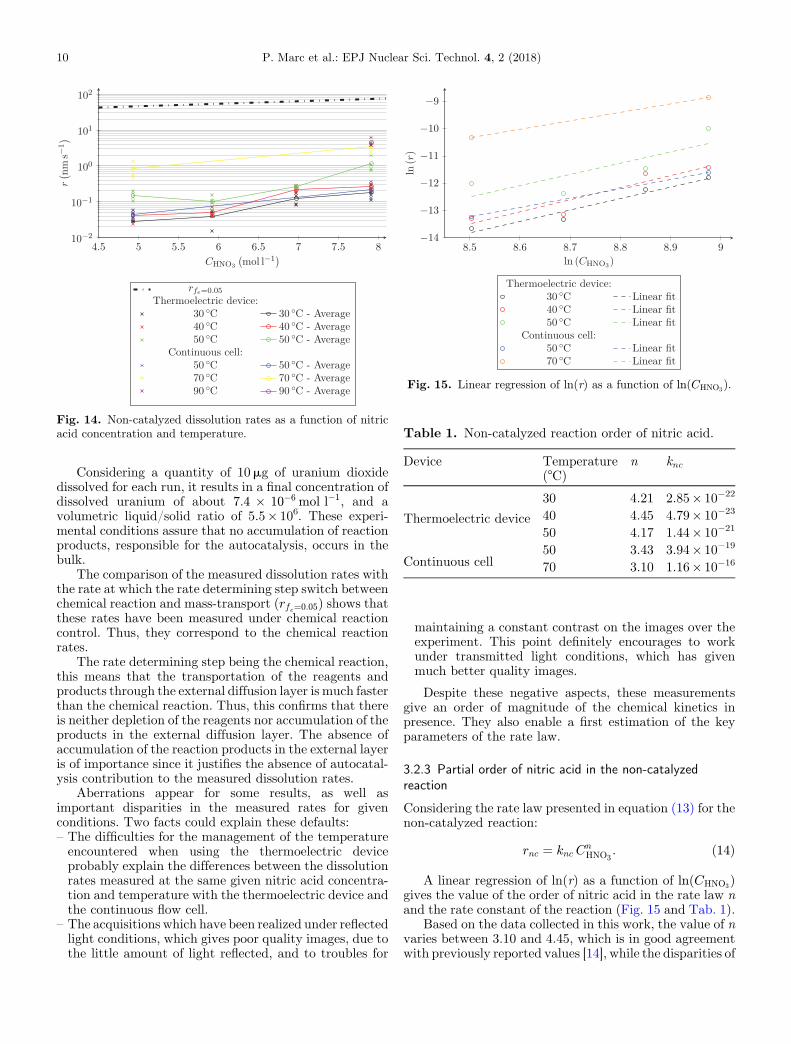
Fig. 14. Non-catalyzed dissolution rates as a function of nitricacid concentration and temperature.
Fig. 15. Linear regression of ln(r) as a function of lnðCHNO3Þ.
Table 1. Non-catalyzed reaction order of nitric acid.
Device Temperature(°C)
n knc
Thermoelectric device
30 4.21 2.85� 10�22
40 4.45 4.79� 10�23
50 4.17 1.44� 10�21
Continuous cell50 3.43 3.94� 10�19
70 3.10 1.16� 10�16
10 P. Marc et al.: EPJ Nuclear Sci. Technol. 4, 2 (2018)
Considering a quantity of 10mg of uranium dioxidedissolved for each run, it results in a final concentration ofdissolved uranium of about 7:4 � 10�6 mol l�1, and avolumetric liquid/solid ratio of 5.5� 106. These experi-mental conditions assure that no accumulation of reactionproducts, responsible for the autocatalysis, occurs in thebulk.
The comparison of the measured dissolution rates withthe rate at which the rate determining step switch betweenchemical reaction and mass-transport (rfe¼0:05) shows thatthese rates have been measured under chemical reactioncontrol. Thus, they correspond to the chemical reactionrates.
The rate determining step being the chemical reaction,this means that the transportation of the reagents andproducts through the external diffusion layer is much fasterthan the chemical reaction. Thus, this confirms that thereis neither depletion of the reagents nor accumulation of theproducts in the external diffusion layer. The absence ofaccumulation of the reaction products in the external layeris of importance since it justifies the absence of autocatal-ysis contribution to the measured dissolution rates.
Aberrations appear for some results, as well asimportant disparities in the measured rates for givenconditions. Two facts could explain these defaults:
– The difficulties for the management of the temperatureencountered when using the thermoelectric deviceprobably explain the differences between the dissolutionrates measured at the same given nitric acid concentra-tion and temperature with the thermoelectric device andthe continuous flow cell.–
The acquisitions which have been realized under reflectedlight conditions, which gives poor quality images, due tothe little amount of light reflected, and to troubles formaintaining a constant contrast on the images over theexperiment. This point definitely encourages to workunder transmitted light conditions, which has givenmuch better quality images.
Despite these negative aspects, these measurementsgive an order of magnitude of the chemical kinetics inpresence. They also enable a first estimation of the keyparameters of the rate law.
3.2.3 Partial order of nitric acid in the non-catalyzedreaction
Considering the rate law presented in equation (13) for thenon-catalyzed reaction:
rnc ¼ knc CnHNO3
: ð14Þ
A linear regression of ln(r) as a function of lnðCHNO3Þ
gives the value of the order of nitric acid in the rate law nand the rate constant of the reaction (Fig. 15 and Tab. 1).
Based on the data collected in this work, the value of nvaries between 3.10 and 4.45, which is in good agreementwith previously reported values [14], while the disparities of

Fig. 16. Arrhenius plot of the dissolution rates.
Table 2. Activation energies (kJmol�1) of the dissolutionreaction.
Device CHNO3
(mol l�1)
Temperature (°C)
30–40 40–50 50–70 70–90
Thermoelectricdevice
4.93 29.2 108.2 � �5.92 16.0 63.3 � �6.97 45.5 15.2 � �7.91 29.3 121.1 � �
Continuous cell4.93 – � 134.7 �7.91 � � 127.7 12.6
P. Marc et al.: EPJ Nuclear Sci. Technol. 4, 2 (2018) 11
the measured dissolution rates are likely explaining thevariations of the calculated n values.
3.2.4 Activation energy of the non-catalyzed reaction
The Arrhenius plot of the dissolution rates (Fig. 16 andTab. 2) shows the same dependence of activation energyupon temperature as reported in literature, and, not takinginto consideration abnormal values, the magnitude of thecalculated activation energies are also in good agreementwith the literature [14,57–59]. This confirms that thisreaction does not follow the Arrhenius law, which could bedue to a change in the chemical step limiting the overalldissolution rates.
4 Conclusions
This study of uranium dioxide dissolution in nitric acidmedia has been realized by means of in situ opticalmicroscopy. This technique has required the developmentof devices allowing the observation of the dissolution andcontrol of the temperature which are presented in thispaper.
It first enables progress in the understanding of thedissolution mechanism of a macroscopic sintered solid ofuranium dioxide. Microscopic observations show that thedevelopment of the cracks at the surface of the solid resultsin its cleavage. There is a large difference in the dissolutionof the whole pellet, which disintegrates in smallerfragments with non-addressed complex phenomena andunder a short time and the further dissolution of thesefragments, which occurs in the absence of bubbling andseems to be uniform.
The simple way the fragments dissolve through hasmotivated their use for a kinetic study by the means ofoptical microscopy. Thus, a complete methodology for thetreatment of the images of the dissolving fragments hasbeen developed.
The comparison of optical microscopy over the classicalmacroscopic techniques has shown that it is particularlyefficient in other domains, and offers even more advantagesin the case of uranium dioxide dissolution in nitric acidmedia. One of these advantages relates to environmentaland safety issues, since this method requires smalleramount of reagent in a comparison with macroscopic ones:this is particularly important in the nuclear chemistry field,where the cost of waste treatment is expensive.
The other points are of primary interest since theyconcern the specificity of the measurement. The dissolutionmechanism of sintered macroscopic uranium dioxide solidsis comprised of phenomena which make highly complex,even impossible, any link between measured dissolutionkinetics at a macroscopic scale and chemical reactionkinetics. The microscopic experiments presented in thispaper show that the dissolution of small fragments occursin absence of potentially disturbing phenomena, such asbubbling, or non-uniform surface evolution. They also givepossibility to easily work with a large excess of liquid,ensuring, when chemical reaction is the rate determiningstep, that the concentrations of the reagents and productsare unchanged over time both in the bulk and at the solid/liquid interface. This means that the concentrations andtemperature corresponding to the measured dissolutionrates can be accurately known. These last points makemicroscopy a reliable method for the measurement of thedissolution chemical reaction kinetics.
The series of measurements realized in this workdemonstrate that the chemical mechanism is stronglyautocatalyzed. The microscopy method enables themeasurement of chemical rates of the non-catalyzedreaction, giving a first approximation of the parametersof the rate law. Problems of disparity and some aberrantresults imply that further studies will be required in orderto measure dissolution rates and determine the parametersof the rate law more accurately, including the catalysedreaction rates.
The measurements presented in this work constituteencouraging preliminary results, which have to be clarified,but remain interesting for approximating some keyparameters for modeling the dissolution of uranium dioxidein nitric acid media.
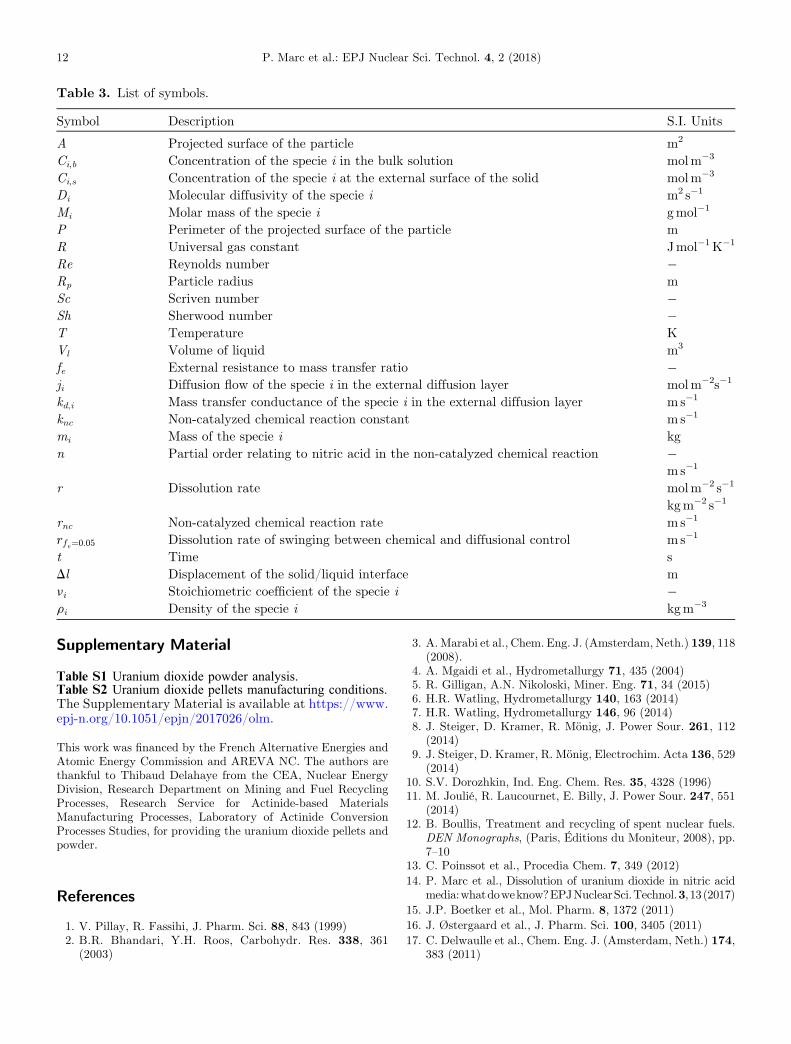
Table 3. List of symbols.
Symbol Description S.I. Units
A Projected surface of the particle m2
Ci,b Concentration of the specie i in the bulk solution molm�3
Ci,s Concentration of the specie i at the external surface of the solid molm�3
Di Molecular diffusivity of the specie i m2 s�1
Mi Molar mass of the specie i gmol�1
P Perimeter of the projected surface of the particle mR Universal gas constant Jmol�1K�1
Re Reynolds number �Rp Particle radius mSc Scriven number �Sh Sherwood number �T Temperature KVl Volume of liquid m3
fe External resistance to mass transfer ratio �ji Diffusion flow of the specie i in the external diffusion layer molm�2s�1
kd,i Mass transfer conductance of the specie i in the external diffusion layer m s�1
knc Non-catalyzed chemical reaction constant m s�1
mi Mass of the specie i kgn Partial order relating to nitric acid in the non-catalyzed chemical reaction �
ms�1
r Dissolution rate molm�2 s�1
kgm�2 s�1
rnc Non-catalyzed chemical reaction rate m s�1
rfe¼0:05 Dissolution rate of swinging between chemical and diffusional control m s�1
t Time sDl Displacement of the solid/liquid interface mni Stoichiometric coefficient of the specie i �ri Density of the specie i kgm�3
12 P. Marc et al.: EPJ Nuclear Sci. Technol. 4, 2 (2018)
Supplementary Material
Table S1 Uranium dioxide powder analysis.Table S2 Uranium dioxide pellets manufacturing conditions.The Supplementary Material is available at https://www.epj-n.org/10.1051/epjn/2017026/olm.
This work was financed by the French Alternative Energies andAtomic Energy Commission and AREVA NC. The authors arethankful to Thibaud Delahaye from the CEA, Nuclear EnergyDivision, Research Department on Mining and Fuel RecyclingProcesses, Research Service for Actinide-based MaterialsManufacturing Processes, Laboratory of Actinide ConversionProcesses Studies, for providing the uranium dioxide pellets andpowder.
References
1. V. Pillay, R. Fassihi, J. Pharm. Sci. 88, 843 (1999)2. B.R. Bhandari, Y.H. Roos, Carbohydr. Res. 338, 361
(2003)
3. A.Marabi et al., Chem. Eng. J. (Amsterdam, Neth.) 139, 118(2008).
4. A. Mgaidi et al., Hydrometallurgy 71, 435 (2004)5. R. Gilligan, A.N. Nikoloski, Miner. Eng. 71, 34 (2015)6. H.R. Watling, Hydrometallurgy 140, 163 (2014)7. H.R. Watling, Hydrometallurgy 146, 96 (2014)8. J. Steiger, D. Kramer, R. Mönig, J. Power Sour. 261, 112
(2014)9. J. Steiger, D. Kramer, R. Mönig, Electrochim. Acta 136, 529
(2014)10. S.V. Dorozhkin, Ind. Eng. Chem. Res. 35, 4328 (1996)11. M. Joulié, R. Laucournet, E. Billy, J. Power Sour. 247, 551
(2014)12. B. Boullis, Treatment and recycling of spent nuclear fuels.
DEN Monographs, (Paris, Éditions du Moniteur, 2008), pp.7–10
13. C. Poinssot et al., Procedia Chem. 7, 349 (2012)14. P. Marc et al., Dissolution of uranium dioxide in nitric acid
media:whatdoweknow?EPJNuclearSci.Technol.3, 13(2017)15. J.P. Boetker et al., Mol. Pharm. 8, 1372 (2011)16. J. Østergaard et al., J. Pharm. Sci. 100, 3405 (2011)17. C. Delwaulle et al., Chem. Eng. J. (Amsterdam, Neth.) 174,
383 (2011)
P. Marc et al.: EPJ Nuclear Sci. Technol. 4, 2 (2018) 13
18. C. Delwaulle, Étude de la dissolution du dioxyded’uraniumen milieu nitrique: unenouvelle approchevisant à la compré-hension des mécanismes interfaciaux. PhD thesis. InstitutNational Polytechnique de Lorraine, 2011
19. M.R. Singh et al., Cryst. Growth Des. 14, 5647 (2014)20. L. Forny,A.Marabi, S.Palzer,PowderTechnol.206, 72 (2011)21. S.V. Dorozhkin, J. Cryst. Growth 182, 125 (1997)22. K.V.R. Prasad et al., Int. J. Pharm. (Amsterdam, Neth.)
238, 29 (2002)23. S.L. Raghavan et al., J. Pharm. Sci. 91, 2166 (2002)24. S.L. Raghavan et al., J. Pharm. Sci. 92, 439 (2003)25. S. Svanbäck, H. Ehlers, J. Yliruusi, Int. J. Pharm.
(Amsterdam, Neth.) 469, 10 (2014)26. S. Svanbäck et al., Anal. Chem. (Washington, DC, US) 87,
5041 (2015)27. S. Svanbäck et al., Anal. Chem. (Washington, DC, US) 87,
11058 (2015)28. A. Briggs, Dislocation etching and chemical polishing studies
on UO2 single crystals. Technical document Ref. AERE-M859. (United Kingdom Atomic Energy Authority, 1961)
29. A. Briggs, Brit. Ceram. Trans. J. 60, 505 (1961)30. M. Shabbir, R.G. Robins, J. Nucl. Mater. 25, 236 (1968)31. Y. Zhao, J. Chen, J. Nucl. Mater. 373, 53 (2008)32. Y. Zhao, J. Chen, Radiochim. Acta 96, 467 (2008)33. Y. Zhao, J. Chen, Sci. China. Ser. B. 51, 700 (2008)34. J.Y. Park, O. Levenspiel, Chem. Eng. Sci. 30, 1207 (1975)35. H. Grénman et al., Chem. Eng. Sci. 66, 4459 (2011)36. H. Grénman, T. Salmi, D.Y. Murzin, Rev. Chem. Eng. 27, 53
(2011)37. T. Salmi et al., Chem. Eng. Process. 50, 1076 (2011)38. J.S. Weszka, Comput. Vision Graph. 7, 259 (1978)39. K.S. Fu, J.K. Mui, Pattern Recogn. 13, 3 (1988)40. R.M. Haralick, L.G. Shapiro, Comput. Vision Graph. 29, 100
(1985)41. P.K. Sahoo et al., Comput. Vision Graph. 41, 233 (1988)42. N.R. Pal, S.K. Pal, Pattern Recogn. 26, 1277 (1993)43. N.R. Pal, D. Bhandari, Signal Process. 33, 139 (1993)
44. D.E. Mears, Ind. Eng. Chem. Process Des. Dev. 10, 541(1971)
45. J.-L. Houzelot, Réacteurs chimiques polyphasés-Couplageréaction/diffusion, in Opérations unitaires. Génie de laréaction chimique (Paris, Techniques de l’ingénieur, 2000)
46. M. Mohagheghi, G. Bakeri, M. Saeedizad, Chem. Eng.Technol. 30, 1721 (2007)
47. J. Villermaux, Génie de la réactionchimique: conceptionetfonctionnement des réacteurs. Techniques et documenta-tion � Lavoisier, 1985.
48. O. Levenspiel, Chemical Reaction Engineering (John Wiley& Sons, New York, 1999)
49. R.S. Ondrejcin, Physical properties of uranium processsolutions. Technical document Ref. DP-653.E. I. du Pont deNemour& Co., 1961.
50. H.-S. Yeh, G.B. Wills, J. Chem. Eng. Data 16, 76 (1971)51. A. Portnoff, H. Frisby, Comptes-rendus hebdomadaires des
séances de l’académie des sciences 250, 1486 (1960)52. A.L. Uriarte, R.H. Rainey, Dissolution of high-density UO2,
PuO2 and UO2-PuO2 pellets in inorganic acids. Technicaldocument Ref. ORNL-3695 (Oak Ridge National Laborato-ry, USA, 1965)
53. L.D. Datsevich, Catal. Today 294, 22 (2005)54. B. Blümich et al., Chem. Eng. J. (Amsterdam, Neth.) 134, 35
(2007)55. T. Oehmichen, L. Datsevich, A. Jess, Chem. Eng. Technol.
33, 911 (2010)56. T. Oehmichen, L. Datsevich, A. Jess, Chem. Eng. Technol.
33, 921 (2010)57. B. Hermann.Dissolution of unirradiated UO2-pellets in nitric
acid. Technical document Ref. 3673. (Karlsruher Institut fürTechnologie, Germany, 1984)
58. R.F. Taylor et al., Processing in limited geometry. Part III.The dissolution of uranium dioxide sintered pellets in nitricacid. Technical document Ref. AERE-R 3678. (UnitedKingdom Atomic Energy Authority, UK, 1962)
59. R.F. Taylor et al., J. Appl. Chem. 13, 32 (1963)
Cite this article as: Philippe Marc, Alastair Magnaldo, Jérémy Godard, Éric Schaer, A method for phenomenological andchemical kinetics study of autocatalytic reactive dissolution by optical microscopy. The case of uranium dioxide dissolution in nitricacid media, EPJ Nuclear Sci. Technol. 4, 2 (2018)