a model for assessing cost effectiveness of applying lean tool
TRANSCRIPT

School of technology and design
A Model for Assessing Cost Effectiveness of Applying Lean Tools
A-case study
VÄXJÖ, JUNE 2007 THESIS No.: TD 077/2007 HEBA AL-HAMED XIAOJIN QIU DEPARTMENT OF MECAHNICL ENGINEERING
I
Organisation/ Organization Författare/Authors Heba Alhamed
VÄXJÖ UNIVERSITET Xiaojin Qiu Institutionen för teknik och design Växjö University School of Technology and Design
Dokumenttyp/Type of document Handledare/tutor Examinator/examiner Examensarbete/ Diplomawork Imad Alsyouf Imad Alsyouf
Titel och undertitel/Title and subtitle A model for Assessing Cost Effectiveness of Applying Lean Tools - A case study
Abstract The purpose of this thesis is to develop a model for assessing cost effectiveness of applying lean tools. The model consists of eight phases: it starts by understanding customers' requirements using Voice of Customer (VOC) and Quality Function Deployment (QFD) tools. In phase 2, the current state of plant is assessed using lean profile charts based on Balanced Scorecard (BSC) measures. In phase 3 and phase 4, identification of critical problem(s) and generating of improvement suggestion(s) are performed. Phase 5 provide evaluation of the cost effectiveness of implementing the suggested lean methods based on life cycle cost analysis (LCCA) and phase 6 prefers the right alternative based on multiple criteria decision making (MCDM). In phase 7 the selected alternative is supposed to be implemented and finally the user should monitor and control the process to make sure that the improvement is going as planned. The model was verified successfully using a case study methodology at one Swedish sawmill called Södra Timber in Ramkvilla, one part of Södra group. Results obtained from the study showed that the production and human resources perspectives are the most critical problem areas that need to be improved. They got the lowest scores in the lean profile, 63% and 68%, respectively. Using value stream mapping (VSM) it was found that the non value added (NVA) ratios for the core and side products are 87.4% and 90.4%, respectively. Using the model, three improvement alternatives were suggested and evaluated using LCCA and MCDM. Consequently, implementing 5S got the highest score, second came redesigning the facility layout. However, it was estimated that 4.7 % of NVA for the side product would be reduced by redesigning the facility layout. The recommendations were suggested for the company to improve their performance. The novelty of the thesis is based on the fact that it addresses two main issues related to lean manufacturing: firstly, suggesting lean techniques based on assessment of lean profile that is based on BSC and QFD, and secondly assessing the cost effectiveness of the suggested lean methods based on LCCA and MCDM. This thesis provides a generalized model that enables the decision-maker to know and measure, holistically, the company performance with respect to customer requirements. This will enable the company to analyze the critical problems, suggest solutions, evaluate them and make a cost effective decision. Thus, the company can improve its competitiveness. Key Words Lean manufacturing, Lean tools, Cost effectiveness, Life cycle cost analysis, Balanced scorecard, Multiple criteria decision making, Value stream mapping, sawmill, model.
Utgivningsår/Year of issue Språk/Language Antal sidor/Number of pages 2007 Engelska/English 46 (73)
http://www.vxu.se/td, http://www.vxu.se/bib/diva/uppsatser/
II
ACKNOLODGEMENTS
We would sincerely like to thank all the people that have
contributed to the work of this thesis.
First of all we would like to thank our tutor, Dr. Imad
Alsyouf, who has supervised us in an excellent way, given
good and existing suggestions and criticism to the process of
the work and motivate us in a good way. This has improved
the quality of the thesis. Also, we would like to thank Dr.Raid
Al-Aomar from JUST University for his useful comments.
We would like to thanks Södra Timber in Ramkvilla for giving
us the opportunity to work on a real case study in the
production. Most of all, we would like to thank Mikael Tates,
and Sophie Palm, who were kindly enough to offer us the
necessary information and devote time during the interviews,
and all the employees that participate in our survey. Without
their support, the compilation of this thesis would not have
been possible.
Växjö, June 2007 Heba Al-Hamed Xiaojin Qiu
III
DEFINITION OF KEY TERMS Balanced Scorecard: It is a link between strategy and execution using a framework to translate strategy into operational terms. The four fundamental dimensions of the balanced scorecard framework are: financial perspective, customer perspective, learning and growth perspective, and internal business process perspective (Kaplan and Norton, 1996). Batch size: It is the number of units accumulated and moved from one work station to the next in the product flow (EL-Haik and AL-Aomar, 2006). Effectiveness: The ratio of actual output over the expected output. It measures the degree to which the relevant goals or objectives are achieved (Alsyouf, 2006). Efficiency: The ratio of the prescribed resources expected to be used, ideally, over resources actually used. It measures how economically the firm's resources are utilized when providing a given level of objective, i.e. output requirements (Alsyouf, 2006). Inventory: Work in progress, raw material, finished goods and suppliers required for creation of a company's goods. Number of units or/and stock value of goods held by a company (Vitasek, 2005). Lead-time: The total time that elapses between an order's placement and its receipt (Vitasek, 2005). Lean profile: It is a tool used to display the current status of the plant and the gap from specific lean targets (Taj, 2005). Life Cycle Cost Analysis: It is defined as a systematic analytical process for evaluating various designs or alternative courses of actions with the objective of choosing the best way to employ scarce resources (Durairaj, 2002). Life Cycle Cost: It is defined as the overall cost of products over its lifetime, including research and development cost, production and construction cost, operation and maintenance cost, retirement and disposal cost (Blanchard, 2004). Overall Equipment effectiveness: It is a measure of how well equipment or lines are utilized in relation to their full potential. OEE is based on the product of three individual factors, Availability, Performance efficiency and Quality rate (Nakajima, 1988). Quality Function Deployment: It means deploying the attributes of a product or service desired by the customer throughout all the appropriate functional components of an organization (Re Velle, 1997). Suppliers-Input-Process-Output-Customers diagram: A tool for creating a high-level map of process, which stands for Supplier, Input, Process, Output, Customers (George, 2003).
IV
Total productive maintenance: It is a management approach to maintenance that focuses on involving all employees in an organization in equipment improvement (Duffuaa, 1999). Value Stream Mapping: a tool that is used to graphically represent the processes or activities involved in the manufacturing and delivery of a product. These activities can be divided into value added and non value added (EL-Haik and AL-Aomar, 2006). Value: It is what the customer is willing to pay for a product or service (EL-Haik and AL-Aomar, 2006). Value added: It is the activities that contribute to the value of a product or service (EL-Haik and AL-Aomar, 2006). 5S: It is one of the lean improvement tools, and it stands for: Sort, organize, separating the needed from the unneeded; Straighten, arrange and identify for ease of use; Shine, clean and look for ways to keep it clean; Standardize, maintain and monitor the first 3 S; Sustain, discipline, stick to the rules and maintain motivation (George, 2003).
V
TABLE OF ABBREVIATIONS BSC : Balanced Scorecard CT : Cycle time ELIN : Electronic Library Information Navigator HOQ : House of Quality LCC : Life Cycle Costing LCCA : Life Cycle Cost Analysis MCDM : Multiple Criteria Decision Making NVA : Non-value added OEE : Overall Equipment Effectiveness PDCA : Plan-Do-Check-Act PW : Present worth QFD : Quality function deployment SEK : Swedish Kronor SIPOC : Suppliers-Input-Process-Output-Customers TPM : Total productive maintenance VA : Value added VSM : Value Stream Mapping WIP : Work in progress
VI
TABLE OF CONTEXT ABSTRACT..................................................................................................................................... I
ACKNOLODGEMENTS ...............................................................................................................II
DEFINITION OF KEY TERMS .................................................................................................. III
TABLE OF ABBREVIATIONS ....................................................................................................V
TABLE OF CONTEXT................................................................................................................ VI
LIST OF APPENDIXES ............................................................................................................VIII
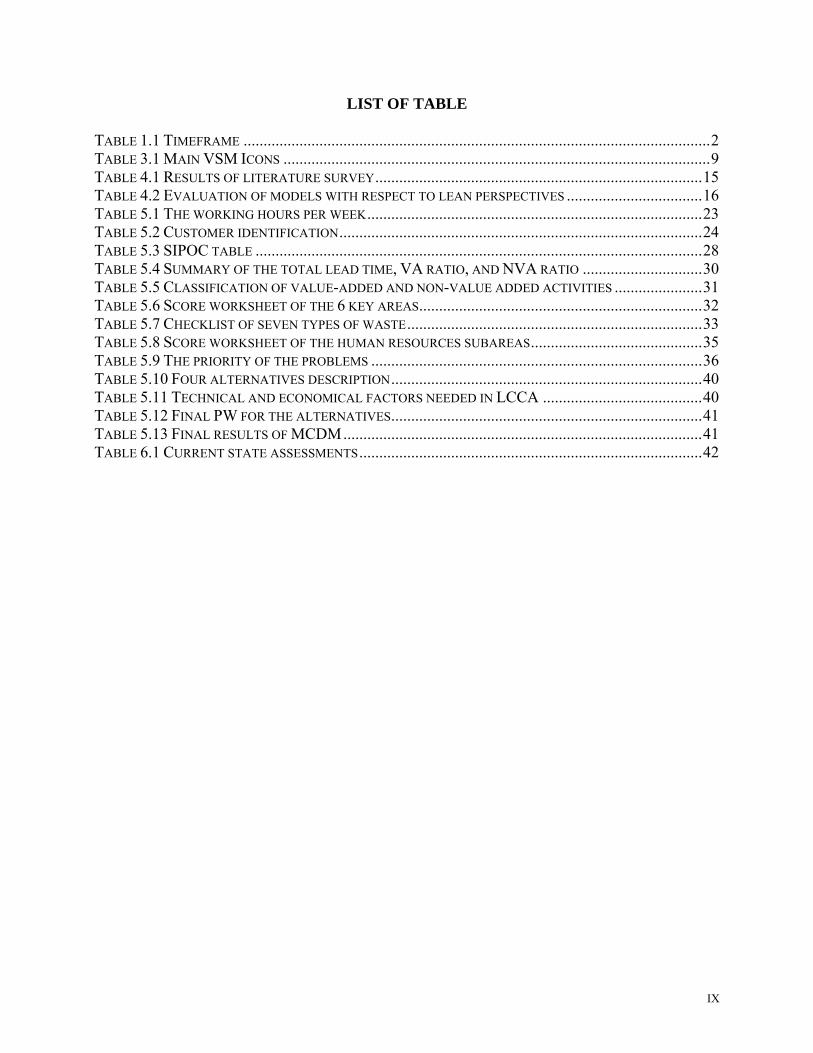
LIST OF TABLE.......................................................................................................................... IX
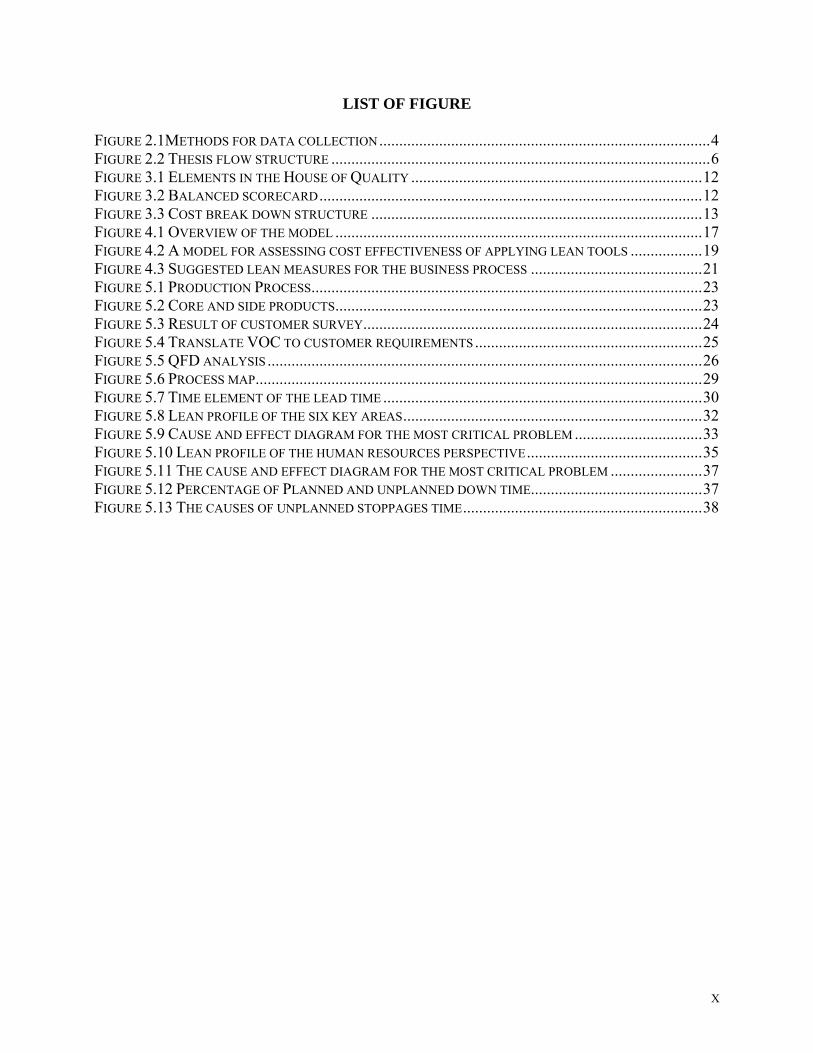
LIST OF FIGURE ..........................................................................................................................X
1. INTRODUCTION ...................................................................................................................... 1
1.1 BACKGROUND .........................................................................................................................1 1.2 PROBLEM DISCUSSION .............................................................................................................1 1.3 PROBLEM FORMULATION.........................................................................................................1 1.4 PURPOSE..................................................................................................................................1 1.5 RELEVANCE.............................................................................................................................2 1.6 LIMITATIONS AND DELIMITATIONS ..........................................................................................2 1.7 TIMEFRAME.............................................................................................................................2
2. METHODOLOGY ..................................................................................................................... 3
2.1 SCIENTIFIC PERSPECTIVE .........................................................................................................3 2.2 RESEARCH APPROACH .............................................................................................................3 2.3 DATA COLLECTION ..................................................................................................................4 2.4 RESULTS EVALUATION ............................................................................................................4
2.4.1 Validity............................................................................................................................4 2.4.2 Reliability ........................................................................................................................5 2.4.3 Generalization of results..................................................................................................5
2.5 PRE-UNDERSTANDING .............................................................................................................5 2.6 THESIS RESEARCH METHODS ...................................................................................................5
3. THEORY .................................................................................................................................... 7
3.1 LEAN PRODUCTION..................................................................................................................7 3.2 LEAN METHODOLOGIES AND TOOLS.........................................................................................7
3.2.1 Value stream mapping.....................................................................................................8 3.2.2 5S...................................................................................................................................10 3.2.3 Total productive maintenance .......................................................................................10 3.2.4 Overall Equipment Effectiveness..................................................................................10
3.3 QUALITY FUNCTION DEPLOYMENT ........................................................................................11 3.4 BALANCED SCORECARD ........................................................................................................12 3.5 LIFE CYCLE COST ANALYSIS ..................................................................................................13 3.6 MULTIPLE CRITERIA DECISION MAKING.................................................................................13
4. MODEL DEVELOPMENT...................................................................................................... 15
4.1 LITERATURE SURVEY.............................................................................................................15
VII
4.2 CRITICAL ANALYSIS OF RELEVANT LITERATURE....................................................................15 4.3 MODEL DEVELOPMENT .........................................................................................................17
5. CASE STUDY.......................................................................................................................... 22
5.1 PRESENTATION OF SÖDRA GROUP..........................................................................................22 5.2 PRESENTATION OF SÖDRA TIMBER IN RAMKVILLA ...............................................................22 5.3 SÖDRA TIMBER PRODUCTION OVERVIEW...............................................................................22 5.4 MODEL VALIDATION AND ANALYSIS .....................................................................................23
6. RESULTS ................................................................................................................................. 42
6.1 MAIN RESULT ........................................................................................................................42 6.2 RESULTS OF MODEL VALIDATION ..........................................................................................42
7. CONCLUSIONS ...................................................................................................................... 44
7.1 ANSWER TO THE PROBLEM FORMULATION.............................................................................44 7.2 RECOMMENDATIONS TO THE CASE COMPANY........................................................................44 7.3 EVALUATION OF THE MODEL .................................................................................................45 7.4 FURTHER RESEARCHES ..........................................................................................................45
REFERENCE................................................................................................................................ 46
VIII
LIST OF APPENDIXES APPENDIX 1 CUSTOMER QUESTIONNAIRE........................................................................................49 APPENDIX 2 EMPLOYEE QUESTIONNAIRE ........................................................................................50 APPENDIX 3 VALUE STREAM MAPPING FOR THE COMPLETE SUPPLY CHAIN .....................................51 APPENDIX 4 VALUE STREAM MAPPING IN THE SAWMILL .................................................................52 APPENDIX 5 LEAN ASSESSMENT TOOL.............................................................................................53 APPENDIX 6 RESULTS OF EMPLOYEE QUESTIONNAIRE.....................................................................57 APPENDIX 7 CURRENT FACILITY LAYOUT........................................................................................58 APPENDIX 8 NEW FACILITY LAYOUT OF ALTERNATIVE 1.................................................................59 APPENDIX 9 LCCA CALCULATIONS OF THE CURRENT STATE ..........................................................60 APPENDIX 10 LCCA CALCULATIONS FOR IMPLEMENT 5S ...............................................................61 APPENDIX 11 LCCA CALCULATIONS FOR CHANGE THE FACILITY LAYOUT .....................................62
IX
LIST OF TABLE TABLE 1.1 TIMEFRAME .....................................................................................................................2 TABLE 3.1 MAIN VSM ICONS ...........................................................................................................9 TABLE 4.1 RESULTS OF LITERATURE SURVEY..................................................................................15 TABLE 4.2 EVALUATION OF MODELS WITH RESPECT TO LEAN PERSPECTIVES ..................................16 TABLE 5.1 THE WORKING HOURS PER WEEK....................................................................................23 TABLE 5.2 CUSTOMER IDENTIFICATION...........................................................................................24 TABLE 5.3 SIPOC TABLE ................................................................................................................28 TABLE 5.4 SUMMARY OF THE TOTAL LEAD TIME, VA RATIO, AND NVA RATIO ..............................30 TABLE 5.5 CLASSIFICATION OF VALUE-ADDED AND NON-VALUE ADDED ACTIVITIES ......................31 TABLE 5.6 SCORE WORKSHEET OF THE 6 KEY AREAS.......................................................................32 TABLE 5.7 CHECKLIST OF SEVEN TYPES OF WASTE..........................................................................33 TABLE 5.8 SCORE WORKSHEET OF THE HUMAN RESOURCES SUBAREAS...........................................35 TABLE 5.9 THE PRIORITY OF THE PROBLEMS ...................................................................................36 TABLE 5.10 FOUR ALTERNATIVES DESCRIPTION..............................................................................40 TABLE 5.11 TECHNICAL AND ECONOMICAL FACTORS NEEDED IN LCCA ........................................40 TABLE 5.12 FINAL PW FOR THE ALTERNATIVES..............................................................................41 TABLE 5.13 FINAL RESULTS OF MCDM..........................................................................................41 TABLE 6.1 CURRENT STATE ASSESSMENTS......................................................................................42
X
LIST OF FIGURE FIGURE 2.1METHODS FOR DATA COLLECTION...................................................................................4 FIGURE 2.2 THESIS FLOW STRUCTURE ...............................................................................................6 FIGURE 3.1 ELEMENTS IN THE HOUSE OF QUALITY .........................................................................12 FIGURE 3.2 BALANCED SCORECARD................................................................................................12 FIGURE 3.3 COST BREAK DOWN STRUCTURE ...................................................................................13 FIGURE 4.1 OVERVIEW OF THE MODEL ............................................................................................17 FIGURE 4.2 A MODEL FOR ASSESSING COST EFFECTIVENESS OF APPLYING LEAN TOOLS ..................19 FIGURE 4.3 SUGGESTED LEAN MEASURES FOR THE BUSINESS PROCESS ...........................................21 FIGURE 5.1 PRODUCTION PROCESS..................................................................................................23 FIGURE 5.2 CORE AND SIDE PRODUCTS............................................................................................23 FIGURE 5.3 RESULT OF CUSTOMER SURVEY.....................................................................................24 FIGURE 5.4 TRANSLATE VOC TO CUSTOMER REQUIREMENTS.........................................................25 FIGURE 5.5 QFD ANALYSIS .............................................................................................................26 FIGURE 5.6 PROCESS MAP................................................................................................................29 FIGURE 5.7 TIME ELEMENT OF THE LEAD TIME ................................................................................30 FIGURE 5.8 LEAN PROFILE OF THE SIX KEY AREAS...........................................................................32 FIGURE 5.9 CAUSE AND EFFECT DIAGRAM FOR THE MOST CRITICAL PROBLEM ................................33 FIGURE 5.10 LEAN PROFILE OF THE HUMAN RESOURCES PERSPECTIVE............................................35 FIGURE 5.11 THE CAUSE AND EFFECT DIAGRAM FOR THE MOST CRITICAL PROBLEM .......................37 FIGURE 5.12 PERCENTAGE OF PLANNED AND UNPLANNED DOWN TIME...........................................37 FIGURE 5.13 THE CAUSES OF UNPLANNED STOPPAGES TIME............................................................38
A MODEL FOR ASSESSING COST EFFECTIVENESS OF APPLYING LEAN TOOLS Introduction
1
1. Introduction
In this chapter, an introduction of the thesis is presented. A description of the background, the problem discussion and the task developed around the subject are included in this chapter. 1.1 Background The world’s globalization and consolidation of multinational companies result in increased competition for all types of organization. Speed, quality, and low cost are the universal goals as long as there has been competition in business (George, 2003). Most fundamental ideas about how to make things have been changed twice by the auto industry in this century. Just as mass production swept away craft production, a new way of making things, called lean production, is rapidly making mass production obsolete (Womack, 1990). Establishing and mastering of a lean production system would allow the company to use less but achieve more, compared to the mass production, i.e. waste reduction by 80%, production cost reduction by 50%, manufacturing cycle times decreased by 50%, labor reduction by 50%, while maintaining or increasing throughput, higher quality, higher profits, etc. (Paixão, 2003). Lean production is a strategy to achieve continuous improvement in business process performance by eliminating the waste (Antony, 2004). In time, the abstractions behind lean production spread to logistics, and from there to the military, to construction, and to the service industry. As it turns out, principles of lean thinking are universal and have been applied successfully across many disciplines. Lean principles have proven not only to be universal, but also to be universally successful at improving results (Lane, 2002). 1.2 Problem discussion Lean tools are powerful tools for companies to achieve their goal. There are many references discussing about how to apply lean tools in different industries. However, companies should pay attention on special considerations for using the lean techniques in different environment, including both tools and methods (George, 2003). The improvements should be a continuous process and should be viewed and measured from an economic point of view. The costs for implementing the improvements must be lower than the benefits that could be gained from it. 1.3 Problem formulation The main research problem in this thesis is:
How to assess the cost effectiveness of lean tools suggested by continual improvement efforts? 1.4 Purpose The purpose of this thesis is to develop a model that can be used for assessing the current state, identifying problem(s), generating and evaluating the suggestion(s), and selecting a most cost effective one. The developed model should be able to help all types of organizations to measure the cost effectiveness of applying lean tool (s).
A MODEL FOR ASSESSING COST EFFECTIVENESS OF APPLYING LEAN TOOLS Introduction
2
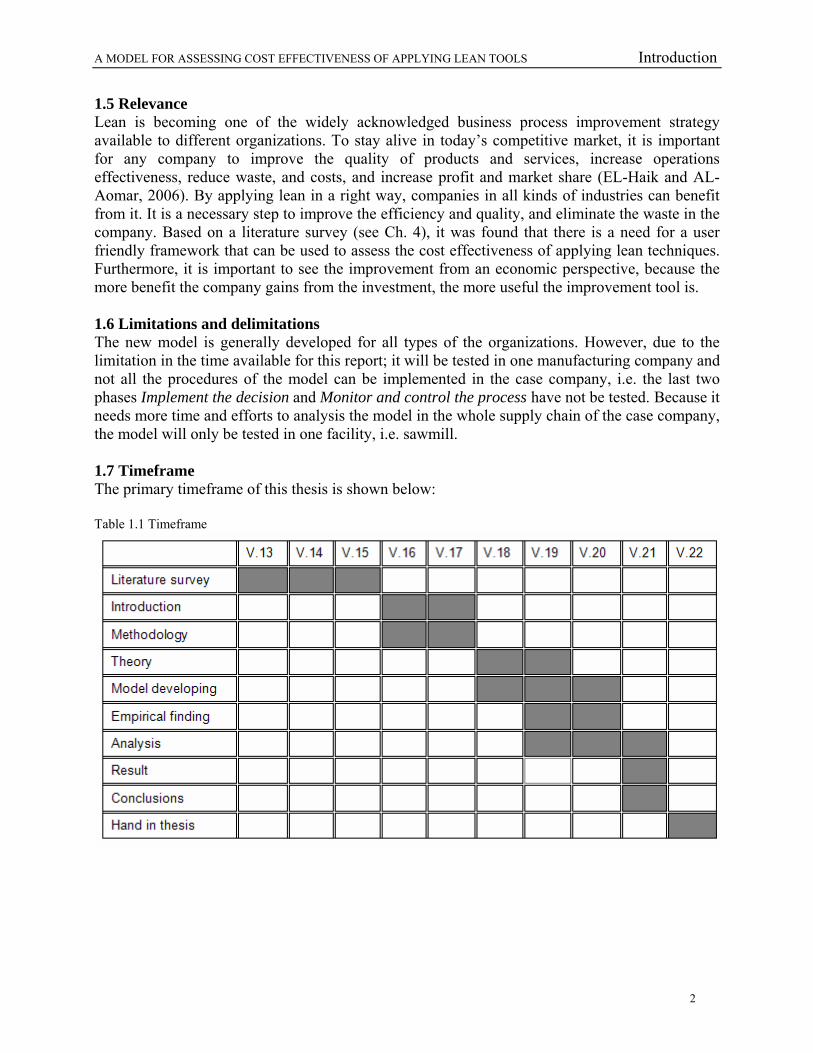
1.5 Relevance Lean is becoming one of the widely acknowledged business process improvement strategy available to different organizations. To stay alive in today’s competitive market, it is important for any company to improve the quality of products and services, increase operations effectiveness, reduce waste, and costs, and increase profit and market share (EL-Haik and AL-Aomar, 2006). By applying lean in a right way, companies in all kinds of industries can benefit from it. It is a necessary step to improve the efficiency and quality, and eliminate the waste in the company. Based on a literature survey (see Ch. 4), it was found that there is a need for a user friendly framework that can be used to assess the cost effectiveness of applying lean techniques. Furthermore, it is important to see the improvement from an economic perspective, because the more benefit the company gains from the investment, the more useful the improvement tool is. 1.6 Limitations and delimitations The new model is generally developed for all types of the organizations. However, due to the limitation in the time available for this report; it will be tested in one manufacturing company and not all the procedures of the model can be implemented in the case company, i.e. the last two phases Implement the decision and Monitor and control the process have not be tested. Because it needs more time and efforts to analysis the model in the whole supply chain of the case company, the model will only be tested in one facility, i.e. sawmill. 1.7 Timeframe The primary timeframe of this thesis is shown below: Table 1.1 Timeframe
A MODEL FOR ASSESSING COST EFFECTIVENESS OF APPLYING LEAN TOOLS Methodology
3
2. Methodology
In this chapter a description of how to select and design the research methodology is presented, as well as the methodology used one for this thesis is also presented at the end of this chapter. 2.1 Scientific perspective There are different scientific perspectives to identify the truth and explain the conclusion from the given or collected knowledge. The main scientific perspectives are the positivism and the hermeneutics. The positivism perspective was developed during the 19th century by an Auguste Comte, who believed that science are going through three stages, with observation as a final stage, bringing natural science into social science. According to Winberg (1997), “The positivist approach is one which states that only observable and measurable data should be taken into account in research. It is an approach which was developed in the natural sciences and which has been transferred to social studies.” Traditional social science research, with random samples, operationally defined variables, and statistical analysis, is positivist. Positivists attempt to use only data provided by direct observation to reach “positive” facts A scientist shall always search to find what really “is” i.e. to find the truth, investigate all conditions, reveal all mysteries, go deep into the unknown and explain all things that happen (ibid). The hermeneutics was developed in 16th to 17th century as a method to make interpretations of the text in the bible. Within this development, the main procedure constituting the method, the procedure of categorizing the meanings of texts, has been examined in terms of the logic entailed. The hermeneutic is seen as a complement to the positivism and is mostly used in the areas of psychology and the research of health care (Gadamer, 1992). 2.2 Research approach There are different types of research approach that the scientist can work with for relating theory and empirical findings; induction, deduction and abduction (Rothchild, 2003). The induction approach is the formation of a generalization derived from examination of a set of facts; it means the objective of the investigation can be done without using any existing theories. The theory is formulated based on the collected information, and observation (ibid). The deduction approach means that a scientist is providing a method to draw a logical conclusion through the use of logical connections, facts and existing theories. This approach starts with existing theories and then formulates hypothesis that will be examined (Bryman, 1989). Combining the induction and deduction approaches implies the third approach abduction. The first stage of this approach is to inductively formulate hypothetical patterns that can explicate the case. The next deductive stage is testing this hypothesis or theory on new cases (Rothchild, 2003)
A MODEL FOR ASSESSING COST EFFECTIVENESS OF APPLYING LEAN TOOLS Methodology
4
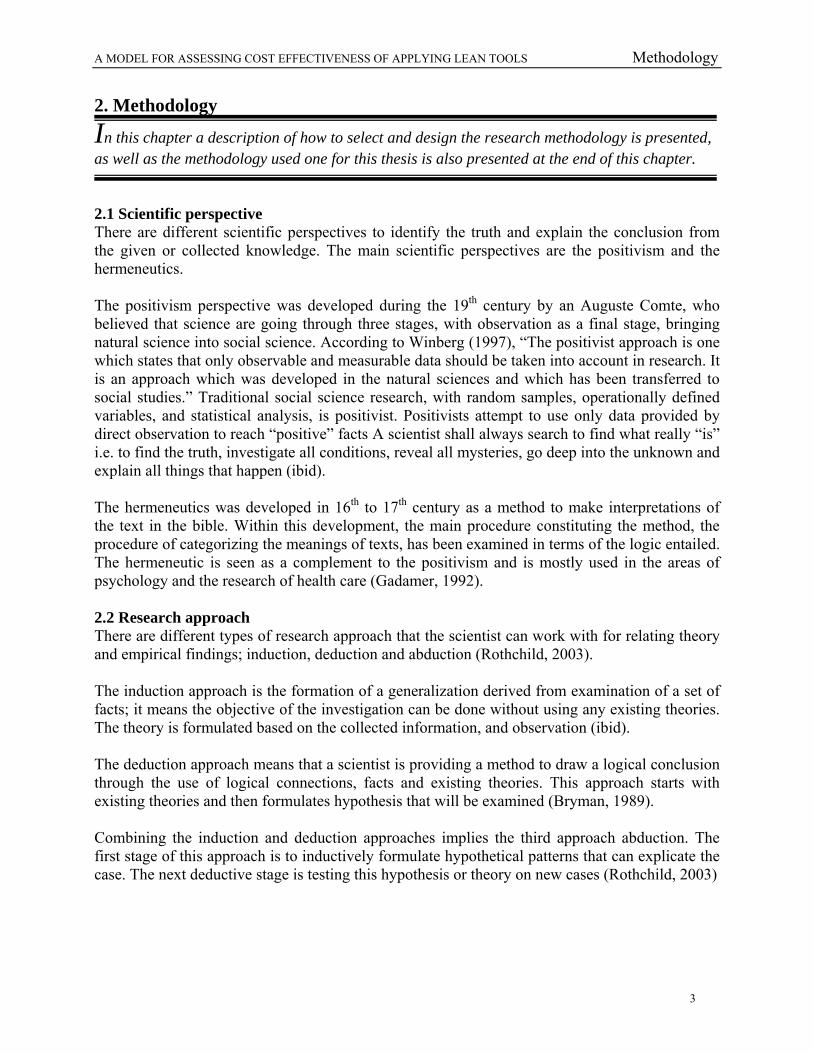
2.3 Data collection Collecting data is the process of defining different characteristics among objects. For conducting a scientific study, a set of tools and methods are needed to collect the data (Yin, 2002), as illustrated in Figure 2.1. In order to come up with these data, there are two main methods: quantitative and qualitative. The information gathered using qualitative method cannot be measured, but it is possible to explain in words and actions, while the information gathered using quantitative method can be decided with probability limits and is more reliable than qualitative data. To gather information in a quantitative way, observations or surveys has to be made in a systematic, structured, standardized and formalized way (Bryman, 1989).
Figure 2.1Methods for data collection (Yin, 2002) 2.4 Results evaluation The quality of the research results is judged according to a set of logical tests such as validity and reliability (Healy and Perry, 2000). Validity determines whether the research truly measures which was intended to measurer, reliability refers to the consistency of a measure (Bryman, 1989). 2.4.1 Validity Validity is considered as a very important factor in assessing the quality of measurements. It is defined as the extent to which the results are true or correct and represent reality. In the analytical approach, the validity of measurement can be divided into the following types, cited by (Alsyouf, 2004):
a. Construct validity: it is concerned with establishing correct operational measures for the concepts being studied; for instance, the names given to the measures are accurate. This requires that the instrument must then be administrated in a standardized manner according to prescribed procedures. b. Internal validity: for explanatory or causal studies, it aims at ensuring that a certain observable event (input variable) was responsible for or influenced a change in behavior (output). Internal validity could be concerned with the logical relationship between the study and the actual area being studied (Arboner and Bejerke, 1997). c. External validity: the possibility of generalizing the results beyond the actual area being studied. d. Face validity: it is an assessment of the degree of acceptance of the results.
FACT
Archival Records
Document
Observations (Direct and Participant) Structured
Interviews and Surveys
Focus Interviews
Open-ended Interviews
A MODEL FOR ASSESSING COST EFFECTIVENESS OF APPLYING LEAN TOOLS Methodology
5
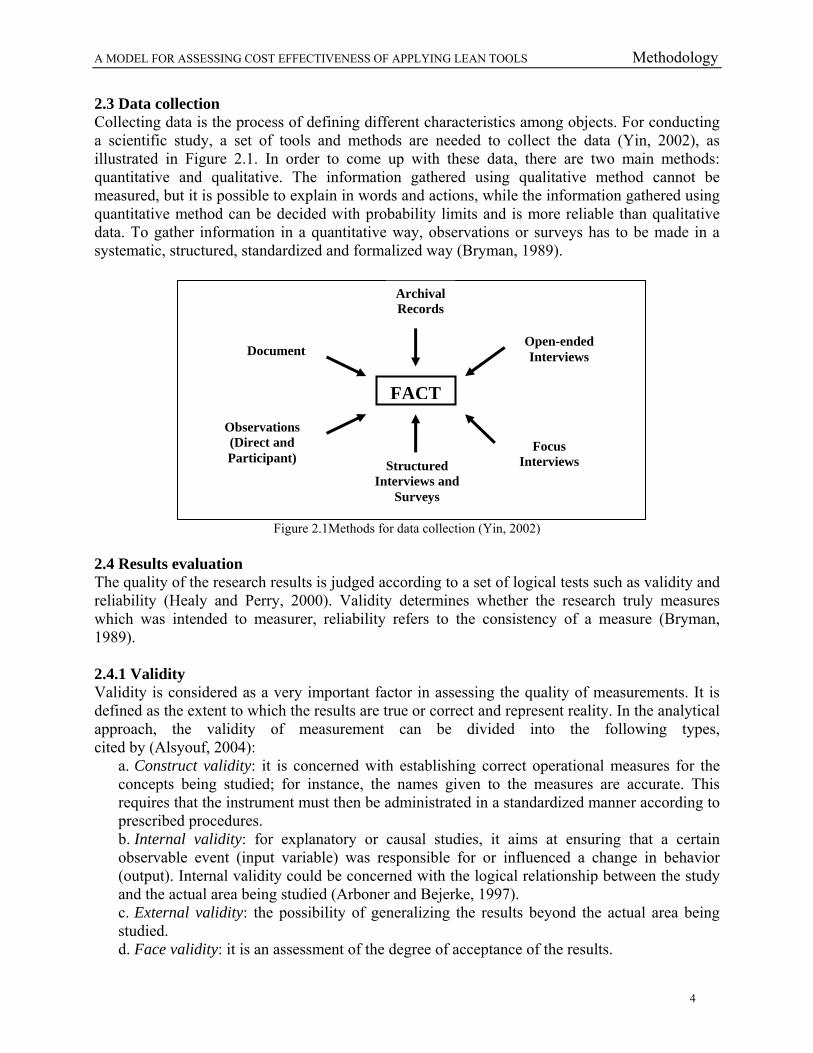
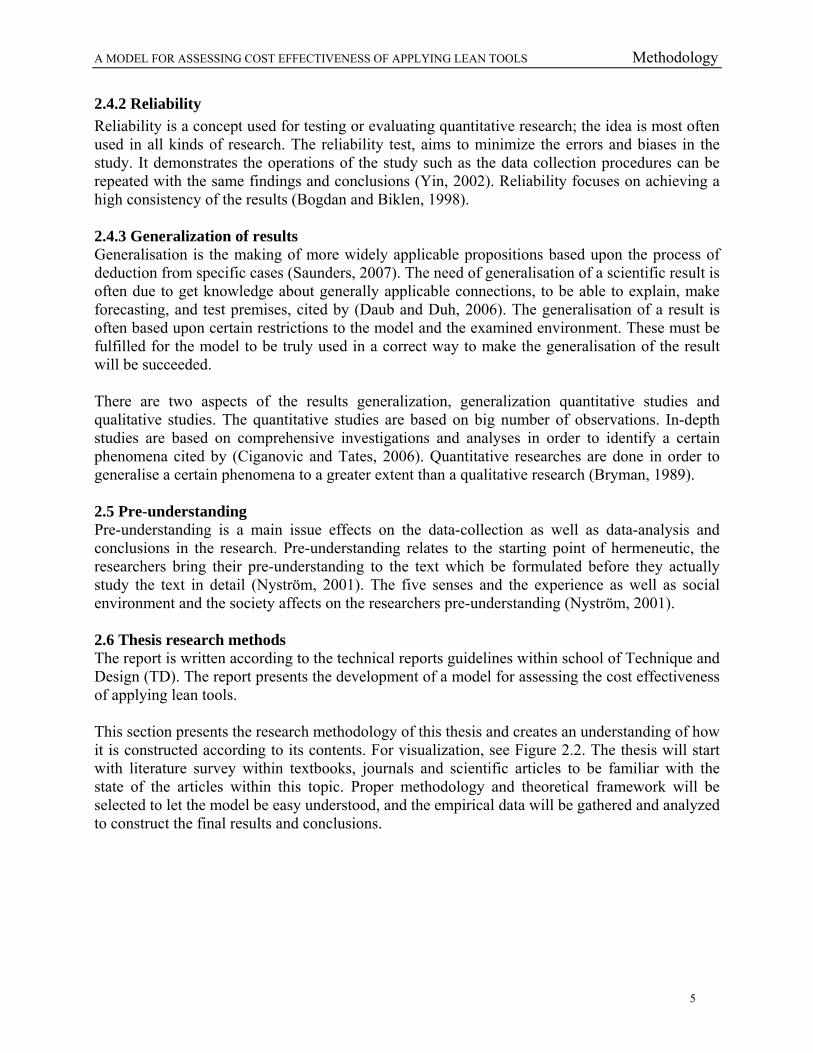
2.4.2 Reliability Reliability is a concept used for testing or evaluating quantitative research; the idea is most often used in all kinds of research. The reliability test, aims to minimize the errors and biases in the study. It demonstrates the operations of the study such as the data collection procedures can be repeated with the same findings and conclusions (Yin, 2002). Reliability focuses on achieving a high consistency of the results (Bogdan and Biklen, 1998). 2.4.3 Generalization of results Generalisation is the making of more widely applicable propositions based upon the process of deduction from specific cases (Saunders, 2007). The need of generalisation of a scientific result is often due to get knowledge about generally applicable connections, to be able to explain, make forecasting, and test premises, cited by (Daub and Duh, 2006). The generalisation of a result is often based upon certain restrictions to the model and the examined environment. These must be fulfilled for the model to be truly used in a correct way to make the generalisation of the result will be succeeded. There are two aspects of the results generalization, generalization quantitative studies and qualitative studies. The quantitative studies are based on big number of observations. In-depth studies are based on comprehensive investigations and analyses in order to identify a certain phenomena cited by (Ciganovic and Tates, 2006). Quantitative researches are done in order to generalise a certain phenomena to a greater extent than a qualitative research (Bryman, 1989). 2.5 Pre-understanding Pre-understanding is a main issue effects on the data-collection as well as data-analysis and conclusions in the research. Pre-understanding relates to the starting point of hermeneutic, the researchers bring their pre-understanding to the text which be formulated before they actually study the text in detail (Nyström, 2001). The five senses and the experience as well as social environment and the society affects on the researchers pre-understanding (Nyström, 2001). 2.6 Thesis research methods The report is written according to the technical reports guidelines within school of Technique and Design (TD). The report presents the development of a model for assessing the cost effectiveness of applying lean tools. This section presents the research methodology of this thesis and creates an understanding of how it is constructed according to its contents. For visualization, see Figure 2.2. The thesis will start with literature survey within textbooks, journals and scientific articles to be familiar with the state of the articles within this topic. Proper methodology and theoretical framework will be selected to let the model be easy understood, and the empirical data will be gathered and analyzed to construct the final results and conclusions.
A MODEL FOR ASSESSING COST EFFECTIVENESS OF APPLYING LEAN TOOLS Methodology
6
Figure 2.2 Thesis flow structure
The scientific perspectives will be used in this report are both positivistic and hermeneutic perspectives. Positivistic perspective will go deep into the work, describe and explain all things that happen in the current case company, while hermeneutic perspective will be used when developing the model. Because this report is only focusing on testing and evaluating the model in one case company, the research approach is a qualitative case study. In this report the abduction research approach will be used, by combing the deduction and induction approaches. The deduction approach will be used for literature survey and model construction, and induction will be used for evaluating the model in the case study including identifying and analyzing the problems, suggesting proper solutions, and evaluating different solutions. Both quantitative and qualitative data collection will be used in the empirical findings and analysis using archival records and documents reviews, interviews, observations, and questionnaire. Literature survey, scientific journals and articles will be used to generate the model. The quality of this repot will be judged according to validity and reliability tests. To increase data reliability, most of the terms will be discussed, explained and agreed upon by the company personnel involved in the case study. The authors’ pre-understanding of this thesis is based on personal experience while studying in Automobile Supporting Engineering and Industrial Engineering programs for four years. As well as the authors are following the continuous improvement concept (PDCA) to develop their understandings to the different perspectives in the report. They start with the plan to solve the problem that is formulated by studying relative books and scientific articles, following with making logical conclusion and discussion using their main five senses. After the application of the plan, they keep rechecking their understanding.

A MODEL FOR ASSESSING COST EFFECTIVENESS OF APPLYING LEAN TOOLS Theory
7
3. Theory
This chapter reviews the literature, which has been used in the thesis. The presented theories and philosophies have served as a foundation for the development of conclusion and recommendation, which have been the result of the thesis. 3.1 Lean production The lean concept, as in lean manufacturing, lean production, etc. is one of the more widespread and successful attempts. Briefly, lean is about controlling the resources in accordance with the customers’ needs and to reduce unnecessary waste (including the waste of time). The concept was introduced at a larger scale by Toyota in the 1950s, but not labeled lean manufacturing until the now famous book about the automobile appeared in 1990 (Womack, 1990). Lean thinking as a management philosophy is focusing on reduction of what is seen as wastes in an organization. The Japanese word muda means “waste” and according to Womack and Jones (2003), it specifically means any human activity which absorbs resources but creates no value: production of items no one wants so that inventories and remaining goods pile up; movement of employees and transport of goods from one place to another with no purpose; groups of people in a downstream activity standing around waiting due to an upstream activity has not delivered on time; and goods and services which do not meet the needs of the customer. Further Womack and Jones mean that in short, lean thinking is lean because it provides a way to do more with less: less human effort, less equipment, less time, and less space. Within lean thinking there is the term lean production, which is further divided into four areas by Womack and Jones (2003): lean product development, lean manufacturing, lean suppliers, and lean customer relation. Lean manufacturing, pioneered by Toyota, involves inventory and quality control, industrial relations, labor management, and supplier-manufacturer. According to Billet (2006), it is a way of looking at any process to get rid of anything that is not value-adding and making processes flow, as opposed to making a batch and then it waits. Lean manufacturing is not just a set of techniques and principles but also a new viewpoint of production. It takes a long time to change the people’s way of thinking, because the working culture should be changed. As a production theory, lean manufacturing is supposed to accomplish three common actions: 1. Design of the production system as a level of managerial action. 2. Control of the production system in order to achieve the desired goals. 3. Leadership of the improvement of production system. 3.2 Lean methodologies and tools Lean principles are fundamentally customer value driven, which makes them appropriate for many manufacturing and distribution situations. In McCurry and McIvor (2001), five basic principles of lean manufacturing are generally acknowledged: (1) Understanding customer value. Only what the customers perceive as value is important.

A MODEL FOR ASSESSING COST EFFECTIVENESS OF APPLYING LEAN TOOLS Theory
8
(2) Value stream analysis. Having understood the value for the customers, the next step is to
analyze the business processes to determine which ones actually add value. If an action does not add value, it should be modified or eliminated from the process.
(3) Flow. Focus on organizing a continuous flow through the production or supply chain rather
than moving commodities in large batches. (4) Pull. Demand chain management prevents producing commodities to stock, i.e. customer
demand pulls finished products through the system. No work is carried out unless the result of it is required downstream.
(5) Perfection. The elimination of non-value-adding elements (waste) is a process of continuous
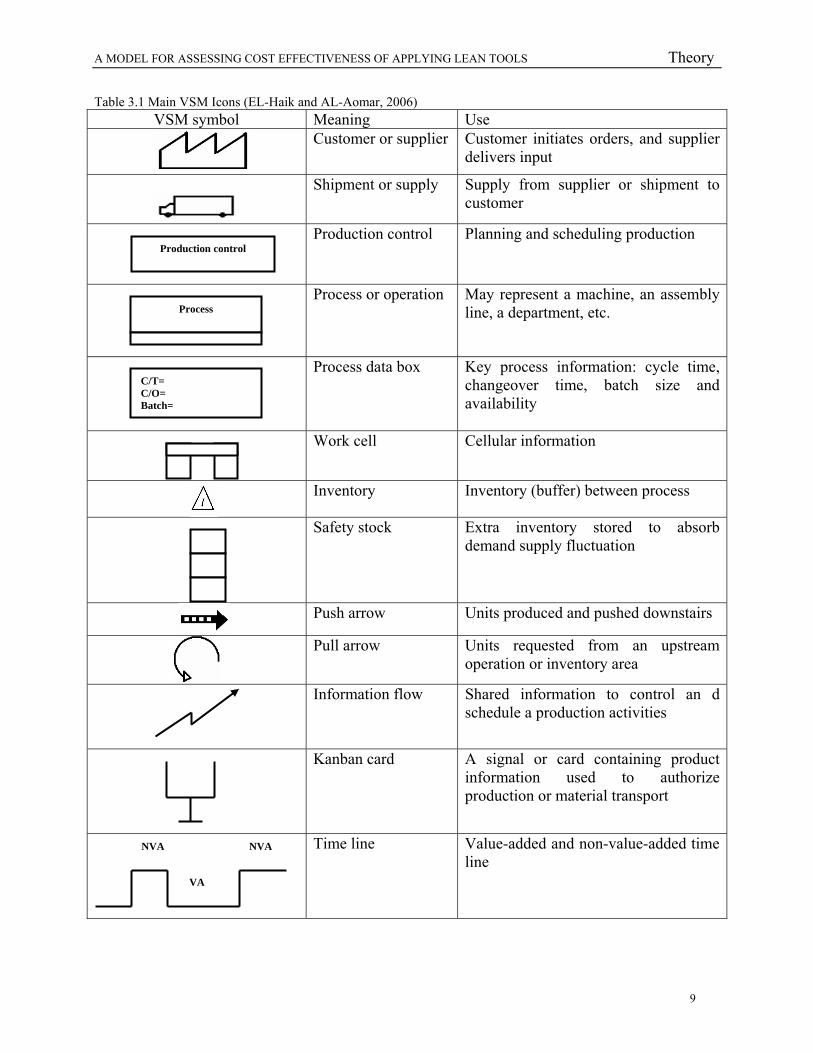
improvement. “There is no end to reducing time, cost, space, mistakes, and effort”. The main elements contributing to the elimination of non-value-adding activities are the following: excess processing, excess production, delays, transport, inventory, defects and movement. A variety of approaches are available for reducing or eliminating waste. These approaches include total productive maintenance, value stream analysis, Kaizen costing and cost analysis, document management, engineering and change management. 3.2.1 Value stream mapping Lean manufacturing is focused mainly on value stream mapping (VSM); VSM is a critical initial step for developing lean systems. Lean can be viewed as VSM integration of a process value chain, where VSM is utilized as a communication tool and as a business-planning tool to manage the change toward a lean environment. VSM focuses on value in the context of what the customer is willing to pay for or what makes the product gain customer satisfaction (EL-Haik and AL-Aomar, 2006). VSM is a tool that is used to graphically represent the processes or activities involved in the manufacturing and delivery of a product. These activities can be divided into value added and non value added. Key process information and data and key performance measures are then added to the VSM to characterize various stages in the product flow and to quantify current state performance. Process data include primarily cycle time (CT), capacity, and availability. The distance traveled, the storage and buffer size, and the time delays characterize storage and transfer activities. VSM includes a representation of the information flow among various flow stages (EL-Haik and AL-Aomar, 2006). The primary goal of VSM is to estimate the lead-time associated with a certain product flow throughout a system. Table 3.1 shows the commonly used VSM icons, together with their meaning and use.
A MODEL FOR ASSESSING COST EFFECTIVENESS OF APPLYING LEAN TOOLS Theory
9
Table 3.1 Main VSM Icons (EL-Haik and AL-Aomar, 2006) VSM symbol Meaning Use
Customer or supplier Customer initiates orders, and supplier delivers input
Shipment or supply Supply from supplier or shipment to customer
Production control Planning and scheduling production
Process or operation May represent a machine, an assembly line, a department, etc.
Process data box Key process information: cycle time, changeover time, batch size and availability
Work cell Cellular information
Inventory Inventory (buffer) between process
Safety stock Extra inventory stored to absorb demand supply fluctuation
Push arrow Units produced and pushed downstairs
Pull arrow Units requested from an upstream operation or inventory area
Information flow Shared information to control an d schedule a production activities
Kanban card A signal or card containing product information used to authorize production or material transport
Time line Value-added and non-value-added time line
Production control
Process
VA
NVA NVA
C/T= C/O= Batch=
A MODEL FOR ASSESSING COST EFFECTIVENESS OF APPLYING LEAN TOOLS Theory
10
3.2.2 5S According to George (2003), the name 5S derive from the first letter in the five Japanese words; “Seiri, Seiton, Seison, Seiketsu and Shitsuke”. The Japanese words have the following translation in English: Sort: Organize, separating the needed from the unneeded. Straighten: Arrange and identify for ease of use. Shine: Clean and look for ways to keep it clean. Standardize: Maintain and monitor the first 3 S’s. Sustain: Discipline, stick to the rules and maintain motivation. 3.2.3 Total productive maintenance Total productive maintenance (TPM) is a management approach to maintenance that focuses on involving all employees in an organization in equipment improvement (Duffuaa, 1999). It consists of a range of methods, which are known from maintenance management experience to be effective in improving reliability, quality, and production. It requires the operators to take over some of the maintenance staff tasks (Nakajima, 1988). According to Duffuaa (1999), TPM was defined by the Japanese Institute of Plant Engineer in 1971 as having five key goals:
• Maximize overall equipment effectiveness (OEE), which includes time availability, performance efficiency and good quality rate.
• Take a systematic approach to reliability, maintainability, and life cycle cost. • Involve operations, materials management, maintenance, engineering, and administration
in equipment management. • Involve all levels of management and workers. • Improve equipment performance through small group activities and team performance.
In TPM, the performance loss is recorded and monitored. The losses can be divided into six categories: setup and adjustments, breakdowns, idling and minor stoppages, reduced speed, defects, and yield losses. Setups and breakdowns cause downtime and impact availability, reduced speed impacts the cycle time, and defects and yield losses impact quality. OEE, defined as the product of availability, cycle time, and quality rate, is the key TPM performance measure (Duffuaa, 1999). 3.2.4 Overall Equipment Effectiveness Overall equipment effectiveness (OEE) is a measure of how well equipment or lines are utilized in relation to their full potential; it is defined as a product of three individual factors, Availability, Performance efficiency and Quality rate. The main objective to measure OEE and its individual factors will give the plant numbers to see where the equipment is loosing time (Nakajima, 1988). OEE is the overall index to measure the operating efficiency by the time loss structure for the processing type equipment, and it is obtained by multiplying time availability, performance efficiency and good quality rate (Duffuaa, 1999). This index indicates whether the present equipment contributes to the added value or not under the total consideration of the condition of present equipment in view of the time and speed, and what the condition of good quality rate is (Nakajima, 1988).
A MODEL FOR ASSESSING COST EFFECTIVENESS OF APPLYING LEAN TOOLS Theory
11
OEE is given as follows :( Nakajima, 1988)
rateQualityefficiencyePerformanctyAvailabiliOEE ××=…………………………………... (1)
Where
time LoadingDowntime -time LoadingtyAvailabili = ……………………………………………………….. (2)
Loading time is the available time minus planned downtime. Planned downtime refers to the downtime officially scheduled in the production plan, such as scheduled maintenance and management activities.
timeOperatingprocessedAmounttimecyclelTheoreticaeffeciencyePerformanc
×
= ………………………. (3)
The theoretical CT is selected among the following three criteria; according to the given equipment condition:
a. The CT designated on the design specification; b. The theoretical CT on an ideal condition; and c. The shortest CT hitherto.
processedAmountmountaDefectiveprocessedAmountrateQuality
−
= ……………………………………… (4)
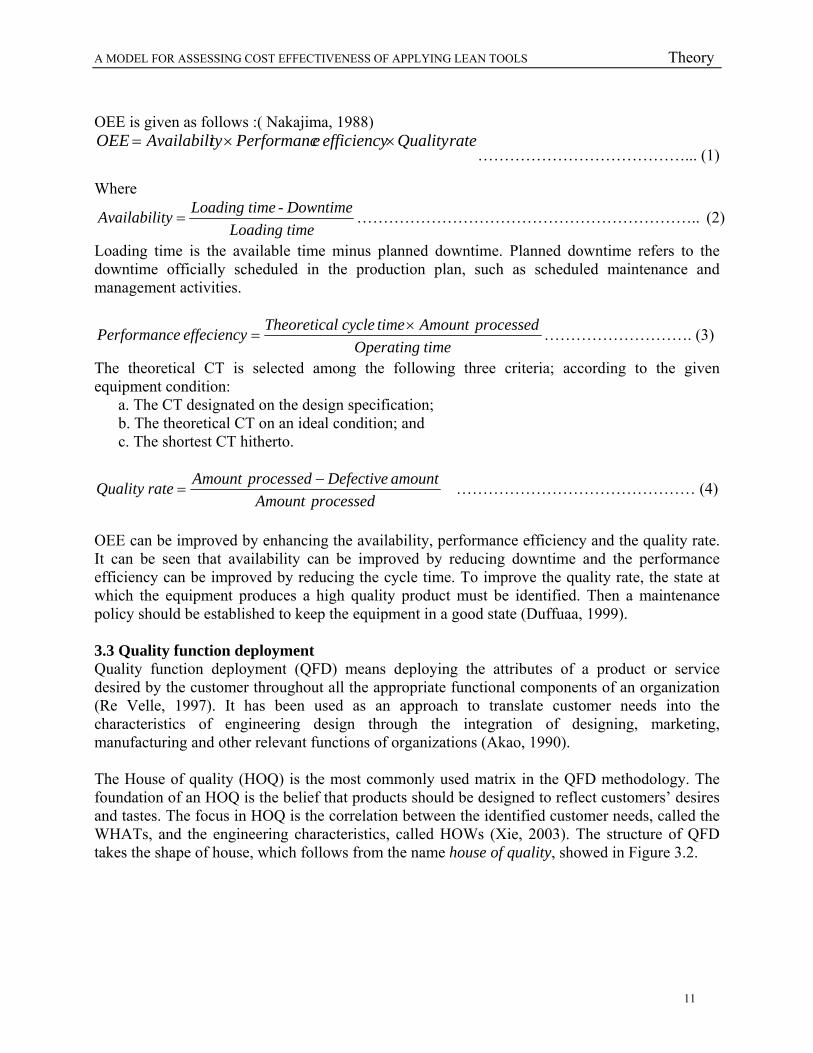
OEE can be improved by enhancing the availability, performance efficiency and the quality rate. It can be seen that availability can be improved by reducing downtime and the performance efficiency can be improved by reducing the cycle time. To improve the quality rate, the state at which the equipment produces a high quality product must be identified. Then a maintenance policy should be established to keep the equipment in a good state (Duffuaa, 1999). 3.3 Quality function deployment Quality function deployment (QFD) means deploying the attributes of a product or service desired by the customer throughout all the appropriate functional components of an organization (Re Velle, 1997). It has been used as an approach to translate customer needs into the characteristics of engineering design through the integration of designing, marketing, manufacturing and other relevant functions of organizations (Akao, 1990). The House of quality (HOQ) is the most commonly used matrix in the QFD methodology. The foundation of an HOQ is the belief that products should be designed to reflect customers’ desires and tastes. The focus in HOQ is the correlation between the identified customer needs, called the WHATs, and the engineering characteristics, called HOWs (Xie, 2003). The structure of QFD takes the shape of house, which follows from the name house of quality, showed in Figure 3.2.
A MODEL FOR ASSESSING COST EFFECTIVENESS OF APPLYING LEAN TOOLS Theory
12
Figure 3.1 Elements in the House of Quality (Xie, 2003)
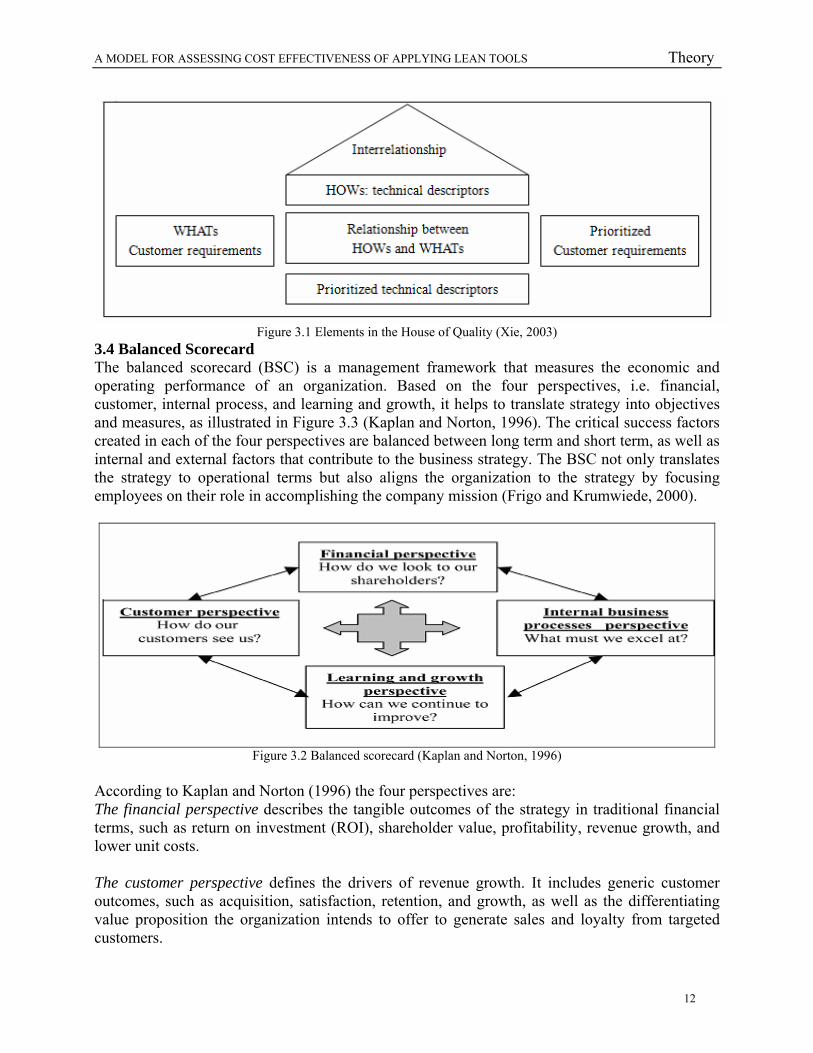
3.4 Balanced Scorecard The balanced scorecard (BSC) is a management framework that measures the economic and operating performance of an organization. Based on the four perspectives, i.e. financial, customer, internal process, and learning and growth, it helps to translate strategy into objectives and measures, as illustrated in Figure 3.3 (Kaplan and Norton, 1996). The critical success factors created in each of the four perspectives are balanced between long term and short term, as well as internal and external factors that contribute to the business strategy. The BSC not only translates the strategy to operational terms but also aligns the organization to the strategy by focusing employees on their role in accomplishing the company mission (Frigo and Krumwiede, 2000).
Figure 3.2 Balanced scorecard (Kaplan and Norton, 1996)
According to Kaplan and Norton (1996) the four perspectives are: The financial perspective describes the tangible outcomes of the strategy in traditional financial terms, such as return on investment (ROI), shareholder value, profitability, revenue growth, and lower unit costs. The customer perspective defines the drivers of revenue growth. It includes generic customer outcomes, such as acquisition, satisfaction, retention, and growth, as well as the differentiating value proposition the organization intends to offer to generate sales and loyalty from targeted customers.
A MODEL FOR ASSESSING COST EFFECTIVENESS OF APPLYING LEAN TOOLS Theory
13
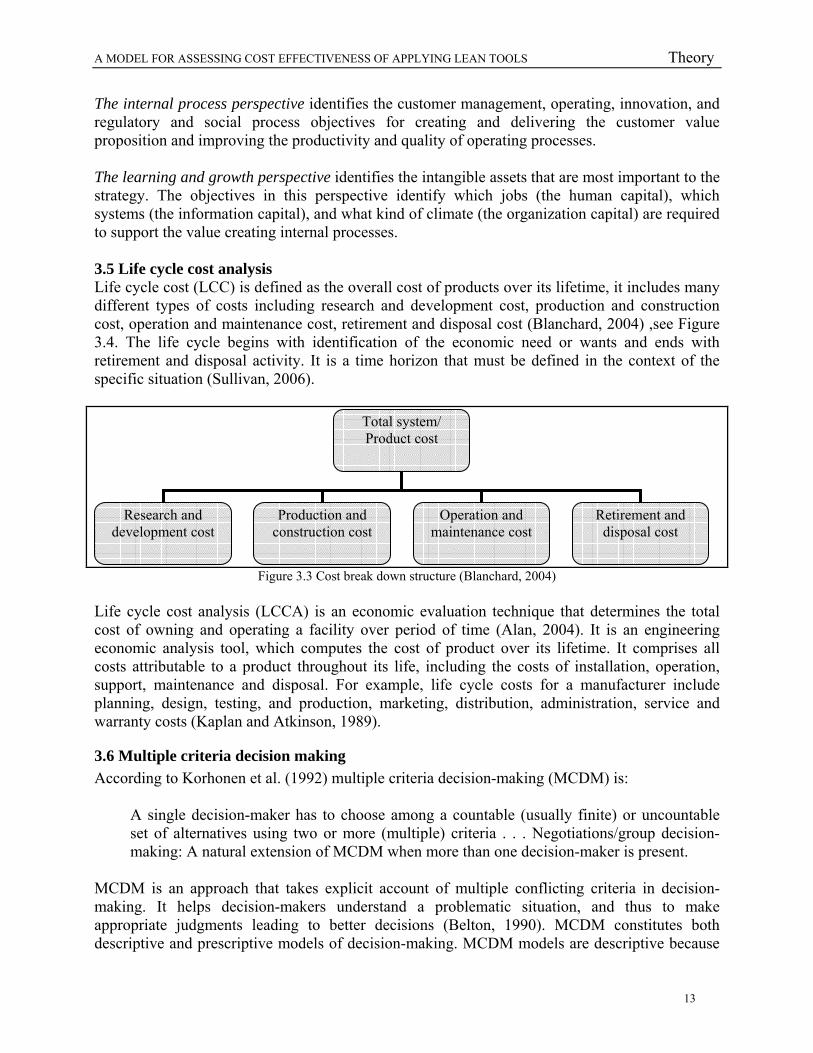
The internal process perspective identifies the customer management, operating, innovation, and regulatory and social process objectives for creating and delivering the customer value proposition and improving the productivity and quality of operating processes. The learning and growth perspective identifies the intangible assets that are most important to the strategy. The objectives in this perspective identify which jobs (the human capital), which systems (the information capital), and what kind of climate (the organization capital) are required to support the value creating internal processes. 3.5 Life cycle cost analysis Life cycle cost (LCC) is defined as the overall cost of products over its lifetime, it includes many different types of costs including research and development cost, production and construction cost, operation and maintenance cost, retirement and disposal cost (Blanchard, 2004) ,see Figure 3.4. The life cycle begins with identification of the economic need or wants and ends with retirement and disposal activity. It is a time horizon that must be defined in the context of the specific situation (Sullivan, 2006).
Figure 3.3 Cost break down structure (Blanchard, 2004)
Life cycle cost analysis (LCCA) is an economic evaluation technique that determines the total cost of owning and operating a facility over period of time (Alan, 2004). It is an engineering economic analysis tool, which computes the cost of product over its lifetime. It comprises all costs attributable to a product throughout its life, including the costs of installation, operation, support, maintenance and disposal. For example, life cycle costs for a manufacturer include planning, design, testing, and production, marketing, distribution, administration, service and warranty costs (Kaplan and Atkinson, 1989).
3.6 Multiple criteria decision making According to Korhonen et al. (1992) multiple criteria decision-making (MCDM) is:
A single decision-maker has to choose among a countable (usually finite) or uncountable set of alternatives using two or more (multiple) criteria . . . Negotiations/group decision-making: A natural extension of MCDM when more than one decision-maker is present.
MCDM is an approach that takes explicit account of multiple conflicting criteria in decision-making. It helps decision-makers understand a problematic situation, and thus to make appropriate judgments leading to better decisions (Belton, 1990). MCDM constitutes both descriptive and prescriptive models of decision-making. MCDM models are descriptive because
Total system/ Product cost
Research and development cost
Production and construction cost
Operation and maintenance cost
Retirement and disposal cost
A MODEL FOR ASSESSING COST EFFECTIVENESS OF APPLYING LEAN TOOLS Theory
14
they require information from decision makers to derive accurate models for a decision-making process. They remain prescriptive models within the constraints posed by the decision makers (Nazareth, 1993). According to Rossi and Freeman (1993), there is no single method of evaluation capable of dealing consequently with many programs of different content, planning or policies that concern development planning and the corresponding decision-making. In the last 40 years, multi-criteria methods of dealing with complex problems of decision-making have been developed, in which many alternatives, e.g., interventions, projects, proposals, scenarios, should be evaluated with respect to many quantitative and qualitative criteria (Keeney and Raiffa, 1976).
A MODEL FOR ASSESSING COST EFFECTIVENESS OF APPLYING LEAN TOOLS Model development
15
4. Model development
In this chapter the procedures to develop the model to assess the cost effectiveness of lean production, literature survey for relevant theories and evaluation of these theories are presented.
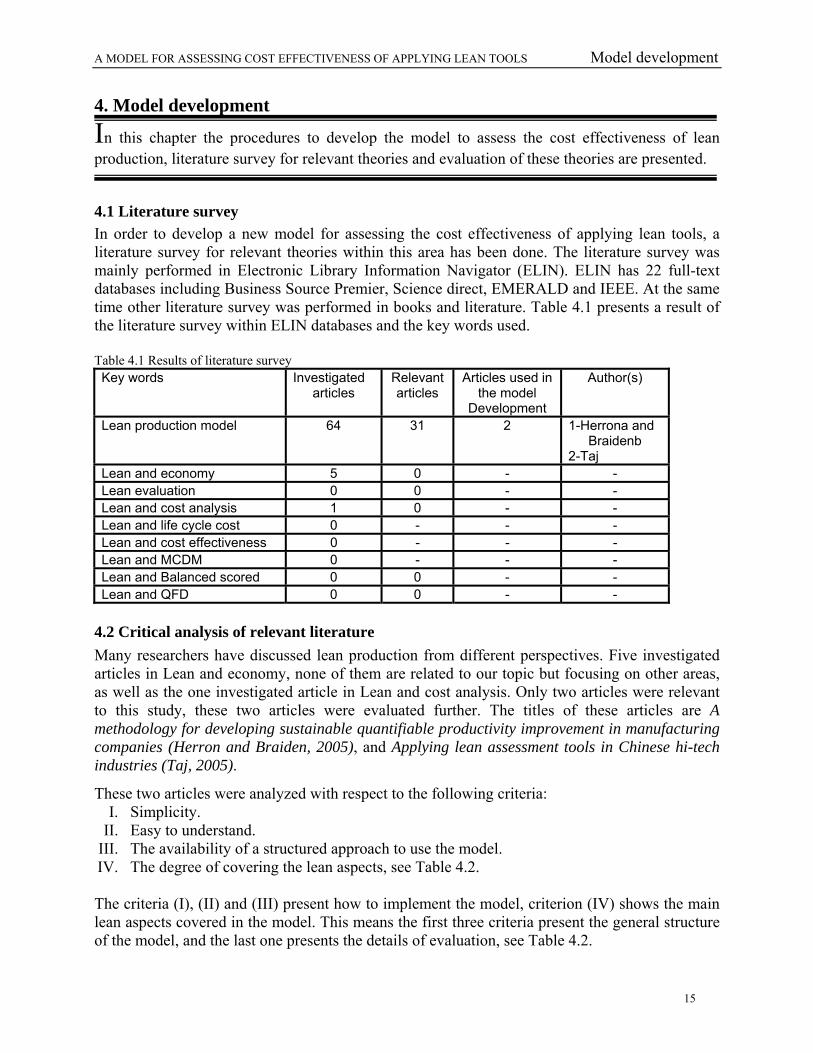
4.1 Literature survey In order to develop a new model for assessing the cost effectiveness of applying lean tools, a literature survey for relevant theories within this area has been done. The literature survey was mainly performed in Electronic Library Information Navigator (ELIN). ELIN has 22 full-text databases including Business Source Premier, Science direct, EMERALD and IEEE. At the same time other literature survey was performed in books and literature. Table 4.1 presents a result of the literature survey within ELIN databases and the key words used. Table 4.1 Results of literature survey Key words Investigated
articles Relevant articles
Articles used in the model
Development
Author(s)
Lean production model 64 31 2 1-Herrona and Braidenb
2-Taj Lean and economy 5 0 - - Lean evaluation 0 0 - - Lean and cost analysis 1 0 - - Lean and life cycle cost 0 - - - Lean and cost effectiveness 0 - - - Lean and MCDM 0 - - - Lean and Balanced scored 0 0 - - Lean and QFD 0 0 - -
4.2 Critical analysis of relevant literature Many researchers have discussed lean production from different perspectives. Five investigated articles in Lean and economy, none of them are related to our topic but focusing on other areas, as well as the one investigated article in Lean and cost analysis. Only two articles were relevant to this study, these two articles were evaluated further. The titles of these articles are A methodology for developing sustainable quantifiable productivity improvement in manufacturing companies (Herron and Braiden, 2005), and Applying lean assessment tools in Chinese hi-tech industries (Taj, 2005).
These two articles were analyzed with respect to the following criteria: I. Simplicity.
II. Easy to understand. III. The availability of a structured approach to use the model. IV. The degree of covering the lean aspects, see Table 4.2.
The criteria (Ι), (II) and (III) present how to implement the model, criterion (IV) shows the main lean aspects covered in the model. This means the first three criteria present the general structure of the model, and the last one presents the details of evaluation, see Table 4.2.

A MODEL FOR ASSESSING COST EFFECTIVENESS OF APPLYING LEAN TOOLS Model development
16
The Sign (√) is used to show whether the criteria are included in the models or not. Table 4.2 Evaluation of models with respect to lean perspectives
(Taj, 2005) model is a lean assessment tool used to assess the current state of the production plant within specific perspectives, it determines the gap between the current state and the target one, and identifies the opportunity for improvement. However, it did not suggest any certain lean tools to improve the current state. (Herron and Braiden, 2005) model evaluate the current state of the production plant within specific perspectives, it suggest certain lean tools to improve the current state. However, it did not consider the cost effectiveness evaluation for each technique, as well as the supplier perspective.
Authors Criteria Taj Herron and Braiden
I. Simplicity √ √
II. Easy to understand √ √
III. The availability of a structured approach to use the model
√ √
IV. The degree of covering the lean aspects
Waste elimination Inventory √ √ Waiting time Over production √ √ Transportation Processing √ √ Motion Defects √ √
Human resources Team approach √ √ Multi-functional workers Leadership Training √ Employee satisfaction
Lead time Machines set-up time √ Material handling time Processing time Work in progress (WIP) time
Maintenance √ √ Customer satisfaction
Suppliers √
A MODEL FOR ASSESSING COST EFFECTIVENESS OF APPLYING LEAN TOOLS Model development
17
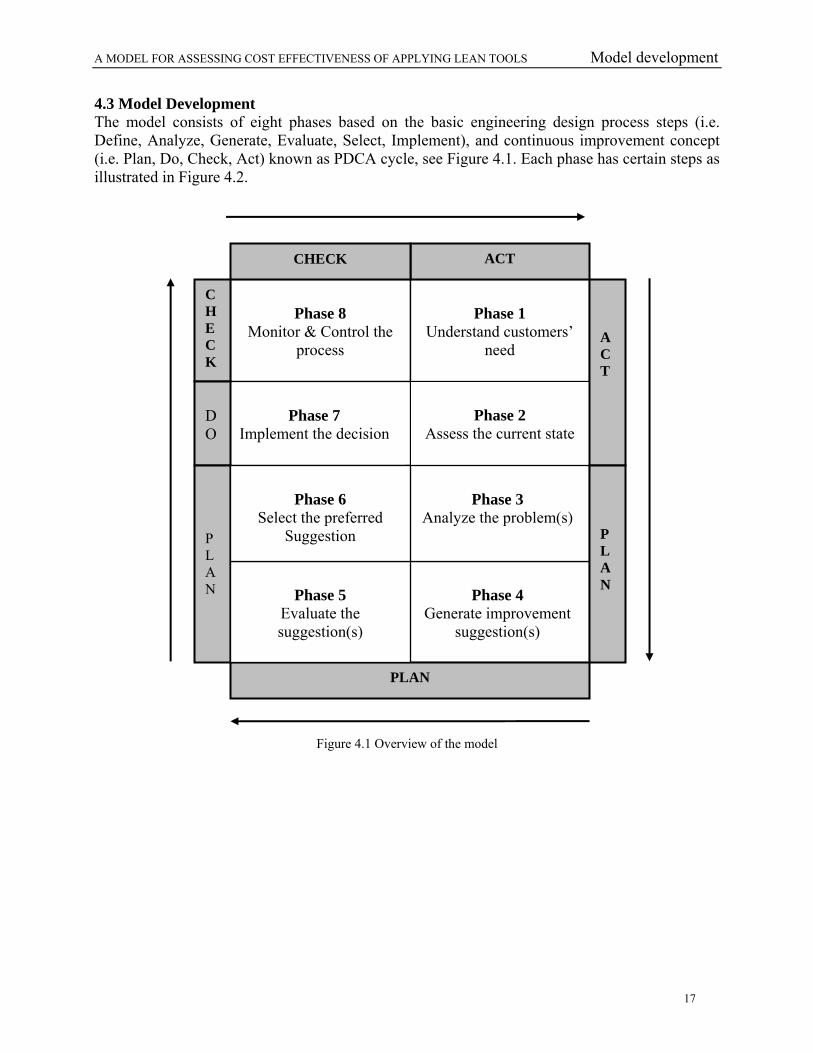
4.3 Model Development The model consists of eight phases based on the basic engineering design process steps (i.e. Define, Analyze, Generate, Evaluate, Select, Implement), and continuous improvement concept (i.e. Plan, Do, Check, Act) known as PDCA cycle, see Figure 4.1. Each phase has certain steps as illustrated in Figure 4.2.
Figure 4.1 Overview of the model
Phase 8
Monitor & Control the process
Phase 7
Implement the decision
Phase 4
Generate improvement suggestion(s)
Phase 1
Understand customers’ need
Phase 2
Assess the current state
Phase 3
Analyze the problem(s)
A C T
PLAN
ACT CHECK
C H E CK
D O
P L A N
Phase 5
Evaluate the suggestion(s)
Phase 6
Select the preferred Suggestion
P L A N
A MODEL FOR ASSESSING COST EFFECTIVENESS OF APPLYING LEAN TOOLS Model development
18
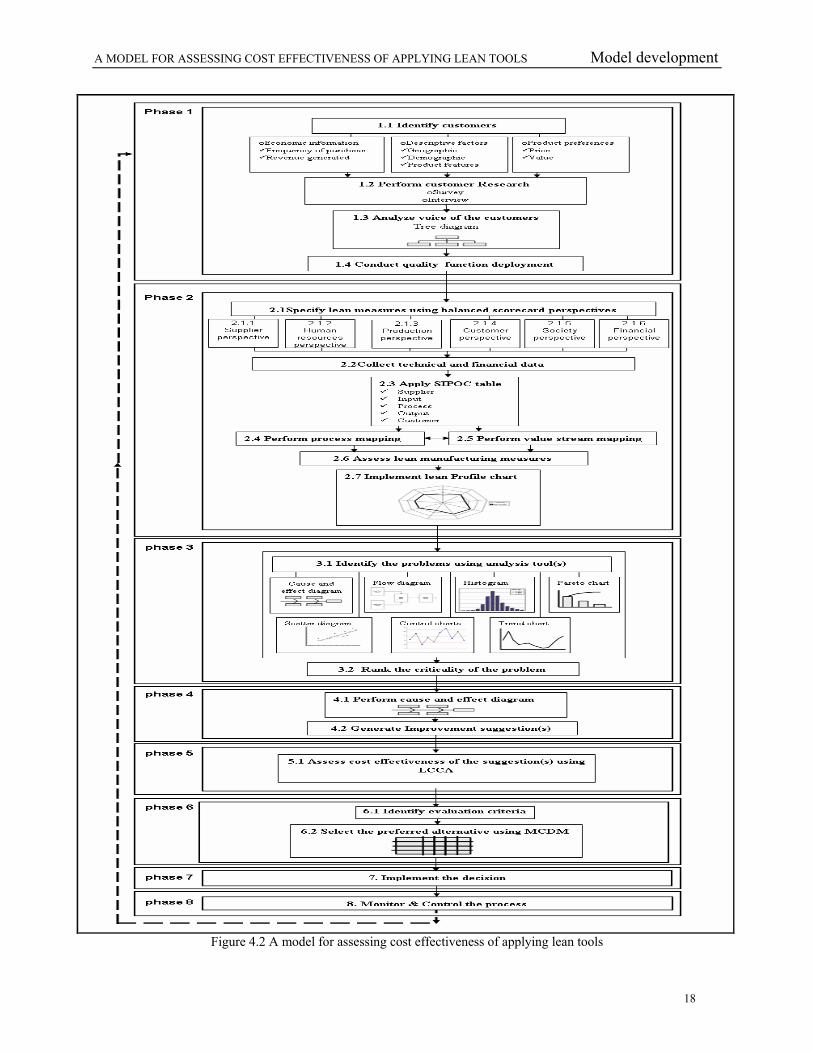
Figure 4.2 A model for assessing cost effectiveness of applying lean tools
A MODEL FOR ASSESSING COST EFFECTIVENESS OF APPLYING LEAN TOOLS Model development
19
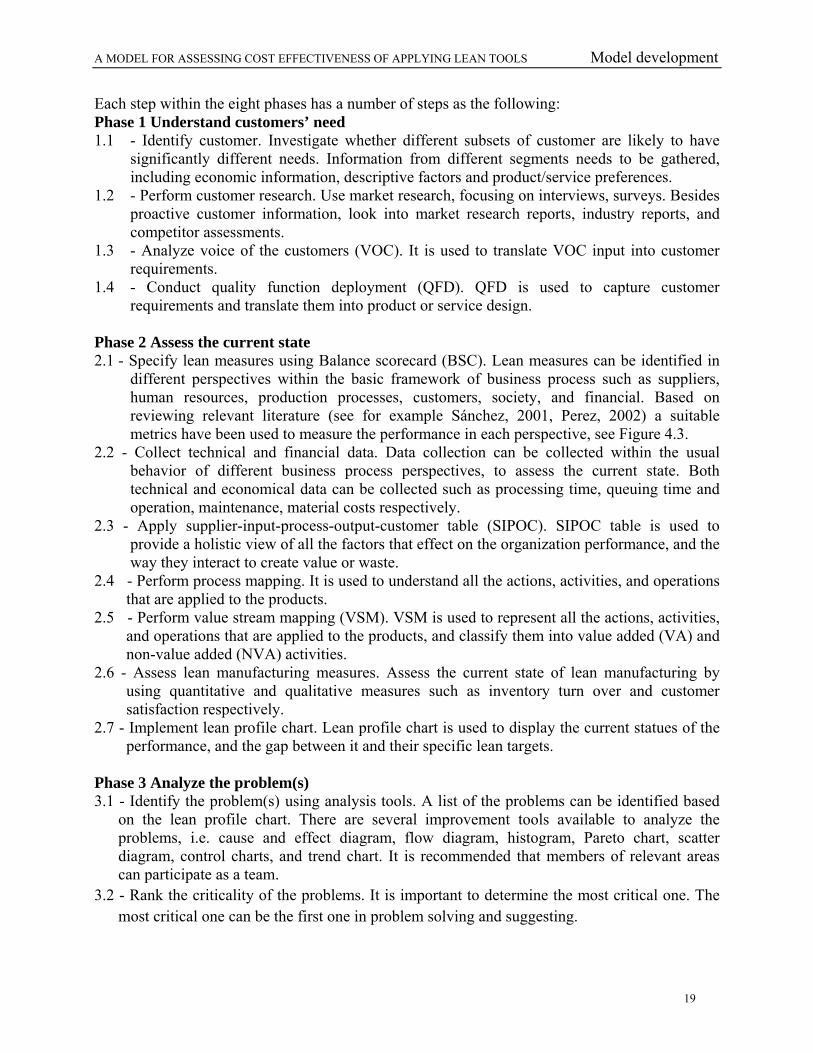
Each step within the eight phases has a number of steps as the following: Phase 1 Understand customers’ need 1.1 - Identify customer. Investigate whether different subsets of customer are likely to have
significantly different needs. Information from different segments needs to be gathered, including economic information, descriptive factors and product/service preferences.
1.2 - Perform customer research. Use market research, focusing on interviews, surveys. Besides proactive customer information, look into market research reports, industry reports, and competitor assessments.
1.3 - Analyze voice of the customers (VOC). It is used to translate VOC input into customer requirements.
1.4 - Conduct quality function deployment (QFD). QFD is used to capture customer requirements and translate them into product or service design.
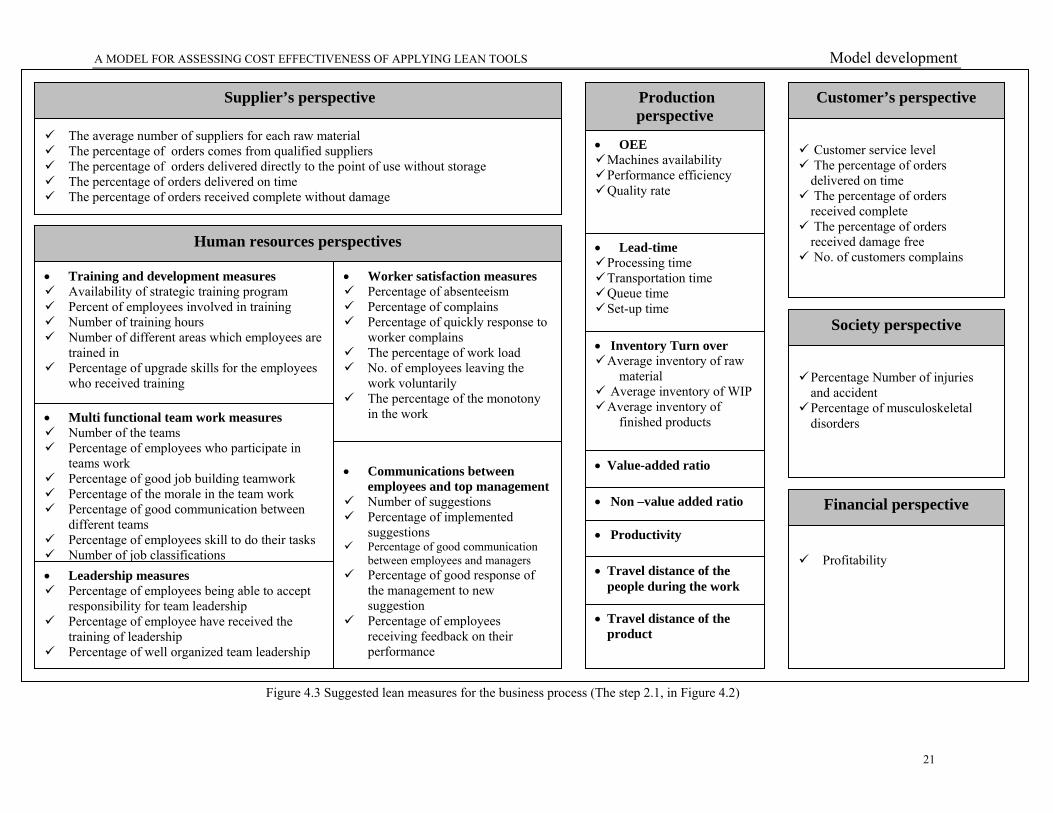
Phase 2 Assess the current state 2.1 - Specify lean measures using Balance scorecard (BSC). Lean measures can be identified in
different perspectives within the basic framework of business process such as suppliers, human resources, production processes, customers, society, and financial. Based on reviewing relevant literature (see for example Sánchez, 2001, Perez, 2002) a suitable metrics have been used to measure the performance in each perspective, see Figure 4.3.
2.2 - Collect technical and financial data. Data collection can be collected within the usual behavior of different business process perspectives, to assess the current state. Both technical and economical data can be collected such as processing time, queuing time and operation, maintenance, material costs respectively.
2.3 - Apply supplier-input-process-output-customer table (SIPOC). SIPOC table is used to provide a holistic view of all the factors that effect on the organization performance, and the way they interact to create value or waste.
2.4 - Perform process mapping. It is used to understand all the actions, activities, and operations that are applied to the products.
2.5 - Perform value stream mapping (VSM). VSM is used to represent all the actions, activities, and operations that are applied to the products, and classify them into value added (VA) and non-value added (NVA) activities.
2.6 - Assess lean manufacturing measures. Assess the current state of lean manufacturing by using quantitative and qualitative measures such as inventory turn over and customer satisfaction respectively.
2.7 - Implement lean profile chart. Lean profile chart is used to display the current statues of the performance, and the gap between it and their specific lean targets.
Phase 3 Analyze the problem(s) 3.1 - Identify the problem(s) using analysis tools. A list of the problems can be identified based
on the lean profile chart. There are several improvement tools available to analyze the problems, i.e. cause and effect diagram, flow diagram, histogram, Pareto chart, scatter diagram, control charts, and trend chart. It is recommended that members of relevant areas can participate as a team.
3.2 - Rank the criticality of the problems. It is important to determine the most critical one. The most critical one can be the first one in problem solving and suggesting.
A MODEL FOR ASSESSING COST EFFECTIVENESS OF APPLYING LEAN TOOLS Model development
20
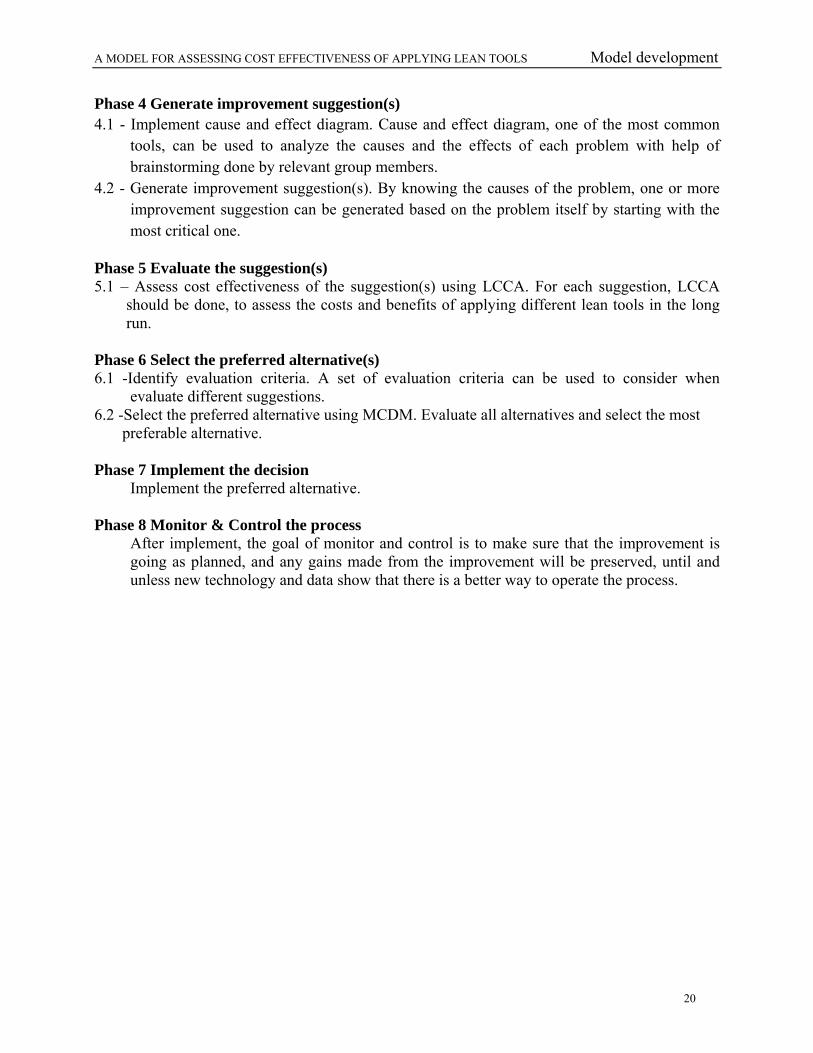
Phase 4 Generate improvement suggestion(s) 4.1 - Implement cause and effect diagram. Cause and effect diagram, one of the most common
tools, can be used to analyze the causes and the effects of each problem with help of brainstorming done by relevant group members.
4.2 - Generate improvement suggestion(s). By knowing the causes of the problem, one or more improvement suggestion can be generated based on the problem itself by starting with the most critical one.
Phase 5 Evaluate the suggestion(s) 5.1 – Assess cost effectiveness of the suggestion(s) using LCCA. For each suggestion, LCCA
should be done, to assess the costs and benefits of applying different lean tools in the long run.
Phase 6 Select the preferred alternative(s) 6.1 -Identify evaluation criteria. A set of evaluation criteria can be used to consider when
evaluate different suggestions. 6.2 -Select the preferred alternative using MCDM. Evaluate all alternatives and select the most preferable alternative.
Phase 7 Implement the decision
Implement the preferred alternative. Phase 8 Monitor & Control the process
After implement, the goal of monitor and control is to make sure that the improvement is going as planned, and any gains made from the improvement will be preserved, until and unless new technology and data show that there is a better way to operate the process.
A MODEL FOR ASSESSING COST EFFECTIVENESS OF APPLYING LEAN TOOLS Model development
21
Figure 4.3 Suggested lean measures for the business process (The step 2.1, in Figure 4.2)
Production perspective
The average number of suppliers for each raw material The percentage of orders comes from qualified suppliers The percentage of orders delivered directly to the point of use without storage The percentage of orders delivered on time The percentage of orders received complete without damage
Human resources perspectives
Percentage Number of injuries and accident Percentage of musculoskeletal disorders
Customer service level The percentage of orders delivered on time The percentage of orders received complete The percentage of orders received damage free No. of customers complains
Profitability
• Training and development measures Availability of strategic training program Percent of employees involved in training Number of training hours Number of different areas which employees are
trained in Percentage of upgrade skills for the employees
who received training
• Multi functional team work measures Number of the teams Percentage of employees who participate in
teams work Percentage of good job building teamwork Percentage of the morale in the team work Percentage of good communication between
different teams Percentage of employees skill to do their tasks Number of job classifications
• Worker satisfaction measures Percentage of absenteeism Percentage of complains Percentage of quickly response to
worker complains The percentage of work load No. of employees leaving the
work voluntarily The percentage of the monotony
in the work
• OEE Machines availability Performance efficiency Quality rate
• Lead-time Processing time Transportation time Queue time Set-up time
• Inventory Turn over Average inventory of raw
material Average inventory of WIP Average inventory of
finished products
• Value-added ratio
• Non –value added ratio
• Productivity
• Travel distance of the people during the work
• Travel distance of the product
Customer’s perspective
Society perspective
Financial perspective
Supplier’s perspective
• Leadership measures Percentage of employees being able to accept
responsibility for team leadership Percentage of employee have received the
training of leadership Percentage of well organized team leadership
• Communications between
employees and top management Number of suggestions Percentage of implemented
suggestions Percentage of good communication
between employees and managers Percentage of good response of
the management to new suggestion
Percentage of employees receiving feedback on their performance
A MODEL FOR ASSESSING COST EFFECTIVENESS OF APPLYING LEAN TOOLS Case study
22
5. Case study
In this chapter, a description of the case company, the production processes, and model
validation and analysis are presented.
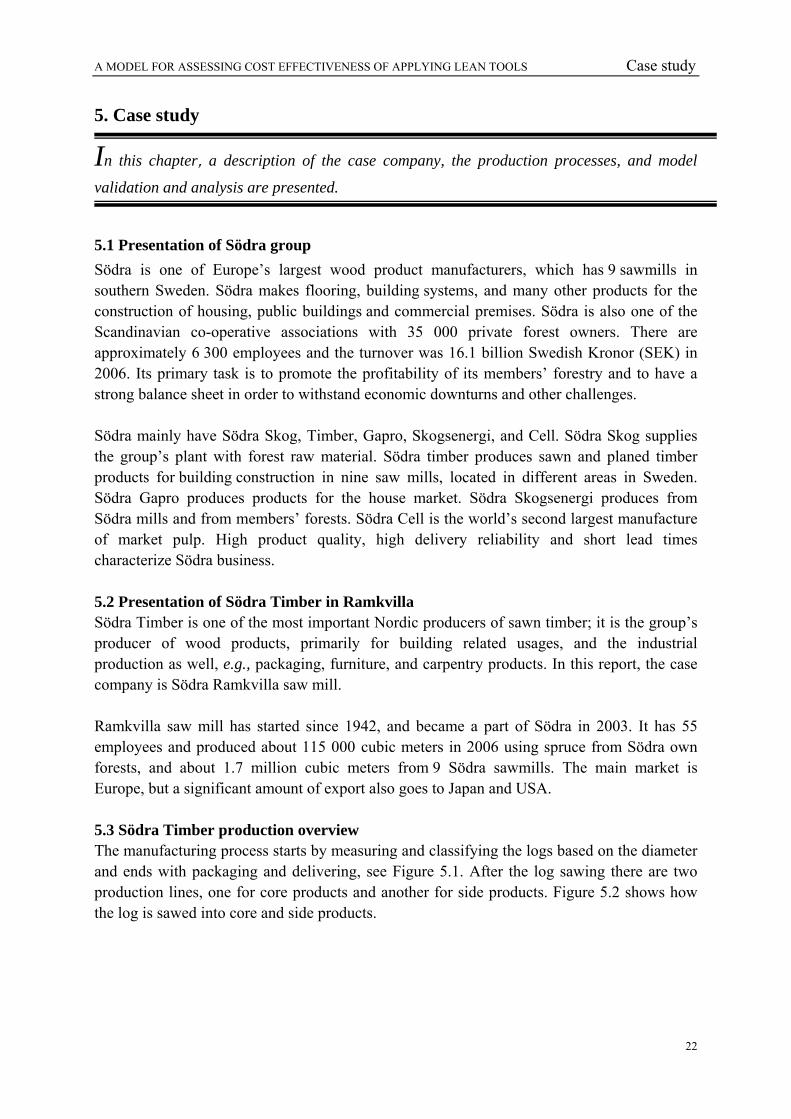
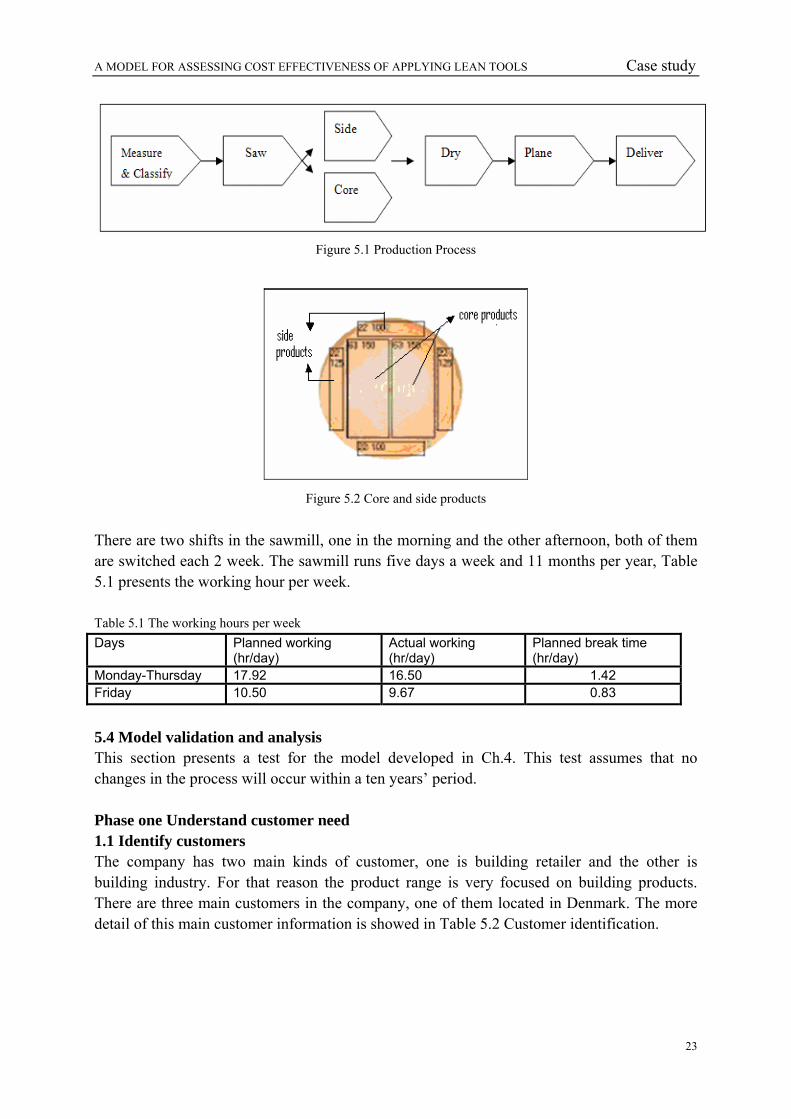
5.1 Presentation of Södra group Södra is one of Europe’s largest wood product manufacturers, which has 9 sawmills in southern Sweden. Södra makes flooring, building systems, and many other products for the construction of housing, public buildings and commercial premises. Södra is also one of the Scandinavian co-operative associations with 35 000 private forest owners. There are approximately 6 300 employees and the turnover was 16.1 billion Swedish Kronor (SEK) in 2006. Its primary task is to promote the profitability of its members’ forestry and to have a strong balance sheet in order to withstand economic downturns and other challenges. Södra mainly have Södra Skog, Timber, Gapro, Skogsenergi, and Cell. Södra Skog supplies the group’s plant with forest raw material. Södra timber produces sawn and planed timber products for building construction in nine saw mills, located in different areas in Sweden. Södra Gapro produces products for the house market. Södra Skogsenergi produces from Södra mills and from members’ forests. Södra Cell is the world’s second largest manufacture of market pulp. High product quality, high delivery reliability and short lead times characterize Södra business. 5.2 Presentation of Södra Timber in Ramkvilla Södra Timber is one of the most important Nordic producers of sawn timber; it is the group’s producer of wood products, primarily for building related usages, and the industrial production as well, e.g., packaging, furniture, and carpentry products. In this report, the case company is Södra Ramkvilla saw mill. Ramkvilla saw mill has started since 1942, and became a part of Södra in 2003. It has 55 employees and produced about 115 000 cubic meters in 2006 using spruce from Södra own forests, and about 1.7 million cubic meters from 9 Södra sawmills. The main market is Europe, but a significant amount of export also goes to Japan and USA. 5.3 Södra Timber production overview The manufacturing process starts by measuring and classifying the logs based on the diameter and ends with packaging and delivering, see Figure 5.1. After the log sawing there are two production lines, one for core products and another for side products. Figure 5.2 shows how the log is sawed into core and side products.
A MODEL FOR ASSESSING COST EFFECTIVENESS OF APPLYING LEAN TOOLS Case study
23
Figure 5.1 Production Process
Figure 5.2 Core and side products
There are two shifts in the sawmill, one in the morning and the other afternoon, both of them are switched each 2 week. The sawmill runs five days a week and 11 months per year, Table 5.1 presents the working hour per week. Table 5.1 The working hours per week Days Planned working
(hr/day) Actual working (hr/day)
Planned break time (hr/day)
Monday-Thursday 17.92 16.50 1.42 Friday 10.50 9.67 0.83
5.4 Model validation and analysis This section presents a test for the model developed in Ch.4. This test assumes that no changes in the process will occur within a ten years’ period. Phase one Understand customer need 1.1 Identify customers The company has two main kinds of customer, one is building retailer and the other is building industry. For that reason the product range is very focused on building products. There are three main customers in the company, one of them located in Denmark. The more detail of this main customer information is showed in Table 5.2 Customer identification.
A MODEL FOR ASSESSING COST EFFECTIVENESS OF APPLYING LEAN TOOLS Case study
24
Table 5.2 Customer identification
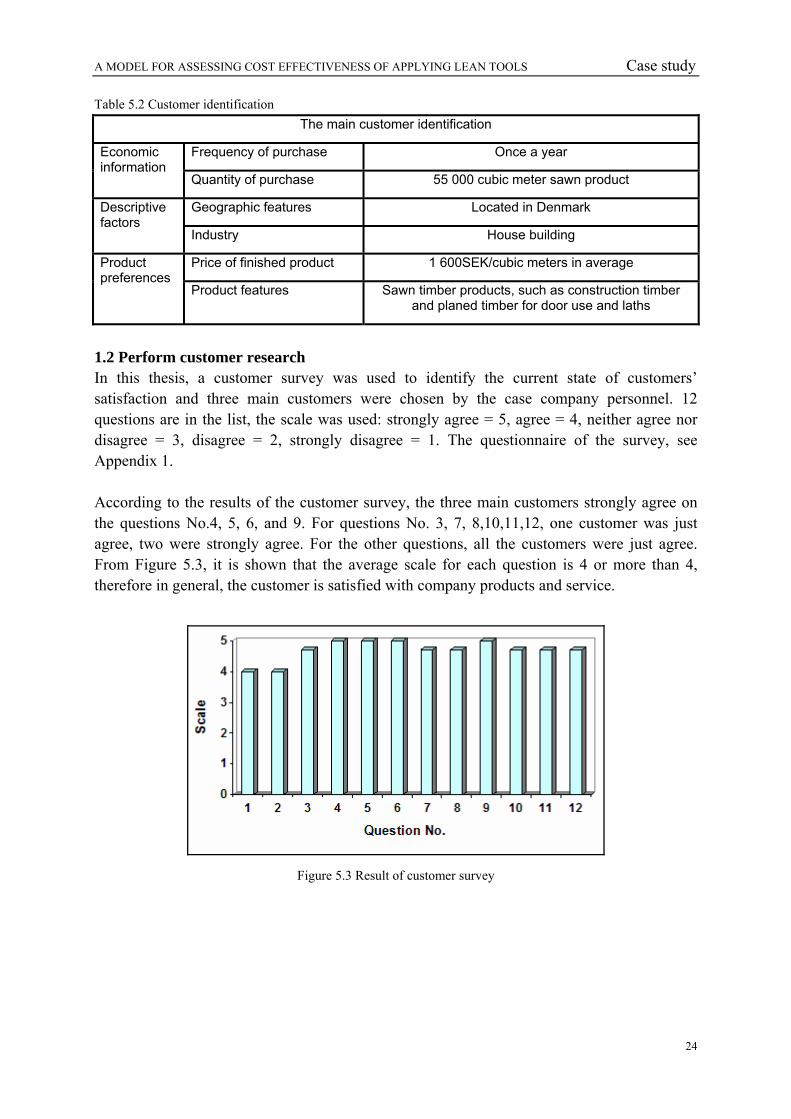
1.2 Perform customer research In this thesis, a customer survey was used to identify the current state of customers’ satisfaction and three main customers were chosen by the case company personnel. 12 questions are in the list, the scale was used: strongly agree = 5, agree = 4, neither agree nor disagree = 3, disagree = 2, strongly disagree = 1. The questionnaire of the survey, see Appendix 1. According to the results of the customer survey, the three main customers strongly agree on the questions No.4, 5, 6, and 9. For questions No. 3, 7, 8,10,11,12, one customer was just agree, two were strongly agree. For the other questions, all the customers were just agree. From Figure 5.3, it is shown that the average scale for each question is 4 or more than 4, therefore in general, the customer is satisfied with company products and service.
Figure 5.3 Result of customer survey
The main customer identification
Frequency of purchase Once a year Economic information
Quantity of purchase 55 000 cubic meter sawn product
Geographic features Located in Denmark Descriptive factors
Industry House building
Price of finished product 1 600SEK/cubic meters in average Product preferences
Product features Sawn timber products, such as construction timber and planed timber for door use and laths
A MODEL FOR ASSESSING COST EFFECTIVENESS OF APPLYING LEAN TOOLS Case study
25
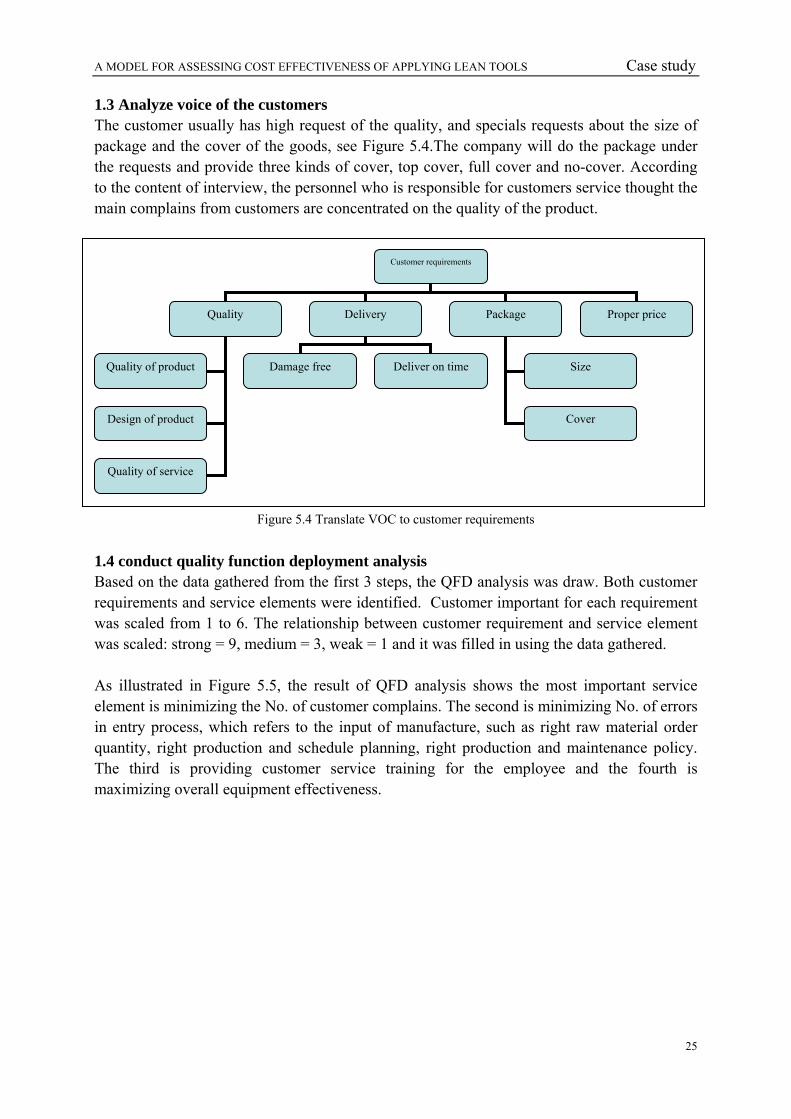
1.3 Analyze voice of the customers The customer usually has high request of the quality, and specials requests about the size of package and the cover of the goods, see Figure 5.4.The company will do the package under the requests and provide three kinds of cover, top cover, full cover and no-cover. According to the content of interview, the personnel who is responsible for customers service thought the main complains from customers are concentrated on the quality of the product.
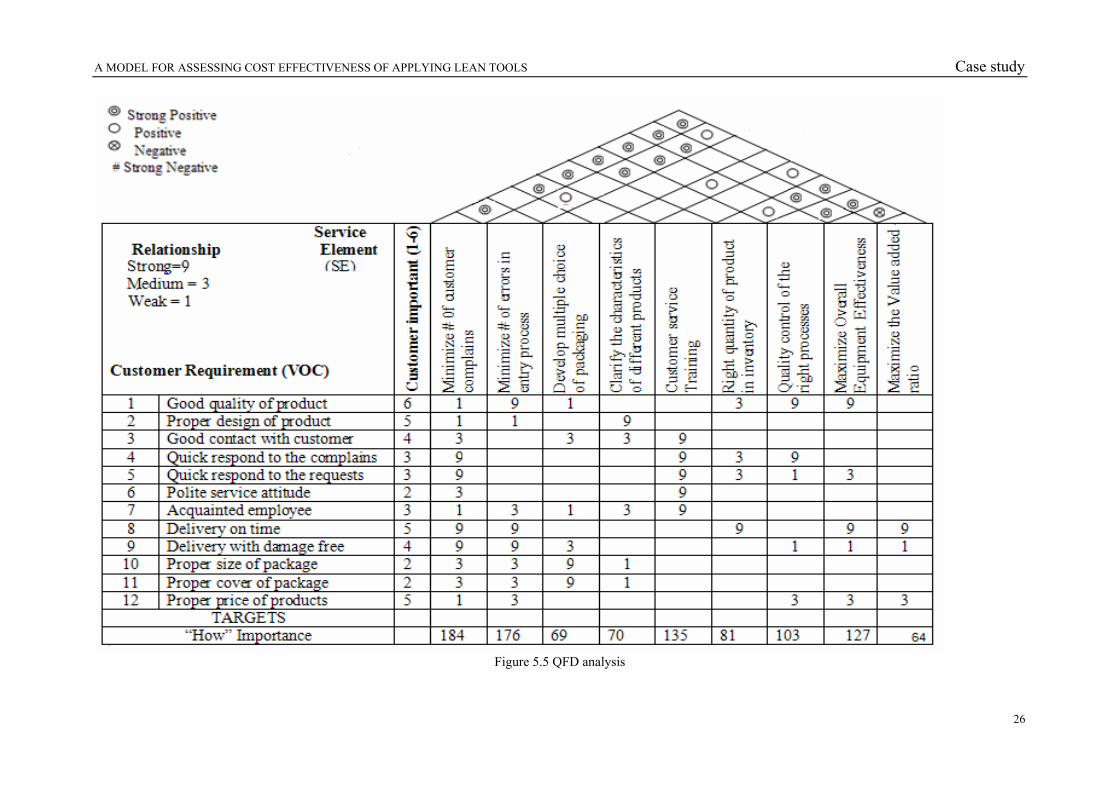
Figure 5.4 Translate VOC to customer requirements
1.4 conduct quality function deployment analysis Based on the data gathered from the first 3 steps, the QFD analysis was draw. Both customer requirements and service elements were identified. Customer important for each requirement was scaled from 1 to 6. The relationship between customer requirement and service element was scaled: strong = 9, medium = 3, weak = 1 and it was filled in using the data gathered. As illustrated in Figure 5.5, the result of QFD analysis shows the most important service element is minimizing the No. of customer complains. The second is minimizing No. of errors in entry process, which refers to the input of manufacture, such as right raw material order quantity, right production and schedule planning, right production and maintenance policy. The third is providing customer service training for the employee and the fourth is maximizing overall equipment effectiveness.
Customer requirements
Quality Delivery Package
Quality of product
Design of product
Damage free Deliver on time
Quality of service
Proper price
Size
Cover
A MODEL FOR ASSESSING COST EFFECTIVENESS OF APPLYING LEAN TOOLS Case study
26
Figure 5.5 QFD analysis
A MODEL FOR ASSESSING COST EFFECTIVENESS OF APPLYING LEAN TOOLS Case study
27
Phase 2 Assess the current state According to the interview with relevant personnel in the company, the number of customer complains is 3 per month in average, and the level of customer satisfaction is high. Therefore, the following analysis is focused on the “minimize No. of errors in entry process” and “maximize overall equipment effectiveness”. The assessment of current state stared by receiving the logs from supplier, and the unit of analysis is the sawmill.
2.1 - Specify lean measures using balanced scorecard.
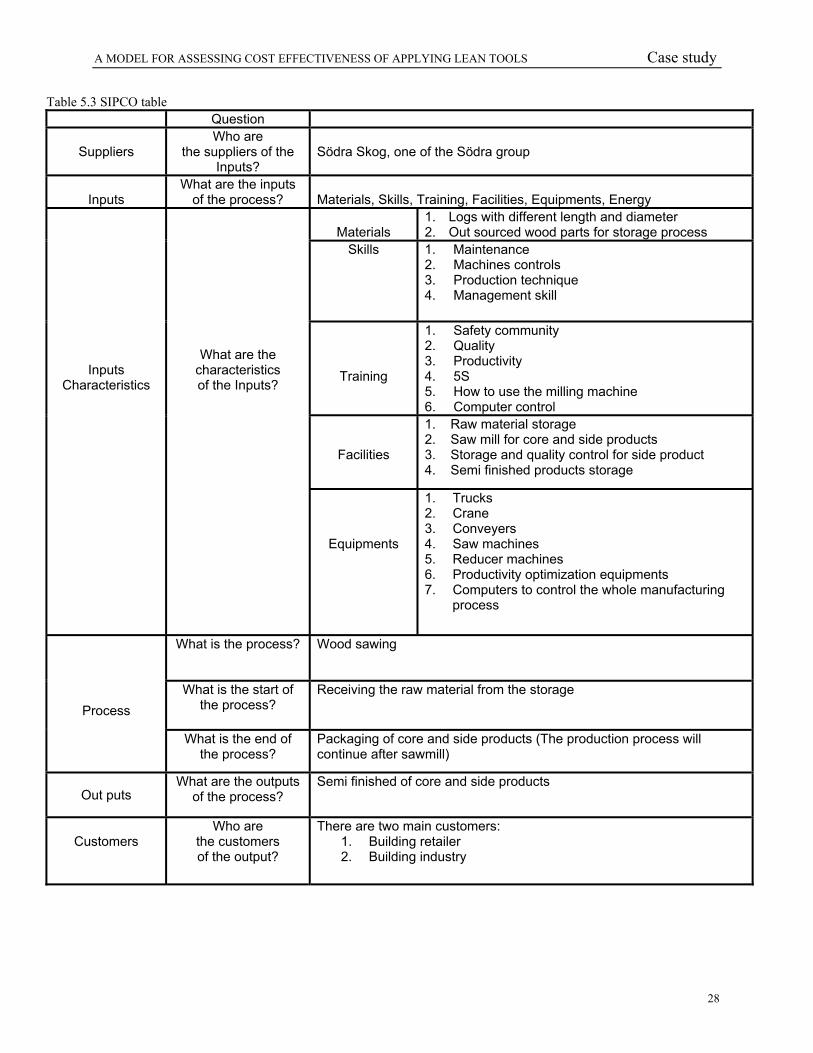
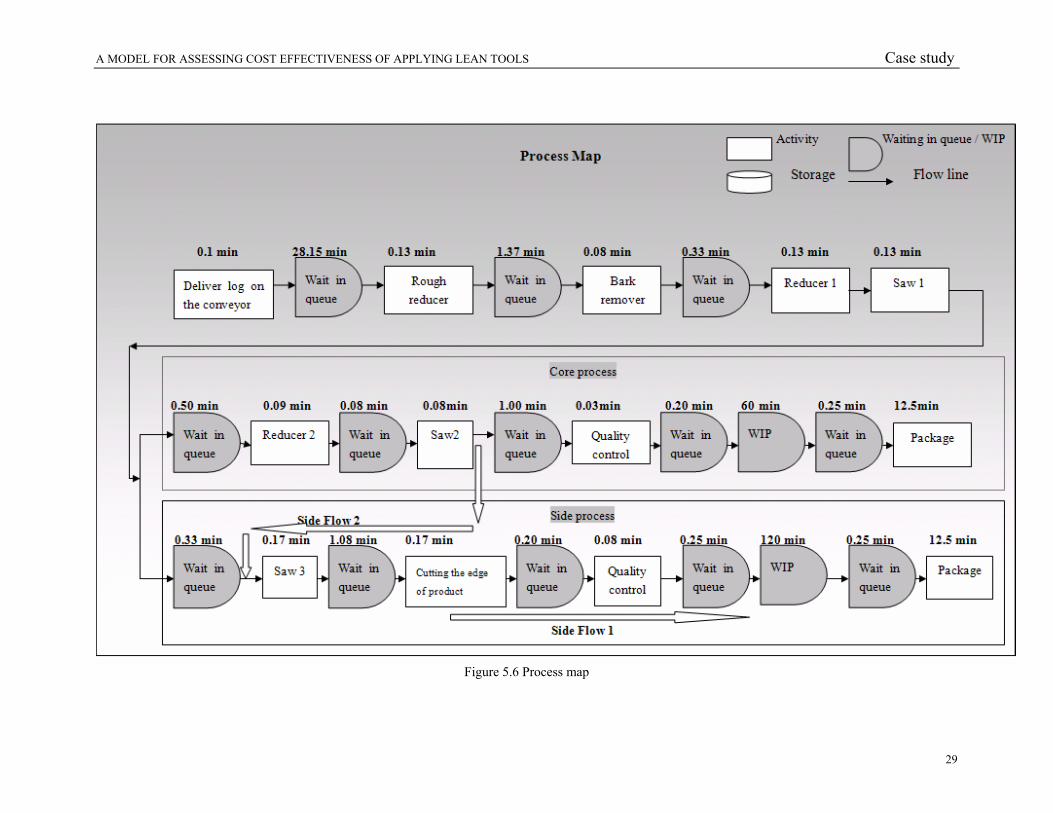
The lean measures in this step are considered with respect to the following perspectives: suppliers, human resources, production processes, customers, society, and financial. The basic lean measures used are presented in Figure 4.3. 2.2 – Collect technical and financial data. An investigation on the material flow, actions, activities, and operations that are applied to the products were made using both the observations and Södra databases. With help from production technician, the processing time, queuing time and storage time for one log was collected; the chosen day was 20th of April 2007. The survey was used to measure the employee satisfaction. 29 questions are in the list, strongly agree = 5 to strongly disagree = 1, see Appendix 2. The distances for the material flow were measured by using the original facility layouts. The financial and technical data were collected by the interviews. All the data collected will be used further to fill the assessment lean tool. 2.3 - Apply supplier-input-process-output-customer (SIPOC) table. The data collected in step 1.1 and 2.2 will be used to develop SIPCO table, see Table 5.3. SIPCO table shows a holistic view of all the elements that will affect the case company’s performance. 2.4 - Perform process mapping. Process map is selected as a useful tool to trace the sequence of events for a single product. Process mapping can be done at different level; the most useful charts are quite detailed. This is important because most waste is usually at a micro-level. In Figure 5.6, the process map inside sawmill is shown. The time in process map was measured by tracking for one log through the whole sawmill. Since the unit of analysis in this study is the saw mill, the process started by delivering the logs to the first conveyor before rough reducer, and all the procedures were divided into three types, i.e. activity, waiting in queue or WIP, and storage, all the procedures were connected by the flow line.
A MODEL FOR ASSESSING COST EFFECTIVENESS OF APPLYING LEAN TOOLS Case study
28
Table 5.3 SIPCO table Question
Suppliers Who are
the suppliers of the Inputs?
Södra Skog, one of the Södra group
Inputs
What are the inputs of the process?
Materials, Skills, Training, Facilities, Equipments, Energy
Materials
1. Logs with different length and diameter 2. Out sourced wood parts for storage process
Skills 1. Maintenance 2. Machines controls 3. Production technique 4. Management skill
Training
1. Safety community 2. Quality 3. Productivity 4. 5S 5. How to use the milling machine 6. Computer control
Facilities
1. Raw material storage 2. Saw mill for core and side products 3. Storage and quality control for side product 4. Semi finished products storage
Inputs Characteristics
What are the characteristics of the Inputs?
Equipments
1. Trucks 2. Crane 3. Conveyers 4. Saw machines 5. Reducer machines 6. Productivity optimization equipments 7. Computers to control the whole manufacturing
process
What is the process? Wood sawing
What is the start of the process?
Receiving the raw material from the storage Process
What is the end of the process?
Packaging of core and side products (The production process will continue after sawmill)
Out puts What are the outputs
of the process? Semi finished of core and side products
Customers
Who are the customers of the output?
There are two main customers: 1. Building retailer 2. Building industry
A MODEL FOR ASSESSING COST EFFECTIVENESS OF APPLYING LEAN TOOLS Case study
29
Figure 5.6 Process map
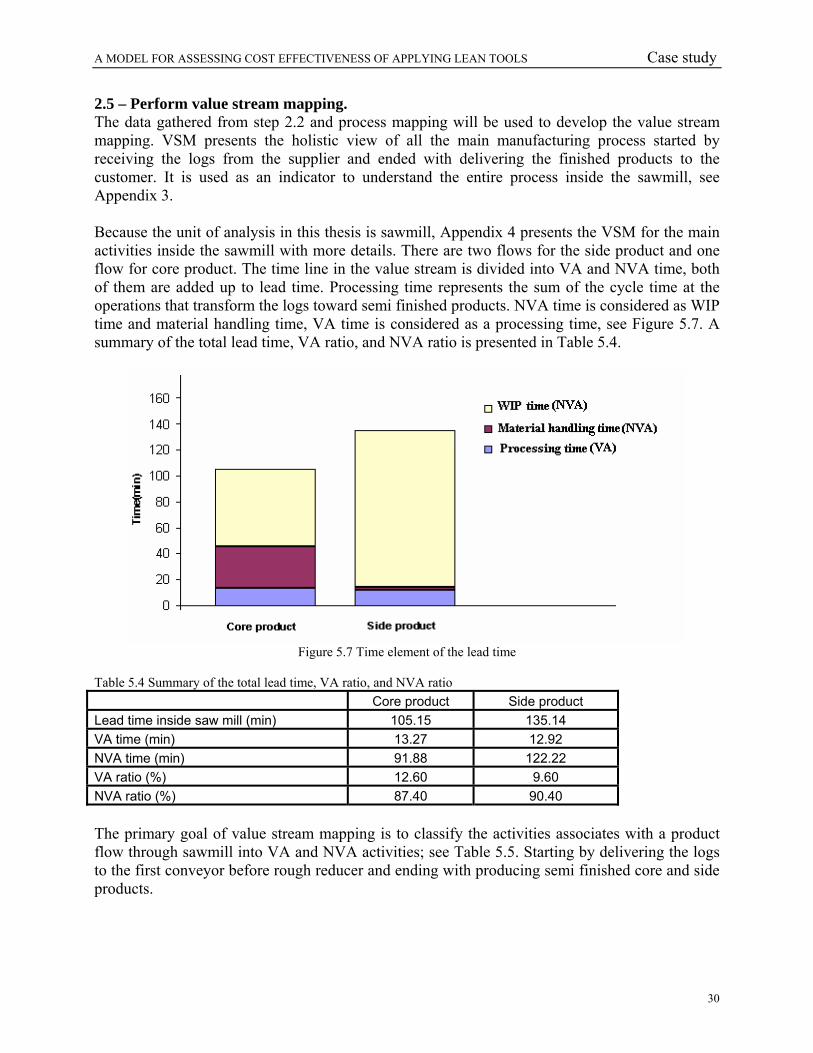
A MODEL FOR ASSESSING COST EFFECTIVENESS OF APPLYING LEAN TOOLS Case study
30
2.5 – Perform value stream mapping. The data gathered from step 2.2 and process mapping will be used to develop the value stream mapping. VSM presents the holistic view of all the main manufacturing process started by receiving the logs from the supplier and ended with delivering the finished products to the customer. It is used as an indicator to understand the entire process inside the sawmill, see Appendix 3. Because the unit of analysis in this thesis is sawmill, Appendix 4 presents the VSM for the main activities inside the sawmill with more details. There are two flows for the side product and one flow for core product. The time line in the value stream is divided into VA and NVA time, both of them are added up to lead time. Processing time represents the sum of the cycle time at the operations that transform the logs toward semi finished products. NVA time is considered as WIP time and material handling time, VA time is considered as a processing time, see Figure 5.7. A summary of the total lead time, VA ratio, and NVA ratio is presented in Table 5.4.
Figure 5.7 Time element of the lead time
Table 5.4 Summary of the total lead time, VA ratio, and NVA ratio Core product Side product Lead time inside saw mill (min) 105.15 135.14 VA time (min) 13.27 12.92 NVA time (min) 91.88 122.22 VA ratio (%) 12.60 9.60 NVA ratio (%) 87.40 90.40 The primary goal of value stream mapping is to classify the activities associates with a product flow through sawmill into VA and NVA activities; see Table 5.5. Starting by delivering the logs to the first conveyor before rough reducer and ending with producing semi finished core and side products.

A MODEL FOR ASSESSING COST EFFECTIVENESS OF APPLYING LEAN TOOLS Case study
31
Table 5.5 Classification of value-added and non-value added activities
Activities VA NVA (muda)
Necessary Not-necessary
Waiting the logs in the conveyors (WIP) √ Reduce the logs thickness √ Transport the logs to bark remover √ Remove the logs bark √ Transport the logs to reducer machine 1 √ Reduce the logs thickness √ Saw the logs to core and side parts √ Transport the core to reducer machine 2 √ Reduce the core parts thickness √ Transport the core parts to saw machine 2 √ Saw core parts to another pieces √ Transport core parts to quality control station √ Check the quality of the core parts √ Store the core parts (WIP) √ Transport the core parts to the packaging place √ Package the core parts. √ Transport the side parts to saw machine 3 √ Saw side parts to another pieces √ Transport side pieces to cutting machine √ Cut the side parts √ Transport side parts to quality control check √ Check the quality of the side parts √ Transport to packaging place √ Package the side parts √ 2.6 - Assess lean manufacturing measures. The lean assessment tool used in this step is an excel spreadsheet. Six key areas are evaluated by this assessment; each ranks the performance of company as a percentage. The data gathered from the interviews and employee survey was used to fill the questions in these six areas, namely: Supplier, Human resources, Production, Customer, Society, and Financial. Appendix 5 shows the results of the assessment tool. The questions in each area try to spotlight on the key performances. Human resources have five sub areas, and each of them also has several questions. The employee survey was among 28 employees in the company; 2 of them work in the office, and the other work in the factory. The result of the employee survey is presented in Appendix 6.

A MODEL FOR ASSESSING COST EFFECTIVENESS OF APPLYING LEAN TOOLS Case study
32
2.7 – Perform lean profile chart. The results of the assessment tool are used to generate the lean profiles. A score is given for
each answer; best score = 5 to worst score = 1. The first column is the list of the lean perspective in the assessment tool. The second column is the perspective points, i.e. the total score for each perspective. The third column is the total number of questions in each perspective. The fourth column, section average, is calculated by dividing section points by the number of questions in each perspective. Fifth column is calculated by dividing the section average by five, which is the maximum possible score. The sixth column is the strategic impact factor, which reflects the importance of the perspectives.
Table 5.6 shows the score of the company in the six key areas of the assessment. The company has the highest score 92 percent in customer perspective and lowest score 63 percent in production.
Table 5.6 Score worksheet of the 6 key areas
Lean perspective
Perspective
Points
No. Of
Questions
Average
Percentage
(%)
Strategic impact
Factor (%)
Section Target
(%) Supplier 21 5 4.20 84 16.7 100 Human resources
101 29 3.40 68 16.7 100
Production 44 14 3.10 63 16.7 100 Customer 23 5 4.60 92 16.7 100 Society 16 4 4.00 80 16.7 100 Financial 7 2 3.50 70 16.7 100 Sum (in percent) 100
Finally, a “Lean Profile” chart is created based on the result from the score worksheet. Figure 5.8 shows the lean profile for the company. It shows the current state of the company in the six key areas, its targets, and the gaps. We have to remind the reader, that person who conducted the assessment had the results available to them immediately upon completion of the questionnaire in the assessment.
Figure 5.8 Lean profile of the six key areas
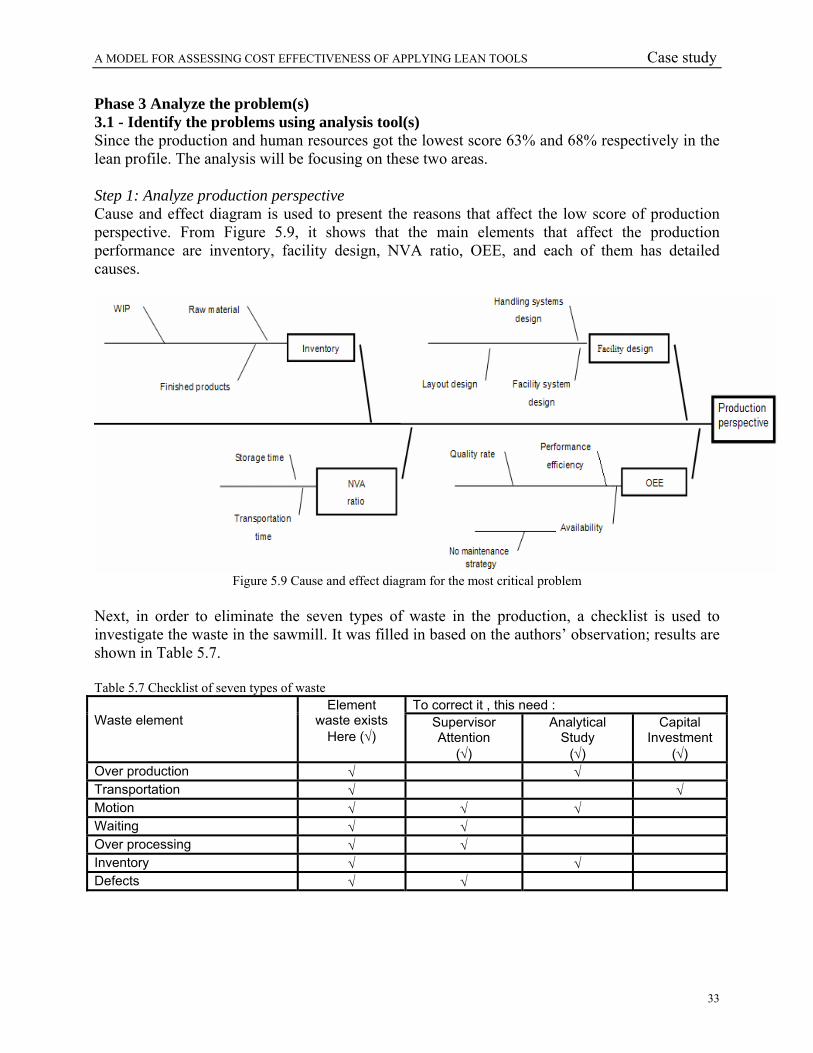
A MODEL FOR ASSESSING COST EFFECTIVENESS OF APPLYING LEAN TOOLS Case study
33
Phase 3 Analyze the problem(s) 3.1 - Identify the problems using analysis tool(s) Since the production and human resources got the lowest score 63% and 68% respectively in the lean profile. The analysis will be focusing on these two areas. Step 1: Analyze production perspective Cause and effect diagram is used to present the reasons that affect the low score of production perspective. From Figure 5.9, it shows that the main elements that affect the production performance are inventory, facility design, NVA ratio, OEE, and each of them has detailed causes.
Figure 5.9 Cause and effect diagram for the most critical problem
Next, in order to eliminate the seven types of waste in the production, a checklist is used to investigate the waste in the sawmill. It was filled in based on the authors’ observation; results are shown in Table 5.7. Table 5.7 Checklist of seven types of waste
To correct it , this need : Waste element
Element waste exists
Here (√) Supervisor Attention
(√)
Analytical Study
(√)
Capital Investment
(√) Over production √ √ Transportation √ √ Motion √ √ √ Waiting √ √ Over processing √ √ Inventory √ √ Defects √ √
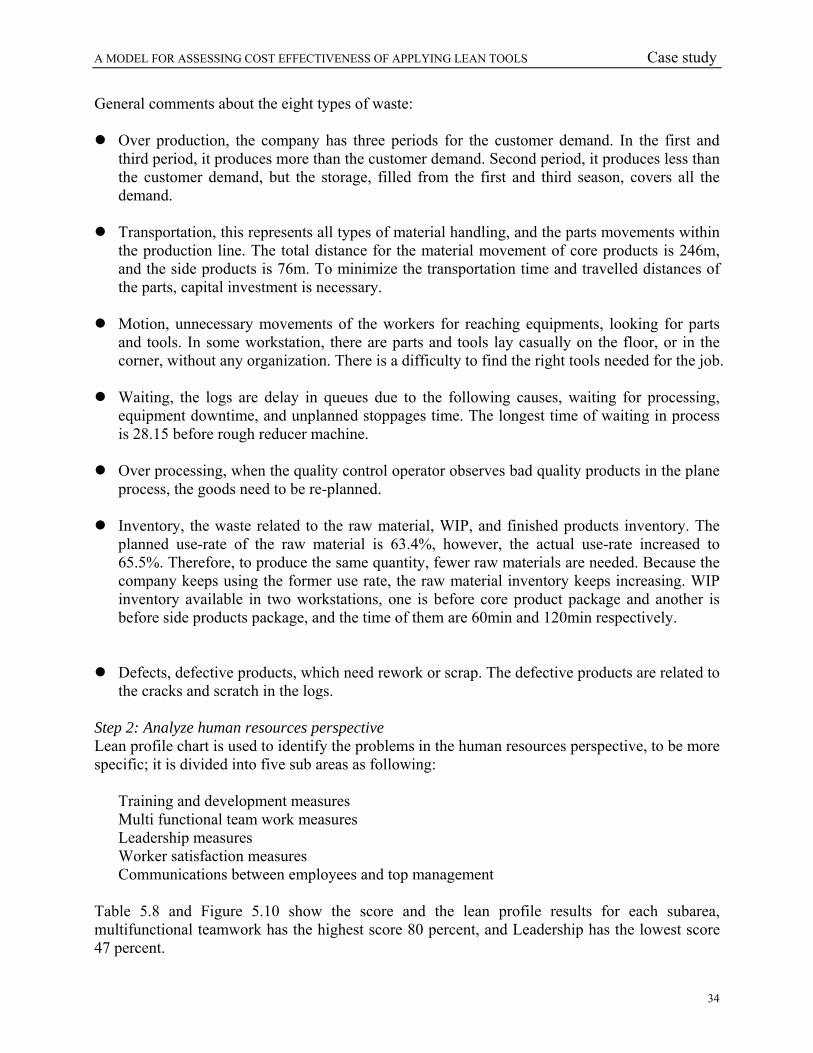
A MODEL FOR ASSESSING COST EFFECTIVENESS OF APPLYING LEAN TOOLS Case study
34
General comments about the eight types of waste:
Over production, the company has three periods for the customer demand. In the first and third period, it produces more than the customer demand. Second period, it produces less than the customer demand, but the storage, filled from the first and third season, covers all the demand.
Transportation, this represents all types of material handling, and the parts movements within
the production line. The total distance for the material movement of core products is 246m, and the side products is 76m. To minimize the transportation time and travelled distances of the parts, capital investment is necessary.
Motion, unnecessary movements of the workers for reaching equipments, looking for parts
and tools. In some workstation, there are parts and tools lay casually on the floor, or in the corner, without any organization. There is a difficulty to find the right tools needed for the job.
Waiting, the logs are delay in queues due to the following causes, waiting for processing,
equipment downtime, and unplanned stoppages time. The longest time of waiting in process is 28.15 before rough reducer machine.
Over processing, when the quality control operator observes bad quality products in the plane
process, the goods need to be re-planned.
Inventory, the waste related to the raw material, WIP, and finished products inventory. The planned use-rate of the raw material is 63.4%, however, the actual use-rate increased to 65.5%. Therefore, to produce the same quantity, fewer raw materials are needed. Because the company keeps using the former use rate, the raw material inventory keeps increasing. WIP inventory available in two workstations, one is before core product package and another is before side products package, and the time of them are 60min and 120min respectively.
Defects, defective products, which need rework or scrap. The defective products are related to the cracks and scratch in the logs.
Step 2: Analyze human resources perspective Lean profile chart is used to identify the problems in the human resources perspective, to be more specific; it is divided into five sub areas as following:
Training and development measures Multi functional team work measures Leadership measures Worker satisfaction measures Communications between employees and top management
Table 5.8 and Figure 5.10 show the score and the lean profile results for each subarea, multifunctional teamwork has the highest score 80 percent, and Leadership has the lowest score 47 percent.
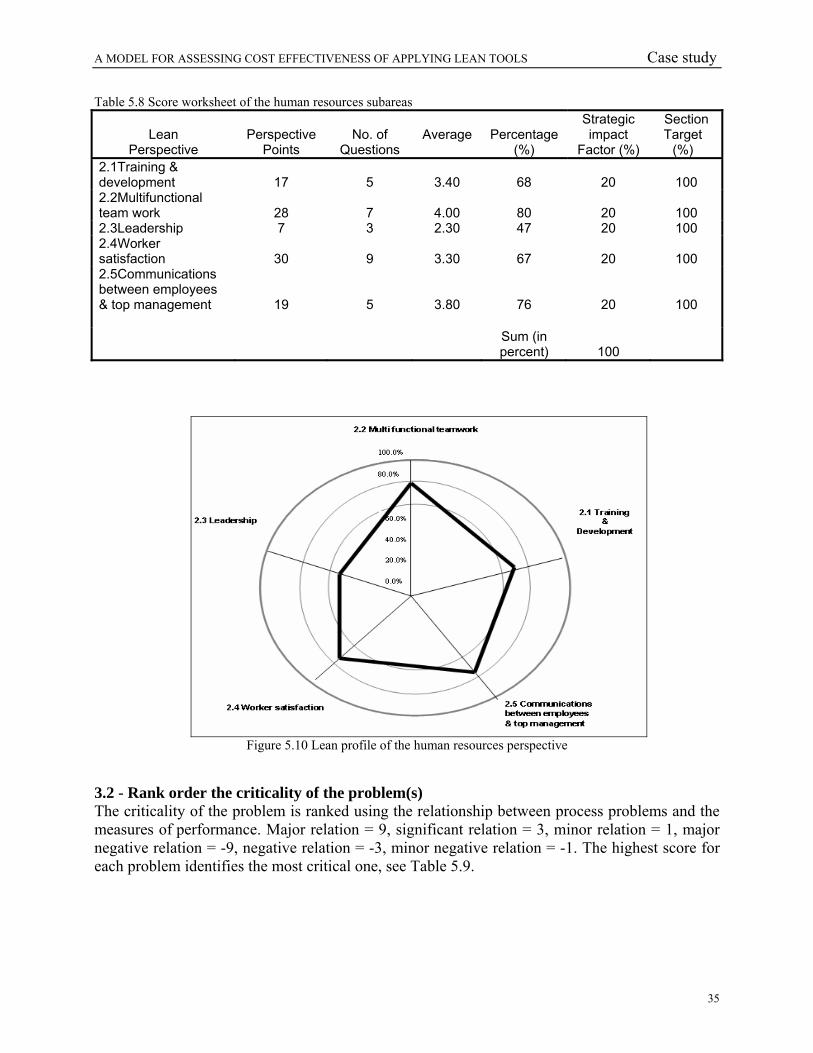
A MODEL FOR ASSESSING COST EFFECTIVENESS OF APPLYING LEAN TOOLS Case study
35
Table 5.8 Score worksheet of the human resources subareas
Lean Perspective
Perspective
Points
No. of
Questions
Average
Percentage
(%)
Strategic impact
Factor (%)
Section Target
(%) 2.1Training & development 17 5 3.40 68 20 100 2.2Multifunctional team work 28 7 4.00 80 20 100 2.3Leadership 7 3 2.30 47 20 100 2.4Worker satisfaction 30 9 3.30 67 20 100 2.5Communications between employees & top management 19 5 3.80 76 20 100
Sum (in percent) 100
Figure 5.10 Lean profile of the human resources perspective
3.2 - Rank order the criticality of the problem(s) The criticality of the problem is ranked using the relationship between process problems and the measures of performance. Major relation = 9, significant relation = 3, minor relation = 1, major negative relation = -9, negative relation = -3, minor negative relation = -1. The highest score for each problem identifies the most critical one, see Table 5.9.

A MODEL FOR ASSESSING COST EFFECTIVENESS OF APPLYING LEAN TOOLS Case study
36
Table 5.9 The priority of the problems
Based on the result of phase 3, the most critical problems are high NVA ratio, and no maintenance strategy. Phase 4 Generate improvement suggestion(s) 4.1 - Perform cause and effect diagram The following analysis is focused on solving the most critical problems prioritized in phase 3. To detect the root reasons of the high NVA, the cause and effect diagram was drawn. Seven main types of waste contribute directly or indirectly to the high NVA ratio, see Figure 5.11.
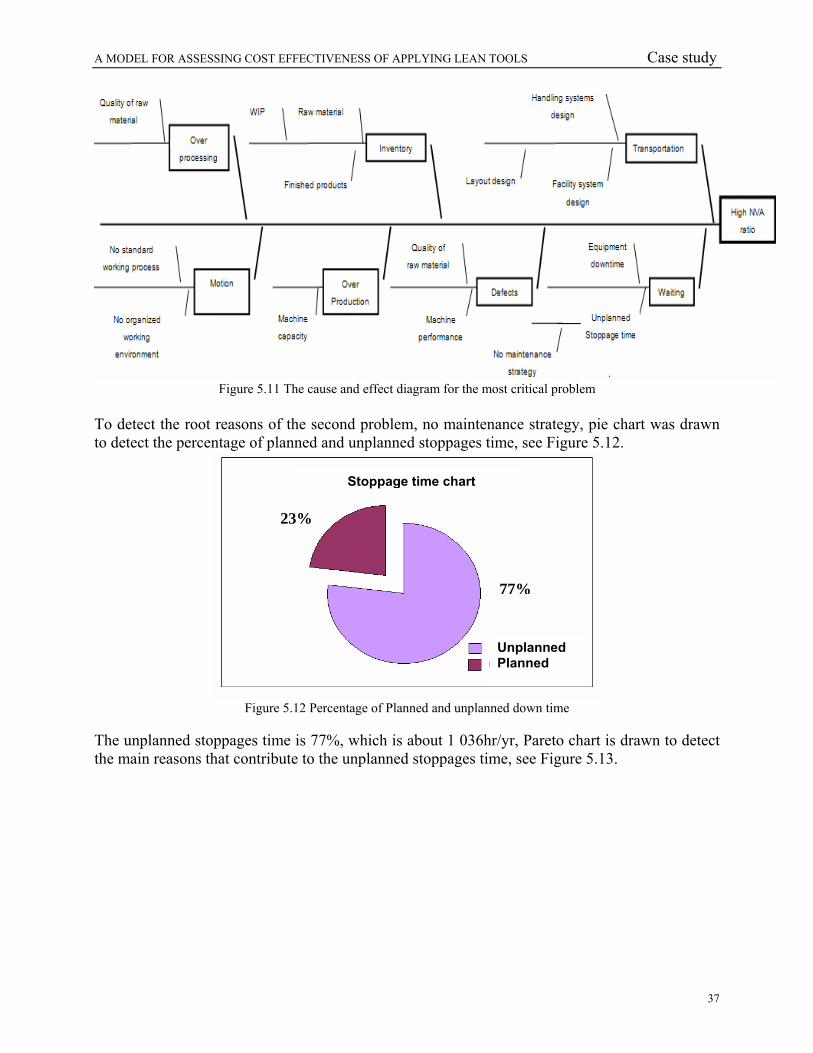
A MODEL FOR ASSESSING COST EFFECTIVENESS OF APPLYING LEAN TOOLS Case study
37
Figure 5.11 The cause and effect diagram for the most critical problem
To detect the root reasons of the second problem, no maintenance strategy, pie chart was drawn to detect the percentage of planned and unplanned stoppages time, see Figure 5.12.
Figure 5.12 Percentage of Planned and unplanned down time
The unplanned stoppages time is 77%, which is about 1 036hr/yr, Pareto chart is drawn to detect the main reasons that contribute to the unplanned stoppages time, see Figure 5.13.
23%
77%
Unplanned Planned
Stoppage time chart
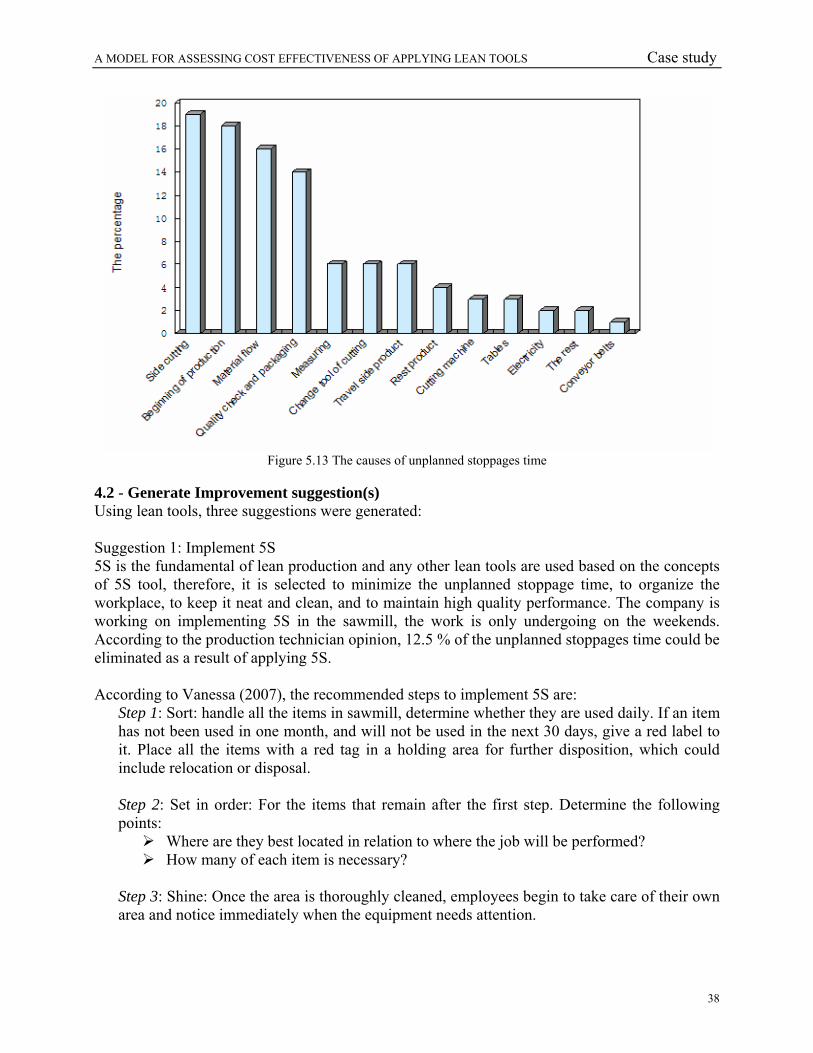
A MODEL FOR ASSESSING COST EFFECTIVENESS OF APPLYING LEAN TOOLS Case study
38
Figure 5.13 The causes of unplanned stoppages time
4.2 - Generate Improvement suggestion(s) Using lean tools, three suggestions were generated: Suggestion 1: Implement 5S 5S is the fundamental of lean production and any other lean tools are used based on the concepts of 5S tool, therefore, it is selected to minimize the unplanned stoppage time, to organize the workplace, to keep it neat and clean, and to maintain high quality performance. The company is working on implementing 5S in the sawmill, the work is only undergoing on the weekends. According to the production technician opinion, 12.5 % of the unplanned stoppages time could be eliminated as a result of applying 5S. According to Vanessa (2007), the recommended steps to implement 5S are:
Step 1: Sort: handle all the items in sawmill, determine whether they are used daily. If an item has not been used in one month, and will not be used in the next 30 days, give a red label to it. Place all the items with a red tag in a holding area for further disposition, which could include relocation or disposal. Step 2: Set in order: For the items that remain after the first step. Determine the following points:
Where are they best located in relation to where the job will be performed? How many of each item is necessary?
Step 3: Shine: Once the area is thoroughly cleaned, employees begin to take care of their own area and notice immediately when the equipment needs attention.
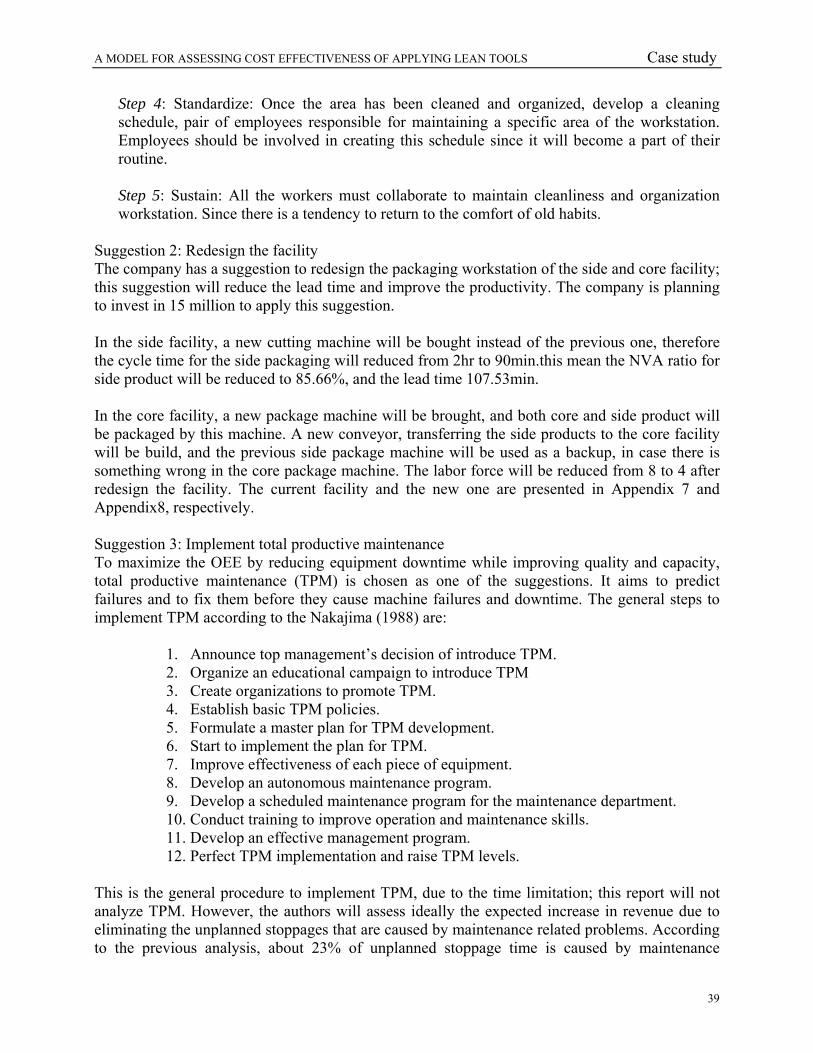
A MODEL FOR ASSESSING COST EFFECTIVENESS OF APPLYING LEAN TOOLS Case study
39
Step 4: Standardize: Once the area has been cleaned and organized, develop a cleaning schedule, pair of employees responsible for maintaining a specific area of the workstation. Employees should be involved in creating this schedule since it will become a part of their routine. Step 5: Sustain: All the workers must collaborate to maintain cleanliness and organization workstation. Since there is a tendency to return to the comfort of old habits.
Suggestion 2: Redesign the facility The company has a suggestion to redesign the packaging workstation of the side and core facility; this suggestion will reduce the lead time and improve the productivity. The company is planning to invest in 15 million to apply this suggestion. In the side facility, a new cutting machine will be bought instead of the previous one, therefore the cycle time for the side packaging will reduced from 2hr to 90min.this mean the NVA ratio for side product will be reduced to 85.66%, and the lead time 107.53min. In the core facility, a new package machine will be brought, and both core and side product will be packaged by this machine. A new conveyor, transferring the side products to the core facility will be build, and the previous side package machine will be used as a backup, in case there is something wrong in the core package machine. The labor force will be reduced from 8 to 4 after redesign the facility. The current facility and the new one are presented in Appendix 7 and Appendix8, respectively. Suggestion 3: Implement total productive maintenance To maximize the OEE by reducing equipment downtime while improving quality and capacity, total productive maintenance (TPM) is chosen as one of the suggestions. It aims to predict failures and to fix them before they cause machine failures and downtime. The general steps to implement TPM according to the Nakajima (1988) are:
1. Announce top management’s decision of introduce TPM. 2. Organize an educational campaign to introduce TPM 3. Create organizations to promote TPM. 4. Establish basic TPM policies. 5. Formulate a master plan for TPM development. 6. Start to implement the plan for TPM. 7. Improve effectiveness of each piece of equipment. 8. Develop an autonomous maintenance program. 9. Develop a scheduled maintenance program for the maintenance department. 10. Conduct training to improve operation and maintenance skills. 11. Develop an effective management program. 12. Perfect TPM implementation and raise TPM levels.
This is the general procedure to implement TPM, due to the time limitation; this report will not analyze TPM. However, the authors will assess ideally the expected increase in revenue due to eliminating the unplanned stoppages that are caused by maintenance related problems. According to the previous analysis, about 23% of unplanned stoppage time is caused by maintenance
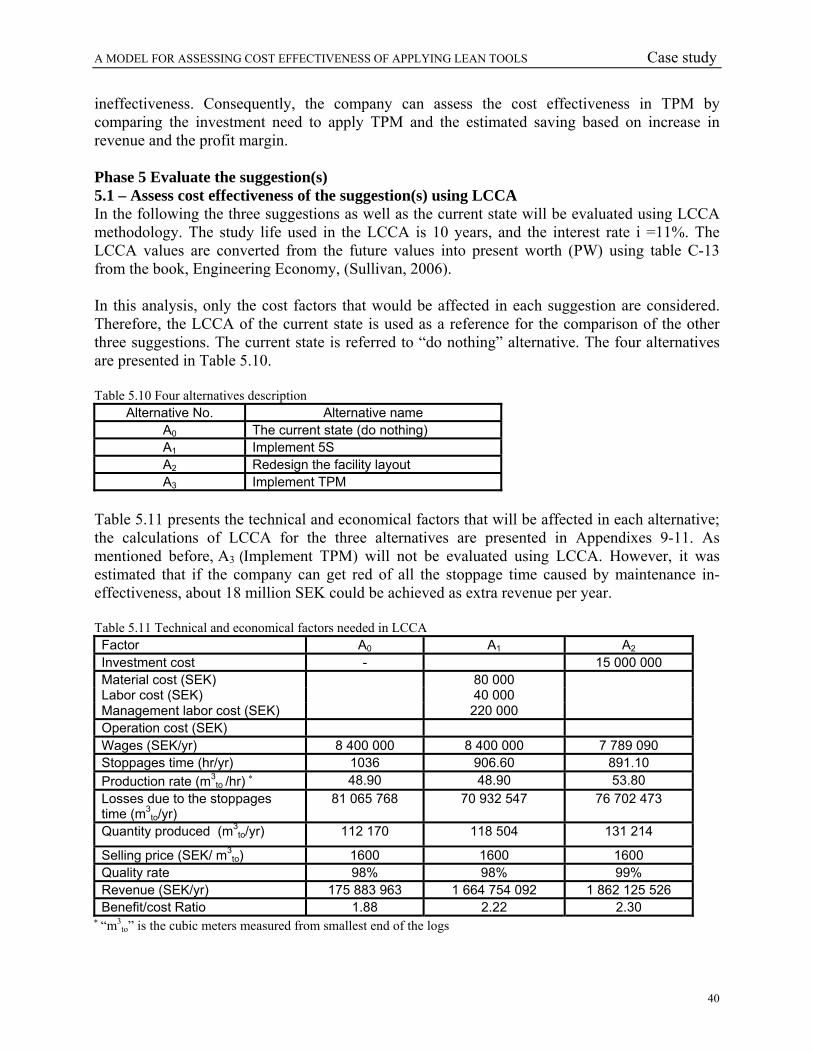
A MODEL FOR ASSESSING COST EFFECTIVENESS OF APPLYING LEAN TOOLS Case study
40
ineffectiveness. Consequently, the company can assess the cost effectiveness in TPM by comparing the investment need to apply TPM and the estimated saving based on increase in revenue and the profit margin. Phase 5 Evaluate the suggestion(s) 5.1 – Assess cost effectiveness of the suggestion(s) using LCCA In the following the three suggestions as well as the current state will be evaluated using LCCA methodology. The study life used in the LCCA is 10 years, and the interest rate i =11%. The LCCA values are converted from the future values into present worth (PW) using table C-13 from the book, Engineering Economy, (Sullivan, 2006). In this analysis, only the cost factors that would be affected in each suggestion are considered. Therefore, the LCCA of the current state is used as a reference for the comparison of the other three suggestions. The current state is referred to “do nothing” alternative. The four alternatives are presented in Table 5.10. Table 5.10 Four alternatives description
Alternative No. Alternative name A0 The current state (do nothing) A1 Implement 5S A2 Redesign the facility layout A3 Implement TPM
Table 5.11 presents the technical and economical factors that will be affected in each alternative; the calculations of LCCA for the three alternatives are presented in Appendixes 9-11. As mentioned before, A3 (Implement TPM) will not be evaluated using LCCA. However, it was estimated that if the company can get red of all the stoppage time caused by maintenance in-effectiveness, about 18 million SEK could be achieved as extra revenue per year. Table 5.11 Technical and economical factors needed in LCCA Factor A0 A1 A2 Investment cost - 15 000 000 Material cost (SEK) 80 000 Labor cost (SEK) 40 000 Management labor cost (SEK) 220 000 Operation cost (SEK) Wages (SEK/yr) 8 400 000 8 400 000 7 789 090 Stoppages time (hr/yr) 1036 906.60 891.10 Production rate (m3
to /hr) ∗ 48.90 48.90 53.80 Losses due to the stoppages time (m3
to/yr) 81 065 768
70 932 547
76 702 473
Quantity produced (m3to/yr) 112 170 118 504 131 214
Selling price (SEK/ m3to) 1600 1600 1600
Quality rate 98% 98% 99% Revenue (SEK/yr) 175 883 963 1 664 754 092 1 862 125 526 Benefit/cost Ratio 1.88 2.22 2.30
∗ “m3to” is the cubic meters measured from smallest end of the logs
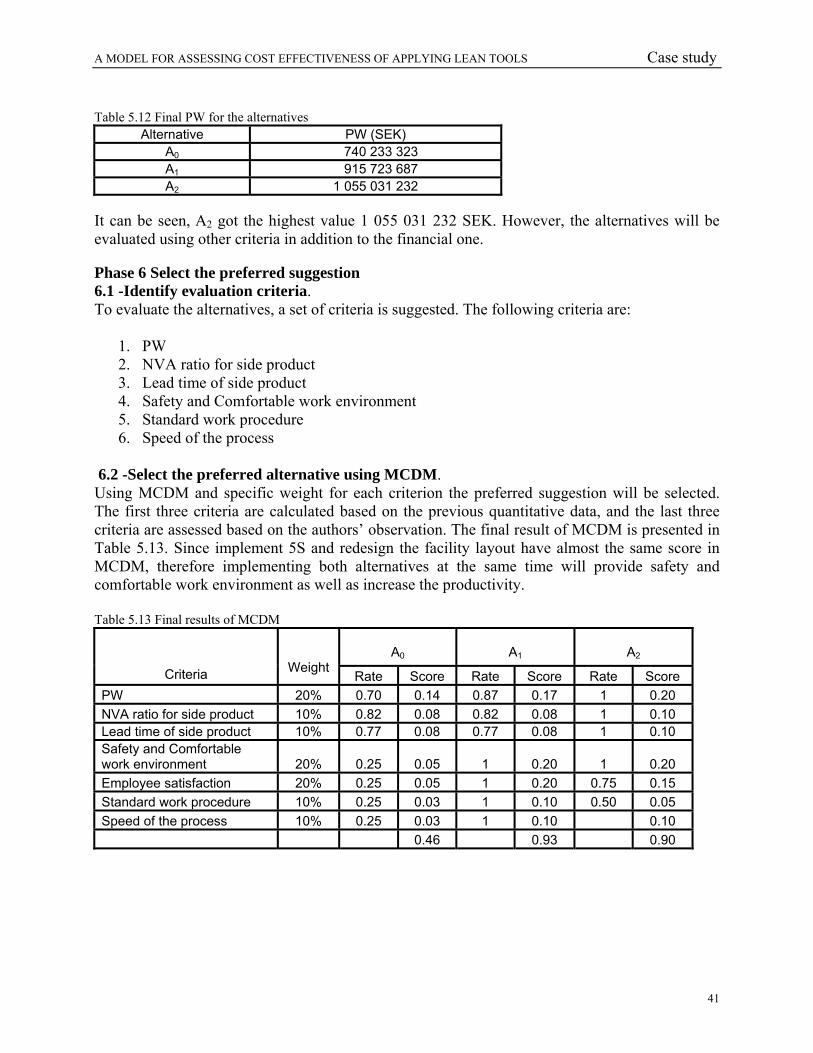
A MODEL FOR ASSESSING COST EFFECTIVENESS OF APPLYING LEAN TOOLS Case study
41
Table 5.12 Final PW for the alternatives
Alternative PW (SEK) A0 740 233 323 A1 915 723 687 A2 1 055 031 232
It can be seen, A2 got the highest value 1 055 031 232 SEK. However, the alternatives will be evaluated using other criteria in addition to the financial one. Phase 6 Select the preferred suggestion 6.1 -Identify evaluation criteria. To evaluate the alternatives, a set of criteria is suggested. The following criteria are:
1. PW 2. NVA ratio for side product 3. Lead time of side product 4. Safety and Comfortable work environment 5. Standard work procedure 6. Speed of the process
6.2 -Select the preferred alternative using MCDM. Using MCDM and specific weight for each criterion the preferred suggestion will be selected. The first three criteria are calculated based on the previous quantitative data, and the last three criteria are assessed based on the authors’ observation. The final result of MCDM is presented in Table 5.13. Since implement 5S and redesign the facility layout have almost the same score in MCDM, therefore implementing both alternatives at the same time will provide safety and comfortable work environment as well as increase the productivity. Table 5.13 Final results of MCDM
A0
A1
A2
Criteria
Weight Rate Score Rate Score Rate Score
PW 20% 0.70 0.14 0.87 0.17 1 0.20 NVA ratio for side product 10% 0.82 0.08 0.82 0.08 1 0.10 Lead time of side product 10% 0.77 0.08 0.77 0.08 1 0.10 Safety and Comfortable work environment 20% 0.25 0.05 1 0.20 1 0.20 Employee satisfaction 20% 0.25 0.05 1 0.20 0.75 0.15 Standard work procedure 10% 0.25 0.03 1 0.10 0.50 0.05 Speed of the process 10% 0.25 0.03 1 0.10 0.10 0.46 0.93 0.90
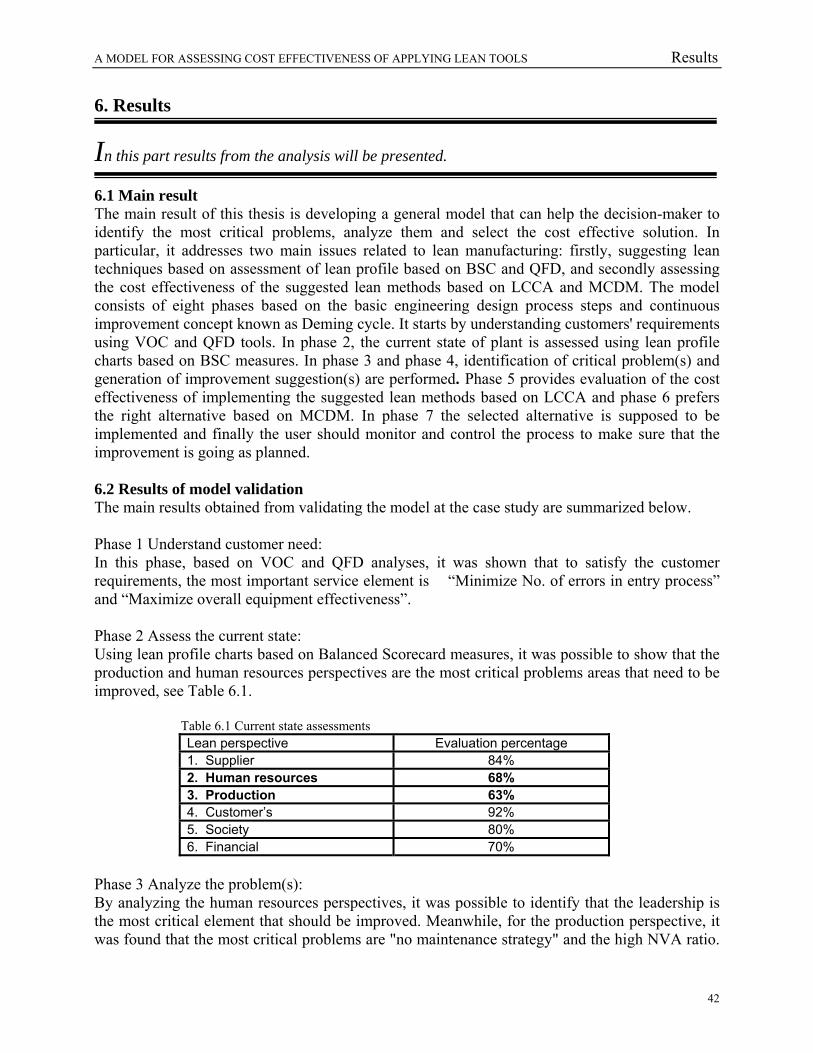
A MODEL FOR ASSESSING COST EFFECTIVENESS OF APPLYING LEAN TOOLS Results
42
6. Results
In this part results from the analysis will be presented. 6.1 Main result The main result of this thesis is developing a general model that can help the decision-maker to identify the most critical problems, analyze them and select the cost effective solution. In particular, it addresses two main issues related to lean manufacturing: firstly, suggesting lean techniques based on assessment of lean profile based on BSC and QFD, and secondly assessing the cost effectiveness of the suggested lean methods based on LCCA and MCDM. The model consists of eight phases based on the basic engineering design process steps and continuous improvement concept known as Deming cycle. It starts by understanding customers' requirements using VOC and QFD tools. In phase 2, the current state of plant is assessed using lean profile charts based on BSC measures. In phase 3 and phase 4, identification of critical problem(s) and generation of improvement suggestion(s) are performed. Phase 5 provides evaluation of the cost effectiveness of implementing the suggested lean methods based on LCCA and phase 6 prefers the right alternative based on MCDM. In phase 7 the selected alternative is supposed to be implemented and finally the user should monitor and control the process to make sure that the improvement is going as planned. 6.2 Results of model validation The main results obtained from validating the model at the case study are summarized below. Phase 1 Understand customer need: In this phase, based on VOC and QFD analyses, it was shown that to satisfy the customer requirements, the most important service element is “Minimize No. of errors in entry process” and “Maximize overall equipment effectiveness”. Phase 2 Assess the current state: Using lean profile charts based on Balanced Scorecard measures, it was possible to show that the production and human resources perspectives are the most critical problems areas that need to be improved, see Table 6.1. Table 6.1 Current state assessments
Lean perspective Evaluation percentage 1. Supplier 84% 2. Human resources 68% 3. Production 63% 4. Customer’s 92% 5. Society 80% 6. Financial 70%
Phase 3 Analyze the problem(s): By analyzing the human resources perspectives, it was possible to identify that the leadership is the most critical element that should be improved. Meanwhile, for the production perspective, it was found that the most critical problems are "no maintenance strategy" and the high NVA ratio.
A MODEL FOR ASSESSING COST EFFECTIVENESS OF APPLYING LEAN TOOLS Results
43
Using VSM it was found that the NVA ratios for the core and side products are 87.4% and 90.4%, respectively. Phase 4 Generate improvement suggestion(s): In order to reduce the NVA ratio and improve the maintenance effectiveness the following three improvement alternatives were suggested:
• A1 Implement 5S • A2 Redesign the facility layout • A3 Implement TPM
Phase 5 Evaluate the suggestion(s): Based on LCCA, it was found that A2 (redesigning the facility layout) got the best PW. However, A3 (Implement TPM) was not analyzed. Nevertheless, it was estimated that if the company can get red of all the stoppage time caused by maintenance in-effectiveness, about 18 million SEK could be achieved as extra revenue per year. Phase 6 Select the preferred suggestion: Based on MCDM methodology implementing 5S got the highest score, i.e. 0.93, second came redesigning the facility layout with a score of 0.90.

A MODEL FOR ASSESSING COST EFFECTIVENESS OF APPLYING LEAN TOOLS CONCLUSIONS
44
7. Conclusions
In this chapter, the answer to the problem formulation will be presented and recommendation to the case company will be given. The model evaluation and future researches are also discussed. 7.1 Answer to the problem formulation The problem formulation for this study is:
How to assess the cost effectiveness of lean tools suggested by continual improvement efforts? The model developed in this thesis helps identifying problems areas as a result of using lean profile that is based on BSC and QFD. It enables the decision-maker to know and measure, holistically, the company performance with respect to customer requirements. This will enable the company to analyze the critical problems, suggest solutions evaluate them and make a cost effective decision. Thus, the company can improve its competitiveness. 7.2 Recommendations to the case company According to the study results, the most critical problems are "no maintenance strategy" and "the high NVA ratio". By analyzing these problems the following recommendations are suggested:
Start thinking using TPM as a strategy to improve the maintenance performance in the company. This will give them the opportunity to measure OEE and continually improve it. It is recommended to investigate the investments needed to build the TPM culture. This investment can be compared to the saving that can be gained by improving the OEE, for example by reducing equipment downtime, improving quality and performance efficiency.
Go ahead with applying 5S, by building an organized work environment and standard
work processes. It is expected that after applying 5S it will have an impact on the working environment and worker comfort, which will be reflected on avoiding all the unnecessary activities, which will improve the company performance.
Go ahead with the investing needed to modify the facility layout, because it a cost
effective suggestion as was proven in the study.
According to the human recourses, it is recommended that the company further investigate what they can do to improve this area, since it got the lowest score in the lean profile chart. For example, more employees need to be motivated to accept responsibility for team leadership, and to participate in the leadership training.
Also, it is recommended that investigate what can be done to improve worker satisfaction.
Based on the lean assessment tool, quicker response to the worker complains are needed and more employees need to participate in task rotations to reduce the repetitiveness.
A MODEL FOR ASSESSING COST EFFECTIVENESS OF APPLYING LEAN TOOLS CONCLUSIONS
45
VSM is a really good tool to use regularly at the plants, because it highlights where the most improvement can be made in the process. OEE should also be an element of the VSM as to show how the process is improving.
7.3 Evaluation of the model The model was tested with the historical data from the case company; the last two phases of the model, implement the decision, and monitor and control the process are not included, due to the limitation in the time available for this report. By evaluating the model in the specified criteria, it is founded by the authors opinion that the model is full filling criteria's II Easy to understand, III The availability of a structured approach to use the model, and Criterion IV The degree of covering the lean aspects. Criterion II is fulfilled showing the model in Figure 4.1 and 4.2. Criterion IV is full filled in Table 4.2. Criterion III is also well fulfilled. The main contribution of the model is that it covers the lack existing in the current literature to assess cost effectiveness of applying lean tool (s). Furthermore, it tries to combine variety of available tools and methods in different disciplines to solve the problems. The model starts with VOC analysis, and then combines BSC perspectives and lean profile to evaluate the current state, uses LCCA after generate the improvement suggestions, applies MCDM to select the preferred decision. Theses aspects have been proven to be of great importance when the decision-maker wants to find a most cost effective solution. Another strength of this model compared with the existing theoretical model is that it has been tested in a real case. The model is a general model developed for all types of companies. Each phase of the model, the assessment tool and lean profile has to be modified to each particular case. Since most of the terms were discussed, explained and agreed upon by the company personnel involved in the case study, and most of the data was collected from the company databases, this would increase data reliability. It shows that by following the certain phases of the model, a result for finding the most cost effective lean tool (s) will be achieved. 7.4 Further researches The model could be tested not only in one facility of the company, but also tested in the whole supply chain. The model is general developed for all types of companies; therefore, it could be tested in different types of companies in order to define the range of generalization. And after implementing the preferred decision, monitor and control process needs to be continuing applied, the new cycle should start from the phase one again.
A MODEL FOR ASSESSING COST EFFECTIVENESS OF APPLYING LEAN TOOLS Reference
46
Reference
In this part, the literatures and websites that were used to conduct this thesis are listed. Akao, Y. (1990), Quality function deployment: Integrating customer requirements into produc design, Cambridge, MA: Productivity Press. Alan, S., Dunk (2004), Product life cycle cost analysis: the impact of customer profiling, competitive advantage, and quality of IS information, Management Accounting Research journal, 401-415. Alsyouf I. (2004), Cost effective maintenance for competitive advantages, School of Industrial Engineering, Växjö University. Alsyouf I. (2006), The role of maintenance in improving companies' productivity profitability, International journal of production economics. Antony (2004), Using six Sigma, IEE Manufacturing Engineer, February/ March. Arbnor and Bejerke (1997), Methodology for creating business knowledge, Second Edition, Sage Publication. Belton, V. (1990), Multiple Criteria Decision Analysis – Practically the Only Way to Choose, University of Strathclyde, Birmingham. Billet D. (2006), What lean manufacturing can do for you, Prism Business Media. Blanchard (2004), Logistics Engineering and Management, Sixth Edition Prentice Hall, New Jersey. Bogdan, R. C. and Biklen, S. K. (1998), Qualitative research in education: An introduction to theory and methods, Third Edition, Needham Heights, MA: Allyn & Bacon. Bryman A. (1989), Research Methods and Organization Studies, the Academic Division of Uuwin hyman Ltd. Ciganovic R. and Tates M (2006), A model for assessing cost effectiveness of facility layouts- case study, School of Technology and Design, Växjö University. Daub C. and Duh C. (2006), A model to enhance the effectiveness of machine centers with automatic multi-pallet changes: case study, School of Technology and Design, Växjö University. Duffuaa S.,Raouf A., and Campbell J. (1999), Planning and control of maintenance systems modeling and analysis, John Wiley and Sons, Inc.
A MODEL FOR ASSESSING COST EFFECTIVENESS OF APPLYING LEAN TOOLS Reference
47
Durairaj, Senthil KumaranOng, S.K. Nee,A.Y.C. and Tan, R.B.H. (2002), Evaluation of Life Cycle Cost Analysis Methodologies, Corporate Environmental Strategy. EL-Haik B. and AL-Aomar R. (2006), Simulation-based lean six-sigma and design for six-sigma, John Wiley and Sons, Inc, HOBOKEN, New Jersey. Frigo, M. L. and K. R. Krumwiede (2000), The Balanced Scorecard, Strategic Finance 81,January. Gadamer, H.-G. (1992). Truth and method, 2nd, J Weisheimer & D.G. Marshall, Trans., New York: Crossroad. George (2003), Lean six sigma for service, McGraw-Hill, New York, NY. Healy, M., & Perry, C. (2000), Comprehensive criteria to judge validity and reliability of qualitative research within the realism paradigm, Qualitative Market Research. Herron. C, Braidenb p. (2006), A methodology for developing sustainable quantifiable productivity improvement in manufacturing companies. International journal of Production Economics, Elsevier publisher, Vol.104 Kaplan, R.S., Atkinson, A.A. (1989), Advanced Management Accounting, Prentice-Hall, Englewood Cliffs, NJ. Kaplan, R. S., and D. P. Norton (1996), The Balanced Scorecard: Translating Strategy into Action, Boston: Harvard Business School Press. Keeney, R.L. and Raiffa, H. (1976), Decisions with Multiple Objectives: Performances and Value Trade-offs, Wiley, New York, NY. Korhonen, P., Moskowitz, H. and Wallenius, J. (1992), Multiple criteria decision support: a review, European Journal of Operational Research, Vol. 63. Lane C. (2002), Principles of Lean Thinking, Poppendieck LCC. www.poppendieck.com/papers/LeanThinking.pdf. McCurry, L. and McIvor, R.T. (2001), Agile manufacturing: 21st century strategy for manufacturing on the periphery? , Conference Proceedings, Irish Academy of Management Conference, University of Ulster. Nakajima, S. (1988) Introduction to total productive maintenance (TPM), Productive press, Camb.shridge, MA, USA. Nazareth, D.L. (1993), Integrating MCDC and DSS: barriers and counter strategies, Vol. 31.
A MODEL FOR ASSESSING COST EFFECTIVENESS OF APPLYING LEAN TOOLS Reference
48
Nyström M. (2001), Pre-understanding and openness ± a relationship without hope?, Borås University College, School of Health Sciences, Borås, Sweden. Paixão A. (2003), Fourth generation ports – a question of agility? . International Journal of Physical Distribution & Logistics Management, May, MCB UP Ltd. Perez,M.P.,Sanchez, A.M., (2000),Lean production and supplier relations: a survey of practices in the Aragonese automotive industry, Technovation, Elsevier, Vol. 20. ReVelle, J.B., J.W. Moran, and C.A.Cox (1997), The QFD handbook, New York: John Wiley & Sons. Rossi, P.H. and Freeman, H.E. (1993), Evaluation: A systematic Approach, Sage Publications, Beverley Hills, CA. Rothchild, Irving (2003), Induction, Deduction, and the Scientific Method. School of Medicine of Case Western Reserve University Saunders, Mark, Lewis Philip & Thornhill Adrian (2007), Research methods for business students, ISBN: 0273701487. Sullivan W. (2006), Engineering Economy, Thirteenth Edition, Pearson Education,Inc. Sánchez, Angel Martínez; Pérez, Manuela Pérez, (2001),Lean indicators and manufacturing strategiesInternational Journal of Production Management, Emerald Publisher, Vol. 21 Taj S. (2005), Applying lean assessment tools in Chinese hi-tech industries, Collage of Business Administration, University of Detroit Mercy, and Detroit, Michigan, USA. Vitasek K. (2005), Supply Chain and Logistics Terms and Glossary, US, Washington, Bellevue: Supply Chain Visions. Vanessa I. (2007), Swiss precision, Industrial Engineer: IE, Institute of Industrial Engineers.Vol. 39. Winberg (1997), How to Research and Evaluate, Juta: Cape Town, South Africa. Womack, J.P., D.T. and Roos, D. (1990), The Machine that Changed the World, Rawson Associates, New York, NY. Womack, J.P. and Jones D.T. (2003), Lean Thinking: Banish waste and create wealth in your corporation, Free Press Business, London, Great Britain. Xie M. (2003), Advanced QFD Applications, Milwaukee, Wis.: ASQ Quality Press. Yin, Robert K. (2002), Case study research: design and methods, Third Edition, Thousand Oaks, Sage publication.
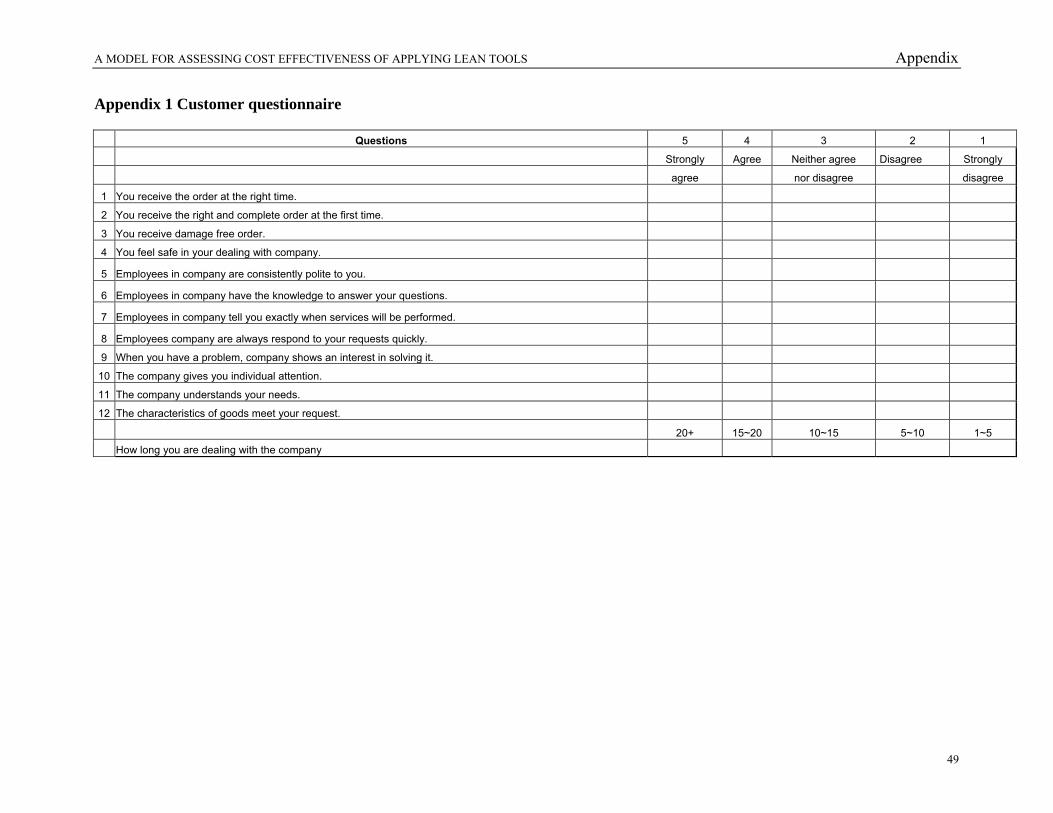
A MODEL FOR ASSESSING COST EFFECTIVENESS OF APPLYING LEAN TOOLS Appendix
49
Appendix 1 Customer questionnaire
Questions 5 4 3 2 1
Strongly Agree Neither agree Disagree Strongly
agree nor disagree disagree
1 You receive the order at the right time.
2 You receive the right and complete order at the first time.
3 You receive damage free order.
4 You feel safe in your dealing with company.
5 Employees in company are consistently polite to you.
6 Employees in company have the knowledge to answer your questions.
7 Employees in company tell you exactly when services will be performed.
8 Employees company are always respond to your requests quickly.
9 When you have a problem, company shows an interest in solving it.
10 The company gives you individual attention.
11 The company understands your needs.
12 The characteristics of goods meet your request.
20+ 15~20 10~15 5~10 1~5 How long you are dealing with the company
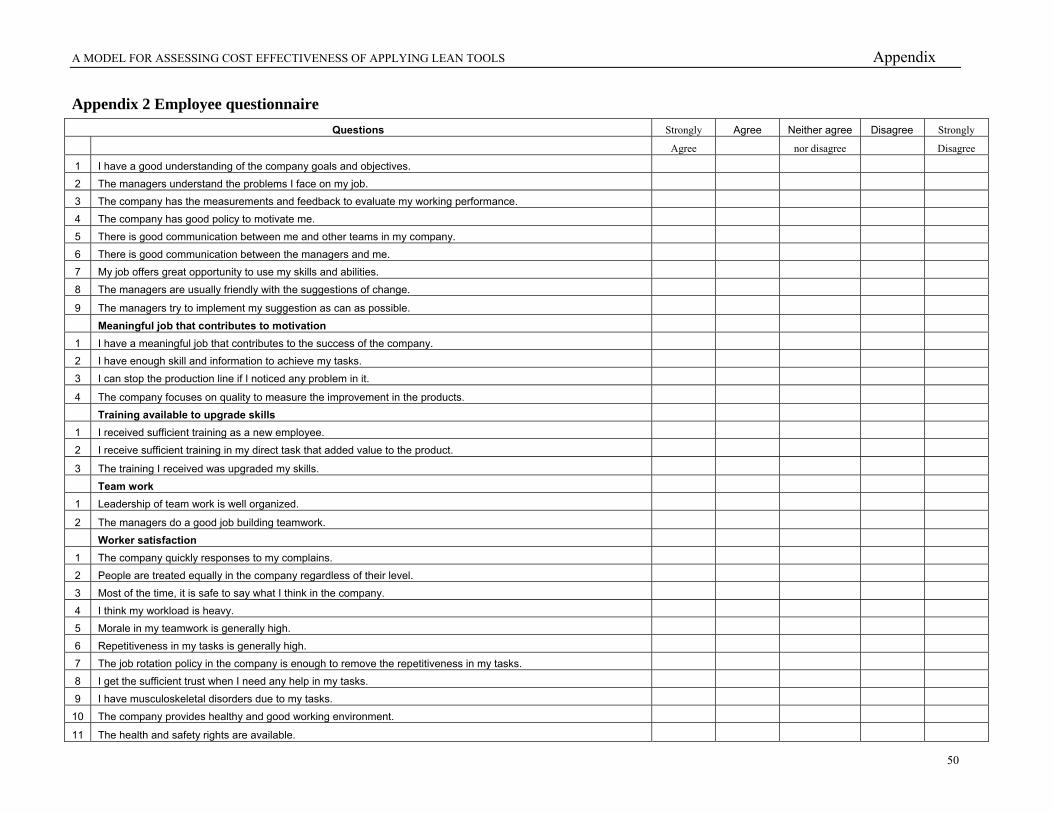
A MODEL FOR ASSESSING COST EFFECTIVENESS OF APPLYING LEAN TOOLS Appendix
50
Appendix 2 Employee questionnaire Questions Strongly Agree Neither agree Disagree Strongly
Agree nor disagree Disagree
1 I have a good understanding of the company goals and objectives.
2 The managers understand the problems I face on my job.
3 The company has the measurements and feedback to evaluate my working performance.
4 The company has good policy to motivate me.
5 There is good communication between me and other teams in my company.
6 There is good communication between the managers and me.
7 My job offers great opportunity to use my skills and abilities.
8 The managers are usually friendly with the suggestions of change.
9 The managers try to implement my suggestion as can as possible.
Meaningful job that contributes to motivation
1 I have a meaningful job that contributes to the success of the company.
2 I have enough skill and information to achieve my tasks.
3 I can stop the production line if I noticed any problem in it.
4 The company focuses on quality to measure the improvement in the products.
Training available to upgrade skills
1 I received sufficient training as a new employee.
2 I receive sufficient training in my direct task that added value to the product.
3 The training I received was upgraded my skills.
Team work
1 Leadership of team work is well organized.
2 The managers do a good job building teamwork.
Worker satisfaction
1 The company quickly responses to my complains.
2 People are treated equally in the company regardless of their level.
3 Most of the time, it is safe to say what I think in the company.
4 I think my workload is heavy.
5 Morale in my teamwork is generally high.
6 Repetitiveness in my tasks is generally high.
7 The job rotation policy in the company is enough to remove the repetitiveness in my tasks.
8 I get the sufficient trust when I need any help in my tasks.
9 I have musculoskeletal disorders due to my tasks.
10 The company provides healthy and good working environment.
11 The health and safety rights are available.
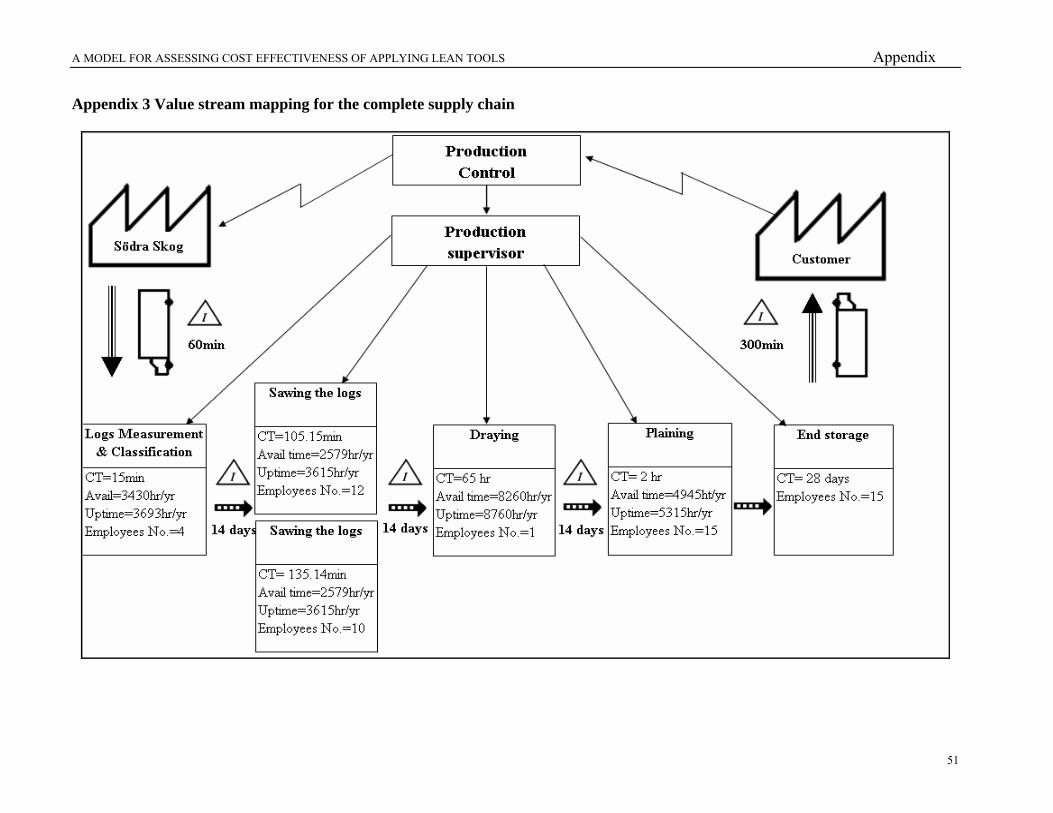
A MODEL FOR ASSESSING COST EFFECTIVENESS OF APPLYING LEAN TOOLS Appendix
51
Appendix 3 Value stream mapping for the complete supply chain

A MODEL FOR ASSESSING COST EFFECTIVENESS OF APPLYING LEAN TOOLS Appendix
52
Appendix 4 Value stream mapping in the sawmill
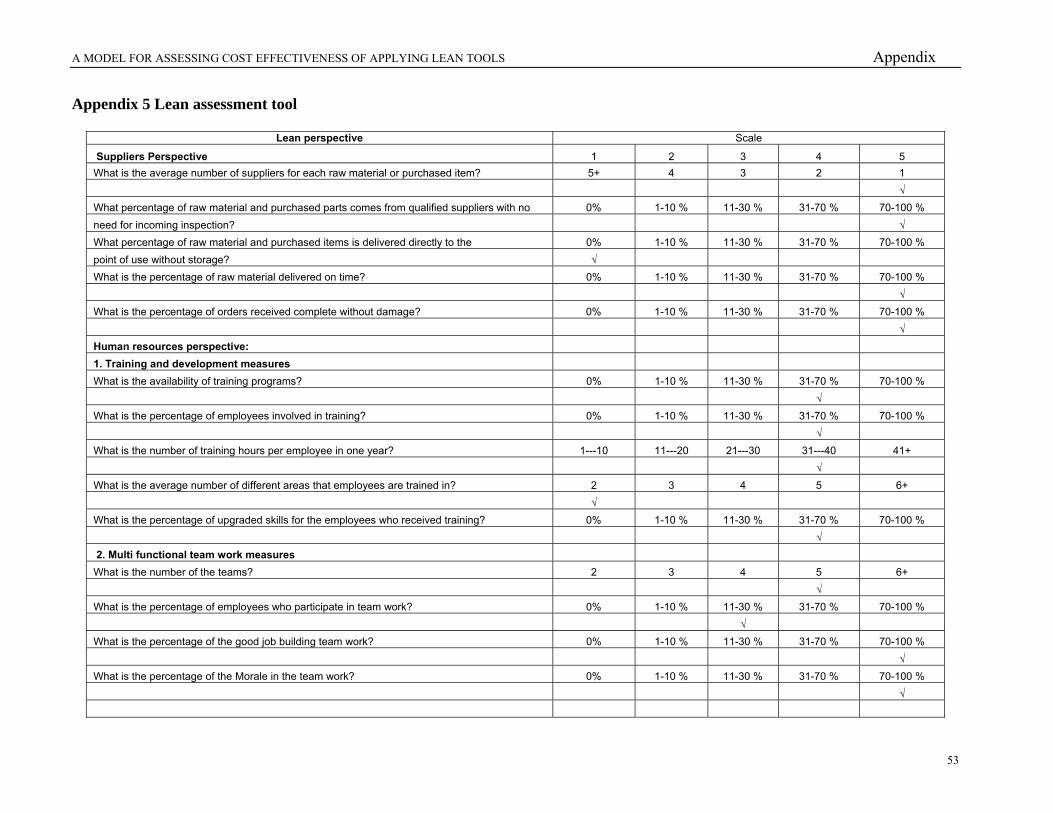
A MODEL FOR ASSESSING COST EFFECTIVENESS OF APPLYING LEAN TOOLS Appendix
53
Appendix 5 Lean assessment tool
Lean perspective Scale
Suppliers Perspective 1 2 3 4 5 What is the average number of suppliers for each raw material or purchased item? 5+ 4 3 2 1 √ What percentage of raw material and purchased parts comes from qualified suppliers with no 0% 1-10 % 11-30 % 31-70 % 70-100 % need for incoming inspection? √ What percentage of raw material and purchased items is delivered directly to the 0% 1-10 % 11-30 % 31-70 % 70-100 % point of use without storage? √ What is the percentage of raw material delivered on time? 0% 1-10 % 11-30 % 31-70 % 70-100 % √ What is the percentage of orders received complete without damage? 0% 1-10 % 11-30 % 31-70 % 70-100 % √ Human resources perspective: 1. Training and development measures What is the availability of training programs? 0% 1-10 % 11-30 % 31-70 % 70-100 % √ What is the percentage of employees involved in training? 0% 1-10 % 11-30 % 31-70 % 70-100 % √ What is the number of training hours per employee in one year? 1---10 11---20 21---30 31---40 41+ √ What is the average number of different areas that employees are trained in? 2 3 4 5 6+ √ What is the percentage of upgraded skills for the employees who received training? 0% 1-10 % 11-30 % 31-70 % 70-100 % √ 2. Multi functional team work measures What is the number of the teams? 2 3 4 5 6+ √ What is the percentage of employees who participate in team work? 0% 1-10 % 11-30 % 31-70 % 70-100 % √ What is the percentage of the good job building team work? 0% 1-10 % 11-30 % 31-70 % 70-100 % √ What is the percentage of the Morale in the team work? 0% 1-10 % 11-30 % 31-70 % 70-100 % √
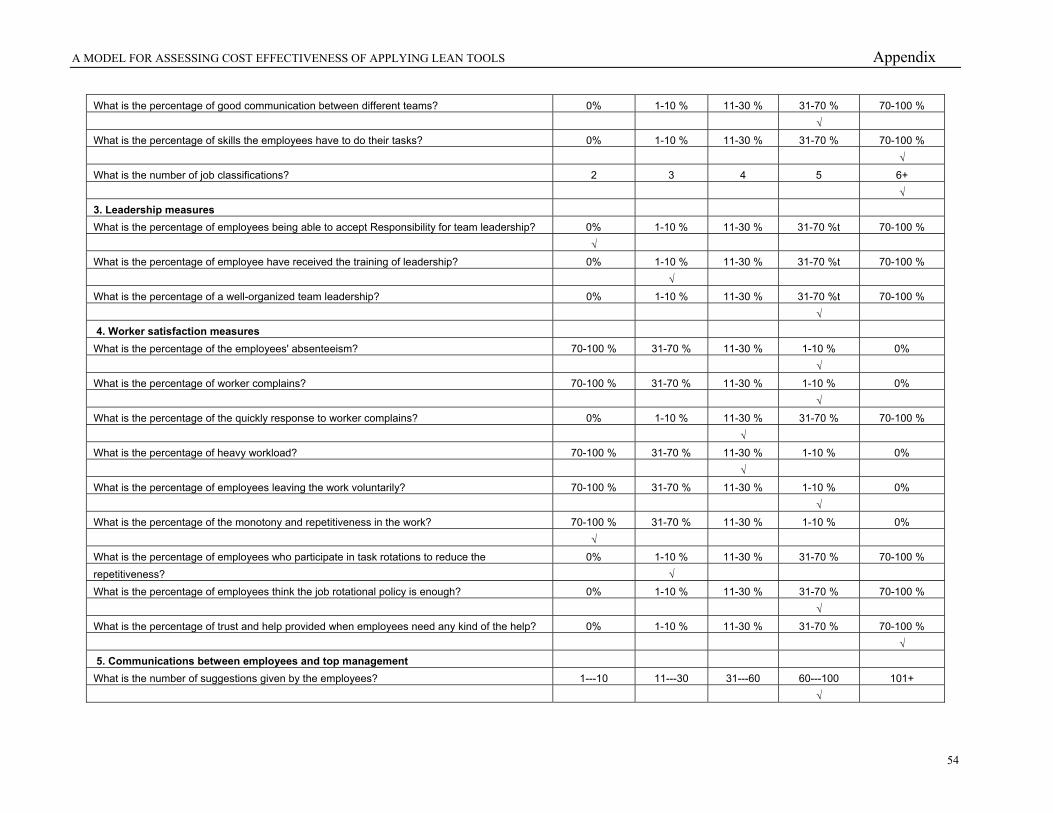
A MODEL FOR ASSESSING COST EFFECTIVENESS OF APPLYING LEAN TOOLS Appendix
54
What is the percentage of good communication between different teams? 0% 1-10 % 11-30 % 31-70 % 70-100 % √ What is the percentage of skills the employees have to do their tasks? 0% 1-10 % 11-30 % 31-70 % 70-100 % √ What is the number of job classifications? 2 3 4 5 6+ √ 3. Leadership measures What is the percentage of employees being able to accept Responsibility for team leadership? 0% 1-10 % 11-30 % 31-70 %t 70-100 % √ What is the percentage of employee have received the training of leadership? 0% 1-10 % 11-30 % 31-70 %t 70-100 % √ What is the percentage of a well-organized team leadership? 0% 1-10 % 11-30 % 31-70 %t 70-100 % √ 4. Worker satisfaction measures What is the percentage of the employees' absenteeism? 70-100 % 31-70 % 11-30 % 1-10 % 0% √ What is the percentage of worker complains? 70-100 % 31-70 % 11-30 % 1-10 % 0% √ What is the percentage of the quickly response to worker complains? 0% 1-10 % 11-30 % 31-70 % 70-100 % √ What is the percentage of heavy workload? 70-100 % 31-70 % 11-30 % 1-10 % 0% √ What is the percentage of employees leaving the work voluntarily? 70-100 % 31-70 % 11-30 % 1-10 % 0% √ What is the percentage of the monotony and repetitiveness in the work? 70-100 % 31-70 % 11-30 % 1-10 % 0% √ What is the percentage of employees who participate in task rotations to reduce the 0% 1-10 % 11-30 % 31-70 % 70-100 % repetitiveness? √ What is the percentage of employees think the job rotational policy is enough? 0% 1-10 % 11-30 % 31-70 % 70-100 % √ What is the percentage of trust and help provided when employees need any kind of the help? 0% 1-10 % 11-30 % 31-70 % 70-100 % √ 5. Communications between employees and top management What is the number of suggestions given by the employees? 1---10 11---30 31---60 60---100 101+ √

A MODEL FOR ASSESSING COST EFFECTIVENESS OF APPLYING LEAN TOOLS Appendix
55
What is the percentage of implemented suggestions? 0% 1-10 % 11-30 % 31-70 % 70-100 % √ What is the percentage of good communication between employees and managers? 0% 1-10 % 11-30 % 31-70 % 70-100 % √ What is the percentage of good response of the management to new suggestions? 0% 1-10 % 11-30 % 31-70 % 70-100 % √ What is the percentage of employees receiving feedback of their performance? 0% 1-10 % 11-30 % 31-70 % 70-100 % √ Production perspective What is the percentage of OEE? 0% 1-10 % 11-30 % 31-70 % 70-100 % √ What is the percentage of the time availability? 0% 1-10 % 11-30 % 31-70 % 70-100 % √ What is the percentage of the performance efficiency? 0% 1-10 % 11-30 % 31-70 % 70-100 % √ What is the percentage of the good quality rate? 0% 1-10 % 11-30 % 31-70 % 70-100 % √ What is the percentage of processing time with respect to the total lead-time? 0% 1-10 % 11-30 % 31-70 % 70-100 % √ What is the percentage of transportation time with respect to the total lead-time? 70-100 % 31-70 % 11-30 % 1-10 % 0% √ What is the percentage of waiting time in the buffer with respect to the total lead-time? 70-100 % 31-70 % 11-30 % 1-10 % 0% √ What is the average overall setup time (minutes/ day) for major equipment? 61+ 31---60 16---30 10---15 0---9 √ What is the overall Inventory Turn over, including finished goods, WIP, and raw material? 0---3 4---6 7--12 13---24 25+ √ What is the percentage of Value-added ratio? 0% 0-10 % 11-30 % 31-70 % 70-100 % √ What is the percentage of Non -Value-added ratio? 70-100 % 31-70 % 11-30 % 1-10 % 0% √ What is the percentage of total space is used for storage and material handling? 71-100 % 46-70 % 31-45 % 16-30 % 0-15% √
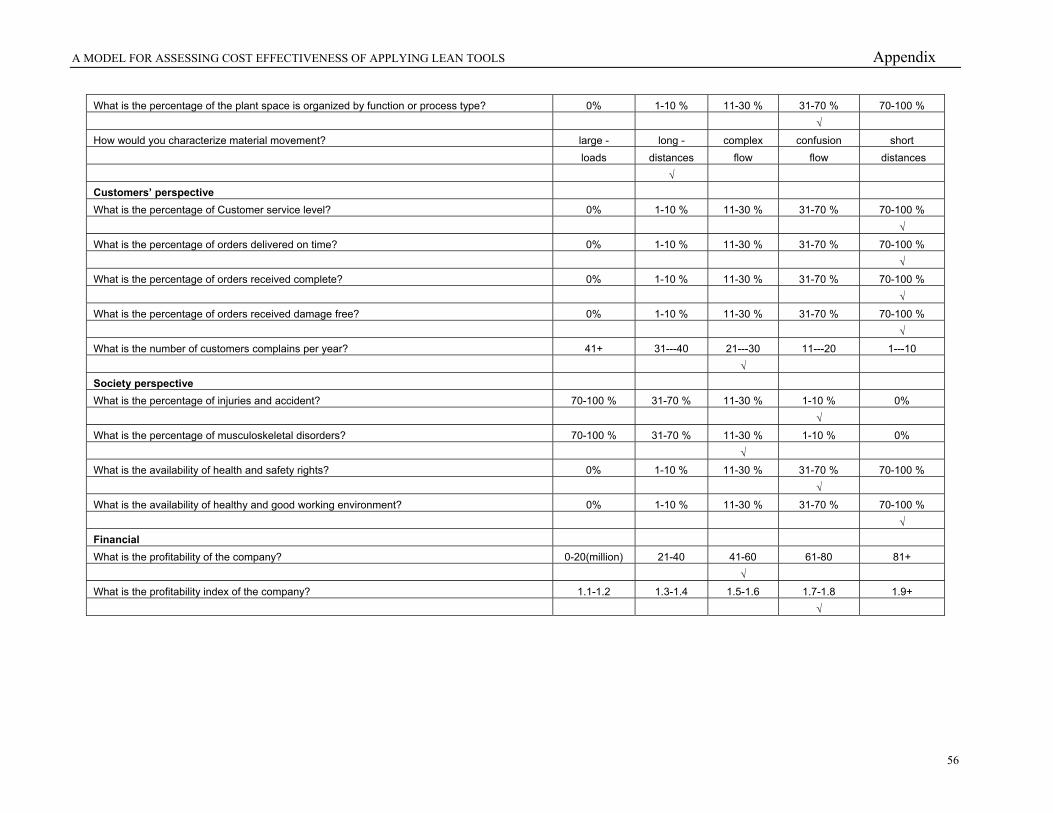
A MODEL FOR ASSESSING COST EFFECTIVENESS OF APPLYING LEAN TOOLS Appendix
56
What is the percentage of the plant space is organized by function or process type? 0% 1-10 % 11-30 % 31-70 % 70-100 % √ How would you characterize material movement? large - long - complex confusion short loads distances flow flow distances √ Customers’ perspective What is the percentage of Customer service level? 0% 1-10 % 11-30 % 31-70 % 70-100 % √ What is the percentage of orders delivered on time? 0% 1-10 % 11-30 % 31-70 % 70-100 % √ What is the percentage of orders received complete? 0% 1-10 % 11-30 % 31-70 % 70-100 % √ What is the percentage of orders received damage free? 0% 1-10 % 11-30 % 31-70 % 70-100 % √ What is the number of customers complains per year? 41+ 31---40 21---30 11---20 1---10 √ Society perspective What is the percentage of injuries and accident? 70-100 % 31-70 % 11-30 % 1-10 % 0% √ What is the percentage of musculoskeletal disorders? 70-100 % 31-70 % 11-30 % 1-10 % 0% √ What is the availability of health and safety rights? 0% 1-10 % 11-30 % 31-70 % 70-100 % √ What is the availability of healthy and good working environment? 0% 1-10 % 11-30 % 31-70 % 70-100 % √ Financial What is the profitability of the company? 0-20(million) 21-40 41-60 61-80 81+ √ What is the profitability index of the company? 1.1-1.2 1.3-1.4 1.5-1.6 1.7-1.8 1.9+ √
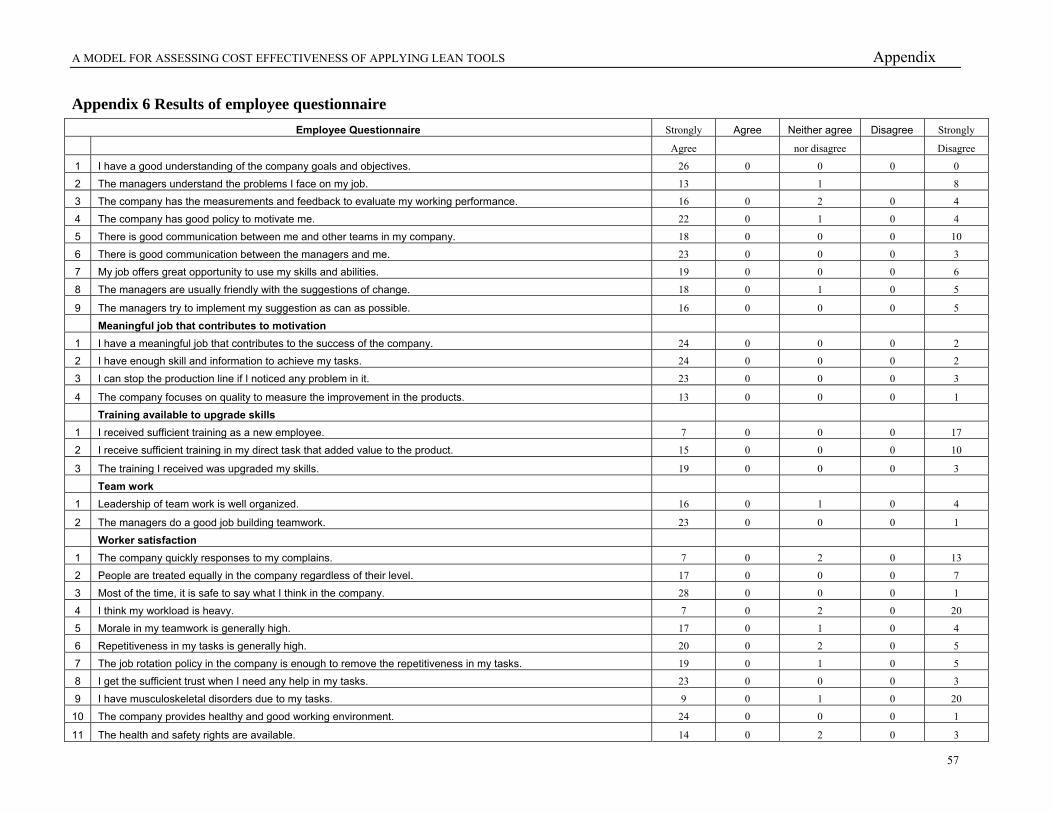
A MODEL FOR ASSESSING COST EFFECTIVENESS OF APPLYING LEAN TOOLS Appendix
57
Appendix 6 Results of employee questionnaire Employee Questionnaire Strongly Agree Neither agree Disagree Strongly
Agree nor disagree Disagree
1 I have a good understanding of the company goals and objectives. 26 0 0 0 0
2 The managers understand the problems I face on my job. 13 1 8
3 The company has the measurements and feedback to evaluate my working performance. 16 0 2 0 4
4 The company has good policy to motivate me. 22 0 1 0 4
5 There is good communication between me and other teams in my company. 18 0 0 0 10
6 There is good communication between the managers and me. 23 0 0 0 3
7 My job offers great opportunity to use my skills and abilities. 19 0 0 0 6
8 The managers are usually friendly with the suggestions of change. 18 0 1 0 5
9 The managers try to implement my suggestion as can as possible. 16 0 0 0 5
Meaningful job that contributes to motivation
1 I have a meaningful job that contributes to the success of the company. 24 0 0 0 2
2 I have enough skill and information to achieve my tasks. 24 0 0 0 2
3 I can stop the production line if I noticed any problem in it. 23 0 0 0 3
4 The company focuses on quality to measure the improvement in the products. 13 0 0 0 1
Training available to upgrade skills
1 I received sufficient training as a new employee. 7 0 0 0 17
2 I receive sufficient training in my direct task that added value to the product. 15 0 0 0 10
3 The training I received was upgraded my skills. 19 0 0 0 3
Team work
1 Leadership of team work is well organized. 16 0 1 0 4
2 The managers do a good job building teamwork. 23 0 0 0 1
Worker satisfaction
1 The company quickly responses to my complains. 7 0 2 0 13
2 People are treated equally in the company regardless of their level. 17 0 0 0 7
3 Most of the time, it is safe to say what I think in the company. 28 0 0 0 1
4 I think my workload is heavy. 7 0 2 0 20
5 Morale in my teamwork is generally high. 17 0 1 0 4
6 Repetitiveness in my tasks is generally high. 20 0 2 0 5
7 The job rotation policy in the company is enough to remove the repetitiveness in my tasks. 19 0 1 0 5
8 I get the sufficient trust when I need any help in my tasks. 23 0 0 0 3
9 I have musculoskeletal disorders due to my tasks. 9 0 1 0 20
10 The company provides healthy and good working environment. 24 0 0 0 1
11 The health and safety rights are available. 14 0 2 0 3
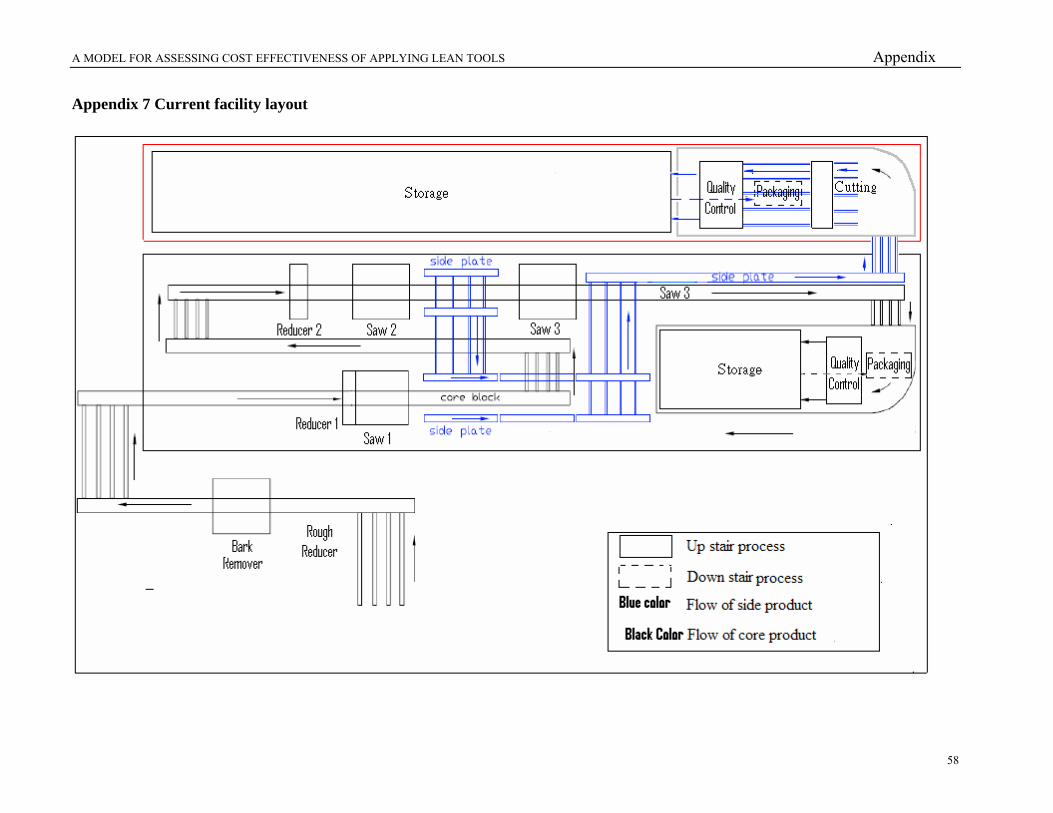
A MODEL FOR ASSESSING COST EFFECTIVENESS OF APPLYING LEAN TOOLS Appendix
58
Appendix 7 Current facility layout
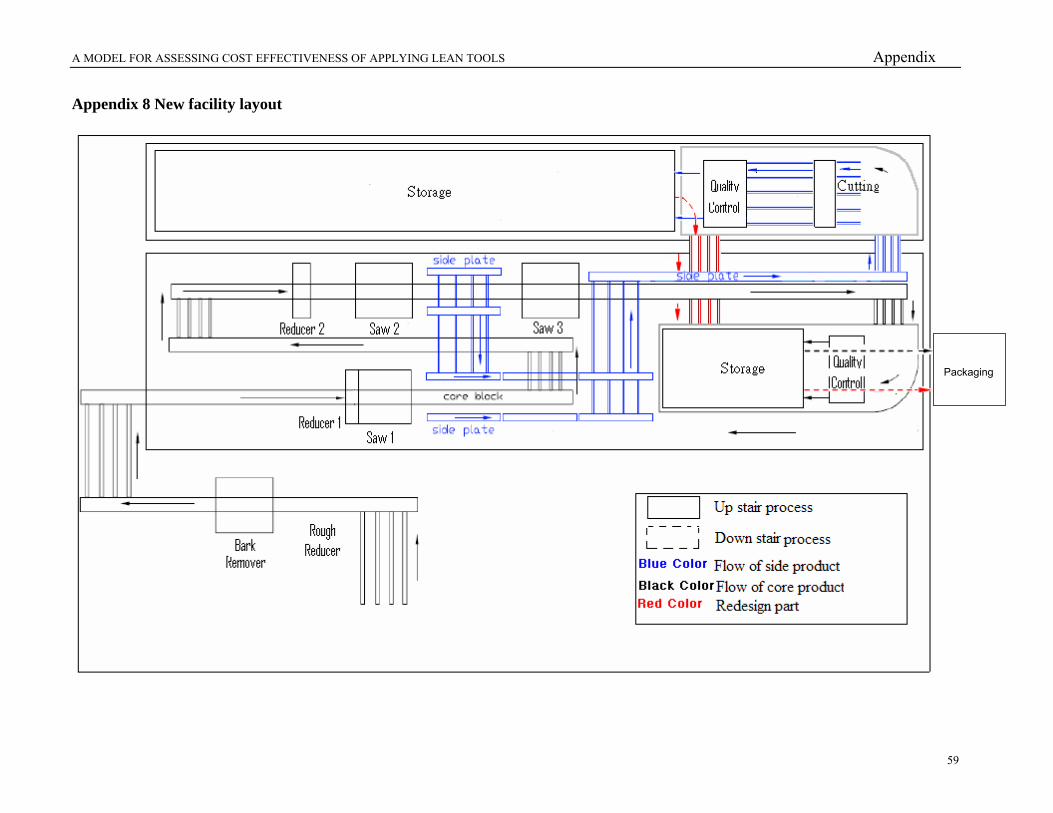
A MODEL FOR ASSESSING COST EFFECTIVENESS OF APPLYING LEAN TOOLS Appendix
59
Appendix 8 New facility layout
Packaging
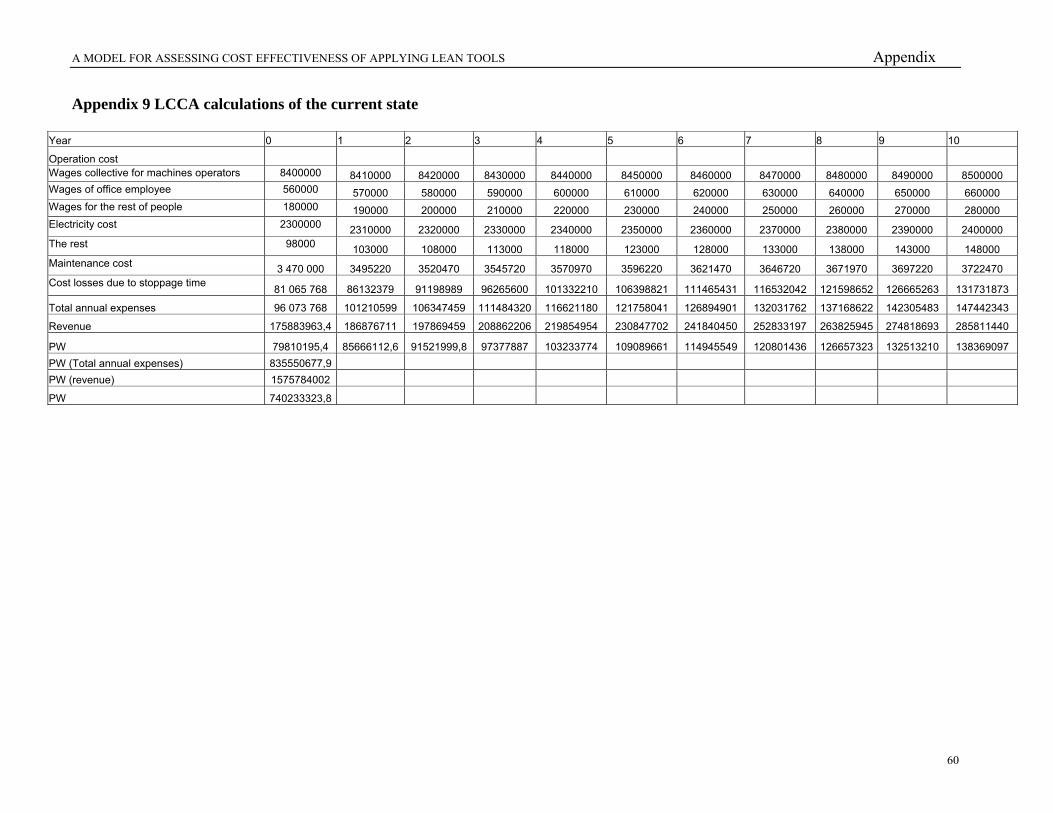
A MODEL FOR ASSESSING COST EFFECTIVENESS OF APPLYING LEAN TOOLS Appendix
60
Appendix 9 LCCA calculations of the current state
Year 0 1 2 3 4 5 6 7 8 9 10
Operation cost Wages collective for machines operators 8400000 8410000 8420000 8430000 8440000 8450000 8460000 8470000 8480000 8490000 8500000 Wages of office employee 560000 570000 580000 590000 600000 610000 620000 630000 640000 650000 660000 Wages for the rest of people 180000 190000 200000 210000 220000 230000 240000 250000 260000 270000 280000 Electricity cost 2300000 2310000 2320000 2330000 2340000 2350000 2360000 2370000 2380000 2390000 2400000 The rest 98000 103000 108000 113000 118000 123000 128000 133000 138000 143000 148000 Maintenance cost 3 470 000 3495220 3520470 3545720 3570970 3596220 3621470 3646720 3671970 3697220 3722470 Cost losses due to stoppage time 81 065 768 86132379 91198989 96265600 101332210 106398821 111465431 116532042 121598652 126665263 131731873
Total annual expenses 96 073 768 101210599 106347459 111484320 116621180 121758041 126894901 132031762 137168622 142305483 147442343
Revenue 175883963,4 186876711 197869459 208862206 219854954 230847702 241840450 252833197 263825945 274818693 285811440
PW 79810195,4 85666112,6 91521999,8 97377887 103233774 109089661 114945549 120801436 126657323 132513210 138369097 PW (Total annual expenses) 835550677,9 PW (revenue) 1575784002
PW 740233323,8
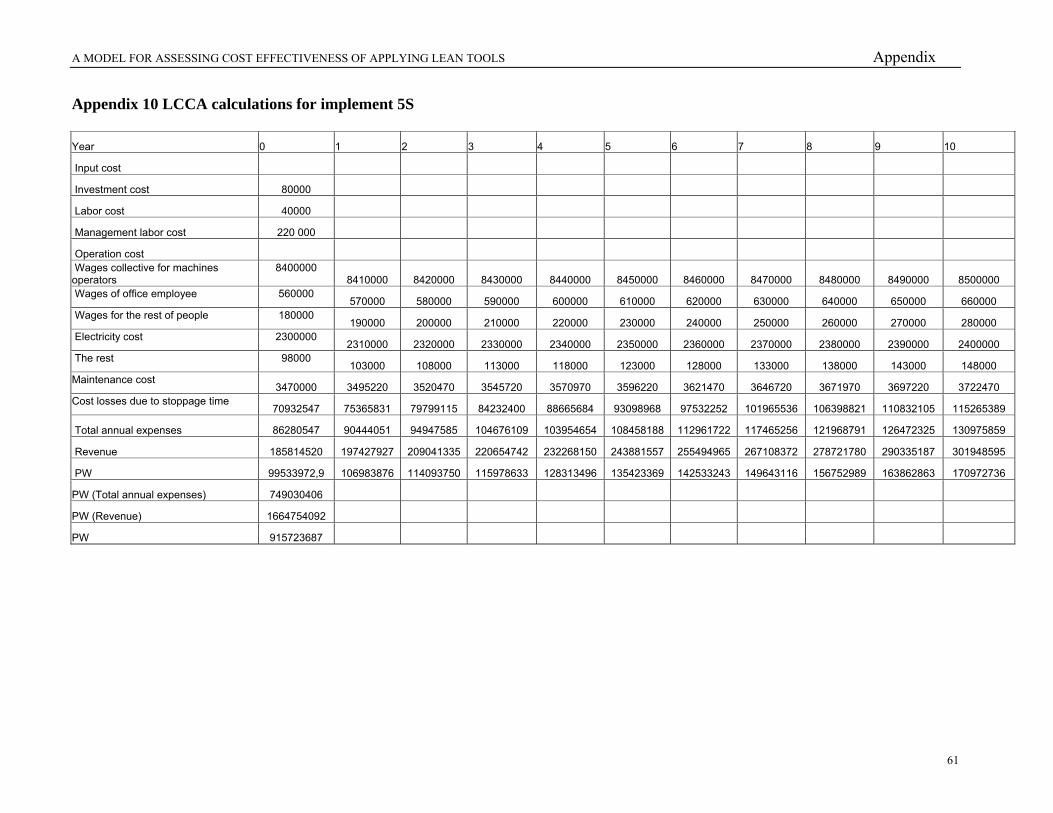
A MODEL FOR ASSESSING COST EFFECTIVENESS OF APPLYING LEAN TOOLS Appendix
61
Appendix 10 LCCA calculations for implement 5S Year 0 1 2 3 4 5 6 7 8 9 10
Input cost
Investment cost 80000
Labor cost 40000
Management labor cost 220 000
Operation cost Wages collective for machines operators
8400000 8410000 8420000 8430000 8440000 8450000 8460000 8470000 8480000 8490000 8500000
Wages of office employee 560000 570000 580000 590000 600000 610000 620000 630000 640000 650000 660000
Wages for the rest of people 180000 190000 200000 210000 220000 230000 240000 250000 260000 270000 280000
Electricity cost 2300000 2310000 2320000 2330000 2340000 2350000 2360000 2370000 2380000 2390000 2400000
The rest 98000 103000 108000 113000 118000 123000 128000 133000 138000 143000 148000
Maintenance cost 3470000 3495220 3520470 3545720 3570970 3596220 3621470 3646720 3671970 3697220 3722470
Cost losses due to stoppage time 70932547 75365831 79799115 84232400 88665684 93098968 97532252 101965536 106398821 110832105 115265389
Total annual expenses 86280547 90444051 94947585 104676109 103954654 108458188 112961722 117465256 121968791 126472325 130975859
Revenue 185814520 197427927 209041335 220654742 232268150 243881557 255494965 267108372 278721780 290335187 301948595
PW 99533972,9 106983876 114093750 115978633 128313496 135423369 142533243 149643116 156752989 163862863 170972736
PW (Total annual expenses) 749030406
PW (Revenue) 1664754092
PW 915723687
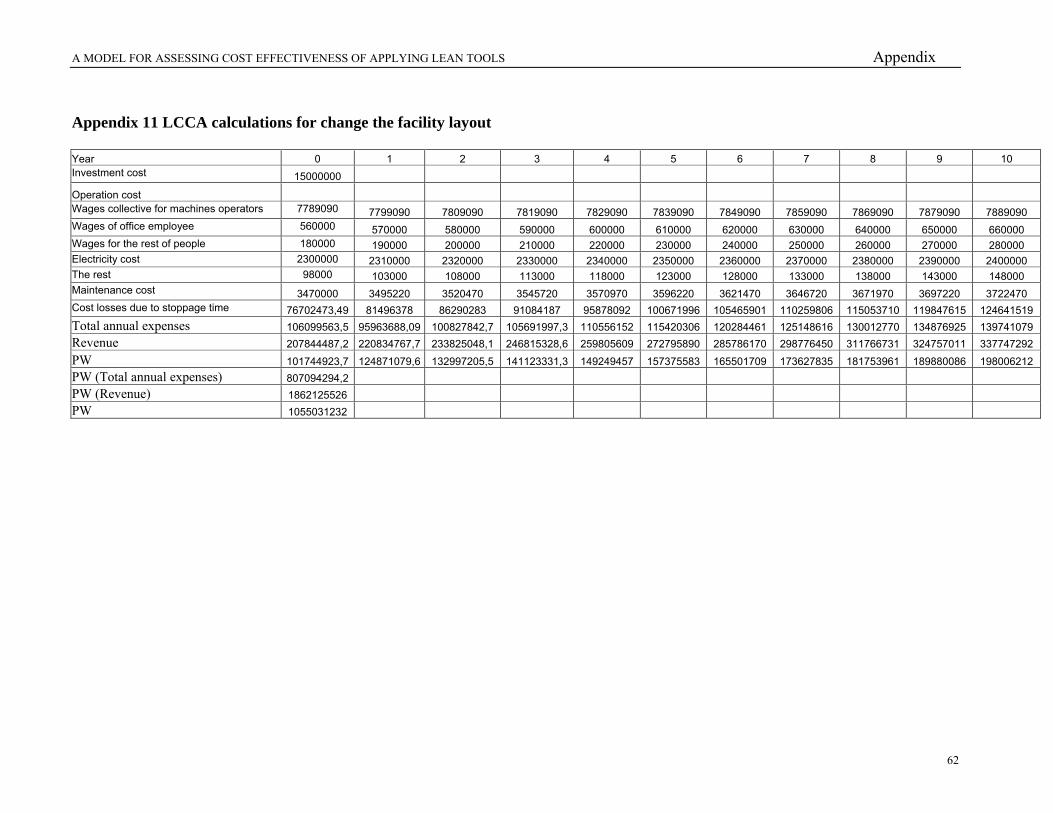
A MODEL FOR ASSESSING COST EFFECTIVENESS OF APPLYING LEAN TOOLS Appendix
62
Appendix 11 LCCA calculations for change the facility layout Year 0 1 2 3 4 5 6 7 8 9 10 Investment cost 15000000
Operation cost Wages collective for machines operators 7789090 7799090 7809090 7819090 7829090 7839090 7849090 7859090 7869090 7879090 7889090 Wages of office employee 560000 570000 580000 590000 600000 610000 620000 630000 640000 650000 660000 Wages for the rest of people 180000 190000 200000 210000 220000 230000 240000 250000 260000 270000 280000 Electricity cost 2300000 2310000 2320000 2330000 2340000 2350000 2360000 2370000 2380000 2390000 2400000 The rest 98000 103000 108000 113000 118000 123000 128000 133000 138000 143000 148000 Maintenance cost 3470000 3495220 3520470 3545720 3570970 3596220 3621470 3646720 3671970 3697220 3722470 Cost losses due to stoppage time 76702473,49 81496378 86290283 91084187 95878092 100671996 105465901 110259806 115053710 119847615 124641519 Total annual expenses 106099563,5 95963688,09 100827842,7 105691997,3 110556152 115420306 120284461 125148616 130012770 134876925 139741079 Revenue 207844487,2 220834767,7 233825048,1 246815328,6 259805609 272795890 285786170 298776450 311766731 324757011 337747292 PW 101744923,7 124871079,6 132997205,5 141123331,3 149249457 157375583 165501709 173627835 181753961 189880086 198006212 PW (Total annual expenses) 807094294,2 PW (Revenue) 1862125526 PW 1055031232