a model to study the grain size components of the sediment...
TRANSCRIPT
Sedimentary Geology 330 (2015) 132–140
Contents lists available at ScienceDirect
Sedimentary Geology
j ourna l homepage: www.e lsev ie r .com/ locate /sedgeo
Amodel to study the grain size components of the sediment deposited inaeolian–fluvial interplay erosion watershed
Xiang Zhang a, Zhanbin Li a,b, Peng Li a,⁎, Shengdong Cheng a, Yang Zhang a, Shanshan Tang a, Tian Wang a
a State Key Laboratory Base of Eco-hydraulic Engineering in Arid Area, Xi'an University of Technology, Xi'an 710048, Shaanxi, PR Chinab State Key Laboratory of Soil Erosion and Dryland Farming on the Loess Plateau, Chinese Academy of Sciences and Ministry of Water Resources, Yangling, Shaanxi 712100, China
⁎ Corresponding author at: State Key Laboratory BaseArid Area, Xi'an University of Technology, Xi'an 710048China. Tel.: +86 13519173826.
E-mail addresses: [email protected] (X. [email protected] (P. Li), [email protected] (S. Cheng), p(Y. Zhang), [email protected] (S. Tang), wthuanjing
http://dx.doi.org/10.1016/j.sedgeo.2015.10.0020037-0738/© 2015 Elsevier B.V. All rights reserved.
a b s t r a c t
a r t i c l e i n f oArticle history:Received 30 June 2015Received in revised form 6 October 2015Accepted 7 October 2015Available online 19 October 2015
Editor: Dr. B. Jones
Keywords:Aeolian–fluvial interplay erosionDeposited sedimentsGrain size distributionWeibull distribution
Aeolian–fluvial interplay erosion areas with complex dynamics and physical sources are the main suppliers ofcoarse sediment in the Yellow River. Understanding the composition, distribution, and sources of deposited sed-iments in such areas is of great importance for the control of sediment transport in rivers. In this paper, a typicalaeolian–fluvial interplay erosion watershed – the Dongliu Gully – was studied and the frequency distributioncurves of sediments deposited in the stream channelwere fitted using theWeibull function. Sources of depositedsediment in the stream channel were analyzed based on the law of the conservation of matter. Results showedthat the hilly zone accounted for 78% of deposited sediments, which were dominated bymaterial with a mediangrain size (d50) of 0.093 mm, and the desert zone accounted for 22% of deposited sediments, which were domi-nated by material with a d50 of 0.01 mm. Wind erosion dynamics accounted for 72% of deposited sediments,while water erosion dynamics accounted for only 28%. This research provides a theoretical basis for the controland management of rivers with high sediment content.
© 2015 Elsevier B.V. All rights reserved.
1. Introduction
The unique topographies, landforms, and climatic conditions ofnorthwestern China, particularly in its desert areas, have led to substan-tial transportation and accumulation of aeolian dust in the region(Derbyshire et al., 1998). Deserts of southern Mongolia are the domi-nant sources of aeolian sediments in the Loess Plateau (Sun, 2002) aswell as in the East China Sea, Japan, and northern Pacific Ocean (Rea,1994). Subjected to bothwind andwater erosion dynamics, northwest-ern China is, in fact, a considerable source of global dust production(Goudie and Middleton, 2006).
The Yellow River, which is famous for its high sediment concentra-tion, flows through the Tengger, Ulanbuh, Muus, and Kubuqi desertsof northwestern China. The coarse sediments deposited in the lowerreaches of the Yellow River are mainly from the upstream andmidstream aeolian–fluvial interplay erosion areas of the watershed(Xu, 2014). Therefore, research on sediments from aeolian–fluvialinterplay erosion areas is important for understanding and possiblycontrolling sediment transport in rivers.
of Eco-hydraulic Engineering in, Shaanxi, People's Republic of
g), [email protected] (Z. Li),[email protected]@126.com (T. Wang).
When studying erosion,most researchers have focused onwind andwater erosion separately. In terms of wind erosion, the characteristicsand sources of grain size in dunes (Hamdan et al., 2015) and the identi-fication of geological transport processes are widely used (Muhs, 2004),while water erosion mechanisms are often testified and verified by im-itation rainfall experiments and models (Xu et al., 2015; Cuomo andDella Sala, 2013). However, soil erosion in areas of aeolian–fluvial inter-action exhibits more intense and complex characteristics than single-type erosion due to the temporal and spatial interplay superpositionof erosion dynamics and diversity of material sources (Harvey, 2001),which explains the large amount of coarse-grain material that entersthe Yellow River from such areas.
Currently, studies on aeolian–fluvial interplay erosion have focusedon the interaction between aeolian sand and runoff (Thomas et al.,1997), modes of dune material entering rivers (Xu et al., 2006), andthe influence of runoff (Harrison and Yair, 1998). Most research effortsrelate to qualitative descriptions of the relationships and principles ofinteractions between wind and water erosion, with few identifyingthe sources of sediment. Little research effort has beenmade on thema-terial sources and dynamic drivers of sediments in stream channels ofaeolian–fluvial interplay erosion areas, and large gaps still remain inregards tomaterial sources and dynamic formationmechanisms of sed-iment transport.
Sediment grain size distribution characteristics are not only closelycorrelated with their sedimentary environments (Peng et al., 2005)but can also provide direct information on changes in material sources,transportation mechanisms, and the environment (Friedman and

133X. Zhang et al. / Sedimentary Geology 330 (2015) 132–140
Sanders, 1978). Analysis of sediment grain size is usually applied tostudy the sedimentary environment, processes, and material sourcesand can also be used to infer the mode of sediment transport as an im-portant index of environmental impact (Christiansen et al., 1984;Ghoshal et al., 2010, 2011; Miousse et al., 2003; Purkait, 2006, 2010;Visher, 1969; Wang et al., 2003). Thus, the analysis of textural parame-ters is the basis for determining the process-response characteristics ofindividual sediment units and ascertaining the material sources anderosion dynamics of sediments (Zhu et al., 2014).
At present, assessment of sediment sources through grain sizedistribution is primarily used in the analysis of settled lake sedi-ments composed of material carried by either wind or runoff (Xiaoet al., 2013). This is because sediment sources are relatively distinctdue to different erosion dynamics resulting in different grain sizes.For example, Sun et al. (2002) employed the Weibull function to an-alyze the grain size distribution characteristics of lake sediments,while Weltje and Prins (2007) used an end-member model whichwas proposed by Weltje (1997) to analyze the material sources oflake sediments.
Similar to lakes, dune aeolian–fluvial interplay erosion areas in semi-arid regions are formed by two kinds of erosion forces, i.e., consecutivelyoccurring wind and water, and the interaction of two materials,i.e., desert and hilly zone material (Bullard and McTainsh, 2003; Taet al., 2008). Sediments are deposited in seasonal stream channelsduring arid seasons due to high-frequency and low-energy wind ero-sion activities, while during the rainy season, high-energy and low-frequency water erosion activities predominate (Kocurek, 1998).When a desert crosses a stream or river, sands will enter the channelthrough aeolian sand flow, river settling, river bank collapse, dunemovement and aeolian–fluvial interplay erosion, and the sedimentcharacteristics of the channel are thereby changed (Bullard andMcTainsh, 2003; Langford, 1989; Xu et al., 2006). Grain size characteris-tics of sediment driven by wind erosion differ from those of sedimentdriven by water erosion, and sediment grain size in desert zones alsodiffer from that in hilly zones (Zhu et al., 2014).
Therefore, based on the sediment deposited in the stream chan-nel of the Dongliu Gully watershed, a typical aeolian–fluvial inter-play erosion area in northeast China, the grain size characteristicsof deposited sediment were quantitatively analyzed to construct amodel to investigate the sources andmain drivers of sediment enter-ing the Yellow River. Sample points representing different sedimentsources according to grain size characteristics were analyzed andtheir frequency distribution curves were determined. The sourcesof other deposited samples were then fitted based on the law of theconservation of matter. Themain source zones and erosion dynamicsof sediment deposited in the Dongliu Gully were further distin-guished in the Yellow River.
2. Data and methods
2.1. Study area
Dongliu Gully is located in the eastern ten-freshet-ditch area, a semi-arid region in Dalad Banner of the Inner Mongolia Autonomous Region(Fig. 1). The Dongliu Gully watershed has a typical continental climate,with long, cold winters and short, hot summers. The mean annual tem-perature is about 6 °C, with a maximum of 40.2 °C and minimum of−34.5 °C. Annual precipitation is 240–360mm, and annual evaporationcapacity is 2200 mm. Runoff is primarily recharged by floods followingheavy rain,with rainfall occurringmainly in the formof storms. The pre-cipitation in July–August accounts for 50–60% of annual precipitation. Inaddition, gale weather often occurs in March–May of every year,resulting in an average of 24 gale days per year and maximum windspeeds of 28 m/s.
Dongliu Gully has an overall stream channel length of 75.4 km and awatershed area of 451.2 km2. The upstreamwatershed area is located in
the half-farming and half-pastoral loess hilly and gully region of theOrdos Plateau; in the midstream area is located where the KubuqiDesert crosses the watershed from west to east; and the downstreamarea is located in a diluvial–alluvial plain. The soil in the hilly zone hasa loamy texture, loose structure, and strong water permeability. Thefixed, semi-fixed, and shifting aeolian sandy soil in the desert zone hasa fine and silty texture, loose structure, and relatively thick soil layer.The downstream area is primarily stationary farmland consisting offlat terrain and fertile soil, with crops such as corn widely planted.
2.2. Sediment samples and grain size analysis
In April 2014, samples were taken from the sediments deposited inthe stream channel and on its slopes at 78 sites within the DongliuGully watershed. Sediment samples at each point were collected to adepth of 30 cm below the surface layer. In addition, 15 suspendedload samples were taken from runoff near the entrance to the YellowRiver. Sample points are shown in Fig. 1a–d.
Grain size analysis of the sediment samples was conducted using aMalvern Mastersizer 2000 laser grain size analyzer (Malvern, UK).Visible impurities contained in each sample were eliminated and thesamples were then air-dried and sieved using a 2 mm sieve. Eachsample (200 mg) was placed into a beaker, after which 10 ml of 30%hydrogen peroxide was added, followed by heating, then 10 ml of 10%hydrochloric acid was added, followed by heating until boiling. Afterfully injecting water, the beakers were allowed to stand for 12 hours,and subsequently 10 ml of 0.05 M sodium hexametaphosphatesolution was added. Each beaker was then placed into an ultrasonicvibrator for 5 minutes, after which the grain size of the sedimentwas determined.
2.3. Fitting grain size components
Thegrain size distribution of single-component deposited sedimentscan be expressed as a unimodal distribution diagram. If the distributionfunction of a grain size is polymodal, then the polymodal distribution isformed by the superposition of multiple unimodal functions; in otherwords, the grain size is composed of multiple single-componentdeposited sediments.
Fitting grain size distribution is widely used in the analysis of sedi-ment sources (Sun et al., 2001; Sun et al., 2002; Qin et al., 2005; Yiet al., 2012; Xiao et al., 2013), three types of functions are usually ap-plied for fitting grain size distribution: Normal function (Sun et al.,2001), Lognormal function (Qin et al., 2005; Xiao et al., 2013), andWeibull function (Sun et al., 2002; Yi et al., 2012). The skewness of Nor-mal function is zero, which makes the Normal function is not feasibleenough to for a variety of grain size distributions of various sediments(Sun et al., 2001). Sun et al. (2002) compared the Weibull functionwith the Lognormal function in fitting aeolian and hydraulic sediments,and the result showed that theWeibull function which yields better fitsnot only for aeolian loess, desert sand, and aeolian dust in deep-sea sed-iment, but also for river and lake sediments, while the Lognormal func-tion only yields acceptable results for some fluvial and lacustrinesamples. Yi et al. (2012) demonstrated that the grain size of surfaceand core samples can be mathematically partitioned using the Weibulldistribution. Therefore, the Weibull function which performs well inaeolian–fluvial interplay erosion watershed will be chosen to fit thegrain size distribution of deposited sediments.
The Weibull function's probability density function is expressed as
f x;λ; kð Þ ¼ kλ
xλ
� �k−1e− x=λð Þk ; x ≥ 0
f x;λ; kð Þ ¼ 0; x b 0ð1Þ
where x is a random variable that represents the grain size componentsof the deposited sediments in Dongliu Gully, λ is a scale parameter, and

Fig. 1. Geographic location and sample points in the study area.
134 X. Zhang et al. / Sedimentary Geology 330 (2015) 132–140
k is a shape parameter. Each unimodal component can be describedwith sufficient accuracy by the Weibull distribution function, and thedistribution of polymodal sediments that consist of several unimodalcomponents is the mixed grain size distribution of the unimodal com-ponent. Assuming that function f(x; λ, k) has three possible sources,i.e., f1(x; λ, k), f2(x; λ, k), and f3(x; λ, k), then the following relationshipshould be satisfied:
f x;λ; kð Þ ¼ af 1 x1;λ1; k1ð Þ þ bf 2 x2;λ2; k2ð Þ þ cf 2 x2;λ2; k2ð Þaþ bþ c ¼ 1 ð2Þ
The fitting residual is calculated as
dF ¼ 1m
Xm
i¼1
F xj� �
−G xj� �� �2 ð3Þ
The coefficient of determination is expressed as:
R2 ¼ 1−
Xm
i¼1
F xið Þ−G xið Þð Þ2
Xm
i¼1
G xið Þ−G xð Þ� �2
ð4Þ
wherem is the number of grain size intervals, F(xi) is the fitted percent-age of the ith grain size interval, G(xi) is the measured percentage of theith grain size interval, and GðxÞ is the mean percentage of all grain sizeintervals. A lower value of dF indicates a better fitting result, and if thefitted percentages agree well with the measured percentages, the R2
value will be close to 1. In our research, the representative samples ofthe unimodal componentswere gathered and grouped. The distributionparameters of theWeibull function for the unimodal components werefirstly estimated by the least squares technique to ensure the residualdifference between the measured and fitted values reached its mini-mum, then the percentage parameters for the polymodal sediments

Table 1Sediment content (%) graded by grain size in the stream channel within different water-shed zones.
Zone N0.05 mm 0.05–0.002 mm b0.002 mm
Hilly 91.84 7.5 0.66Desert 88.36 10.8 0.84Farmland 81.06 16.82 2.12Suspended load 2.47 79.23 18.30
135X. Zhang et al. / Sedimentary Geology 330 (2015) 132–140
were determined by the least squares technique. The coefficients of de-termination between fitted and measured percentages were calculatedto measure the capability of the fitted distribution.
3. Results
3.1. Analysis of sedimentary characteristics of the watershed
According to the sample points layout, themedian grain size charac-teristics of the sediments deposited from the upper to lower reaches ofthe Dongliu Gully were analyzed (Fig. 2). The watershed was dividedinto three zones from upstream to downstream on the basis of the dis-tance to the gully head, i.e., hilly zone (0–20 km), desert zone (20–38 km), and farmland zone (38–65 km). Broken hills and movingdunes existed on the banks of the stream channel in the hilly and desertzones, respectively. Thus, the channel was considered a typical valleystream channel, with a width of about 200–400 m. The stream in thefarmland zone was only 2–3 m wide and crops such as corn wereplanted on both sides.
The components and grain size distributions of the sedimentsdeposited in the aeolian–fluvial interplay area are changed along thewatershed, themedian grain size d50 is related to the critical shear stressof sediment and can be used to determine the sediment supply rate bythe difference between predicted and observed median grain sizes(Buffington and Montgomery, 1999); therefore d50 is used to detectthe change point of the deposited sediment in our research. It shouldbe noted that the d50 is not the best parameters of describing hydraulicsediments when sample sediments are greatly skewed (Green, 2003).
The sediment grain sizes in thewatershedwere concentratedwithintwo ranges: relatively coarse deposited sediments (0.25–0.6mm, meand50 of 0.47mm)mainly distributed in the hilly zone at the starting pointof the upper reaches to about 20 km from the gully head; and relativelyfine deposited sediments (0.1–0.2 mm, mean d50 of 0.18 mm) mainlydistributed 20–60 km from the gully head where the gradient becamegentle.
Sediment content (%) graded by grain size in the stream channelwithin different zones is shown in Table 1. The grain size compositioncharacteristics variedwithin the zones and from those in the suspendedload in the Dongliu Gully watershed. Sand was the main component ofsediment deposited in the whole watershed, accounting for 87.09% onaverage, though its content decreased upstream to downstream. Con-versely, silt was the main component of sediment in the suspendedload, accounting for 79.23%, with sand accounting for only 2.47%. Thisindicated that sediments entering the Yellow River through runoffwere primarily composed of silt and clay, and the material depositedin the stream channel was mainly sand.
Fig. 2. (a) Relationship betweenmedian grain size anddistance of deposited sediments to gully hin the three regions.
Mann–Whitney rank sum test was conducted based on the d50
values of the deposited sediments (Yue and Wang, 2002), and resultsare shown in Fig. 3. In the figure, the abscissa denotes the samplepoint numbers from the upper to lower reaches, and the ordinatedenotes the normal distribution point |Zu| of the rank statistic U.Furthermore, the square indicates the change point of the sedimentsdeposited in the stream channel, which occurred at sample point 17, lo-cated 18 km from sample point 1 at the gully head. As also seen in Fig. 2,sample point 17was thefirst to exhibit amedian grain size of b0.15mmand was thus located in the zone where sediment grain sizes firstchanged significantly.
Several samples with typical grain size distribution characteristicswere selected as the end members of different erosion dynamics andmaterial sources (Xu et al., 2010). The processes of change in regardsto material composition, erosion dynamics, and material source in thedeposited sediments were analyzed, with grain size distribution at thetypical sample points taken as the basic source of sediments depositedin other gullies.
3.2. Grain characteristics of erosion sediment sources in the watershed
Based on the watershed zones, end-member representative samplepoints were selected in the hilly and desert zones to analyze the depos-ited sediment sources. For sample point analysis, three typical samplepoints were selected for calculation. Each typical sample point included8–9 sample points with similar frequency distribution curves.
Sediment samples from the stream channel within the hilly zone(S1): Sediment sampleswere collected to a depth of 30 cm in the streamchannel. This sediment was deposited under the joint effects of waterand wind erosion.
Wind erosion sediment samples from the stream channel in the hillyzone (S2): Using a brush, sediment samples were collected from thesurface layer (about 0.1 cm) of the stream channel and from the surfacelayer of the slopes on both banks at the same position. Samples werecollected at the end of the windy season but before the start of the
ead; (b) relationship between elevation and distance of deposited sediments to gully head

Fig. 3. Analysis of change point of deposited sediments in the Dongliu Gully.
Fig. 4. Grain size frequency distribution curves of various components: C1 component, i.e.hilly material deposited in the stream channel by water erosion; C2 component, i.e. hillymaterial deposited in the stream channel by wind erosion; and C3 component, i.e. desertmaterial deposited in the stream channel by wind erosion.
136 X. Zhang et al. / Sedimentary Geology 330 (2015) 132–140
rainy season, and thus this sediment was deposited under the effect ofwind erosion.
Dune sediment samples in the desert zone (S3): Samples were col-lected from the dune tops and to a depth of 30 cm in the slope surfacelayer on both banks in themidstream desert zone. These samples repre-sented dunematerial entering the stream channel due to wind erosion.
The selection results and characteristics of typical sample points aregiven in Table 2. In the three typical sample points, the S1 samples wererelatively coarse andhad themaximumgrain size range, S2 samples hadthe smallest grain size, and S3 samples had grain sizes with the mostconcentrated distribution. All typical sample points had negative skew-ness, indicating that sediment grain size in the streamchannel tended tobe larger than the mean sediment grain size, and fine grains weretransported to the lower reaches of the river. The S3 dune samplesshowed a relatively small negative skewness trend since they weremainly subjected to wind erosion and had relatively uniform grainsize. The kurtoses of the samples were narrow (1.11–1.50) to very nar-row (1.50–3.00). The S1 samples had the largest sorting coefficients, in-dicating that the exogenic force on the sediment samples in the streamchannelwas relatively complex; the S3 samples had the smallest sortingcoefficients, indicating that the erosion force on the samples from thedesert zonewas relatively simple. The differences in kurtoses, skewness,and sorting coefficients were mainly caused by different sources anddynamic effects of the deposited sediments.
We concluded that the differences between S1 and S2 were the de-position of hilly material (C1) in the stream channel by water erosionand S2 represented deposition of hillymaterial (C2) in the stream chan-nel by wind erosion, while the S3 samples consisted of desert material(C3) deposited in the streamchannel bywind erosion. These three com-ponents, i.e., C1, C2, and C3, represented the coupling effects of two dif-ferent material sources and two different erosion dynamics in thewatershed. Therefore, they can be regarded as the sources of sedimentdeposited in the stream channel.
Table 2Parameters of typical sample points.
Samples Number ofsamples
Modal size (mm) Skewness
Min Max Min Max
S1 8 0.390 0.561 −0.5 1.29S2 8 0.074 0.155 −0.42 1.10S3 9 0.140 0.200 −0.34 0.46
3.3. Analysis of deposited sediment sources
The Weibull distribution was fitted to describe the grain size distri-bution of C1, C2, and C3. For C2 and C3, the empirical grain size distribu-tion was directly determined based on S2 and S3 samples, respectively,and the percentages of each grain size interval were equal to the meanvalue of the S2 and S3 samples, respectively. The C2 and C3Weibull dis-tribution parameters were then estimated by least squares to minimizethe fitting residual. The grain size distribution of S1 was composed ofthe grain size distribution of C1 and C2, but for each S1 sample, thepercentages of C1 and C2 were different, thus the parameters of C1and its percentages for each S1 sample were estimated to minimizethe summation of the fitting residual of all S1 samples.
The frequency curves of these components is shown in Fig. 4. C1 rep-resentedwater erosion dynamics and relatively coarse hilly zone sourcematerialwith a d50 of 0.564mm. C2 representedwind erosion dynamicsand hilly zone source material with wide composition, large grain sizedistribution range, poor sorting property and a d50 of 0.093 mm. C3represented wind erosion dynamics and desert zone source materialwith relatively good sorting property and a d50 of 0.156 mm.
The determination coefficients between the observed and fittedgrain size distributions of typical samples (S1, S2 and S3) showed thatmost S3 samples were well-described by the grain size distribution ofC3. However, the differences between the grain size distribution ofsome S2 samples and C2 were rather large since the differencesbetween S2 samples were large. The majority of S1 samples werewell-fitted with the grain size distribution of C2 and C1 (Table 2).These results indicated that the grain size distributions of C1, C2, andC3 were appropriate for estimating the grain size distribution of depos-ited sediments.
Kurtosis Sortingcoefficient
Coefficient ofdetermination
Min Max Min Max Min Max
1.29 1.89 1.15 1.89 0.88 0.951.10 1.65 1.30 1.65 0.72 0.930.46 2.09 0.95 2.09 0.89 0.95

Fig. 6. Boxplot of coefficient of determination between observed and fitted grain size dis-tribution of sediment deposited in the river channel in the three regions of Dongliu Gully.
137X. Zhang et al. / Sedimentary Geology 330 (2015) 132–140
With the distribution of 61 sediment samples in the stream channelfrom the upper to lower reaches as the objective function, the percent-ages of C1, C2, and C3 in each sediment sample were calculated usingthe least squares method and the law of the conservation of matter, asshown in Fig. 5. The composition of sediments deposited from theupper to lower reaches was as follows: C1 exhibited a decreasingtrend, whereas C2 and C3 exhibited increasing trends; C2 had aslope of 0.6869 and C3 had a slope of 0.596, indicating that C3 increasedfaster than C2. In the hilly zone sediments, C1 accounted for 68.88%and C3 was basically absent. According to the sample point layout, thematerial source of C3 was the midstream desert zone, with the up-stream hilly zone only containing a trace of C3; thus, the calculation re-sults well fit with the actual situation. The percentage of C1 decreasedrapidly from the middle to lower reaches, but the percentage of C3 in-creased; near the entrance of the Dongliu Gully to the Yellow River,the deposited sediments were mainly composed of C2 (62.28%) andC3, with C1 not found.
The coefficient of determination between the observed and fittedgrain size distributions of channel deposited sediment in the three re-gions is shown in Fig. 6 and includes the median, minimum, maximum,1st quartile, and 3rd quartile. The sediments deposited in the river chan-nel of the hilly zone had the largest dispersion range, interquartilerange, and lowest median values, while sediments deposited in thefarmland zone had the smallest dispersion range, interquartile range,and highest median values. The poorly fitted grain size distribution inthe hilly zone resulted from the complex topographical conditions,since broken hills and interlacing hilly-desert areas are included in thehilly zone. In the farmland zone, the stream has been channelized andstabilized, therefore deposited sediment was rather homogeneous.
To further analyzematerial source changes, we determined the rela-tionships between the three components and the distance of the sampleto the gully head, between the three components and the sample pointsin the whole watershed, between each component and the different
Fig. 5. Percentage of C1 component (a), C2 component (b
zones, and between the three components and sample points, excludingthose in the desert zone. The R2 results of different zones are given inTable 3.
Results showed that C1 had the closest and C2 had the poorest rela-tionship with distance to gully head. The R2 values of the desert zonecomponents were significantly smaller than those in the other zonesand were also the most discrete. Erosion was the most severe in thedesert zone, where wind and water erosion occurred alternately. If thedesert zone, sample points were eliminated, the R2 values increasedobviously and exhibited a consistent change law. This indicated that,in the desert zone, both material source and erosion dynamics changeddramatically along the river.
), and C3 component (c) along the stream channel.
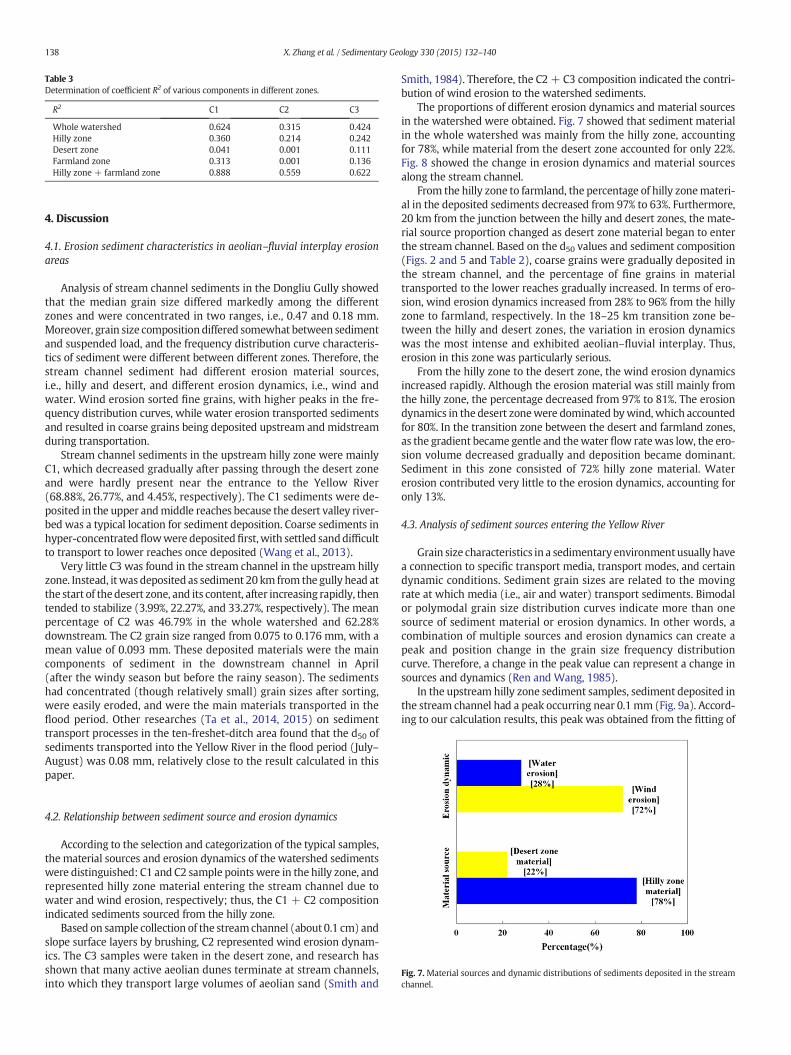
Table 3Determination of coefficient R2 of various components in different zones.
R2 C1 C2 C3
Whole watershed 0.624 0.315 0.424Hilly zone 0.360 0.214 0.242Desert zone 0.041 0.001 0.111Farmland zone 0.313 0.001 0.136Hilly zone + farmland zone 0.888 0.559 0.622
138 X. Zhang et al. / Sedimentary Geology 330 (2015) 132–140
4. Discussion
4.1. Erosion sediment characteristics in aeolian–fluvial interplay erosionareas
Analysis of stream channel sediments in the Dongliu Gully showedthat the median grain size differed markedly among the differentzones and were concentrated in two ranges, i.e., 0.47 and 0.18 mm.Moreover, grain size composition differed somewhat between sedimentand suspended load, and the frequency distribution curve characteris-tics of sediment were different between different zones. Therefore, thestream channel sediment had different erosion material sources,i.e., hilly and desert, and different erosion dynamics, i.e., wind andwater. Wind erosion sorted fine grains, with higher peaks in the fre-quency distribution curves, while water erosion transported sedimentsand resulted in coarse grains being deposited upstream andmidstreamduring transportation.
Stream channel sediments in the upstream hilly zone were mainlyC1, which decreased gradually after passing through the desert zoneand were hardly present near the entrance to the Yellow River(68.88%, 26.77%, and 4.45%, respectively). The C1 sediments were de-posited in the upper andmiddle reaches because the desert valley river-bed was a typical location for sediment deposition. Coarse sediments inhyper-concentratedflowwere depositedfirst,with settled sanddifficultto transport to lower reaches once deposited (Wang et al., 2013).
Very little C3 was found in the stream channel in the upstream hillyzone. Instead, itwas deposited as sediment 20 km from the gully head atthe start of thedesert zone, and its content, after increasing rapidly, thentended to stabilize (3.99%, 22.27%, and 33.27%, respectively). The meanpercentage of C2 was 46.79% in the whole watershed and 62.28%downstream. The C2 grain size ranged from 0.075 to 0.176 mm, with amean value of 0.093 mm. These deposited materials were the maincomponents of sediment in the downstream channel in April(after the windy season but before the rainy season). The sedimentshad concentrated (though relatively small) grain sizes after sorting,were easily eroded, and were the main materials transported in theflood period. Other researches (Ta et al., 2014, 2015) on sedimenttransport processes in the ten-freshet-ditch area found that the d50 ofsediments transported into the Yellow River in the flood period (July–August) was 0.08 mm, relatively close to the result calculated in thispaper.
Fig. 7. Material sources and dynamic distributions of sediments deposited in the streamchannel.
4.2. Relationship between sediment source and erosion dynamics
According to the selection and categorization of the typical samples,the material sources and erosion dynamics of the watershed sedimentswere distinguished: C1 and C2 sample points were in the hilly zone, andrepresented hilly zone material entering the stream channel due towater and wind erosion, respectively; thus, the C1 + C2 compositionindicated sediments sourced from the hilly zone.
Based on sample collection of the streamchannel (about 0.1 cm) andslope surface layers by brushing, C2 represented wind erosion dynam-ics. The C3 samples were taken in the desert zone, and research hasshown that many active aeolian dunes terminate at stream channels,into which they transport large volumes of aeolian sand (Smith and
Smith, 1984). Therefore, the C2 + C3 composition indicated the contri-bution of wind erosion to the watershed sediments.
The proportions of different erosion dynamics and material sourcesin the watershed were obtained. Fig. 7 showed that sediment materialin the whole watershed was mainly from the hilly zone, accountingfor 78%, while material from the desert zone accounted for only 22%.Fig. 8 showed the change in erosion dynamics and material sourcesalong the stream channel.
From the hilly zone to farmland, the percentage of hilly zonemateri-al in the deposited sediments decreased from 97% to 63%. Furthermore,20 km from the junction between the hilly and desert zones, the mate-rial source proportion changed as desert zone material began to enterthe stream channel. Based on the d50 values and sediment composition(Figs. 2 and 5 and Table 2), coarse grains were gradually deposited inthe stream channel, and the percentage of fine grains in materialtransported to the lower reaches gradually increased. In terms of ero-sion, wind erosion dynamics increased from 28% to 96% from the hillyzone to farmland, respectively. In the 18–25 km transition zone be-tween the hilly and desert zones, the variation in erosion dynamicswas the most intense and exhibited aeolian–fluvial interplay. Thus,erosion in this zone was particularly serious.
From the hilly zone to the desert zone, the wind erosion dynamicsincreased rapidly. Although the erosion material was still mainly fromthe hilly zone, the percentage decreased from 97% to 81%. The erosiondynamics in the desert zonewere dominated bywind, which accountedfor 80%. In the transition zone between the desert and farmland zones,as the gradient became gentle and thewater flow ratewas low, the ero-sion volume decreased gradually and deposition became dominant.Sediment in this zone consisted of 72% hilly zone material. Watererosion contributed very little to the erosion dynamics, accounting foronly 13%.
4.3. Analysis of sediment sources entering the Yellow River
Grain size characteristics in a sedimentary environment usually havea connection to specific transport media, transport modes, and certaindynamic conditions. Sediment grain sizes are related to the movingrate at which media (i.e., air and water) transport sediments. Bimodalor polymodal grain size distribution curves indicate more than onesource of sediment material or erosion dynamics. In other words, acombination of multiple sources and erosion dynamics can create apeak and position change in the grain size frequency distributioncurve. Therefore, a change in the peak value can represent a change insources and dynamics (Ren and Wang, 1985).
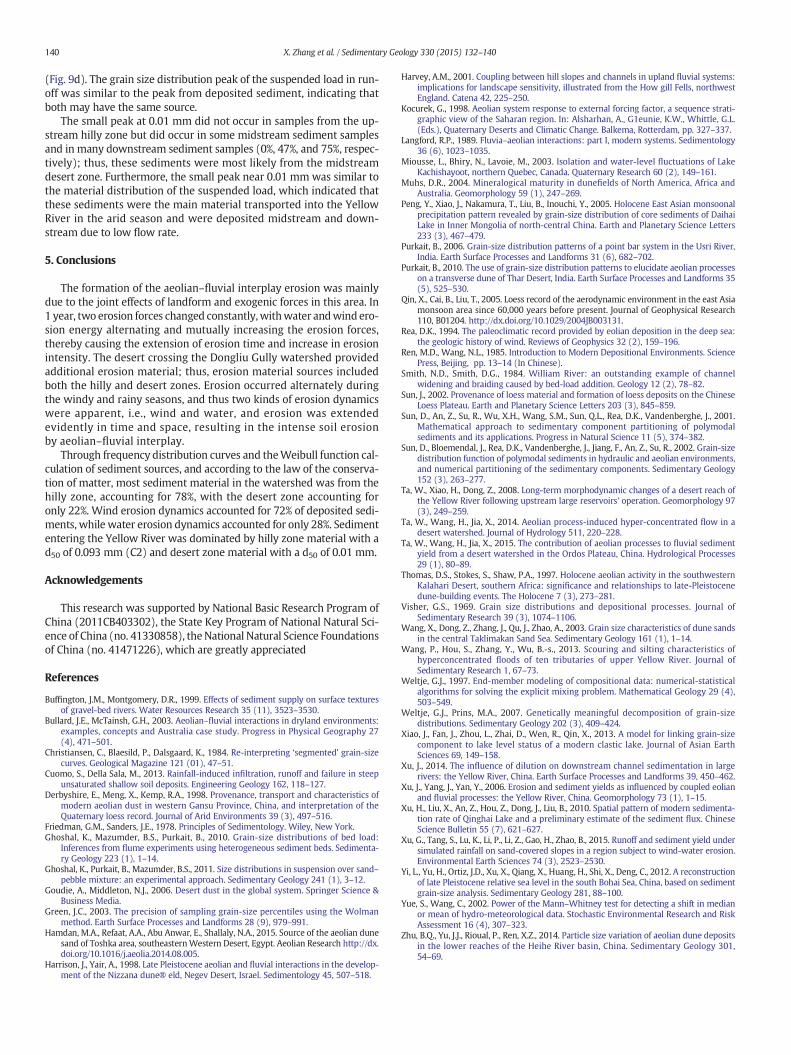
In the upstream hilly zone sediment samples, sediment deposited inthe stream channel had a peak occurring near 0.1mm (Fig. 9a). Accord-ing to our calculation results, this peak was obtained from the fitting of
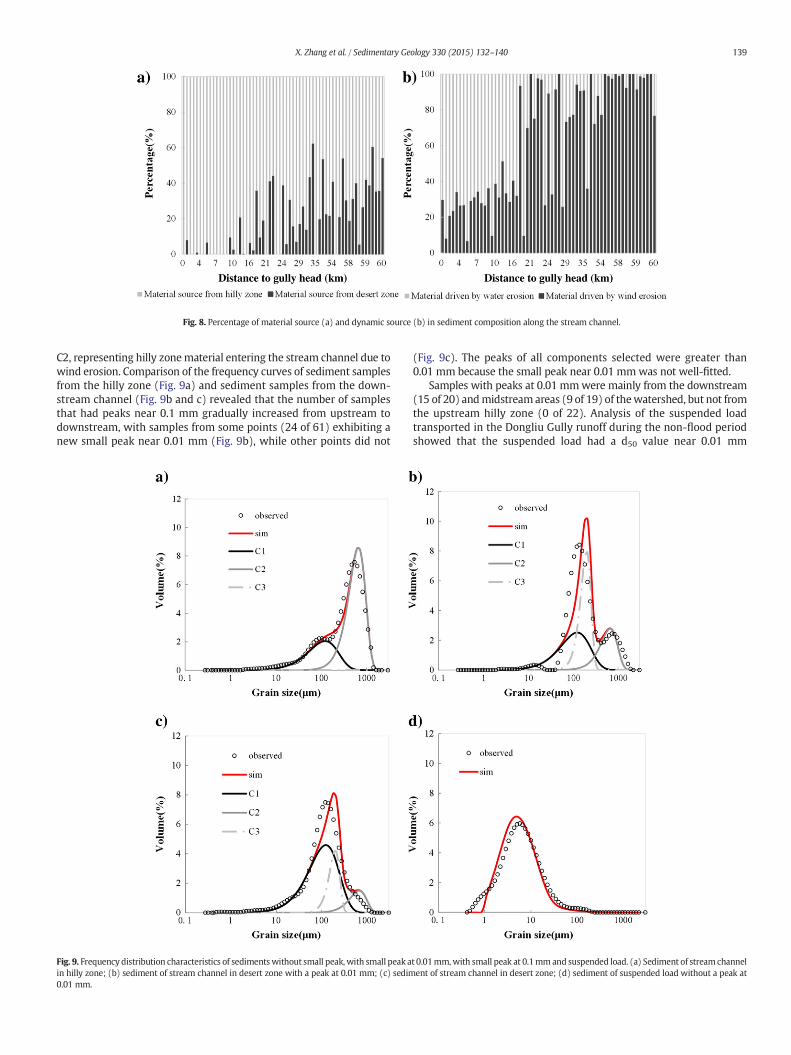
Fig. 8. Percentage of material source (a) and dynamic source (b) in sediment composition along the stream channel.
139X. Zhang et al. / Sedimentary Geology 330 (2015) 132–140
C2, representing hilly zonematerial entering the stream channel due towind erosion. Comparison of the frequency curves of sediment samplesfrom the hilly zone (Fig. 9a) and sediment samples from the down-stream channel (Fig. 9b and c) revealed that the number of samplesthat had peaks near 0.1 mm gradually increased from upstream todownstream, with samples from some points (24 of 61) exhibiting anew small peak near 0.01 mm (Fig. 9b), while other points did not
Fig. 9. Frequency distribution characteristics of sedimentswithout small peak, with small peak ain hilly zone; (b) sediment of stream channel in desert zone with a peak at 0.01 mm; (c) sedim0.01 mm.
(Fig. 9c). The peaks of all components selected were greater than0.01 mm because the small peak near 0.01 mmwas not well-fitted.
Samples with peaks at 0.01 mmwere mainly from the downstream(15 of 20) andmidstream areas (9 of 19) of thewatershed, but not fromthe upstream hilly zone (0 of 22). Analysis of the suspended loadtransported in the Dongliu Gully runoff during the non-flood periodshowed that the suspended load had a d50 value near 0.01 mm
t 0.01mm,with small peak at 0.1mmand suspended load. (a) Sediment of streamchannelent of stream channel in desert zone; (d) sediment of suspended load without a peak at
140 X. Zhang et al. / Sedimentary Geology 330 (2015) 132–140
(Fig. 9d). The grain size distribution peak of the suspended load in run-off was similar to the peak from deposited sediment, indicating thatboth may have the same source.
The small peak at 0.01 mm did not occur in samples from the up-stream hilly zone but did occur in some midstream sediment samplesand in many downstream sediment samples (0%, 47%, and 75%, respec-tively); thus, these sediments were most likely from the midstreamdesert zone. Furthermore, the small peak near 0.01 mm was similar tothe material distribution of the suspended load, which indicated thatthese sediments were the main material transported into the YellowRiver in the arid season and were deposited midstream and down-stream due to low flow rate.
5. Conclusions
The formation of the aeolian–fluvial interplay erosion was mainlydue to the joint effects of landform and exogenic forces in this area. In1 year, two erosion forces changed constantly,withwater andwind ero-sion energy alternating and mutually increasing the erosion forces,thereby causing the extension of erosion time and increase in erosionintensity. The desert crossing the Dongliu Gully watershed providedadditional erosion material; thus, erosion material sources includedboth the hilly and desert zones. Erosion occurred alternately duringthe windy and rainy seasons, and thus two kinds of erosion dynamicswere apparent, i.e., wind and water, and erosion was extendedevidently in time and space, resulting in the intense soil erosionby aeolian–fluvial interplay.
Through frequency distribution curves and theWeibull function cal-culation of sediment sources, and according to the law of the conserva-tion of matter, most sediment material in the watershed was from thehilly zone, accounting for 78%, with the desert zone accounting foronly 22%. Wind erosion dynamics accounted for 72% of deposited sedi-ments, while water erosion dynamics accounted for only 28%. Sedimententering the Yellow River was dominated by hilly zone material with ad50 of 0.093 mm (C2) and desert zone material with a d50 of 0.01 mm.
Acknowledgements
This research was supported by National Basic Research Program ofChina (2011CB403302), the State Key Program of National Natural Sci-ence of China (no. 41330858), the National Natural Science Foundationsof China (no. 41471226), which are greatly appreciated
References
Buffington, J.M., Montgomery, D.R., 1999. Effects of sediment supply on surface texturesof gravel-bed rivers. Water Resources Research 35 (11), 3523–3530.
Bullard, J.E., McTainsh, G.H., 2003. Aeolian–fluvial interactions in dryland environments:examples, concepts and Australia case study. Progress in Physical Geography 27(4), 471–501.
Christiansen, C., Blaesild, P., Dalsgaard, K., 1984. Re-interpreting ‘segmented’ grain-sizecurves. Geological Magazine 121 (01), 47–51.
Cuomo, S., Della Sala, M., 2013. Rainfall-induced infiltration, runoff and failure in steepunsaturated shallow soil deposits. Engineering Geology 162, 118–127.
Derbyshire, E., Meng, X., Kemp, R.A., 1998. Provenance, transport and characteristics ofmodern aeolian dust in western Gansu Province, China, and interpretation of theQuaternary loess record. Journal of Arid Environments 39 (3), 497–516.
Friedman, G.M., Sanders, J.E., 1978. Principles of Sedimentology. Wiley, New York.Ghoshal, K., Mazumder, B.S., Purkait, B., 2010. Grain-size distributions of bed load:
Inferences from flume experiments using heterogeneous sediment beds. Sedimenta-ry Geology 223 (1), 1–14.
Ghoshal, K., Purkait, B., Mazumder, B.S., 2011. Size distributions in suspension over sand–pebble mixture: an experimental approach. Sedimentary Geology 241 (1), 3–12.
Goudie, A., Middleton, N.J., 2006. Desert dust in the global system. Springer Science &Business Media.
Green, J.C., 2003. The precision of sampling grain-size percentiles using the Wolmanmethod. Earth Surface Processes and Landforms 28 (9), 979–991.
Hamdan, M.A., Refaat, A.A., Abu Anwar, E., Shallaly, N.A., 2015. Source of the aeolian dunesand of Toshka area, southeasternWestern Desert, Egypt. Aeolian Research http://dx.doi.org/10.1016/j.aeolia.2014.08.005.
Harrison, J., Yair, A., 1998. Late Pleistocene aeolian and fluvial interactions in the develop-ment of the Nizzana dune® eld, Negev Desert, Israel. Sedimentology 45, 507–518.
Harvey, A.M., 2001. Coupling between hill slopes and channels in upland fluvial systems:implications for landscape sensitivity, illustrated from the How gill Fells, northwestEngland. Catena 42, 225–250.
Kocurek, G., 1998. Aeolian system response to external forcing factor, a sequence strati-graphic view of the Saharan region. In: Alsharhan, A., G1eunie, K.W., Whittle, G.L.(Eds.), Quaternary Deserts and Climatic Change. Balkema, Rotterdam, pp. 327–337.
Langford, R.P., 1989. Fluvia–aeolian interactions: part I, modern systems. Sedimentology36 (6), 1023–1035.
Miousse, L., Bhiry, N., Lavoie, M., 2003. Isolation and water-level fluctuations of LakeKachishayoot, northern Quebec, Canada. Quaternary Research 60 (2), 149–161.
Muhs, D.R., 2004. Mineralogical maturity in dunefields of North America, Africa andAustralia. Geomorphology 59 (1), 247–269.
Peng, Y., Xiao, J., Nakamura, T., Liu, B., Inouchi, Y., 2005. Holocene East Asian monsoonalprecipitation pattern revealed by grain-size distribution of core sediments of DaihaiLake in Inner Mongolia of north-central China. Earth and Planetary Science Letters233 (3), 467–479.
Purkait, B., 2006. Grain-size distribution patterns of a point bar system in the Usri River,India. Earth Surface Processes and Landforms 31 (6), 682–702.
Purkait, B., 2010. The use of grain-size distribution patterns to elucidate aeolian processeson a transverse dune of Thar Desert, India. Earth Surface Processes and Landforms 35(5), 525–530.
Qin, X., Cai, B., Liu, T., 2005. Loess record of the aerodynamic environment in the east Asiamonsoon area since 60,000 years before present. Journal of Geophysical Research110, B01204. http://dx.doi.org/10.1029/2004JB003131.
Rea, D.K., 1994. The paleoclimatic record provided by eolian deposition in the deep sea:the geologic history of wind. Reviews of Geophysics 32 (2), 159–196.
Ren, M.D., Wang, N.L., 1985. Introduction to Modern Depositional Environments. SciencePress, Beijing, pp. 13–14 (In Chinese).
Smith, N.D., Smith, D.G., 1984. William River: an outstanding example of channelwidening and braiding caused by bed-load addition. Geology 12 (2), 78–82.
Sun, J., 2002. Provenance of loess material and formation of loess deposits on the ChineseLoess Plateau. Earth and Planetary Science Letters 203 (3), 845–859.
Sun, D., An, Z., Su, R., Wu, X.H., Wang, S.M., Sun, Q.L., Rea, D.K., Vandenberghe, J., 2001.Mathematical approach to sedimentary component partitioning of polymodalsediments and its applications. Progress in Natural Science 11 (5), 374–382.
Sun, D., Bloemendal, J., Rea, D.K., Vandenberghe, J., Jiang, F., An, Z., Su, R., 2002. Grain-sizedistribution function of polymodal sediments in hydraulic and aeolian environments,and numerical partitioning of the sedimentary components. Sedimentary Geology152 (3), 263–277.
Ta, W., Xiao, H., Dong, Z., 2008. Long-term morphodynamic changes of a desert reach ofthe Yellow River following upstream large reservoirs' operation. Geomorphology 97(3), 249–259.
Ta, W., Wang, H., Jia, X., 2014. Aeolian process-induced hyper-concentrated flow in adesert watershed. Journal of Hydrology 511, 220–228.
Ta, W., Wang, H., Jia, X., 2015. The contribution of aeolian processes to fluvial sedimentyield from a desert watershed in the Ordos Plateau, China. Hydrological Processes29 (1), 80–89.
Thomas, D.S., Stokes, S., Shaw, P.A., 1997. Holocene aeolian activity in the southwesternKalahari Desert, southern Africa: significance and relationships to late-Pleistocenedune-building events. The Holocene 7 (3), 273–281.
Visher, G.S., 1969. Grain size distributions and depositional processes. Journal ofSedimentary Research 39 (3), 1074–1106.
Wang, X., Dong, Z., Zhang, J., Qu, J., Zhao, A., 2003. Grain size characteristics of dune sandsin the central Taklimakan Sand Sea. Sedimentary Geology 161 (1), 1–14.
Wang, P., Hou, S., Zhang, Y., Wu, B.-s., 2013. Scouring and silting characteristics ofhyperconcentrated floods of ten tributaries of upper Yellow River. Journal ofSedimentary Research 1, 67–73.
Weltje, G.J., 1997. End-member modeling of compositional data: numerical-statisticalalgorithms for solving the explicit mixing problem. Mathematical Geology 29 (4),503–549.
Weltje, G.J., Prins, M.A., 2007. Genetically meaningful decomposition of grain-sizedistributions. Sedimentary Geology 202 (3), 409–424.
Xiao, J., Fan, J., Zhou, L., Zhai, D., Wen, R., Qin, X., 2013. A model for linking grain-sizecomponent to lake level status of a modern clastic lake. Journal of Asian EarthSciences 69, 149–158.
Xu, J., 2014. The influence of dilution on downstream channel sedimentation in largerivers: the Yellow River, China. Earth Surface Processes and Landforms 39, 450–462.
Xu, J., Yang, J., Yan, Y., 2006. Erosion and sediment yields as influenced by coupled eolianand fluvial processes: the Yellow River, China. Geomorphology 73 (1), 1–15.
Xu, H., Liu, X., An, Z., Hou, Z., Dong, J., Liu, B., 2010. Spatial pattern of modern sedimenta-tion rate of Qinghai Lake and a preliminary estimate of the sediment flux. ChineseScience Bulletin 55 (7), 621–627.
Xu, G., Tang, S., Lu, K., Li, P., Li, Z., Gao, H., Zhao, B., 2015. Runoff and sediment yield undersimulated rainfall on sand-covered slopes in a region subject to wind-water erosion.Environmental Earth Sciences 74 (3), 2523–2530.
Yi, L., Yu, H., Ortiz, J.D., Xu, X., Qiang, X., Huang, H., Shi, X., Deng, C., 2012. A reconstructionof late Pleistocene relative sea level in the south Bohai Sea, China, based on sedimentgrain-size analysis. Sedimentary Geology 281, 88–100.
Yue, S., Wang, C., 2002. Power of the Mann–Whitney test for detecting a shift in medianor mean of hydro-meteorological data. Stochastic Environmental Research and RiskAssessment 16 (4), 307–323.
Zhu, B.Q., Yu, J.J., Rioual, P., Ren, X.Z., 2014. Particle size variation of aeolian dune depositsin the lower reaches of the Heihe River basin, China. Sedimentary Geology 301,54–69.