a modelling framework for optimising investment for …
TRANSCRIPT

Iberoamerican Journal of Industrial Engineering, Florianópolis, SC, Brasil, v. 5, n. 10, p. 1-15, 2013.
A MODELLING FRAMEWORK FOR OPTIMISING INVESTMENT
FOR THE AUSTRALIAN LIVESTOCK INDUSTRY
Rodolfo García-Flores1
Andrew Higgins2
Di Prestwidge3
Stephen McFallan4
ABSTRACT: Despite the scale and importance of the beef industry in the north of
Australia, recent political and environmental disruptions have highlighted the vulnerability
of the supply chain. Ensuring that the supply chain remains resilient to climatic events as
well as to unexpected decisions by the stakeholders will require careful planning and
investment in logistics. In this paper, we outline an integrated methodology based on tactical
and operational dynamic models, for assessing the effect of changes in the supply chain.
Emphasis is on the development of an optimisation model that covers the flow of cattle from
properties to agistment farms and feedlots to abattoirs/ports, and the selection of rest areas
(spelling yards) along the path. The model selects the optimal location of spelling yards
along the road network, subject to budget, site capacity, and service requirements. We show
preliminary results for a case study comprising Western Australia and the Northern
Territory.
Keywords: Beef supply chain. Facility location. Network flow optimization. Maximal
covering.
1 INTRODUCTION
The ever-increasing world population is putting pressure on the beef industry to
become more efficient. As global demand continues to increase (KEARNEY, 2012), thanks
1 Dr. Research Scientist, Commonwealth Scientific and Industrial Research Organisation (CSIRO) Digital Productivity and Services Flagship, Private Bag 33, Clayton South, VIC 3168, Australia. E-mail: [email protected]. 2 Dr. Team Leader, Commonwealth Scientific and Industrial Research Organisation (CSIRO) Land and Water Flagship, PO Box 2583, Brisbane, QLD 4001, Australia. E-mail: [email protected]. 3 Dr. Research Projects Officer, Commonwealth Scientific and Industrial Research Organisation (CSIRO) Land and Water Flagship, PO Box 3583, Brisbane, QLD 4001, Australia. E-mail: [email protected]. 4 Dr. Research Projects Officer, Commonwealth Scientific and Industrial Research Organisation (CSIRO) Land and Water Flagship, PO Box 2583, Brisbane, QLD 4001, Australia. E-mail: [email protected].

Iberoamerican Journal of Industrial Engineering, Florianópolis, SC, Brasil, v. 5, n. 10, p. 1-15, 2013.
2
mostly to consumers in developing countries, so does the impact on the environment. Given
that world resources are limited, the improvement must come from technology; it has been
estimated that in the year 2050, world population will require 100% more food, and 70% of
this must come from efficiency-improving technology (FOOD AND AGRICULTURE
ORGANISATION – 2009). Concrete problems to address include improving the efficiency
of the transportation networks, exploiting possible synergies among economic actors and
regions, and more strict and effective assessment of infrastructure investment.
Beef production in the north of Australia is currently at a crossroads due to recent
environmental, political and economical changes. Economically, this is a very important
activity: Australian farm exports earned the country $32.5 billion in 2011, of which beef and
veal production contributed 17%. The northern beef herd of 12.5 million head supplies
nearly 90% of Australia’s live export cattle, most of which is sent to Indonesia.
However, live exports have been affected by the recent imposition of weight
restrictions, as well as by Australia’s decision to stop exports temporarily in June 2012 due
to poor animal welfare. Investigation of alternative paths to market is a clear priority for the
northern beef industry, paths that will certainly involve investment in new infrastructure.
Cattle production in the north is fundamentally different to the more intensive beef
farming industry of the south because it takes place in an environment characterised by
large-scale enterprises on pastoral lease, low herd density (10 head per km2 or less), long
distances to market, and significant annual interruptions of production and distribution
processes due to heat, drought and tropical rainfall patterns. A significant increase in the
costs of production has meant that many properties struggle to remain profitable
(MCCOSKER; MCLEAN; HOLMES, 2009). Transport constitutes approximately one third
of the total supply chain costs.
The analysis and ultimate selection of alternative capital investment and operational
scenarios applicable to the northern Australian beef industry requires a much more
multidisciplinary modelling methodology than anything attempted in the past. In this paper,
we introduce the Northern Australian Beef Industry Strategy (NABIS) as a framework to
assess these scenarios, with special emphasis in the strategic optimisation component.
Previous studies have focused on individual stages of the beef supply chain, as in
(STOTT et al., 2003), who use linear programming to assess the relative contribution that
disease prevention could make to farm income and to its variability, or (STYGAR;

Iberoamerican Journal of Industrial Engineering, Florianópolis, SC, Brasil, v. 5, n. 10, p. 1-15, 2013.
3
MAKULSKA, 2010), who provide a review of optimisation and simulation models used for
herd management.
Logistic studies include (BOYABATLI; KLEINDORFER; KOONTZ, 2011), who
optimised contracts between producers and abattoir given different market options, or
(DOMINGUES-ZUCCHI; ZENG; CAIXETA-FILHO, 2011), who select optimal locations
for abattoirs. Other than the latter, models for simulating and optimising livestock logistics
are limited, despite being more abundant in other supply chains (HIGGINS et al., 2010 and
AHUMADA; VILLALOBOS, 2009 for reviews).
The remainder of this paper is organised as follows. Section 2 briefly describes the
structure of the supply chain in question, introduces the structure of the NABIS framework,
and sketches a concrete problem on infrastructure investment. Section 3 expands on the
strategic optimisation model, whose aim is to select the optimal locations of spelling
facilities. Section 4 presents and discusses preliminary results and Section 5 presents the
conclusions and future work.
2 A FRAMEWORK FOR CAPITAL INVESTMENT AND OPERATIONS
Figure 1 shows a schematic of the northern Australian beef supply chain. Breeding
properties typically produce weaned calves to the age of about 8 months, when their weight
is approximately 330 kg. These cattle can then be sold to live export for finishing in other
countries. Many breeding properties do not have enough forage to produce cattle to
slaughter weight.
Figure 1 – Schematic of the northern Australian beef supply chain
Source: Meateng Pty Ltd (2004)

Iberoamerican Journal of Industrial Engineering, Florianópolis, SC, Brasil, v. 5, n. 10, p. 1-15, 2013.
4
Such cattle are transported by road trains to finishing properties where they are grass-
fed, or to a more intensive confined feeding system (or feedlot) where they are grain-fed.
Cattle spend a minimum of 100 days in feedlots until they reach suitable weight categories
for sale. In sale yards, cattle of multiple classes are sold by auction to abattoirs, for breeding
and for further finishing.
Abattoirs transform the finished cattle into frozen or chilled meat products. Abattoirs
vary significantly in terms of throughput (up to 2000 head per day) though Australia’s
largest 25 abattoirs account for 61% of production. Once processed, the meat is either
transported in refrigerated containers to terminals or to domestic wholesale outlets.
The two most important cost components of this supply chain are transportation and
construction of processing facilities. To better inform stakeholders on the most beneficial
road and facility infrastructure investments and to release the supply chain’s productive
potential, the governments of the northern states of Australia are working with industry to
provide a comprehensive analysis of the livestock industry value chain.
An important outcome of this strategic partnership is the development of NABIS, an
integrated set of models at different temporal and spatial scales. The aim of these models,
introduced next, is to examine how changes in infrastructure could catalyse changes in
logistics costs under different market scenarios.
2.1 The Northern Australian Beef Industry Strategy
NABIS consists of three components:
1. Operational simulation model. This model captures the real-time movements of
individual transport vehicles (trucks and trains) between sites. It incorporates all
the design features of the supply chain, such as individual ports and holding yards,
vehicle and yard capacities, loading and unloading times and queuing times in
order to quantify overall operational efficiency and assess “what-if” scenarios.
Uncertainties related to road condition, queuing delays and disruptions can also be
simulated and visualised with this model.
2. Strategic simulation model. This model simulates large-scale investment decisions
of transport infrastructure. It aims to inform policy decisions that impact on the
mass flow of cattle across the north of Australia by following the path of livestock
between enterprises to ports or abattoirs. For each recorded movement of cattle, the

Iberoamerican Journal of Industrial Engineering, Florianópolis, SC, Brasil, v. 5, n. 10, p. 1-15, 2013.
5
model generates a “least cost” trip between origins and destinations. These are
aggregated on a monthly basis to generate a cost estimate, so that changes due to
network improvements such as road upgrades can be assessed.
3. Strategic optimisation model. This model is meant to highlight the best possible
investment decisions. The stakeholders propose potential sites for the construction
of facilities (spelling yards), but the selection of the best sites is difficult to assess.
The problem becomes extremely complex as the number of proposals to be
assessed increases. This model aims to select the optimal location of spelling yards
along the road network subject to budget, site capacity, and service requirements.
The model must also comply with the guidelines that determine maximum driving
hours and maximum water deprivation times.
The rest of this paper explains in more detail the development of the strategic
optimisation model.
3 OPTIMISING LOGISTICS AND SPELLING YARD SELECTION
The problem of selecting the best facility sites can be stated as follows: determine the
locations of the spelling yards, paths and volumes of cattle transported, such that the profit
of operating the supply chain is maximised, subject to network flow, inventory, capacity,
operational and demand satisfaction constraints. Profit is expressed as the difference of the
income from satisfying the demand from the terminal nodes, plus the income from the
service provided by the spelling yards, minus transportation cost, minus agistment cost,
minus the cost of opening the spelling yards.
Figure 2 illustrates the sites and transportation stages considered. Cattle of different
breeds are transported in trucks from breeding properties S to fattening properties P, which
can be either agistment farms F or feedlots L. The cattle pass through transhipment points R,
some of which will be selected as spelling yards D, whereas the rest are simply road
junctions H. When the truckloads arrive at the fattening properties, cattle spend a number of
months gaining weight there, until they are ready to be sent to the terminal nodes A.

Iberoamerican Journal of Industrial Engineering, Florianópolis, SC, Brasil, v. 5, n. 10, p. 1-15, 2013.
6
Figure 2 – Diagram of the northern Australian beef supply chain. Spelling yards must be chosen
from a set of transit nodes R when transported from breeding properties S to fattening properties P,
or from fattening properties to terminal nodes A (i.e., ports, saleyards or abattoirs)
Spelling yards and fattening properties are rest areas because the cattle stop there for
prolonged periods. Terminal nodes can be ports, abattoirs or saleyards, and for the purpose
of the model, they are equivalent, except that the income they produce per truckload is
different. The agistment period in agistment farms is six months, whereas for feedlots it is
three months only.
The decision variables needed to model the system described above are as follows. Let
ybgijt be the flow in truckloads of breed b and age g (in months) from sites i to j in period t;
qbgijt the inventory of breed b and age g in property i at period t, zi an indicator variable that
takes the value 1 if the need for the service of a spelling yard at node i ∈ {S ∪A} is covered
for the whole time horizon, and zero otherwise. And xj, which takes the value 1 if node j ∈ D
is selected as a rest area, and 0 otherwise. The model addresses the following questions:
1. Where should spelling yards be built so as to maximise the profit subject to
infrastructure, budget and operational guidelines?
2. What is the optimal volume of cattle that each terminal node should process to
ensure maximum benefit?
3. What are the flows to be transported and processed among facilities during the
time horizon?

Iberoamerican Journal of Industrial Engineering, Florianópolis, SC, Brasil, v. 5, n. 10, p. 1-15, 2013.
7
3.1 Objective Function
Maximise profit expressed as the income from satisfying the demand from the
terminal nodes, plus the income from the service provided by the spelling yards, minus
transportation costs, minus agistment costs, minus the cost of opening spelling yards
(Equation 1):
∑∑∑ ∑ ( )∈ ∈ ∈ ∈ ∈
∑ ∈{ ∪ }
∑∑∑ ∑ ( )∈ ∈ ∈ ∈
∑∑∑∑ ∈ ∈ ∈ ∈
∑ ∈
(1)
Where AIbgjt is the income per truckload of cattle of breed b of age g at site j at period
t, hi is the profit from satisfying truckload demand of site i, TCij is the transportation cost
between i and j, ACi is the agistment cost at farm i, and OCj is the cost of opening a rest site
at j.
3.2 Constraints
Constraints (2) to (4) are network flow constraints. Constraints 5 to 13 are derived
from the maximal covering location problem (MCLP) Current, Daskin and Schilling (2004)
applied to the transportation from properties to farms, and from farms to terminal nodes
(abattoirs, ports and saleyards).
1. Flow constraints. The balance of incoming and outgoing truckloads to each site is
(Constraint 2):
∑
∑
{
∈ ∈ ∈ ∈
∈ ∈ ∈ ∈
∈ ∈ ∈ ∈
(2)
where aijt is the availability of the link that joins i to j (for roads) at time t and pbgit is the
production of cattle of breed b and age g in node i at period t. Note that pbgit can only be
non-zero if g = 1 month, since calves of age g > 1 could not have been born at g.
Iberoamerican Journal of Industrial Engineering, Florianópolis, SC, Brasil, v. 5, n. 10, p. 1-15, 2013.
8
2. Agistment constraints. The cattle truckloads received and produced in a breeding
property are released only after that property’s agistment period (Constraint 3).
∑ ∈{ ∪ } ∑ ∈{ ∪ }
∈ ∈ ∈ ∈ (3)
where τib,i ∈ P = {F ∪ L}, is the agistment period of breed b in fattening at property i.
3. Terminal capacity. The terminals can process up to a specified number of
truckloads, Constraint 4.
∑∑ ∑ ∈{ ∪ } ∈ ∈
∈ ∈
(4)
where AKit is the total processing capacity of terminal i during period t.
4. No-flow indicator constraints. To make sure that rest areas are placed in sites
through which there is flow, we introduce an indicator variable that shows whether
or not there is no flow going out from a potential rest area, Constraint 5.
∑∑∑∑
∈ ∈ ∈
∈
(5)
where N denotes the set of all nodes. Similarly and to ensure that nodes are serviced by
at least one rest area only if there is flow into the nodes, we introduce (Constraint 6)
∑∑∑∑
∈ ∈ ∈
∈
(6)
5. Demand satisfaction constraints. Demand at a given site i is not satisfied until a site
j that covers i is selected, Constraint 7 and 8.

Iberoamerican Journal of Industrial Engineering, Florianópolis, SC, Brasil, v. 5, n. 10, p. 1-15, 2013.
9
∑ ∈
∈ ∈
(7)
where
{ | ̅
∈ { ∪ } ∈ { ∪ }} (8)
is the set of all candidate locations that can cover demand point i within the
maximum driving hours. Here, ̅ is the average speed, ΘD
represents the maximum
driving hours, and and dij is the distance between nodes i and j in the shortest path of
network.
6. Breeding-properties-as-yards constraints. All the breeding properties are also
spelling yards. Apart from the fact that cattle get rest during agistment, this
constraint encourages direct transport from properties to farms that are within the
distance that can be travelled within the maximum number of driving hours
(Constraint 9).
xi = 1 i ∈ P . (9)
7. Combined rest site capacity. Sites selected as rest areas can receive a limited
number of truckloads, Constraint 10.
∑ ∑ ∑ ∈ ∈ ∑ ∑ ∈ ∈ ∈ { ∪ } ∈
(10)
where RKi is the combined capacity of rest sites. In this constraint, the production term
is different to zero only for agistment farms.
8. Breeding property capacity. The breeding properties can hold up to a limited
number of truckloads, Constraint 11.
∑∑ ∈ ∈
∈ ∈
(11)
where PKi is the total storage capacity of breeding property i.

Iberoamerican Journal of Industrial Engineering, Florianópolis, SC, Brasil, v. 5, n. 10, p. 1-15, 2013.
10
9. Maximum number of spelling yards. The number of spelling yards that can be built
is limited, Constraint 12.
∑ ∈
(12)
where BG is the total available budget for construction of spelling yards. We assume
that the cost of setting up fattening farms as rest areas is zero; see Constraint 9.
10. Service requirements. We require every breeding farm and terminal node to be
served by at least one rest site (that is, spelling yard or fattening farm), on the
condition that there is flow through these sites. In other words, a site does not need
to be served by a rest site if there is no flow through it (see constraint group 4
above) (Constraint 13 and 14).
∑ ∈
∈
(13)
∑ ∈
∈
(14)
where MiY
is analogous to MiD
in Equation (8), but uses the cattle’s maximum water
deprivation time ΘY
instead of the maximum driving time ΘD.
11. Conditional flow constraints. Finally, we declare explicitly that spelling yards will
not be built at sites through which there is no flow, Constraint 15.
xi ≤ 1 − δiO i ∈ R . (15)
3.3 Parameters and Input Data
The data sources, which fed the model, are the National Livestock Identification
System, or NLIS, which is a historical record of cattle movements from 2007 to 2011. And
Iberoamerican Journal of Industrial Engineering, Florianópolis, SC, Brasil, v. 5, n. 10, p. 1-15, 2013.
11
operational codes such as the Guidelines for managing Heavy Vehicle Driver Fatigue
(NATIONAL TRANSPORT COMMISSION AUSTRALIA, 2007) and the Code of Practice
for the Welfare of Animals (AGRICULTURE AND RESOURCE MANAGEMENT
COUNCIL OF AUSTRALIA AND NEW ZEALAND, 1999).
These provided the recommended maximum driving times and maximum water
deprivation times, respectively, which are important parameters in our model.
4 RESULTS AND DISCUSSION
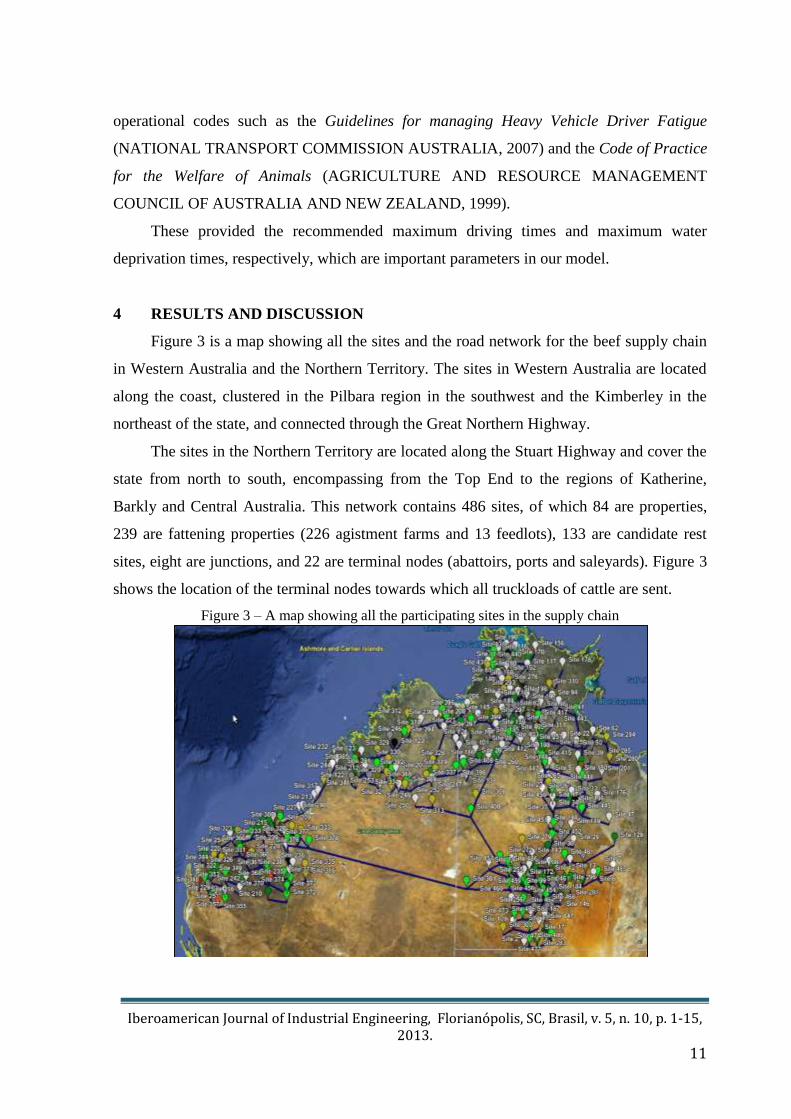
Figure 3 is a map showing all the sites and the road network for the beef supply chain
in Western Australia and the Northern Territory. The sites in Western Australia are located
along the coast, clustered in the Pilbara region in the southwest and the Kimberley in the
northeast of the state, and connected through the Great Northern Highway.
The sites in the Northern Territory are located along the Stuart Highway and cover the
state from north to south, encompassing from the Top End to the regions of Katherine,
Barkly and Central Australia. This network contains 486 sites, of which 84 are properties,
239 are fattening properties (226 agistment farms and 13 feedlots), 133 are candidate rest
sites, eight are junctions, and 22 are terminal nodes (abattoirs, ports and saleyards). Figure 3
shows the location of the terminal nodes towards which all truckloads of cattle are sent.
Figure 3 – A map showing all the participating sites in the supply chain

Iberoamerican Journal of Industrial Engineering, Florianópolis, SC, Brasil, v. 5, n. 10, p. 1-15, 2013.
12
All calculations were made using CPLEX 12.5 in a 64-bit Intel Xeon CPU with one
processor of eight cores (2.27 GHz) each and 16 GB of RAM. The problem has 227746
variables and 102936 constraints, was coded in Java and a typical run is solved in
approximately two hours. The locations of the 82 sites selected as spelling yards are
indicated in Figure 4. These represent 61.6% of the candidate rest areas.
Figure 5 – Map showing the sites selected as spelling yards produced by the optimisation model
The cost of building a spelling yard is assumed to be $0.34M. The number of spelling
yards varies from 55 to 82, as the results in Table 1 show. On one hand, for budgets larger
than the amount needed to build 82 spelling yards, the model does not produce more than
the 82 sites shown in Figure 4.
Table 1 – The cost of building a spelling yard
Budget (MAUD) P
j xj
19.00 55
20.00 58
21.00 61
22.00 64
23.00 67
24.00 70
25.00 73
26.00 76
27.00 79
28.00 82
29.00 82
If, on the other hand, the budget is lower than $19M, the problem becomes infeasible.
The general distribution of the sites selected when the budget is $19M (not shown due to
Iberoamerican Journal of Industrial Engineering, Florianópolis, SC, Brasil, v. 5, n. 10, p. 1-15, 2013.
13
space limitations) is not too different from the distribution obtained with a budget of $29M
(Figure 4) in the sense that the same areas show a higher density of spelling yards, although
with less sites. These areas are the Pilbara and Kimberley regions, and along the Stuart
Highway. Overall, the percentage of selected sites among the candidate rest sites varies
between 41.35% and 61.65%.
5 CONCLUSIONS AND DIRECTIONS FOR RESEARCH
Ensuring continuing operations of the beef supply chain in the northern states of
Australia in the face of climatic events and changes in stakeholders’ decisions requires
careful planning and investment in logistics. We have introduced a three-pronged
methodology for assessing the effect of environmental and policy changes in the operation
of the supply chain, which consists of an operational simulation model, a strategic
simulation model, and a strategic optimisation model.
The focus of this paper has been on describing the strategic optimisation model. This
model adopts a systems view of the supply chain by using capital and operational costs as
parameters. On the one hand, it incorporates infrastructure information, such as existing
roads, location and type of properties that participate in the supply chain, and building costs
and locations of new facilities.
On the other hand, it also uses operational data regarding cattle flows along the
network, transportation costs and the costs of operating facilities. With this information, the
model determines the location of the spelling yards, the optimal volume of cattle that each
terminal node should process, and the flows among facilities that respect maximum water
deprivation times and maximum driving hours. Our results indicate that the regions where
the spelling yards are located do not change as a function of budget, although, naturally, the
number of sites does. Thus, the model can help prioritise spelling yard construction within
regions on quantitative grounds.
Although the model already covers all the relevant aspects of the supply chain, the
effort must centre now on verifying the accuracy of the data. Tuning is needed, for example,
in the costing model, or in ironing out the inconsistencies found in the NLIS database.
Another aspect of the problem that requires attention is the effect of seasonal
conditions on road access: historical records are needed to model the availability of certain
road segments as part of the transportation network at certain times of the year. Operational

Iberoamerican Journal of Industrial Engineering, Florianópolis, SC, Brasil, v. 5, n. 10, p. 1-15, 2013.
14
codes are also likely to change in the near future, and these need to be updated. To this end,
a closer engagement with the stakeholders is necessary.
REFERENCES
AGRICULTURE AND RESOURCE MANAGEMENT COUNCIL OF AUSTRALIA AND
NEW ZEALAND. Standing Committee on Agriculture and Resource Management. Ed.:
Land transport of cattle. Model code of practice for the welfare of animals SCARM report.
CSIRO Publishing, 150 Oxford Street, Collingwood, VIC 3066, Australia, 1999.
AHUMADA, O.; VILLALOBOS, J. Application of planning models in the agri-food supply
chain: a review. European Journal of Operational Research, v. 195, n. 1, p. 1-20, 2009.
BOYABATLI, O.; KLEINDORFER, P.; KOONTZ, S. Integrating long-term and short-term
contracting in beef supply chains. Management Science, v. 57, n. 10, p. 1771-1787, 2011.
DOMINGUES-ZUCCHI, J.; ZENG, A.; CAIXETA-FILHO, J. Optimum location for export
oriented slaughterhouses in Mato Grosso, Brazil: a dynamic mathematical model.
International Journal of Logistics: Research and Applications, v. 14, n. 3, p. 135-148,
2011.
FOOD AND AGRICULTURE ORGANISATION. The technology challenge. Issues
briefs, United Nations. 2009. Available at:
<http://www.fao.org/fileadmin/templates/%20wsfs/docs/Issues%20papers/HLEF2050Techn
ology.pdf./>
HIGGINS, A.; MILLER, C.; ARCHER, A.; TON, T.; FLETCHER, C.; MCALLISTER, R.
Challenges of operations research practice in agricultural value chains. Journal of the
Operational Research Society, v. 61, n. 6, p. 964-973, 2010.
KEARNEY, J. Food consumption trends and drivers. Philosophical Transactions of the
Royal Society, v. 365, n. 1554, p. 2793-2807, 2012.
MCCOSKER, T.; MCLEAN, D.; HOLMES, P. Northern beef situation analysis.
Technicalreport, Meat and Livestock Australia, Sydney, 2009.
MEATENG PTY Ltd: Evaluating the commercial viability of a northern outback. 2004.
Queensland meat processing facility. Technical Report 136476698, Meateng Pty Ltd, 8
Montrose St., Hawthorn east, VIC 3123 Australia (February 2012) 11. Current, J., Daskin,
M., Schilling, D.: 3. Discrete Network Location Models. In: Facility Location Applications
and Theory, p. 81-118, 2004.
NATIONAL TRANSPORT COMMISSION AUSTRALIA. Guidelines for managing
heavy vehicle driver fatigue. Final report, National Transport Commission Australia, Level
15/628 Bourke Street, Melbourne, VIC 3000, Australia, 2007.

Iberoamerican Journal of Industrial Engineering, Florianópolis, SC, Brasil, v. 5, n. 10, p. 1-15, 2013.
15
STOTT, A.; LLOYD, J.; HUMPHRY, R.; GUNN, G. A linear programming approach
toestimate the economic impact of bovine viral diarrhoea (bvd) at the whole-farm level in
Scotland. Preventive Veterinary Medicine, v. 59, n. 1-2, p. 51-66, 2003.
STYGAR, A.; MAKULSKA, J. Application of mathematical modelling in beef herd
management – a review. Annals of Animal Science, v. 10, n. 4, p. 333-348, 2010.
Originais recebidos em: 26/10/2013
Aceito para publicação em: 15/04/2014