a monthly publication of beyondproxy llc · pdf filethe new monthly european v ... 117...
TRANSCRIPT
PORTFOLIO MANAGER’S REVIEW
Copyright Warning: It is a violation of federal copyright law to reproduce all or part of this publication for any purpose without the prior written consent of BeyondProxy LLC. The Copyright Act imposes liability of up to $150,000 per issue for such infringement, and violators will be prosecuted to the full extent of the law. See inside for subscription information, including having multiple copies sent to you. © 2008-09 by BeyondProxy LLC. All rights reserved.
A Monthly Publication of BeyondProxy LLC www.manualofideas.com [email protected] November 20, 2009
When asked how he became so successful, Buffett answered: “we read hundreds and hundreds of annual reports every year.”
Edited by the
Manual of Ideas Research Team
“If our efforts can further the goals of our members by giving them a discernible edge over other market participants, we have succeeded.”
Top Five Ideas In This Report
(Nasdaq: ………………… p. 60 ATP Oil & Gas (Nasdaq: ATPG) ……………… p. 63 CapitalSource (NYSE: CSE) ………………… p. 66 Lockheed Martin (NYSE: LMT) ………………… p. 69
(NYSE: ………………… p. 71
Also Inside
Editor’s Commentary …………….. p. 6 Portfolios with “Signal Value” … p. 8 Interview with Paul Sonkin …… p. 33 100 Superinvestor Stocks ……… p. 40
About Portfolio Manager’s Review
Our goal is to bring you investment ideas that are compelling on the basis of value versus price. In our quest for value, we analyze the top holdings of top fund managers. We also use a proprietary methodology to identify stocks that are not widely followed by institutional investors. Our managing editor John Mihaljevic is a member of Value Investors Club, an exclusive community of money managers, and has won the Club’s prize for best investment idea. John is a trained capital allocator, having studied under Yale chief investment officer David Swensen and served as research assistant to Nobel laureate James Tobin. John holds a BA in Economics, summa cum laude, from Yale and is a CFA charterholder.
THE SUPERINVESTOR ISSUE
► Snapshot of 100 companies owned by superinvestors ► 24 companies profiled by MOI research team
► Proprietary selection of Top 5 candidates for investment ► Plus: Latest holdings of top investors
► Plus: Exclusive Interview with Paul Sonkin
Superinvestor companies mentioned in this issue include Abbott Labs, Aetna, Alcatel-Lucent, Alleghany, Allegheny Energy,
Alliance One, Allstate, AmeriCredit, ATP Oil & Gas, Baldwin & Lyons, Becton Dickinson, Boeing, BreitBurn Energy,
Brookfield Asset Management, Brookfield Properties, CA, Campbell Soup, Capital Southwest, CapitalSource, Cardinal Health, CarMax,
Chesapeake Energy, Citigroup, Columbia Banking, Contango Oil & Gas, Crosstex Energy, dELiA*s, Dell, DENTSPLY, Diageo, Dillard's, DineEquity,
DIRECTV, Domtar, DreamWorks Animation, Enzon Pharma, Fair Isaac, Fairfax Financial, Forest City Enterprises, Forest Labs, Gastar Exploration,
General Electric, Hartford Financial, Heritage-Crystal, Hertz, Humana, Huntsman, International Assets, International Coal, Investors Title,
ITC Holdings, J.C. Penney, Jefferies Group, John Bean Tech, Johnson & Johnson, Kraft Foods, Leucadia National, Level 3 Comms,
Lockheed Martin, Markel, McDonald's, MI Developments, Microsoft, MTS Systems, Multimedia Games, News Corp.,
Northrop Grumman, Omnicom, Orange 21, Overstock.com, Paychex, Pfizer, Pioneer Natural, Pool Corp., Resource America, RSC Holdings,
Sears Holdings, Spirit AeroSystems, St. Joe, Syneron Medical, Theravance, Thomas Properties Group, TravelCenters, tw telecom,
Tyco Electronics, United America Indemnity, United Parcel Svc, USG, Viad, ViaSat, Wal-Mart, Walt Disney, WellCare, Wells Fargo, Wendy's Arby's,
Yum! Brands, Zenith National, Zoran, and more.
(profiled companies are underlined)
© 2009 by BeyondProxy LLC. All rights reserved. www.manualofideas.com November 20, 2009 – Page 3 of 131
The new monthly EUROPEAN VALUE REPORT is here!
Start your FREE trial today
www.manualofideas.com/evr.html
© 2009 by BeyondProxy LLC. All rights reserved. www.manualofideas.com November 20, 2009 – Page 4 of 131
Table of Contents
EDITOR’S COMMENTARY .............................................................................6
PORTFOLIOS WITH “SIGNAL VALUE” ........................................................8 BILL ACKMAN, PERSHING SQUARE ............................................................................................ 9 ZEKE ASHTON, CENTAUR ....................................................................................................... 10 BRIAN BARES, BARES CAPITAL ............................................................................................... 11 BRUCE BERKOWITZ, FAIRHOLME............................................................................................. 12 WARREN BUFFETT, BERKSHIRE HATHAWAY ............................................................................ 13 IAN CUMMING & JOE STEINBERG, LEUCADIA ............................................................................ 14 DAVID EINHORN, GREENLIGHT ................................................................................................ 15 BRIAN GAINES, SPRINGHOUSE ............................................................................................... 16 TOM GAYNER, MARKEL GAYNER ............................................................................................ 17 GLENN GREENBERG, CHIEFTAIN ............................................................................................. 18 MASON HAWKINS, SOUTHEASTERN ......................................................................................... 19 CHRIS HOHN, CHILDREN’S INVESTMENT .................................................................................. 20 CARL ICAHN, ICAHN PARTNERS .............................................................................................. 21 SETH KLARMAN, BAUPOST ..................................................................................................... 22 EDDIE LAMPERT, RBS PARTNERS .......................................................................................... 23 DAN LOEB, THIRD POINT ........................................................................................................ 24 STEVE MANDEL, LONE PINE ................................................................................................... 25 MOHNISH PABRAI, PABRAI FUNDS ........................................................................................... 26 RICH PZENA, PZENA INVESTMENT ........................................................................................... 27 BRYANT RILEY, RILEY INVESTMENT ......................................................................................... 28 KEN SHUBIN STEIN, SPENCER ................................................................................................ 29 PREM WATSA, FAIRFAX.......................................................................................................... 30 WALLY WEITZ, WEITZ FUNDS ................................................................................................. 31 MARTY WHITMAN, THIRD AVENUE ........................................................................................... 32
EXCLUSIVE INTERVIEW WITH PAUL SONKIN ........................................ 33
SNAPSHOT OF 100 SUPERINVESTOR-OWNED COMPANIES ............... 40 IN ALPHABETICAL ORDER ....................................................................................................... 40 BY MARKET VALUE ................................................................................................................ 42 BY SECTOR ........................................................................................................................... 44 STOCK PRICE PERFORMANCE ................................................................................................ 46 FREE CASH FLOW ................................................................................................................. 48 P/E MULTIPLES ..................................................................................................................... 50 LATEST QUARTERLY EPS SURPRISES ..................................................................................... 52 REVENUE AND EPS GROWTH ................................................................................................. 54 PERCENTILE RANK WITHIN INDUSTRY ...................................................................................... 56 INSIDER BUYING AND OWNERSHIP .......................................................................................... 58
TOP FIVE SUPERINVESTOR SELECTIONS .............................................. 60 – ACKMAN , BARES , EINHORN .............................................................. 60
ATP OIL & GAS (ATPG) – EINHORN ................................................................................... 63 CAPITALSOURCE (CSE) – KLARMAN , LOEB ................................................................... 66 LOCKHEED MARTIN (LMT) – GREENBERG , HOHN .......................................................... 69
– ASHTON ......................................................................................... 71
NEW OR INCREASED SUPERINVESTOR HOLDINGS ............................. 74 ABBOTT LABS (ABT) – GAYNER .......................................................................................... 74 ALLEGHANY (Y) – ASHTON ................................................................................................. 77 BROOKFIELD PROPERTIES (BPO) – PABRAI ......................................................................... 79 CARDINAL HEALTH (CAH) – BERKOWITZ , EINHORN ........................................................ 82 UNITED AMERICA INDEMNITY (INDM) – PZENA ..................................................................... 85
© 2009 by BeyondProxy LLC. All rights reserved. www.manualofideas.com November 20, 2009 – Page 5 of 131
UNCHANGED (OR OFFSETTING) SUPERINVESTOR HOLDINGS .......... 87 BALDWIN & LYONS (BWINB) – WATSA ............................................................................... 87 BECTON DICKINSON (BDX) – BUFFETT ............................................................................... 90 BOEING (BA) – BERKOWITZ , PZENA .............................................................................. 93 CAMPBELL SOUP (CPB) – GAYNER .................................................................................... 96 CAPITAL SOUTHWEST (CSWC) – ASHTON , CUMMING/STEINBERG , WHITMAN .............. 99 FOREST CITY ENTERPRISES (FCE.A) – WHITMAN ............................................................. 102 JOHNSON & JOHNSON (JNJ) – BUFFETT , WATSA .......................................................... 104 MCDONALD’S (MCD) – ACKMAN , MANDEL ..................................................................... 108 MICROSOFT (MSFT) – WEITZ .......................................................................................... 111 MI DEVELOPMENTS (MIM) – EINHORN .............................................................................. 114
REDUCED OR ELIMINATED SUPERINVESTOR HOLDINGS ................. 117 ALLEGHENY ENERGY (AYE) – EINHORN , SHUBIN STEIN ............................................... 117 DREAMWORKS ANIMATION (DWA) – ASHTON ................................................................. 120 SYNERON (ELOS) – ASHTON , KLARMAN ..................................................................... 122 THOMAS PROPERTIES GROUP (TPGI) – WHITMAN ............................................................. 124
© 2009 by BeyondProxy LLC. All rights reserved. www.manualofideas.com November 20, 2009 – Page 8 of 131
Portfolios With “Signal Value” Revealing the Top Ideas of Top Investors
“Signal value” as opposed to “noise.” We present the
holdings of some of the world’s top investors. We look for
investors who have amassed impressive track records over
long periods of time. We choose these investors carefully
to avoid the noise inherent in most 13F-HR filings.
Top investors included in this section:
• William Ackman, Pershing Square • Zeke Ashton, Centaur • Brian Bares, Bares Capital • Bruce Berkowitz, Fairholme • Warren Buffett, Berkshire Hathaway • Ian Cumming & Joe Steinberg, Leucadia • David Einhorn, Greenlight • Glenn Greenberg, Chieftain • Brian Gaines, Springhouse • Tom Gayner, Markel Gayner • Mason Hawkins, Southeastern • Chris Hohn, Children’s Investment Fund • Carl Icahn, Icahn • Seth Klarman, Baupost • Eddie Lampert, RBS (ESL) • Dan Loeb, Third Point • Steve Mandel, Lone Pine • Mohnish Pabrai, Pabrai Funds • Rich Pzena, Pzena Investment • Bryant Riley, Riley Investment • Kenneth Shubin Stein, Spencer • Prem Watsa, Fairfax • Wally Weitz, Weitz Funds • Marty Whitman, Third Avenue
Missing your favorite superinvestor? Let us know at [email protected].
MOI Signal Rank answers the question, “What are this
investor’s top ten ideas right now?” Rather than simply
presenting each investor’s largest holdings as of the recently
filed quarter end, the MOI’s proprietary methodology ranks
the companies in each investor’s portfolio based on the
investor’s current level of conviction in each holding, as
judged by the MOI.
Our proprietary methodology takes into account
a number of variables, including the size of a position in an
investor’s portfolio, the size of a position relative to the
market value of the corresponding company, the most recent
quarterly change in the number of shares owned, and the
change in the stock price of a position since the most recent
quarterly filing date.
For example, an investor might have the most
conviction in a position that is only the tenth-largest
position in such investor’s portfolio. This might be the case
if an investor invests in a small company, resulting in a
holding that is simply too small to rank highly based on size
alone. On the other hand, such a holding might represent
19.9% of the shares outstanding of the subject company,
suggesting a high level of conviction. Our estimate of the
conviction level would rise further if the subject company
has a 20% poison-pill threshold, thereby suggesting that the
investor has bought as much of the subject company as is
practically feasible.
© 2009 by BeyondProxy LLC. All rights reserved. www.manualofideas.com November 20, 2009 – Page 9 of 131
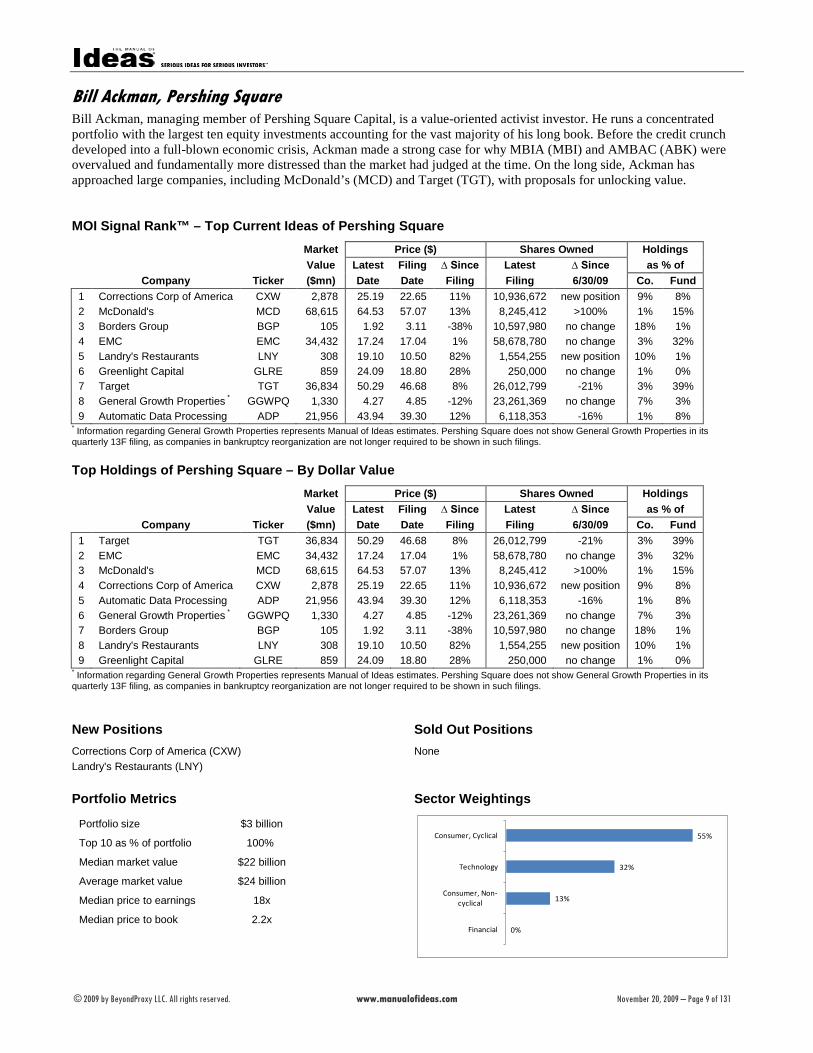
Bill Ackman, Pershing Square Bill Ackman, managing member of Pershing Square Capital, is a value-oriented activist investor. He runs a concentrated portfolio with the largest ten equity investments accounting for the vast majority of his long book. Before the credit crunch developed into a full-blown economic crisis, Ackman made a strong case for why MBIA (MBI) and AMBAC (ABK) were overvalued and fundamentally more distressed than the market had judged at the time. On the long side, Ackman has approached large companies, including McDonald’s (MCD) and Target (TGT), with proposals for unlocking value. MOI Signal Rank™ – Top Current Ideas of Pershing Square
Market Price ($) Shares Owned Holdings
Value Latest Filing ∆ Since Latest ∆ Since as % of Company Ticker ($mn) Date Date Filing Filing 6/30/09 Co. Fund 1 Corrections Corp of America CXW 2,878 25.19 22.65 11% 10,936,672 new position 9% 8% 2 McDonald's MCD 68,615 64.53 57.07 13% 8,245,412 >100% 1% 15% 3 Borders Group BGP 105 1.92 3.11 -38% 10,597,980 no change 18% 1% 4 EMC EMC 34,432 17.24 17.04 1% 58,678,780 no change 3% 32% 5 Landry's Restaurants LNY 308 19.10 10.50 82% 1,554,255 new position 10% 1% 6 Greenlight Capital GLRE 859 24.09 18.80 28% 250,000 no change 1% 0% 7 Target TGT 36,834 50.29 46.68 8% 26,012,799 -21% 3% 39% 8 General Growth Properties * GGWPQ 1,330 4.27 4.85 -12% 23,261,369 no change 7% 3% 9 Automatic Data Processing ADP 21,956 43.94 39.30 12% 6,118,353 -16% 1% 8%
* Information regarding General Growth Properties represents Manual of Ideas estimates. Pershing Square does not show General Growth Properties in its quarterly 13F filing, as companies in bankruptcy reorganization are not longer required to be shown in such filings. Top Holdings of Pershing Square – By Dollar Value
Market Price ($) Shares Owned Holdings
Value Latest Filing ∆ Since Latest ∆ Since as % of Company Ticker ($mn) Date Date Filing Filing 6/30/09 Co. Fund 1 Target TGT 36,834 50.29 46.68 8% 26,012,799 -21% 3% 39% 2 EMC EMC 34,432 17.24 17.04 1% 58,678,780 no change 3% 32% 3 McDonald's MCD 68,615 64.53 57.07 13% 8,245,412 >100% 1% 15% 4 Corrections Corp of America CXW 2,878 25.19 22.65 11% 10,936,672 new position 9% 8% 5 Automatic Data Processing ADP 21,956 43.94 39.30 12% 6,118,353 -16% 1% 8% 6 General Growth Properties * GGWPQ 1,330 4.27 4.85 -12% 23,261,369 no change 7% 3% 7 Borders Group BGP 105 1.92 3.11 -38% 10,597,980 no change 18% 1% 8 Landry's Restaurants LNY 308 19.10 10.50 82% 1,554,255 new position 10% 1% 9 Greenlight Capital GLRE 859 24.09 18.80 28% 250,000 no change 1% 0%
* Information regarding General Growth Properties represents Manual of Ideas estimates. Pershing Square does not show General Growth Properties in its quarterly 13F filing, as companies in bankruptcy reorganization are not longer required to be shown in such filings. New Positions Sold Out Positions Corrections Corp of America (CXW) Landry's Restaurants (LNY)
None
Portfolio Metrics Sector Weightings
Portfolio size $3 billion
Top 10 as % of portfolio 100%
Median market value $22 billion
Average market value $24 billion
Median price to earnings 18x
Median price to book 2.2x
0%
13%
32%
55%
Financial
Consumer, Non-cyclical
Technology
Consumer, Cyclical
© 2009 by BeyondProxy LLC. All rights reserved. www.manualofideas.com November 20, 2009 – Page 33 of 131
Exclusive Interview with Paul Sonkin
We recently had the pleasure of speaking with Paul Sonkin at his offices in New York. Paul is one of the most prominent value investors focused on micro cap and nano cap investing. He serves as portfolio manager of The Hummingbird Value Funds and the Tarsier Nanocap Value Fund. He is also an adjunct professor at Columbia Business School, where he teaches security analysis and value investing. He was previously a senior analyst at First Manhattan and an analyst and portfolio manager at Royce. Prior to receiving an MBA from Columbia, Paul worked at Goldman Sachs and at the SEC. He is a co-author of Value Investing: From Graham to Buffett and Beyond.
MOI: What was the genesis of your firm, and how would you describe your investment approach?
Paul Sonkin: I started in December of 1999, so we’re coming up on ten years. I had worked at Royce and then I had worked at First Manhattan. First Manhattan did large cap value, and I really wanted to get back to what I had done at Royce—which was micro cap value—because that’s what I really love. I met with Mario Gabelli and said I wanted to manage his micro cap fund. He had this guy who worked for him who had started a partnership, and he said, Why don’t you start a hedge fund and I’ll give you some money and own a piece of your management company? So that was how I really got the start at Hummingbird. It’s just old-school, Graham-and-Dodd-type value investing.
We’ve pushed the envelope a little bit—Bruce Greenwald talks about doing an asset value based on replacement cost, and then an earnings power value and an earnings power value with growth. The asset value is really Graham’s “net nets.” The earnings power value would be the low P/E. The earnings power value with growth is where you may be paying a full price for the current earnings power but you are getting all the growth for free. We tend to stay in the first two categories, although we have gotten into situations where we are paying for earnings that we firmly believe will materialize, but they haven’t materialized yet—and then we’re getting a lot of growth on top of that for free. That’s evident in a lot of the positions we have.
Our largest position now is a company called Rand Logistics (RLOG). We believe they’ll do about $0.40 in free cash flow [per share] in this fiscal year ending March [2010]. We think that will go up to $0.75 to $1 over time. The stock is at $3-3.25, so we think it’s a pretty good bargain.
Hummingbird was structured after the old Buffett Partnership and Graham-Newman. There are two sides to the portfolio: There is an arbitrage side, and there is a cheap stocks side. We look to keep to those roughly 50-50, although that’ll change over time. In the last few years, there hasn’t been a lot going on in arbitrage. There are a lot of spinoffs but none—that area is pretty well picked over. Liquidations used to be a great area to invest in, and that’s become very picked over. Even in micro cap risk arbitrage, we’ve seen more deals breaking, so that hasn’t been a great area for us.
“Our largest position is a company called Rand Logistics (RLOG). We
believe they’ll do about $0.40 in free cash flow [per share]
in this fiscal year ending March. We think that will go up to $0.75 to $1 over time. The stock is at $3-3.25…”
© 2009 by BeyondProxy LLC. All rights reserved. www.manualofideas.com November 20, 2009 – Page 40 of 131
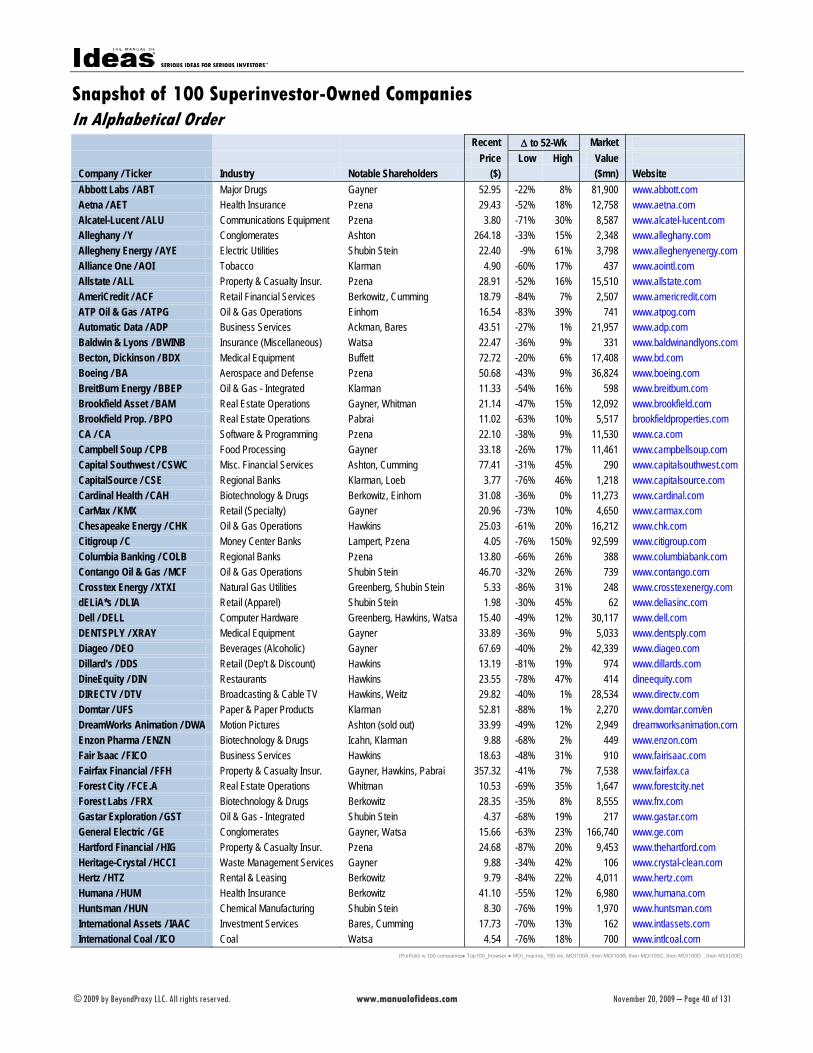
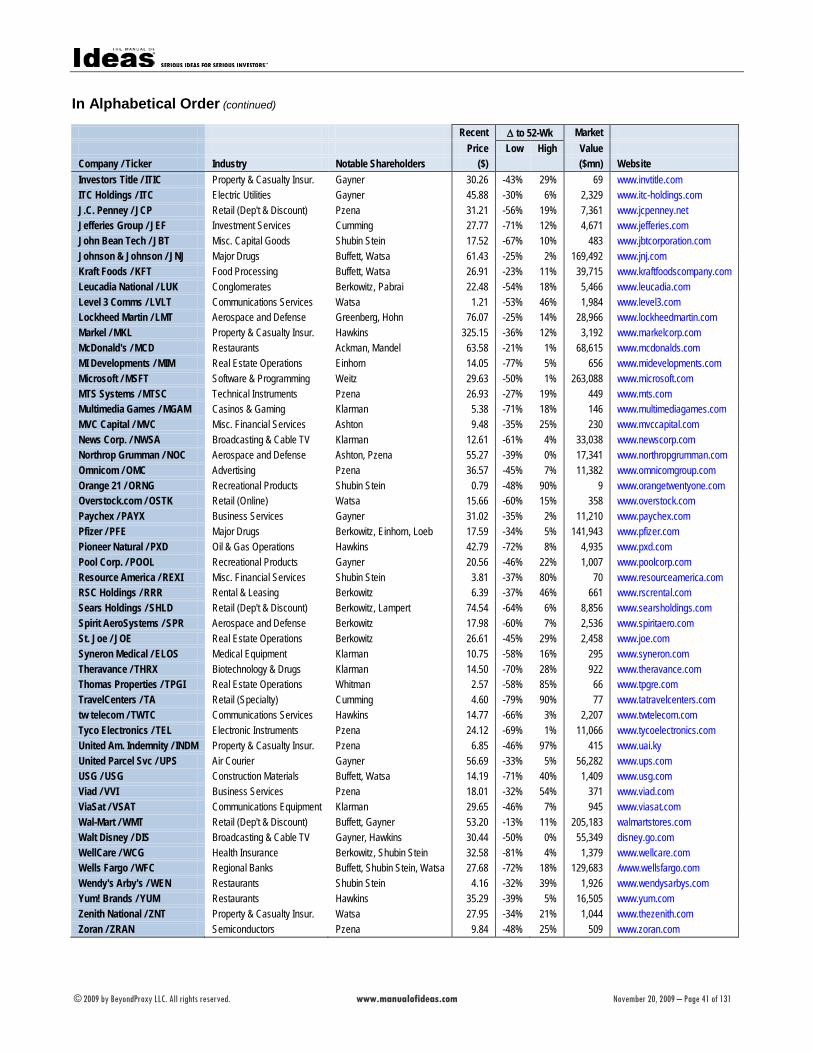
Snapshot of 100 Superinvestor-Owned Companies In Alphabetical Order
Recent ∆ to 52-Wk Market
Price Low High Value Company / Ticker Industry Notable Shareholders ($) ($mn) Website Abbott Labs / ABT Major Drugs Gayner 52.95 -22% 8% 81,900 www.abbott.com
Aetna / AET Health Insurance Pzena 29.43 -52% 18% 12,758 www.aetna.com
Alcatel-Lucent / ALU Communications Equipment Pzena 3.80 -71% 30% 8,587 www.alcatel-lucent.com
Alleghany / Y Conglomerates Ashton 264.18 -33% 15% 2,348 www.alleghany.com
Allegheny Energy / AYE Electric Utilities Shubin Stein 22.40 -9% 61% 3,798 www.alleghenyenergy.com
Alliance One / AOI Tobacco Klarman 4.90 -60% 17% 437 www.aointl.com
Allstate / ALL Property & Casualty Insur. Pzena 28.91 -52% 16% 15,510 www.allstate.com
AmeriCredit / ACF Retail Financial Services Berkowitz, Cumming 18.79 -84% 7% 2,507 www.americredit.com
ATP Oil & Gas / ATPG Oil & Gas Operations Einhorn 16.54 -83% 39% 741 www.atpog.com
Automatic Data / ADP Business Services Ackman, Bares 43.51 -27% 1% 21,957 www.adp.com
Baldwin & Lyons / BWINB Insurance (Miscellaneous) Watsa 22.47 -36% 9% 331 www.baldwinandlyons.com
Becton, Dickinson / BDX Medical Equipment Buffett 72.72 -20% 6% 17,408 www.bd.com
Boeing / BA Aerospace and Defense Pzena 50.68 -43% 9% 36,824 www.boeing.com
BreitBurn Energy / BBEP Oil & Gas - Integrated Klarman 11.33 -54% 16% 598 www.breitburn.com
Brookfield Asset / BAM Real Estate Operations Gayner, Whitman 21.14 -47% 15% 12,092 www.brookfield.com
Brookfield Prop. / BPO Real Estate Operations Pabrai 11.02 -63% 10% 5,517 brookfieldproperties.com
CA / CA Software & Programming Pzena 22.10 -38% 9% 11,530 www.ca.com
Campbell Soup / CPB Food Processing Gayner 33.18 -26% 17% 11,461 www.campbellsoup.com
Capital Southwest / CSWC Misc. Financial Services Ashton, Cumming 77.41 -31% 45% 290 www.capitalsouthwest.com
CapitalSource / CSE Regional Banks Klarman, Loeb 3.77 -76% 46% 1,218 www.capitalsource.com
Cardinal Health / CAH Biotechnology & Drugs Berkowitz, Einhorn 31.08 -36% 0% 11,273 www.cardinal.com
CarMax / KMX Retail (Specialty) Gayner 20.96 -73% 10% 4,650 www.carmax.com
Chesapeake Energy / CHK Oil & Gas Operations Hawkins 25.03 -61% 20% 16,212 www.chk.com
Citigroup / C Money Center Banks Lampert, Pzena 4.05 -76% 150% 92,599 www.citigroup.com
Columbia Banking / COLB Regional Banks Pzena 13.80 -66% 26% 388 www.columbiabank.com
Contango Oil & Gas / MCF Oil & Gas Operations Shubin Stein 46.70 -32% 26% 739 www.contango.com
Crosstex Energy / XTXI Natural Gas Utilities Greenberg, Shubin Stein 5.33 -86% 31% 248 www.crosstexenergy.com
dELiA*s / DLIA Retail (Apparel) Shubin Stein 1.98 -30% 45% 62 www.deliasinc.com
Dell / DELL Computer Hardware Greenberg, Hawkins, Watsa 15.40 -49% 12% 30,117 www.dell.com
DENTSPLY / XRAY Medical Equipment Gayner 33.89 -36% 9% 5,033 www.dentsply.com
Diageo / DEO Beverages (Alcoholic) Gayner 67.69 -40% 2% 42,339 www.diageo.com
Dillard's / DDS Retail (Dep't & Discount) Hawkins 13.19 -81% 19% 974 www.dillards.com
DineEquity / DIN Restaurants Hawkins 23.55 -78% 47% 414 dineequity.com
DIRECTV / DTV Broadcasting & Cable TV Hawkins, Weitz 29.82 -40% 1% 28,534 www.directv.com
Domtar / UFS Paper & Paper Products Klarman 52.81 -88% 1% 2,270 www.domtar.com/en
DreamWorks Animation / DWA Motion Pictures Ashton (sold out) 33.99 -49% 12% 2,949 dreamworksanimation.com
Enzon Pharma / ENZN Biotechnology & Drugs Icahn, Klarman 9.88 -68% 2% 449 www.enzon.com
Fair Isaac / FICO Business Services Hawkins 18.63 -48% 31% 910 www.fairisaac.com
Fairfax Financial / FFH Property & Casualty Insur. Gayner, Hawkins, Pabrai 357.32 -41% 7% 7,538 www.fairfax.ca
Forest City / FCE.A Real Estate Operations Whitman 10.53 -69% 35% 1,647 www.forestcity.net
Forest Labs / FRX Biotechnology & Drugs Berkowitz 28.35 -35% 8% 8,555 www.frx.com
Gastar Exploration / GST Oil & Gas - Integrated Shubin Stein 4.37 -68% 19% 217 www.gastar.com
General Electric / GE Conglomerates Gayner, Watsa 15.66 -63% 23% 166,740 www.ge.com
Hartford Financial / HIG Property & Casualty Insur. Pzena 24.68 -87% 20% 9,453 www.thehartford.com
Heritage-Crystal / HCCI Waste Management Services Gayner 9.88 -34% 42% 106 www.crystal-clean.com
Hertz / HTZ Rental & Leasing Berkowitz 9.79 -84% 22% 4,011 www.hertz.com
Humana / HUM Health Insurance Berkowitz 41.10 -55% 12% 6,980 www.humana.com
Huntsman / HUN Chemical Manufacturing Shubin Stein 8.30 -76% 19% 1,970 www.huntsman.com
International Assets / IAAC Investment Services Bares, Cumming 17.73 -70% 13% 162 www.intlassets.com
International Coal / ICO Coal Watsa 4.54 -76% 18% 700 www.intlcoal.com
[Portfolio w 100 companies ● Top100_browser ● MOI_macros_100.xls, MOI100A, then MOI100B, then MOI100C, then MOI100D , then MOI100E]
© 2009 by BeyondProxy LLC. All rights reserved. www.manualofideas.com November 20, 2009 – Page 41 of 131
In Alphabetical Order (continued)
Recent ∆ to 52-Wk Market Price Low High Value Company / Ticker Industry Notable Shareholders ($) ($mn) Website Investors Title / ITIC Property & Casualty Insur. Gayner 30.26 -43% 29% 69 www.invtitle.com
ITC Holdings / ITC Electric Utilities Gayner 45.88 -30% 6% 2,329 www.itc-holdings.com
J.C. Penney / JCP Retail (Dep't & Discount) Pzena 31.21 -56% 19% 7,361 www.jcpenney.net
Jefferies Group / JEF Investment Services Cumming 27.77 -71% 12% 4,671 www.jefferies.com
John Bean Tech / JBT Misc. Capital Goods Shubin Stein 17.52 -67% 10% 483 www.jbtcorporation.com
Johnson & Johnson / JNJ Major Drugs Buffett, Watsa 61.43 -25% 2% 169,492 www.jnj.com
Kraft Foods / KFT Food Processing Buffett, Watsa 26.91 -23% 11% 39,715 www.kraftfoodscompany.com
Leucadia National / LUK Conglomerates Berkowitz, Pabrai 22.48 -54% 18% 5,466 www.leucadia.com
Level 3 Comms / LVLT Communications Services Watsa 1.21 -53% 46% 1,984 www.level3.com
Lockheed Martin / LMT Aerospace and Defense Greenberg, Hohn 76.07 -25% 14% 28,966 www.lockheedmartin.com
Markel / MKL Property & Casualty Insur. Hawkins 325.15 -36% 12% 3,192 www.markelcorp.com
McDonald's / MCD Restaurants Ackman, Mandel 63.58 -21% 1% 68,615 www.mcdonalds.com
MI Developments / MIM Real Estate Operations Einhorn 14.05 -77% 5% 656 www.midevelopments.com
Microsoft / MSFT Software & Programming Weitz 29.63 -50% 1% 263,088 www.microsoft.com
MTS Systems / MTSC Technical Instruments Pzena 26.93 -27% 19% 449 www.mts.com
Multimedia Games / MGAM Casinos & Gaming Klarman 5.38 -71% 18% 146 www.multimediagames.com
MVC Capital / MVC Misc. Financial Services Ashton 9.48 -35% 25% 230 www.mvccapital.com
News Corp. / NWSA Broadcasting & Cable TV Klarman 12.61 -61% 4% 33,038 www.newscorp.com
Northrop Grumman / NOC Aerospace and Defense Ashton, Pzena 55.27 -39% 0% 17,341 www.northropgrumman.com
Omnicom / OMC Advertising Pzena 36.57 -45% 7% 11,382 www.omnicomgroup.com
Orange 21 / ORNG Recreational Products Shubin Stein 0.79 -48% 90% 9 www.orangetwentyone.com
Overstock.com / OSTK Retail (Online) Watsa 15.66 -60% 15% 358 www.overstock.com
Paychex / PAYX Business Services Gayner 31.02 -35% 2% 11,210 www.paychex.com
Pfizer / PFE Major Drugs Berkowitz, Einhorn, Loeb 17.59 -34% 5% 141,943 www.pfizer.com
Pioneer Natural / PXD Oil & Gas Operations Hawkins 42.79 -72% 8% 4,935 www.pxd.com
Pool Corp. / POOL Recreational Products Gayner 20.56 -46% 22% 1,007 www.poolcorp.com
Resource America / REXI Misc. Financial Services Shubin Stein 3.81 -37% 80% 70 www.resourceamerica.com
RSC Holdings / RRR Rental & Leasing Berkowitz 6.39 -37% 46% 661 www.rscrental.com
Sears Holdings / SHLD Retail (Dep't & Discount) Berkowitz, Lampert 74.54 -64% 6% 8,856 www.searsholdings.com
Spirit AeroSystems / SPR Aerospace and Defense Berkowitz 17.98 -60% 7% 2,536 www.spiritaero.com
St. Joe / JOE Real Estate Operations Berkowitz 26.61 -45% 29% 2,458 www.joe.com
Syneron Medical / ELOS Medical Equipment Klarman 10.75 -58% 16% 295 www.syneron.com
Theravance / THRX Biotechnology & Drugs Klarman 14.50 -70% 28% 922 www.theravance.com
Thomas Properties / TPGI Real Estate Operations Whitman 2.57 -58% 85% 66 www.tpgre.com
TravelCenters / TA Retail (Specialty) Cumming 4.60 -79% 90% 77 www.tatravelcenters.com
tw telecom / TWTC Communications Services Hawkins 14.77 -66% 3% 2,207 www.twtelecom.com
Tyco Electronics / TEL Electronic Instruments Pzena 24.12 -69% 1% 11,066 www.tycoelectronics.com
United Am. Indemnity / INDM Property & Casualty Insur. Pzena 6.85 -46% 97% 415 www.uai.ky
United Parcel Svc / UPS Air Courier Gayner 56.69 -33% 5% 56,282 www.ups.com
USG / USG Construction Materials Buffett, Watsa 14.19 -71% 40% 1,409 www.usg.com
Viad / VVI Business Services Pzena 18.01 -32% 54% 371 www.viad.com
ViaSat / VSAT Communications Equipment Klarman 29.65 -46% 7% 945 www.viasat.com
Wal-Mart / WMT Retail (Dep't & Discount) Buffett, Gayner 53.20 -13% 11% 205,183 walmartstores.com
Walt Disney / DIS Broadcasting & Cable TV Gayner, Hawkins 30.44 -50% 0% 55,349 disney.go.com
WellCare / WCG Health Insurance Berkowitz, Shubin Stein 32.58 -81% 4% 1,379 www.wellcare.com
Wells Fargo / WFC Regional Banks Buffett, Shubin Stein, Watsa 27.68 -72% 18% 129,683 /www.wellsfargo.com
Wendy's Arby's / WEN Restaurants Shubin Stein 4.16 -32% 39% 1,926 www.wendysarbys.com
Yum! Brands / YUM Restaurants Hawkins 35.29 -39% 5% 16,505 www.yum.com
Zenith National / ZNT Property & Casualty Insur. Watsa 27.95 -34% 21% 1,044 www.thezenith.com
Zoran / ZRAN Semiconductors Pzena 9.84 -48% 25% 509 www.zoran.com
© 2009 by BeyondProxy LLC. All rights reserved. www.manualofideas.com November 20, 2009 – Page 42 of 131
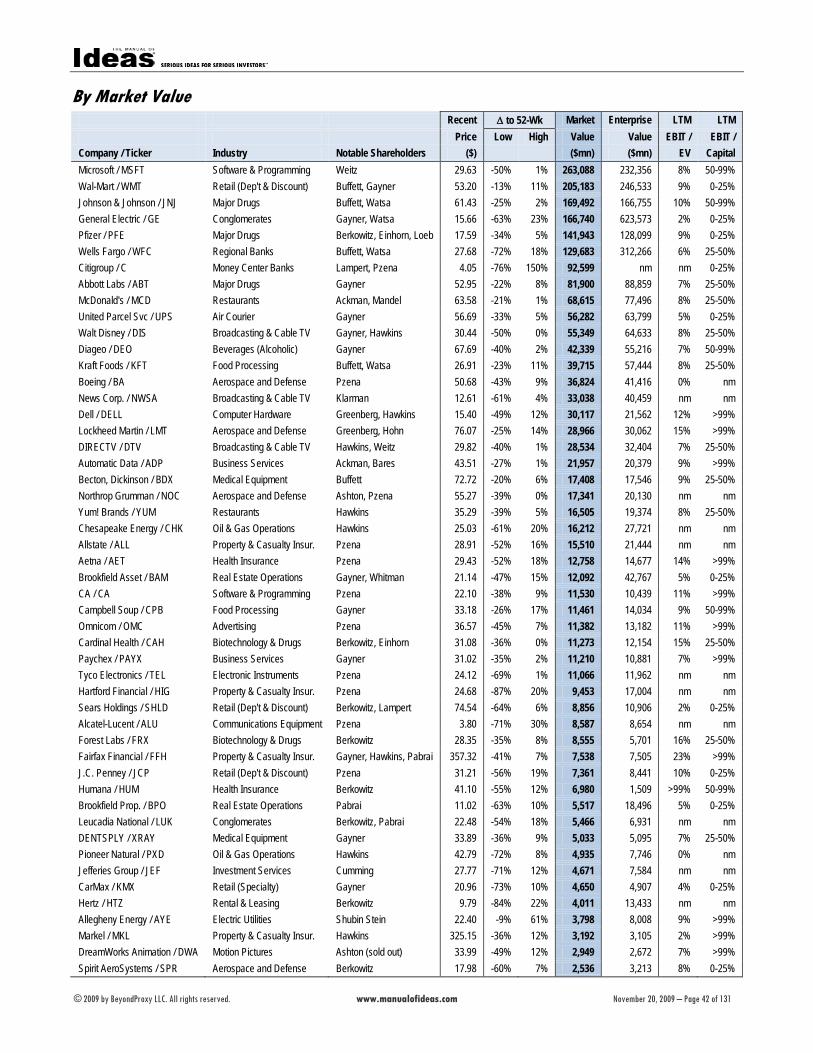
By Market Value Recent ∆ to 52-Wk Market Enterprise LTM LTM Price Low High Value Value EBIT / EBIT / Company / Ticker Industry Notable Shareholders ($) ($mn) ($mn) EV Capital Microsoft / MSFT Software & Programming Weitz 29.63 -50% 1% 263,088 232,356 8% 50-99% Wal-Mart / WMT Retail (Dep't & Discount) Buffett, Gayner 53.20 -13% 11% 205,183 246,533 9% 0-25% Johnson & Johnson / JNJ Major Drugs Buffett, Watsa 61.43 -25% 2% 169,492 166,755 10% 50-99% General Electric / GE Conglomerates Gayner, Watsa 15.66 -63% 23% 166,740 623,573 2% 0-25% Pfizer / PFE Major Drugs Berkowitz, Einhorn, Loeb 17.59 -34% 5% 141,943 128,099 9% 0-25% Wells Fargo / WFC Regional Banks Buffett, Watsa 27.68 -72% 18% 129,683 312,266 6% 25-50% Citigroup / C Money Center Banks Lampert, Pzena 4.05 -76% 150% 92,599 nm nm 0-25% Abbott Labs / ABT Major Drugs Gayner 52.95 -22% 8% 81,900 88,859 7% 25-50% McDonald's / MCD Restaurants Ackman, Mandel 63.58 -21% 1% 68,615 77,496 8% 25-50% United Parcel Svc / UPS Air Courier Gayner 56.69 -33% 5% 56,282 63,799 5% 0-25% Walt Disney / DIS Broadcasting & Cable TV Gayner, Hawkins 30.44 -50% 0% 55,349 64,633 8% 25-50% Diageo / DEO Beverages (Alcoholic) Gayner 67.69 -40% 2% 42,339 55,216 7% 50-99% Kraft Foods / KFT Food Processing Buffett, Watsa 26.91 -23% 11% 39,715 57,444 8% 25-50% Boeing / BA Aerospace and Defense Pzena 50.68 -43% 9% 36,824 41,416 0% nm News Corp. / NWSA Broadcasting & Cable TV Klarman 12.61 -61% 4% 33,038 40,459 nm nm Dell / DELL Computer Hardware Greenberg, Hawkins 15.40 -49% 12% 30,117 21,562 12% >99% Lockheed Martin / LMT Aerospace and Defense Greenberg, Hohn 76.07 -25% 14% 28,966 30,062 15% >99% DIRECTV / DTV Broadcasting & Cable TV Hawkins, Weitz 29.82 -40% 1% 28,534 32,404 7% 25-50% Automatic Data / ADP Business Services Ackman, Bares 43.51 -27% 1% 21,957 20,379 9% >99% Becton, Dickinson / BDX Medical Equipment Buffett 72.72 -20% 6% 17,408 17,546 9% 25-50% Northrop Grumman / NOC Aerospace and Defense Ashton, Pzena 55.27 -39% 0% 17,341 20,130 nm nm Yum! Brands / YUM Restaurants Hawkins 35.29 -39% 5% 16,505 19,374 8% 25-50% Chesapeake Energy / CHK Oil & Gas Operations Hawkins 25.03 -61% 20% 16,212 27,721 nm nm Allstate / ALL Property & Casualty Insur. Pzena 28.91 -52% 16% 15,510 21,444 nm nm Aetna / AET Health Insurance Pzena 29.43 -52% 18% 12,758 14,677 14% >99% Brookfield Asset / BAM Real Estate Operations Gayner, Whitman 21.14 -47% 15% 12,092 42,767 5% 0-25% CA / CA Software & Programming Pzena 22.10 -38% 9% 11,530 10,439 11% >99% Campbell Soup / CPB Food Processing Gayner 33.18 -26% 17% 11,461 14,034 9% 50-99% Omnicom / OMC Advertising Pzena 36.57 -45% 7% 11,382 13,182 11% >99% Cardinal Health / CAH Biotechnology & Drugs Berkowitz, Einhorn 31.08 -36% 0% 11,273 12,154 15% 25-50% Paychex / PAYX Business Services Gayner 31.02 -35% 2% 11,210 10,881 7% >99% Tyco Electronics / TEL Electronic Instruments Pzena 24.12 -69% 1% 11,066 11,962 nm nm Hartford Financial / HIG Property & Casualty Insur. Pzena 24.68 -87% 20% 9,453 17,004 nm nm Sears Holdings / SHLD Retail (Dep't & Discount) Berkowitz, Lampert 74.54 -64% 6% 8,856 10,906 2% 0-25% Alcatel-Lucent / ALU Communications Equipment Pzena 3.80 -71% 30% 8,587 8,654 nm nm Forest Labs / FRX Biotechnology & Drugs Berkowitz 28.35 -35% 8% 8,555 5,701 16% 25-50% Fairfax Financial / FFH Property & Casualty Insur. Gayner, Hawkins, Pabrai 357.32 -41% 7% 7,538 7,505 23% >99% J.C. Penney / JCP Retail (Dep't & Discount) Pzena 31.21 -56% 19% 7,361 8,441 10% 0-25% Humana / HUM Health Insurance Berkowitz 41.10 -55% 12% 6,980 1,509 >99% 50-99% Brookfield Prop. / BPO Real Estate Operations Pabrai 11.02 -63% 10% 5,517 18,496 5% 0-25% Leucadia National / LUK Conglomerates Berkowitz, Pabrai 22.48 -54% 18% 5,466 6,931 nm nm DENTSPLY / XRAY Medical Equipment Gayner 33.89 -36% 9% 5,033 5,095 7% 25-50% Pioneer Natural / PXD Oil & Gas Operations Hawkins 42.79 -72% 8% 4,935 7,746 0% nm Jefferies Group / JEF Investment Services Cumming 27.77 -71% 12% 4,671 7,584 nm nm CarMax / KMX Retail (Specialty) Gayner 20.96 -73% 10% 4,650 4,907 4% 0-25% Hertz / HTZ Rental & Leasing Berkowitz 9.79 -84% 22% 4,011 13,433 nm nm Allegheny Energy / AYE Electric Utilities Shubin Stein 22.40 -9% 61% 3,798 8,008 9% >99% Markel / MKL Property & Casualty Insur. Hawkins 325.15 -36% 12% 3,192 3,105 2% >99% DreamWorks Animation / DWA Motion Pictures Ashton (sold out) 33.99 -49% 12% 2,949 2,672 7% >99% Spirit AeroSystems / SPR Aerospace and Defense Berkowitz 17.98 -60% 7% 2,536 3,213 8% 0-25%
© 2009 by BeyondProxy LLC. All rights reserved. www.manualofideas.com November 20, 2009 – Page 43 of 131
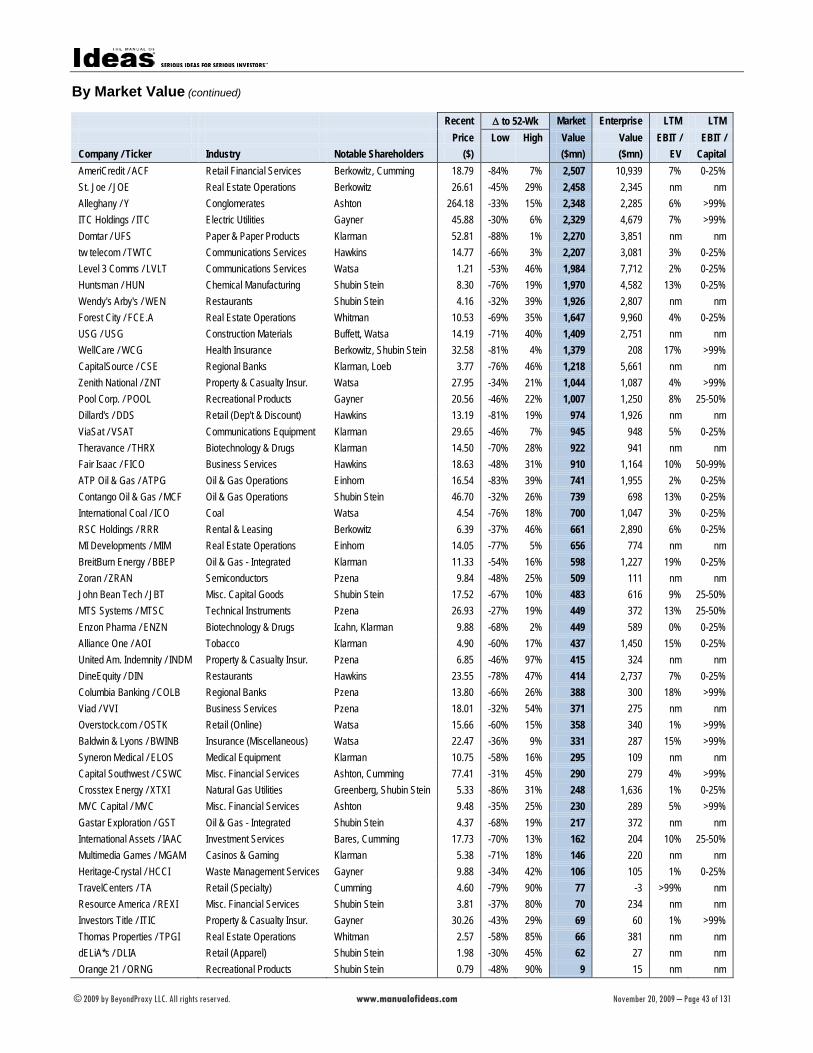
By Market Value (continued)
Recent ∆ to 52-Wk Market Enterprise LTM LTM Price Low High Value Value EBIT / EBIT / Company / Ticker Industry Notable Shareholders ($) ($mn) ($mn) EV Capital AmeriCredit / ACF Retail Financial Services Berkowitz, Cumming 18.79 -84% 7% 2,507 10,939 7% 0-25% St. Joe / JOE Real Estate Operations Berkowitz 26.61 -45% 29% 2,458 2,345 nm nm Alleghany / Y Conglomerates Ashton 264.18 -33% 15% 2,348 2,285 6% >99% ITC Holdings / ITC Electric Utilities Gayner 45.88 -30% 6% 2,329 4,679 7% >99% Domtar / UFS Paper & Paper Products Klarman 52.81 -88% 1% 2,270 3,851 nm nm tw telecom / TWTC Communications Services Hawkins 14.77 -66% 3% 2,207 3,081 3% 0-25% Level 3 Comms / LVLT Communications Services Watsa 1.21 -53% 46% 1,984 7,712 2% 0-25% Huntsman / HUN Chemical Manufacturing Shubin Stein 8.30 -76% 19% 1,970 4,582 13% 0-25% Wendy's Arby's / WEN Restaurants Shubin Stein 4.16 -32% 39% 1,926 2,807 nm nm Forest City / FCE.A Real Estate Operations Whitman 10.53 -69% 35% 1,647 9,960 4% 0-25% USG / USG Construction Materials Buffett, Watsa 14.19 -71% 40% 1,409 2,751 nm nm WellCare / WCG Health Insurance Berkowitz, Shubin Stein 32.58 -81% 4% 1,379 208 17% >99% CapitalSource / CSE Regional Banks Klarman, Loeb 3.77 -76% 46% 1,218 5,661 nm nm Zenith National / ZNT Property & Casualty Insur. Watsa 27.95 -34% 21% 1,044 1,087 4% >99% Pool Corp. / POOL Recreational Products Gayner 20.56 -46% 22% 1,007 1,250 8% 25-50% Dillard's / DDS Retail (Dep't & Discount) Hawkins 13.19 -81% 19% 974 1,926 nm nm ViaSat / VSAT Communications Equipment Klarman 29.65 -46% 7% 945 948 5% 0-25% Theravance / THRX Biotechnology & Drugs Klarman 14.50 -70% 28% 922 941 nm nm Fair Isaac / FICO Business Services Hawkins 18.63 -48% 31% 910 1,164 10% 50-99% ATP Oil & Gas / ATPG Oil & Gas Operations Einhorn 16.54 -83% 39% 741 1,955 2% 0-25% Contango Oil & Gas / MCF Oil & Gas Operations Shubin Stein 46.70 -32% 26% 739 698 13% 0-25% International Coal / ICO Coal Watsa 4.54 -76% 18% 700 1,047 3% 0-25% RSC Holdings / RRR Rental & Leasing Berkowitz 6.39 -37% 46% 661 2,890 6% 0-25% MI Developments / MIM Real Estate Operations Einhorn 14.05 -77% 5% 656 774 nm nm BreitBurn Energy / BBEP Oil & Gas - Integrated Klarman 11.33 -54% 16% 598 1,227 19% 0-25% Zoran / ZRAN Semiconductors Pzena 9.84 -48% 25% 509 111 nm nm John Bean Tech / JBT Misc. Capital Goods Shubin Stein 17.52 -67% 10% 483 616 9% 25-50% MTS Systems / MTSC Technical Instruments Pzena 26.93 -27% 19% 449 372 13% 25-50% Enzon Pharma / ENZN Biotechnology & Drugs Icahn, Klarman 9.88 -68% 2% 449 589 0% 0-25% Alliance One / AOI Tobacco Klarman 4.90 -60% 17% 437 1,450 15% 0-25% United Am. Indemnity / INDM Property & Casualty Insur. Pzena 6.85 -46% 97% 415 324 nm nm DineEquity / DIN Restaurants Hawkins 23.55 -78% 47% 414 2,737 7% 0-25% Columbia Banking / COLB Regional Banks Pzena 13.80 -66% 26% 388 300 18% >99% Viad / VVI Business Services Pzena 18.01 -32% 54% 371 275 nm nm Overstock.com / OSTK Retail (Online) Watsa 15.66 -60% 15% 358 340 1% >99% Baldwin & Lyons / BWINB Insurance (Miscellaneous) Watsa 22.47 -36% 9% 331 287 15% >99% Syneron Medical / ELOS Medical Equipment Klarman 10.75 -58% 16% 295 109 nm nm Capital Southwest / CSWC Misc. Financial Services Ashton, Cumming 77.41 -31% 45% 290 279 4% >99% Crosstex Energy / XTXI Natural Gas Utilities Greenberg, Shubin Stein 5.33 -86% 31% 248 1,636 1% 0-25% MVC Capital / MVC Misc. Financial Services Ashton 9.48 -35% 25% 230 289 5% >99% Gastar Exploration / GST Oil & Gas - Integrated Shubin Stein 4.37 -68% 19% 217 372 nm nm International Assets / IAAC Investment Services Bares, Cumming 17.73 -70% 13% 162 204 10% 25-50% Multimedia Games / MGAM Casinos & Gaming Klarman 5.38 -71% 18% 146 220 nm nm Heritage-Crystal / HCCI Waste Management Services Gayner 9.88 -34% 42% 106 105 1% 0-25% TravelCenters / TA Retail (Specialty) Cumming 4.60 -79% 90% 77 -3 >99% nm Resource America / REXI Misc. Financial Services Shubin Stein 3.81 -37% 80% 70 234 nm nm Investors Title / ITIC Property & Casualty Insur. Gayner 30.26 -43% 29% 69 60 1% >99% Thomas Properties / TPGI Real Estate Operations Whitman 2.57 -58% 85% 66 381 nm nm dELiA*s / DLIA Retail (Apparel) Shubin Stein 1.98 -30% 45% 62 27 nm nm Orange 21 / ORNG Recreational Products Shubin Stein 0.79 -48% 90% 9 15 nm nm
© 2009 by BeyondProxy LLC. All rights reserved. www.manualofideas.com November 20, 2009 – Page 44 of 131
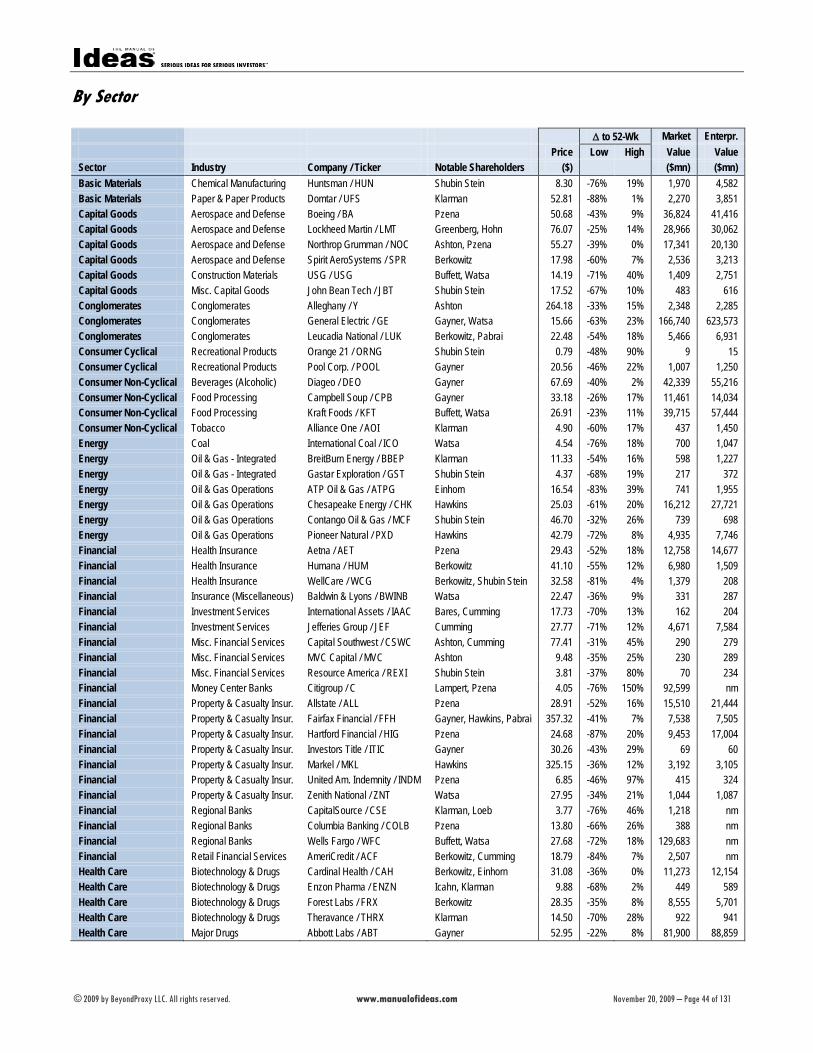
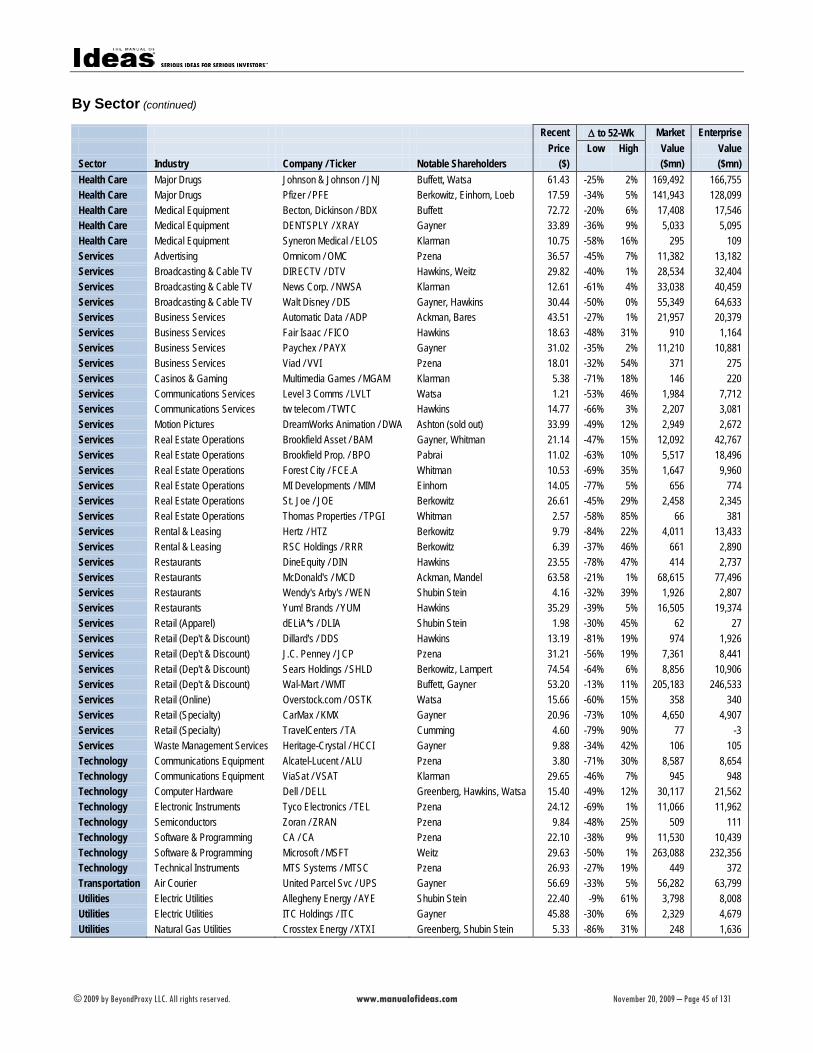
By Sector
∆ to 52-Wk Market Enterpr. Price Low High Value Value Sector Industry Company / Ticker Notable Shareholders ($) ($mn) ($mn) Basic Materials Chemical Manufacturing Huntsman / HUN Shubin Stein 8.30 -76% 19% 1,970 4,582 Basic Materials Paper & Paper Products Domtar / UFS Klarman 52.81 -88% 1% 2,270 3,851 Capital Goods Aerospace and Defense Boeing / BA Pzena 50.68 -43% 9% 36,824 41,416 Capital Goods Aerospace and Defense Lockheed Martin / LMT Greenberg, Hohn 76.07 -25% 14% 28,966 30,062 Capital Goods Aerospace and Defense Northrop Grumman / NOC Ashton, Pzena 55.27 -39% 0% 17,341 20,130 Capital Goods Aerospace and Defense Spirit AeroSystems / SPR Berkowitz 17.98 -60% 7% 2,536 3,213 Capital Goods Construction Materials USG / USG Buffett, Watsa 14.19 -71% 40% 1,409 2,751 Capital Goods Misc. Capital Goods John Bean Tech / JBT Shubin Stein 17.52 -67% 10% 483 616 Conglomerates Conglomerates Alleghany / Y Ashton 264.18 -33% 15% 2,348 2,285 Conglomerates Conglomerates General Electric / GE Gayner, Watsa 15.66 -63% 23% 166,740 623,573 Conglomerates Conglomerates Leucadia National / LUK Berkowitz, Pabrai 22.48 -54% 18% 5,466 6,931 Consumer Cyclical Recreational Products Orange 21 / ORNG Shubin Stein 0.79 -48% 90% 9 15 Consumer Cyclical Recreational Products Pool Corp. / POOL Gayner 20.56 -46% 22% 1,007 1,250 Consumer Non-Cyclical Beverages (Alcoholic) Diageo / DEO Gayner 67.69 -40% 2% 42,339 55,216 Consumer Non-Cyclical Food Processing Campbell Soup / CPB Gayner 33.18 -26% 17% 11,461 14,034 Consumer Non-Cyclical Food Processing Kraft Foods / KFT Buffett, Watsa 26.91 -23% 11% 39,715 57,444 Consumer Non-Cyclical Tobacco Alliance One / AOI Klarman 4.90 -60% 17% 437 1,450 Energy Coal International Coal / ICO Watsa 4.54 -76% 18% 700 1,047 Energy Oil & Gas - Integrated BreitBurn Energy / BBEP Klarman 11.33 -54% 16% 598 1,227 Energy Oil & Gas - Integrated Gastar Exploration / GST Shubin Stein 4.37 -68% 19% 217 372 Energy Oil & Gas Operations ATP Oil & Gas / ATPG Einhorn 16.54 -83% 39% 741 1,955 Energy Oil & Gas Operations Chesapeake Energy / CHK Hawkins 25.03 -61% 20% 16,212 27,721 Energy Oil & Gas Operations Contango Oil & Gas / MCF Shubin Stein 46.70 -32% 26% 739 698 Energy Oil & Gas Operations Pioneer Natural / PXD Hawkins 42.79 -72% 8% 4,935 7,746 Financial Health Insurance Aetna / AET Pzena 29.43 -52% 18% 12,758 14,677 Financial Health Insurance Humana / HUM Berkowitz 41.10 -55% 12% 6,980 1,509 Financial Health Insurance WellCare / WCG Berkowitz, Shubin Stein 32.58 -81% 4% 1,379 208 Financial Insurance (Miscellaneous) Baldwin & Lyons / BWINB Watsa 22.47 -36% 9% 331 287 Financial Investment Services International Assets / IAAC Bares, Cumming 17.73 -70% 13% 162 204 Financial Investment Services Jefferies Group / JEF Cumming 27.77 -71% 12% 4,671 7,584 Financial Misc. Financial Services Capital Southwest / CSWC Ashton, Cumming 77.41 -31% 45% 290 279 Financial Misc. Financial Services MVC Capital / MVC Ashton 9.48 -35% 25% 230 289 Financial Misc. Financial Services Resource America / REXI Shubin Stein 3.81 -37% 80% 70 234 Financial Money Center Banks Citigroup / C Lampert, Pzena 4.05 -76% 150% 92,599 nm Financial Property & Casualty Insur. Allstate / ALL Pzena 28.91 -52% 16% 15,510 21,444 Financial Property & Casualty Insur. Fairfax Financial / FFH Gayner, Hawkins, Pabrai 357.32 -41% 7% 7,538 7,505 Financial Property & Casualty Insur. Hartford Financial / HIG Pzena 24.68 -87% 20% 9,453 17,004 Financial Property & Casualty Insur. Investors Title / ITIC Gayner 30.26 -43% 29% 69 60 Financial Property & Casualty Insur. Markel / MKL Hawkins 325.15 -36% 12% 3,192 3,105 Financial Property & Casualty Insur. United Am. Indemnity / INDM Pzena 6.85 -46% 97% 415 324 Financial Property & Casualty Insur. Zenith National / ZNT Watsa 27.95 -34% 21% 1,044 1,087 Financial Regional Banks CapitalSource / CSE Klarman, Loeb 3.77 -76% 46% 1,218 nm Financial Regional Banks Columbia Banking / COLB Pzena 13.80 -66% 26% 388 nm Financial Regional Banks Wells Fargo / WFC Buffett, Watsa 27.68 -72% 18% 129,683 nm Financial Retail Financial Services AmeriCredit / ACF Berkowitz, Cumming 18.79 -84% 7% 2,507 nm Health Care Biotechnology & Drugs Cardinal Health / CAH Berkowitz, Einhorn 31.08 -36% 0% 11,273 12,154 Health Care Biotechnology & Drugs Enzon Pharma / ENZN Icahn, Klarman 9.88 -68% 2% 449 589 Health Care Biotechnology & Drugs Forest Labs / FRX Berkowitz 28.35 -35% 8% 8,555 5,701 Health Care Biotechnology & Drugs Theravance / THRX Klarman 14.50 -70% 28% 922 941 Health Care Major Drugs Abbott Labs / ABT Gayner 52.95 -22% 8% 81,900 88,859
© 2009 by BeyondProxy LLC. All rights reserved. www.manualofideas.com November 20, 2009 – Page 45 of 131
By Sector (continued)
Recent ∆ to 52-Wk Market Enterprise Price Low High Value Value Sector Industry Company / Ticker Notable Shareholders ($) ($mn) ($mn) Health Care Major Drugs Johnson & Johnson / JNJ Buffett, Watsa 61.43 -25% 2% 169,492 166,755 Health Care Major Drugs Pfizer / PFE Berkowitz, Einhorn, Loeb 17.59 -34% 5% 141,943 128,099 Health Care Medical Equipment Becton, Dickinson / BDX Buffett 72.72 -20% 6% 17,408 17,546 Health Care Medical Equipment DENTSPLY / XRAY Gayner 33.89 -36% 9% 5,033 5,095 Health Care Medical Equipment Syneron Medical / ELOS Klarman 10.75 -58% 16% 295 109 Services Advertising Omnicom / OMC Pzena 36.57 -45% 7% 11,382 13,182 Services Broadcasting & Cable TV DIRECTV / DTV Hawkins, Weitz 29.82 -40% 1% 28,534 32,404 Services Broadcasting & Cable TV News Corp. / NWSA Klarman 12.61 -61% 4% 33,038 40,459 Services Broadcasting & Cable TV Walt Disney / DIS Gayner, Hawkins 30.44 -50% 0% 55,349 64,633 Services Business Services Automatic Data / ADP Ackman, Bares 43.51 -27% 1% 21,957 20,379 Services Business Services Fair Isaac / FICO Hawkins 18.63 -48% 31% 910 1,164 Services Business Services Paychex / PAYX Gayner 31.02 -35% 2% 11,210 10,881 Services Business Services Viad / VVI Pzena 18.01 -32% 54% 371 275 Services Casinos & Gaming Multimedia Games / MGAM Klarman 5.38 -71% 18% 146 220 Services Communications Services Level 3 Comms / LVLT Watsa 1.21 -53% 46% 1,984 7,712 Services Communications Services tw telecom / TWTC Hawkins 14.77 -66% 3% 2,207 3,081 Services Motion Pictures DreamWorks Animation / DWA Ashton (sold out) 33.99 -49% 12% 2,949 2,672 Services Real Estate Operations Brookfield Asset / BAM Gayner, Whitman 21.14 -47% 15% 12,092 42,767 Services Real Estate Operations Brookfield Prop. / BPO Pabrai 11.02 -63% 10% 5,517 18,496 Services Real Estate Operations Forest City / FCE.A Whitman 10.53 -69% 35% 1,647 9,960 Services Real Estate Operations MI Developments / MIM Einhorn 14.05 -77% 5% 656 774 Services Real Estate Operations St. Joe / JOE Berkowitz 26.61 -45% 29% 2,458 2,345 Services Real Estate Operations Thomas Properties / TPGI Whitman 2.57 -58% 85% 66 381 Services Rental & Leasing Hertz / HTZ Berkowitz 9.79 -84% 22% 4,011 13,433 Services Rental & Leasing RSC Holdings / RRR Berkowitz 6.39 -37% 46% 661 2,890 Services Restaurants DineEquity / DIN Hawkins 23.55 -78% 47% 414 2,737 Services Restaurants McDonald's / MCD Ackman, Mandel 63.58 -21% 1% 68,615 77,496 Services Restaurants Wendy's Arby's / WEN Shubin Stein 4.16 -32% 39% 1,926 2,807 Services Restaurants Yum! Brands / YUM Hawkins 35.29 -39% 5% 16,505 19,374 Services Retail (Apparel) dELiA*s / DLIA Shubin Stein 1.98 -30% 45% 62 27 Services Retail (Dep't & Discount) Dillard's / DDS Hawkins 13.19 -81% 19% 974 1,926 Services Retail (Dep't & Discount) J.C. Penney / JCP Pzena 31.21 -56% 19% 7,361 8,441 Services Retail (Dep't & Discount) Sears Holdings / SHLD Berkowitz, Lampert 74.54 -64% 6% 8,856 10,906 Services Retail (Dep't & Discount) Wal-Mart / WMT Buffett, Gayner 53.20 -13% 11% 205,183 246,533 Services Retail (Online) Overstock.com / OSTK Watsa 15.66 -60% 15% 358 340 Services Retail (Specialty) CarMax / KMX Gayner 20.96 -73% 10% 4,650 4,907 Services Retail (Specialty) TravelCenters / TA Cumming 4.60 -79% 90% 77 -3 Services Waste Management Services Heritage-Crystal / HCCI Gayner 9.88 -34% 42% 106 105 Technology Communications Equipment Alcatel-Lucent / ALU Pzena 3.80 -71% 30% 8,587 8,654 Technology Communications Equipment ViaSat / VSAT Klarman 29.65 -46% 7% 945 948 Technology Computer Hardware Dell / DELL Greenberg, Hawkins, Watsa 15.40 -49% 12% 30,117 21,562 Technology Electronic Instruments Tyco Electronics / TEL Pzena 24.12 -69% 1% 11,066 11,962 Technology Semiconductors Zoran / ZRAN Pzena 9.84 -48% 25% 509 111 Technology Software & Programming CA / CA Pzena 22.10 -38% 9% 11,530 10,439 Technology Software & Programming Microsoft / MSFT Weitz 29.63 -50% 1% 263,088 232,356 Technology Technical Instruments MTS Systems / MTSC Pzena 26.93 -27% 19% 449 372 Transportation Air Courier United Parcel Svc / UPS Gayner 56.69 -33% 5% 56,282 63,799 Utilities Electric Utilities Allegheny Energy / AYE Shubin Stein 22.40 -9% 61% 3,798 8,008 Utilities Electric Utilities ITC Holdings / ITC Gayner 45.88 -30% 6% 2,329 4,679 Utilities Natural Gas Utilities Crosstex Energy / XTXI Greenberg, Shubin Stein 5.33 -86% 31% 248 1,636
© 2009 by BeyondProxy LLC. All rights reserved. www.manualofideas.com November 20, 2009 – Page 63 of 131
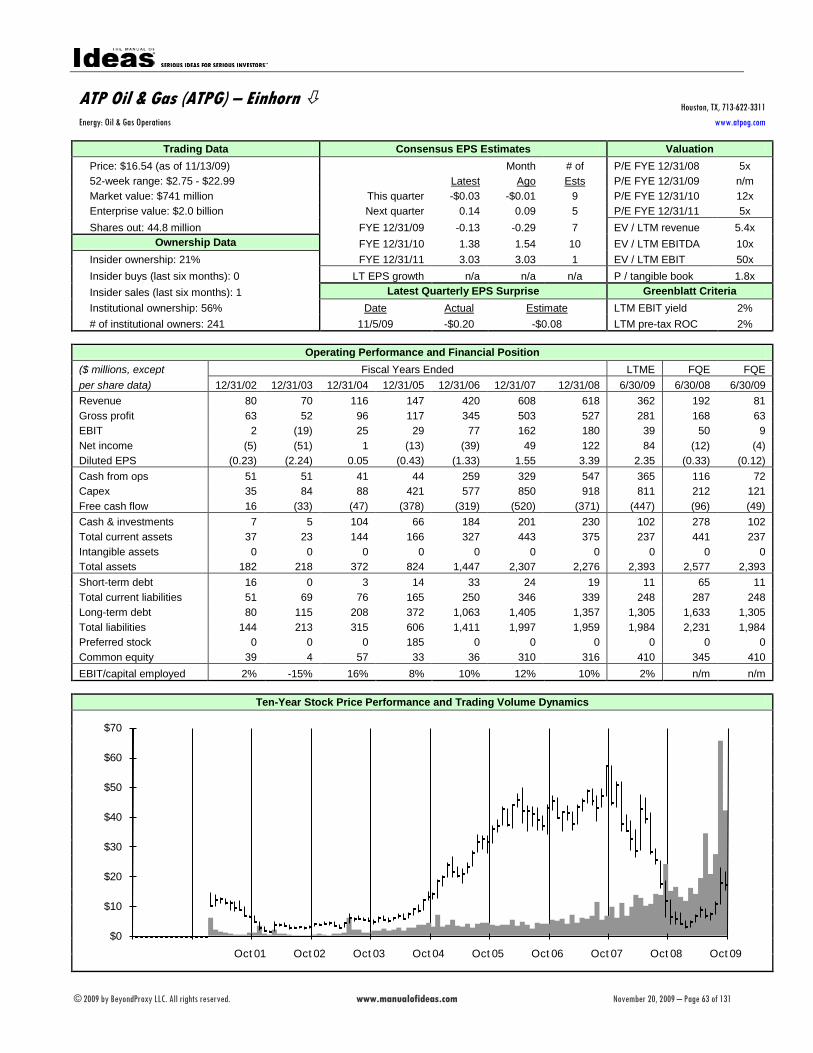
ATP Oil & Gas (ATPG) – Einhorn Houston, TX, 713-622-3311
Energy: Oil & Gas Operations www.atpog.com
Trading Data Consensus EPS Estimates Valuation
Price: $16.54 (as of 11/13/09)
Month # of P/E FYE 12/31/08 5x 52-week range: $2.75 - $22.99 Latest Ago Ests P/E FYE 12/31/09 n/m Market value: $741 million This quarter -$0.03 -$0.01 9 P/E FYE 12/31/10 12x Enterprise value: $2.0 billion Next quarter 0.14 0.09 5 P/E FYE 12/31/11 5x Shares out: 44.8 million FYE 12/31/09 -0.13 -0.29 7 EV / LTM revenue 5.4x
Ownership Data FYE 12/31/10 1.38 1.54 10 EV / LTM EBITDA 10x Insider ownership: 21% FYE 12/31/11 3.03 3.03 1 EV / LTM EBIT 50x Insider buys (last six months): 0 LT EPS growth n/a n/a n/a P / tangible book 1.8x Insider sales (last six months): 1 Latest Quarterly EPS Surprise Greenblatt Criteria Institutional ownership: 56% Date Actual Estimate LTM EBIT yield 2% # of institutional owners: 241 11/5/09 -$0.20 -$0.08 LTM pre-tax ROC 2%
Operating Performance and Financial Position
($ millions, except Fiscal Years Ended LTME FQE FQE per share data) 12/31/02 12/31/03 12/31/04 12/31/05 12/31/06 12/31/07 12/31/08 6/30/09 6/30/08 6/30/09 Revenue 80 70 116 147 420 608 618 362 192 81 Gross profit 63 52 96 117 345 503 527 281 168 63 EBIT 2 (19) 25 29 77 162 180 39 50 9 Net income (5) (51) 1 (13) (39) 49 122 84 (12) (4) Diluted EPS (0.23) (2.24) 0.05 (0.43) (1.33) 1.55 3.39 2.35 (0.33) (0.12) Cash from ops 51 51 41 44 259 329 547 365 116 72 Capex 35 84 88 421 577 850 918 811 212 121 Free cash flow 16 (33) (47) (378) (319) (520) (371) (447) (96) (49) Cash & investments 7 5 104 66 184 201 230 102 278 102 Total current assets 37 23 144 166 327 443 375 237 441 237 Intangible assets 0 0 0 0 0 0 0 0 0 0 Total assets 182 218 372 824 1,447 2,307 2,276 2,393 2,577 2,393 Short-term debt 16 0 3 14 33 24 19 11 65 11 Total current liabilities 51 69 76 165 250 346 339 248 287 248 Long-term debt 80 115 208 372 1,063 1,405 1,357 1,305 1,633 1,305 Total liabilities 144 213 315 606 1,411 1,997 1,959 1,984 2,231 1,984 Preferred stock 0 0 0 185 0 0 0 0 0 0 Common equity 39 4 57 33 36 310 316 410 345 410 EBIT/capital employed 2% -15% 16% 8% 10% 12% 10% 2% n/m n/m
Ten-Year Stock Price Performance and Trading Volume Dynamics
$0
$10
$20
$30
$40
$50
$60
$70
Oct 09Oct 08Oct 07Oct 06Oct 05Oct 04Oct 03Oct 02Oct 01
© 2009 by BeyondProxy LLC. All rights reserved. www.manualofideas.com November 20, 2009 – Page 64 of 131
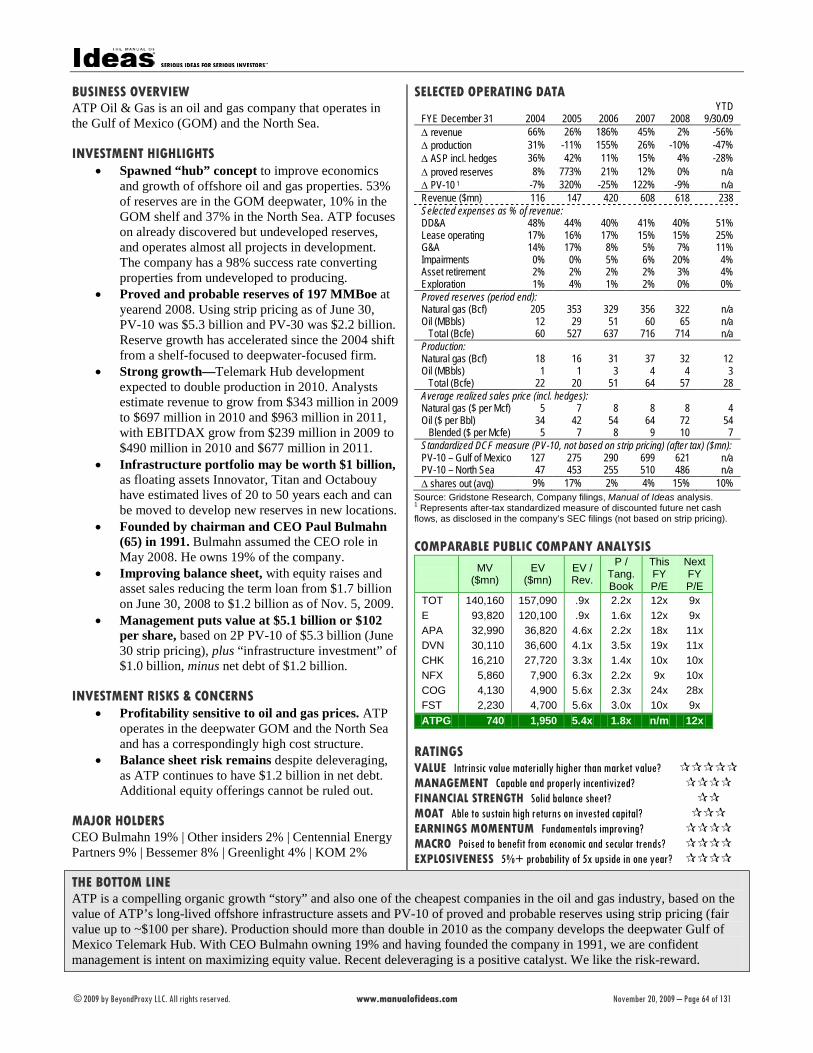
BUSINESS OVERVIEW ATP Oil & Gas is an oil and gas company that operates in the Gulf of Mexico (GOM) and the North Sea. INVESTMENT HIGHLIGHTS
• Spawned “hub” concept to improve economics and growth of offshore oil and gas properties. 53% of reserves are in the GOM deepwater, 10% in the GOM shelf and 37% in the North Sea. ATP focuses on already discovered but undeveloped reserves, and operates almost all projects in development. The company has a 98% success rate converting properties from undeveloped to producing.
• Proved and probable reserves of 197 MMBoe at yearend 2008. Using strip pricing as of June 30, PV-10 was $5.3 billion and PV-30 was $2.2 billion. Reserve growth has accelerated since the 2004 shift from a shelf-focused to deepwater-focused firm.
• Strong growth—Telemark Hub development expected to double production in 2010. Analysts estimate revenue to grow from $343 million in 2009 to $697 million in 2010 and $963 million in 2011, with EBITDAX grow from $239 million in 2009 to $490 million in 2010 and $677 million in 2011.
• Infrastructure portfolio may be worth $1 billion, as floating assets Innovator, Titan and Octabouy have estimated lives of 20 to 50 years each and can be moved to develop new reserves in new locations.
• Founded by chairman and CEO Paul Bulmahn (65) in 1991. Bulmahn assumed the CEO role in May 2008. He owns 19% of the company.
• Improving balance sheet, with equity raises and asset sales reducing the term loan from $1.7 billion on June 30, 2008 to $1.2 billion as of Nov. 5, 2009.
• Management puts value at $5.1 billion or $102 per share, based on 2P PV-10 of $5.3 billion (June 30 strip pricing), plus “infrastructure investment” of $1.0 billion, minus net debt of $1.2 billion.
INVESTMENT RISKS & CONCERNS
• Profitability sensitive to oil and gas prices. ATP operates in the deepwater GOM and the North Sea and has a correspondingly high cost structure.
• Balance sheet risk remains despite deleveraging, as ATP continues to have $1.2 billion in net debt. Additional equity offerings cannot be ruled out.
MAJOR HOLDERS CEO Bulmahn 19% | Other insiders 2% | Centennial Energy Partners 9% | Bessemer 8% | Greenlight 4% | KOM 2%
SELECTED OPERATING DATA
FYE December 31 2004 2005 2006 2007 2008 YTD
9/30/09 ∆ revenue 66% 26% 186% 45% 2% -56% ∆ production 31% -11% 155% 26% -10% -47% ∆ ASP incl. hedges 36% 42% 11% 15% 4% -28% ∆ proved reserves 8% 773% 21% 12% 0% n/a ∆ PV-10 1 -7% 320% -25% 122% -9% n/a Revenue ($mn) 116 147 420 608 618 238 Selected expenses as % of revenue: DD&A 48% 44% 40% 41% 40% 51% Lease operating 17% 16% 17% 15% 15% 25% G&A 14% 17% 8% 5% 7% 11% Impairments 0% 0% 5% 6% 20% 4% Asset retirement 2% 2% 2% 2% 3% 4% Exploration 1% 4% 1% 2% 0% 0% Proved reserves (period end): Natural gas (Bcf) 205 353 329 356 322 n/a Oil (MBbls) 12 29 51 60 65 n/a Total (Bcfe) 60 527 637 716 714 n/a Production: Natural gas (Bcf) 18 16 31 37 32 12 Oil (MBbls) 1 1 3 4 4 3 Total (Bcfe) 22 20 51 64 57 28 Average realized sales price (incl. hedges): Natural gas ($ per Mcf) 5 7 8 8 8 4 Oil ($ per Bbl) 34 42 54 64 72 54 Blended ($ per Mcfe) 5 7 8 9 10 7 Standardized DCF measure (PV-10, not based on strip pricing) (after tax) ($mn): PV-10 – Gulf of Mexico 127 275 290 699 621 n/a PV-10 – North Sea 47 453 255 510 486 n/a ∆ shares out (avg) 9% 17% 2% 4% 15% 10%
Source: Gridstone Research, Company filings, Manual of Ideas analysis. 1 Represents after-tax standardized measure of discounted future net cash flows, as disclosed in the company’s SEC filings (not based on strip pricing). COMPARABLE PUBLIC COMPANY ANALYSIS
MV ($mn)
EV ($mn)
EV / Rev.
P / Tang. Book
This FY P/E
Next FY P/E
TOT 140,160 157,090 .9x 2.2x 12x 9x E 93,820 120,100 .9x 1.6x 12x 9x APA 32,990 36,820 4.6x 2.2x 18x 11x DVN 30,110 36,600 4.1x 3.5x 19x 11x CHK 16,210 27,720 3.3x 1.4x 10x 10x NFX 5,860 7,900 6.3x 2.2x 9x 10x COG 4,130 4,900 5.6x 2.3x 24x 28x FST 2,230 4,700 5.6x 3.0x 10x 9x ATPG 740 1,950 5.4x 1.8x n/m 12x
RATINGS VALUE Intrinsic value materially higher than market value? MANAGEMENT Capable and properly incentivized? FINANCIAL STRENGTH Solid balance sheet? MOAT Able to sustain high returns on invested capital? EARNINGS MOMENTUM Fundamentals improving? MACRO Poised to benefit from economic and secular trends? EXPLOSIVENESS 5%+ probability of 5x upside in one year?
THE BOTTOM LINE ATP is a compelling organic growth “story” and also one of the cheapest companies in the oil and gas industry, based on the value of ATP’s long-lived offshore infrastructure assets and PV-10 of proved and probable reserves using strip pricing (fair value up to ~$100 per share). Production should more than double in 2010 as the company develops the deepwater Gulf of Mexico Telemark Hub. With CEO Bulmahn owning 19% and having founded the company in 1991, we are confident management is intent on maximizing equity value. Recent deleveraging is a positive catalyst. We like the risk-reward.
© 2009 by BeyondProxy LLC. All rights reserved. www.manualofideas.com November 20, 2009 – Page 65 of 131
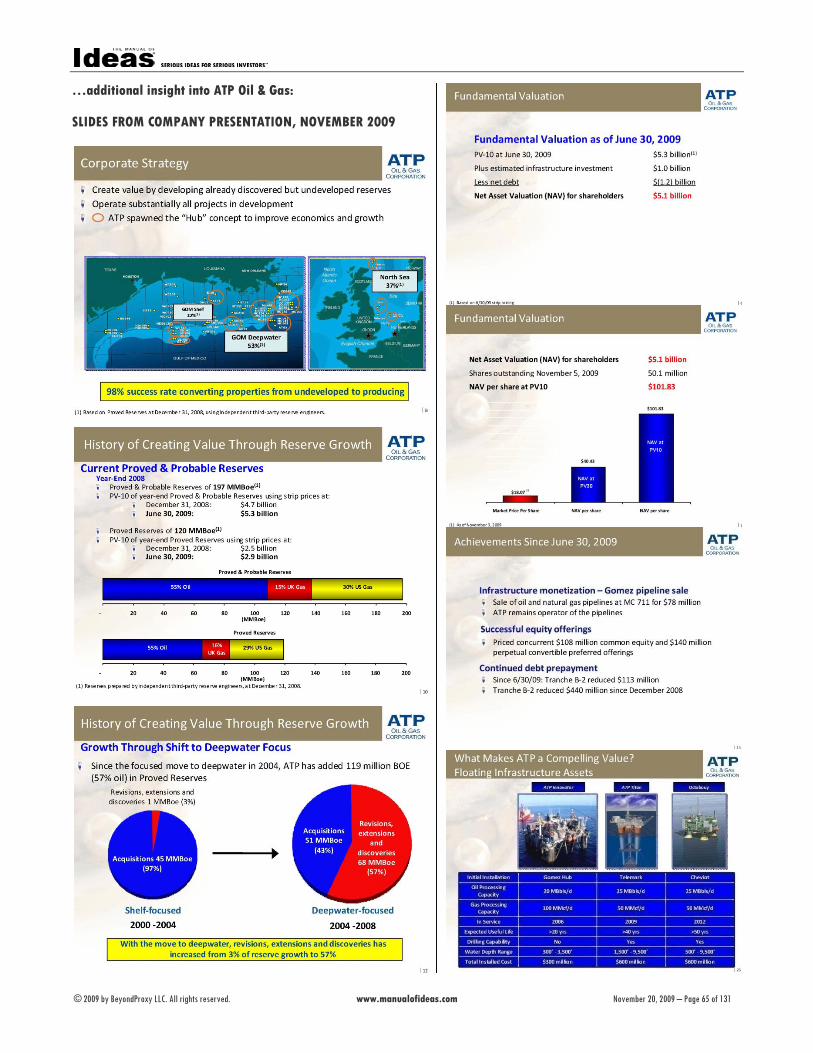
…additional insight into ATP Oil & Gas: SLIDES FROM COMPANY PRESENTATION, NOVEMBER 2009
© 2009 by BeyondProxy LLC. All rights reserved. www.manualofideas.com November 20, 2009 – Page 129 of 131
About PORTFOLIO MANAGER’S REVIEW © 2009 by BeyondProxy LLC. All rights reserved. All content is protected by U.S. and international copyright laws and is the property of BeyondProxy and any third-party providers of such content. The U.S. Copyright Act imposes liability of up to $150,000 for each act of willful infringement of a copyright. PORTFOLIO MANAGER’S REVIEW is published monthly by BeyondProxy. Subscribers may download content to their computer and store and print materials for their individual use only. Any other reproduction, transmission, display or editing of the content by any means, mechanical or electronic, without the prior written permission of BeyondProxy is strictly prohibited. Terms of use: Use of this newsletter and its content is governed by the Terms of Use described in detail at www.manualofideas.com. See a summary of key terms below. Contact information: For all customer service, subscription or other inquiries, please visit www.manualofideas.com, or contact us at BeyondProxy, 235 East 95th Street, Suite 14J, New York, NY 10128; telephone: 415-412-8059. Editor-in-chief: John Mihaljevic, CFA. Annual subscription price: $999. To subscribe, visit www.manualofideas.com/pmr.html General Publication Information and Terms of Use PORTFOLIO MANAGER’S REVIEW is published by BeyondProxy. Use of this newsletter and its content is governed by the Terms of Use described in detail at www.manualofideas.com/terms.html. For your convenience, a summary of certain key policies, disclosures and disclaimers is reproduced below. This summary is meant in no way to limit or otherwise circumscribe the full scope and effect of the complete Terms of Use. No Investment Advice This newsletter is not an offer to sell or the solicitation of an offer to buy any security in any jurisdiction where such an offer or solicitation would be illegal. This newsletter is distributed for informational purposes only and should not be construed as investment advice or a recommendation to sell or buy any security or other investment, or
undertake any investment strategy. It does not constitute a general or personal recommendation or take into account the particular investment objectives, financial situations, or needs of individual investors. The price and value of securities referred to in this newsletter will fluctuate. Past performance is not a guide to future performance, future returns are not guaranteed, and a loss of all of the original capital invested in a security discussed in this newsletter may occur. Certain transactions, including those involving futures, options, and other derivatives, give rise to substantial risk and are not suitable for all investors. Disclaimers There are no warranties, expressed or implied, as to the accuracy, completeness, or results obtained from any information set forth in this newsletter. BeyondProxy will not be liable to you or anyone else for any loss or injury resulting directly or indirectly from the use of the information contained in this newsletter, caused in whole or in part by its negligence in compiling, interpreting, reporting or delivering the content in this newsletter. Related Persons BeyondProxy’s officers, directors, employees and/or principals (collectively “Related Persons”) may have positions in and may, from time to time, make purchases or sales of the securities or other investments discussed or evaluated in this newsletter. John Mihaljevic, Chairman of BeyondProxy, is also a principal of Mihaljevic Capital Management LLC (“MCM”), which serves as the general partner of a private investment partnership. MCM may purchase or sell securities and financial instruments discussed in this newsletter on behalf of the investment partnership or other accounts it manages. It is the policy of MCM and all Related Persons to allow a full trading day to elapse after the publication of this newsletter before purchases or sales of any securities or financial instruments discussed herein are made. Compensation BeyondProxy receives compensation in connection with the publication of this newsletter only in the form of subscription fees charged to subscribers and reproduction or re-dissemination fees charged to subscribers or others interested in the newsletter content.
The Manual of Ideas research team is gratified to have won high praise for our investment idea generation process and analytical work.
“I highly recommend MOI — the thoroughness of the product coupled with the quality
of the content makes it an invaluable tool for the serious investor.” —TIM DAVIS, MANAGING DIRECTOR, BLUESTEM ASSET MANAGEMENT
“We do similar work ourselves.”
—GLENN GREENBERG, MANAGING DIRECTOR, CHIEFTAIN CAPITAL MANAGEMENT
“The Manual of Ideas is a tremendous effort and very well put together.” —MOHNISH PABRAI, MANAGING PARTNER, PABRAI INVESTMENT FUNDS
“Outstanding.”
—JONATHAN HELLER, CFA, EDITOR, CHEAP STOCKS
“Your reports provide serious investors with a plethora of bargain stocks and sound advice. I highly recommend them.”
—MIGUEL BARBOSA, EDITOR, SIMOLEON SENSE
“Very impressive.” —SHAI DARDASHTI, MANAGING PARTNER, DARDASHTI CAPITAL MANAGEMENT
“It’s little surprise MOI is a winner. When you start with superior stock screening and
combine it with good judgment, you put yourself in a great position to outperform.” —MARKO VUCEMILOVIC, FOUNDER AND MANAGING DIRECTOR, ALKAR GLOBAL
“This is the best institutional-quality equity research to come along in a long time. It not only unearths companies with compelling risk-reward profiles but also analyzes them with a clear understanding of business economics and competitive dynamics.”
—PAVEL SAVOR, ASSISTANT PROFESSOR OF FINANCE, THE WHARTON SCHOOL
“I am (as always) impressed with your work.” —MARK SPROULE, SCOPIA CAPITAL
“Keep up the great work, you are quickly becoming one of my must-read sources.”
—CORY JANSSEN, FOUNDER, INVESTOPEDIA.COM
FIND OUT WHAT THE BUZZ IS ABOUT.
WWW.MANUALOFIDEAS.COM

Pay-By-Check Subscription Form
Publisher: BeyondProxy LLC
For faster enrollment, subscribe online at www.manualofideas.com
To Do: Please print this form and fill in the following information legibly and completely.
Mail the completed form and payment to: BeyondProxy LLC P.O. Box 1375 New York, NY 10150 Your Information: Name: _____________________________________________________________________________ Firm: _______________________________________________________________________________ Mailing Address: _____________________________________________________________________ City: ____________________________________________ State (if applicable): ________________ ZIP / Postal Code: __________________ Country: ________________________________________ Email: ______________________________________________________________________________ Your Subscriptions:
PORTFOLIO MANAGER’S REVIEW: one year, $999 (12 issues) two years, $1,898 (24 issues)
EUROPEAN VALUE REPORT: one year, $299 (12 issues) two years, $578 (24 issues)
DOWNSIDE PROTECTION REPORT: one year, $149 (12 issues) two years, $288 (24 issues)
10X45 BARGAIN HUNTER: one year, $99 (26 issues) two years, $188 (52 issues)
EQUITIES AND TOBIN’S Q: one year, $399 (4 issues) two years, $698 (8 issues) Payment Information: Check enclosed (make payable to “BeyondProxy LLC”) Confirmation: We will confirm by email the receipt of your request and welcome you to The Manual of Ideas. Thanks!
Questions about your order? Email us at [email protected] or call 415-412-8059.