a multi-platform analysis of the north american reactive
TRANSCRIPT

Overview:
1) National Emissions Inventory 1999 (EPA NEI99) A new anthropogenic emissions inventory over the U.S.
2) Export of reactive nitrogen during the ICARTT summer intensive.
GEOS-CHEM MeetingApril 4, 2005
A multi-platform analysis of the North American reactive nitrogen budget during the ICARTT summer intensive
R. C. Hudman, D. J. Jacob, S. Turquety, ITCT-2K4 science team, INTEX-NA science team

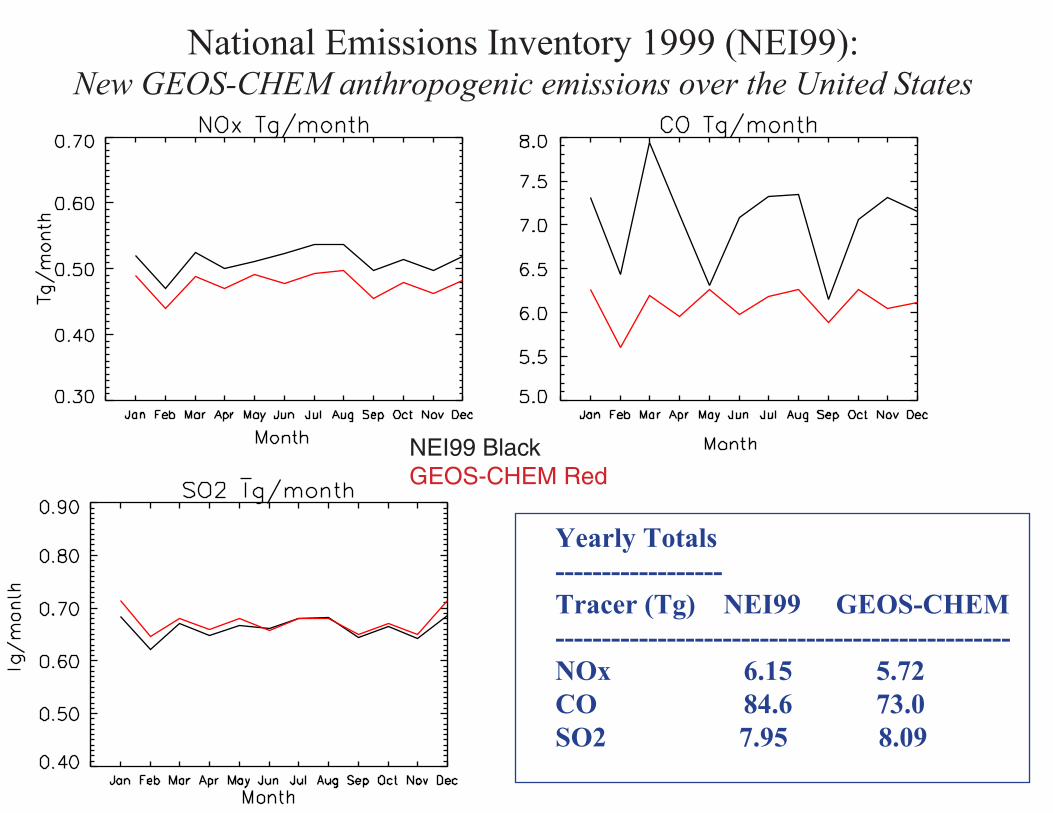
National Emissions Inventory 1999 (NEI99):New GEOS-CHEM anthropogenic emissions over the United States
Currently in GEOS-CHEM:
Emitted anthropogenic species include: CO, NOx, SO2, NH3, C2H6, C3H8, Acetone, ALK4 (C4+ Alkanes), PRPE (C3+ Alkenes), MEK (C4+ ketones)
GEOS CHEM now uses a 1985 inventory which is scaled by trend data.
Source Types*: biogenic, biomass burning, cow, fertilizer, fowl, hogs, household solvents, industrial solvents, other anthropogenic, plane, biofuel, residential fossil fuel, transportation
* red = anthropogenic no biofuels blue = biofuel
EPA releases new emission inventories for the US every three years - .25X.25 gridded product for 1999- Monthly, weekday/weekend (keep diurnal cycle as is in current inventory)- New geographical distributions!
National Emissions Inventory 1999 (NEI99):New GEOS-CHEM anthropogenic emissions over the United States
NEI99 BlackGEOS-CHEM Red
Yearly Totals------------------Tracer (Tg) NEI99 GEOS-CHEM-------------------------------------------------NOx 6.15 5.72CO 84.6 73.0SO2 7.95 8.09

National Emissions Inventory 1999 (NEI99):New GEOS-CHEM anthropogenic emissions over the United States
Propane, Ethane, Acetone are scaled up to GEOS-CHEM values.Ketones, and Alkenes reduced...but small anyway.
JAN JUN DEC JAN JUN DEC JAN JUN DEC

National Emissions Inventory 1999 (NEI99):CO Comparison
NEI99 CO Emissions for January 1998 CO Emissions for January
1998 - NEI99
66 00
3-3
- Decrease over Western US- Increase over East Coast- Similar trend in NOx!- Important implications for ICARTT
January
25N
30N
35N
40N
45N
50N
55N
The
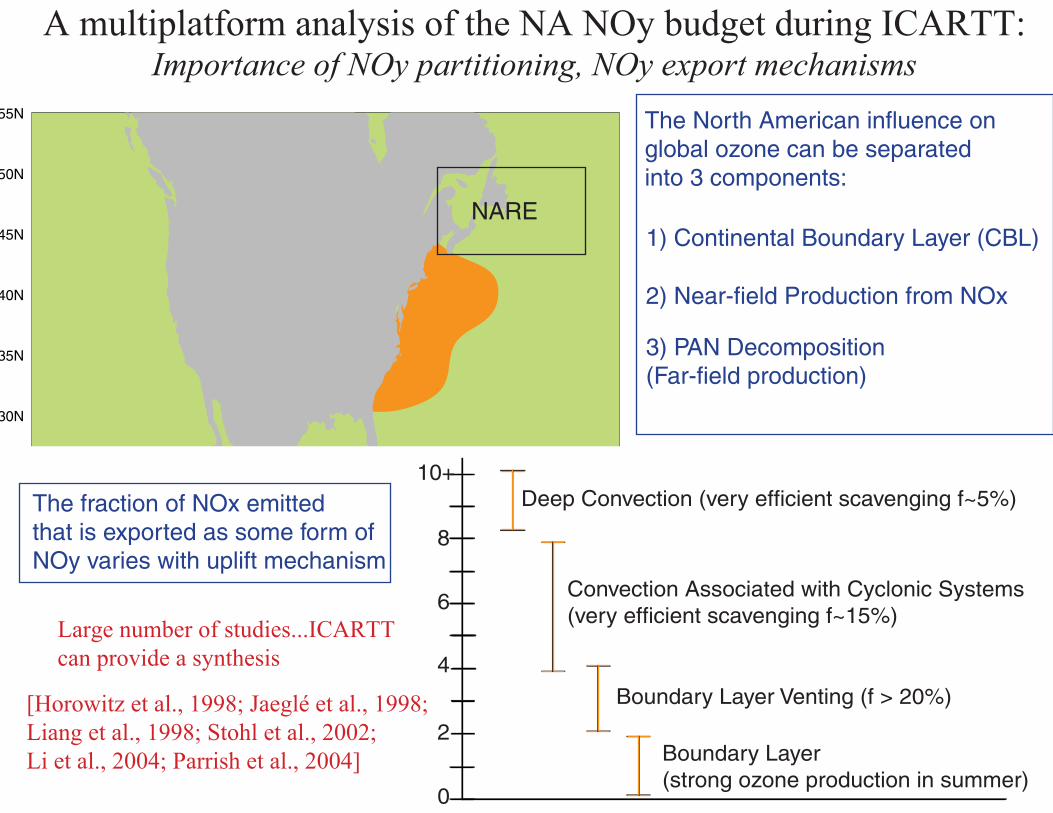
2) Near-field Production from NOx
1) Continental Boundary Layer (CBL)
3) PAN Decomposition(Far-field production)
0
2
4
6
8
10+Deep Convection (very efficient scavenging f~5%)
Convection Associated with Cyclonic Systems (very efficient scavenging f~15%)
Boundary Layer Venting (f > 20%)
Boundary Layer (strong ozone production in summer)
NARE
The North American influence on global ozone can be separated into 3 components:
The fraction of NOx emitted that is exported as some form of NOy varies with uplift mechanism
A multiplatform analysis of the NA NOy budget during ICARTT:Importance of NOy partitioning, NOy export mechanisms
[Horowitz et al., 1998; Jaeglé et al., 1998; Liang et al., 1998; Stohl et al., 2002; Li et al., 2004; Parrish et al., 2004]
Large number of studies...ICARTT can provide a synthesis

%
ICARTT 0-2 km NOy partitioning: Rapid oxidation of NOx downwind of continent
Hudman, R. C., Jacob, D. J., Turquety, S., and INTEX-NA science team,ITCT2k4 science team

12
10
8
6
4
2
050 100 150 2000100 200 300 500 10001500100 200 300400 400
NOAA ITCT2k4100 200 300 400 50 100 150 2000 100 200 300 400 500 1000 1500
12
10
8
6
4
2
0
NASA INTEX-NA
500
5000
0
0
0
0
0
GEOS-CHEM vs. INTEX-NA and ITCT2k4: Comparison along the flight tracks*
PAN:Newunderestimatein the free trop.
HNO3:Previous overestimatecorrected?
Overestimate of CO and NOx in boundary layerAnthro. sourcebias?
NOx: underestimate above 10 km lightning?
* local, strat, BB filtered

NOy export efficiency, f:Regional differences in export efficiency
NARE region has the lowest f . Is this a result of uplift over water after NOy has been removed in MBL?
Is lower export efficiency from southern U.S. a result of stagnation?
Lower export efficiencies seen than Fall studies...~15%
[NOy] - [NOy]bkd[CO] - [CO]bkd
f =
R= anth. emission ratio ofCO/NOx = 6.15 (NEI - all US avg)
[CO]bkd = 75 ppbv, [NOy]bkd=300 ppt
Reg
ions
xR NARE
OffShoreSOUTH
NE and MidWest
PLUMES DEFINEDAS CObkd + 30 ppbv
Convective NOx issue
boundary layer venting
WCB
GEOS-CHEMcaptures theseexport differences

Proposed Future Work
1) A multi-platform analysis of the North American reactive nitrogen budget during the ICARTT summer intensive.
2) Impact of North American pollution on global ozone and transatlantic transport
- The complete ICARTT data set is an outstanding data set to provide a synthesis of differences in regional distribution of NOy export and partitioning
- What are the implications of this export of NOy and ozone precursors to global ozone and transatlantic transport?