a multi-residue method for the analysis of pesticides in
TRANSCRIPT
Application Note
A Multi-Residue Method for the Analysis of Pesticides in Cannabis Using UPLC-MS/MS and APGC-MS/MS to Meet Canadian Regulatory Requirements
David James, Nichole Taylor, Christopher Stadey
Bloom Labs at Perennia Laboratories, Waters Corporation
Abstract
This application note presents the use of a simple sample extraction and d-SPE (dispersive solid phase
extraction) cleanup where the resulting extract is analyzed by UPLC-MS/MS or APGC-MS/MS.
Benefits
Sensitive and reproducible workflow for screening cannabis for the Canadian list of pesticides■
Minimal sample preparation followed by rapid UPLC and GC separations■
UPLC-MS/MS and APGC-MS/MS analysis of the same sample extracts on one tandem quadrupole mass
spectrometer
■
Analysis of large suites of pesticides in a single injection per chromatographic inlet■
Analysis of cannabis at legislatively relevant levels ■
Introduction
Health Canada requires mandatory testing for the presence of pesticide residues in cannabis before the
product can be sold to consumers.1,2 The regulations are present to ensure the highest safety and quality
standards possible when it comes to the supply of cannabis for medical or recreational use. To adhere to
testing requirements, licensed cannabis producers must demonstrate that no unauthorized pesticides have
been used on their products and that there is no contamination of the products within the limits set out by
Health Canada. Currently, the target list consists of 96 pesticides, with limits of quantitation as low as 20 ppb
in dried cannabis. Tandem mass spectrometry is a sensitive and selective technique. When coupled with
both gas (GC) and liquid chromatography (LC), it provides a comprehensive analysis for a wide range of
pesticide residues with sufficient sensitivity to meet the Health Canada regulations. The advantage of
ultraperformance liquid chromatography (UPLC) coupled with tandem quadrupole mass spectrometry
(MS/MS) for multi-residue pesticide analysis is widely reported.3 More recently, the use of GC-MS/MS
operated at atmospheric pressure (APGC) has been shown to offer significant improvements in performance
over EI for challenging pesticides, in terms of selectivity, specificity and speed of analysis.4,5 Regulations for
cannabis testing will most likely evolve and possibly become even more rigorous. The use of both LC-MS/MS
and GC-MS/MS ensures system flexibility that can be adapted in the event that more pesticides are
regulated.
In this Application Note, we present the use of a simple sample extraction and d-SPE (dispersive solid phase
extraction) cleanup where the resulting extract is analyzed by UPLC-MS/MS or APGC-MS/MS. A single
workflow for the multi-residue analysis of pesticides in cannabis is demonstrated. Utilizing the universal
source of the Waters Xevo TQ-S micro allows for LC and GC analyses to be completed on the same tandem
quadrupole MS instrument. The performance of the method will be highlighted in terms of sensitivity,
recovery, and linearity for both LC and GC analysis.
Experimental
Materials and reagents
1. Pesticide standards
Pesticide analytical standards were purchased from LGC Standards. Mix 1 consisted of 35 pesticides at 50
ppm in acetonitrile, Mix 2 consisted of 45 pesticides at 100 ppm in acetonitrile, and Mix 3 consisted of 14
pesticides at 100 ppm in toluene. Dimethomorph was also purchased from LGC Standards at 10 ppm in
acetonitrile. Benzovindiflupyr was purchased separately from Chem Service at 100 ppm in methylene chloride
solution. All 96 pesticides were combined in a 1 ppm stock solution of each.
2. Reagents
LC-MS-grade methanol, LC-MS-grade acetonitrile, and RO (reverse osmosis) water were all purchased from
Fisher Scientific and were used as received. Formic acid was purchased from Waters (p/n: 186006691) and
was used as received.
3. Miscellaneous
Helium and argon gases were obtained from Air Liquide. A Thermo Fisher Scientific vortex (0-3200 rpm), a
Fisher Scientific accuSpin 400 centrifuge, a Fisher Scientific 60L gravity oven, and a Mettler Toledo AE50
analytical balance (0.1 mg) were all used in the sample preparation procedure.
Sample preparation
Preparation
The representative samples were dipped in liquid nitrogen and frozen before grinding. After freezing, but
before grinding, all stems and seeds were removed from the sample. The ground sample was equilibrated to
room temperature. Several 0.5-g portions of ground cannabis were weighed. The initial mass was recorded.
To ensure that all the liquid nitrogen had evaporated, and an accurate sample mass was obtained, the
sample sat on the scale until there was <1 mg change in mass over a 10-minute period.
Pesticide extraction
The 0.5-g samples of ground cannabis were placed in a 10-mL centrifuge tube and 5 mL of LC-MS/MS-
grade acetonitrile was added. The sample was then vortexed for five minutes followed by centrifugation at
5000 rpm for five minutes. One milliliter of the supernatant was removed and used in the clean-up step.
Clean-up
One milliliter of the supernatant from the pesticide extraction was placed in a d-SPE cartridge (150 mg MgSO
4, 50 mg PSA, 50 mg C18, and 7.5 mg graphitized carbon black). The cartridge was shaken for one minute and
centrifuged for five minutes at 5000 rpm. The resulting cannabis extracts were directly pipetted into clean 2-
mL vials in preparation for analysis by LC-MS/MS and APGC-MS/MS.
Calibration preparation
Calibration standards were made using a stock solution of 96 pesticides (1 ppm stock). Matrix-matched
calibrations were used to ensure that the signals obtained in the analysis were representative of what the
signal would be in cannabis samples. Standards ranging from 1–6400 ppb were made to accommodate the
different ionization efficiencies of all analytes. Pesticides with low detection limits used the lower
concentration standards and the pesticides with higher detection limits used higher concentration standards
for their calibration curves.
Instrumentation and software
A Waters ACQUITY UPLC H-Class PLUS System coupled with a Waters Xevo TQ-S micro Tandem
Quadrupole Mass Spectrometer (MS/MS) with electrospray as the ionization mode was used to carry out the
analysis of 84 of the pesticides by LC-MS/MS (see Appendix A). An Agilent 7890B gas chromatograph (GC)
coupled with a Waters Xevo TQ-S micro Tandem Quadrupole Mass Spectrometer was used to carry out the
analysis of the remaining 12 pesticides with APGC as the ionization mode. A nitrogen generator (Peak
Scientific) was used as the source of the N2 gas. MassLynx MS Software v4.2 was used for data acquisition
and processing for both LC-MS/MS and GC-MS/MS methods.
UPLC conditions
Separation mode: Gradient
Column: ACQUITY UPLC BEH C18, 1.7 μm, 2.1 × 100 mm
Solvent A: Methanol
Solvent B: Water
Solvent C: 2% formic acid in RO water
Flow rate: 0.500 mL/min
Column temp.: 60 °C
Sample temp.: 10 °C
Injection volume: 2 μL
Gradient table:
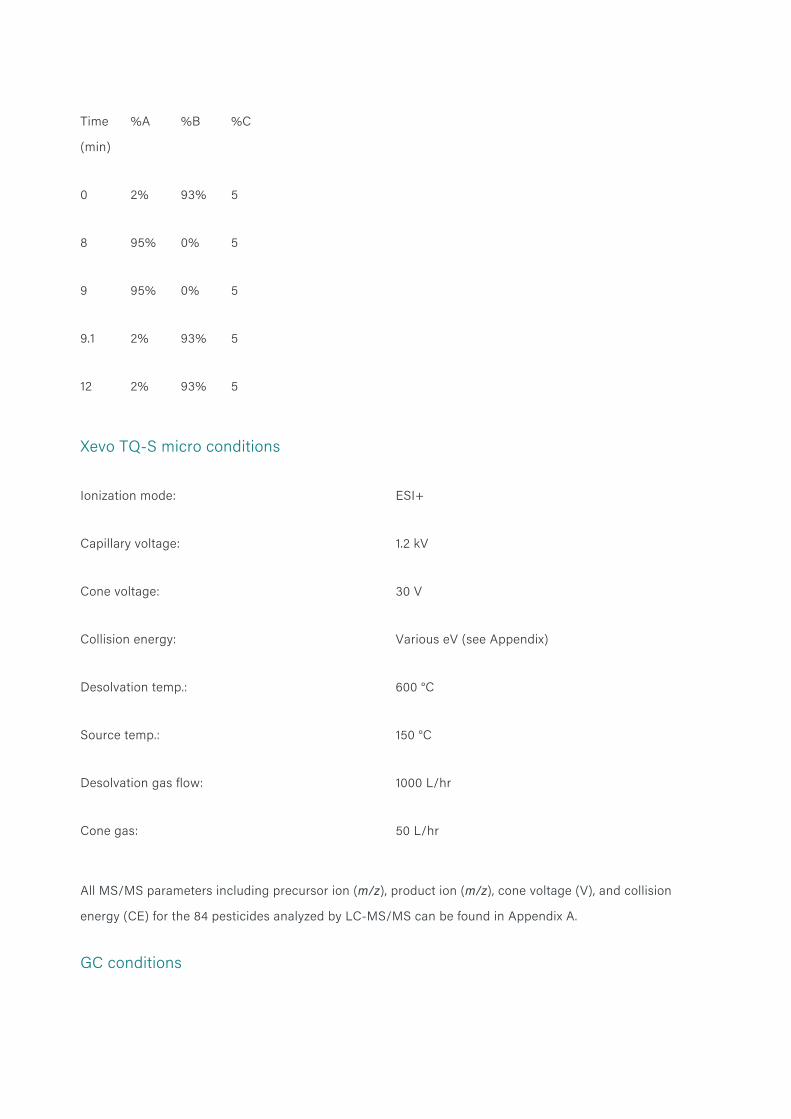
Time
(min)
%A %B %C
0 2% 93% 5
8 95% 0% 5
9 95% 0% 5
9.1 2% 93% 5
12 2% 93% 5
Xevo TQ-S micro conditions
Ionization mode: ESI+
Capillary voltage: 1.2 kV
Cone voltage: 30 V
Collision energy: Various eV (see Appendix)
Desolvation temp.: 600 °C
Source temp.: 150 °C
Desolvation gas flow: 1000 L/hr
Cone gas: 50 L/hr
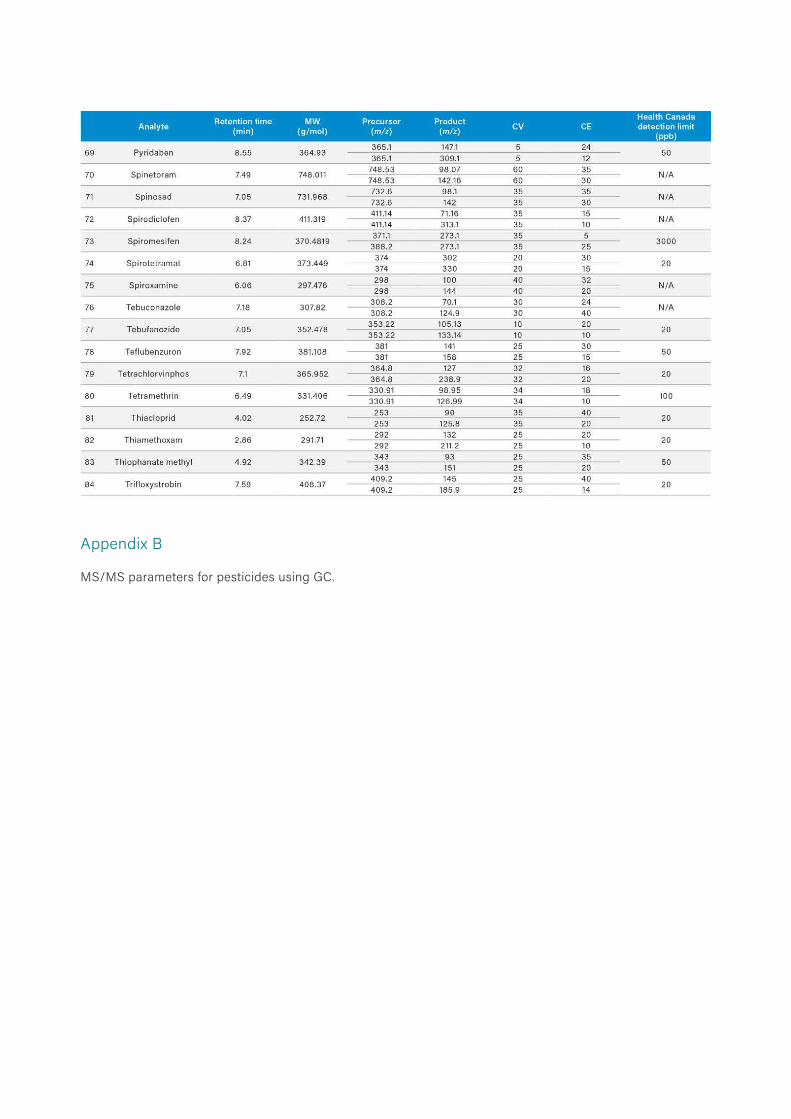
All MS/MS parameters including precursor ion (m/z), product ion (m/z), cone voltage (V), and collision
energy (CE) for the 84 pesticides analyzed by LC-MS/MS can be found in Appendix A.
GC conditions
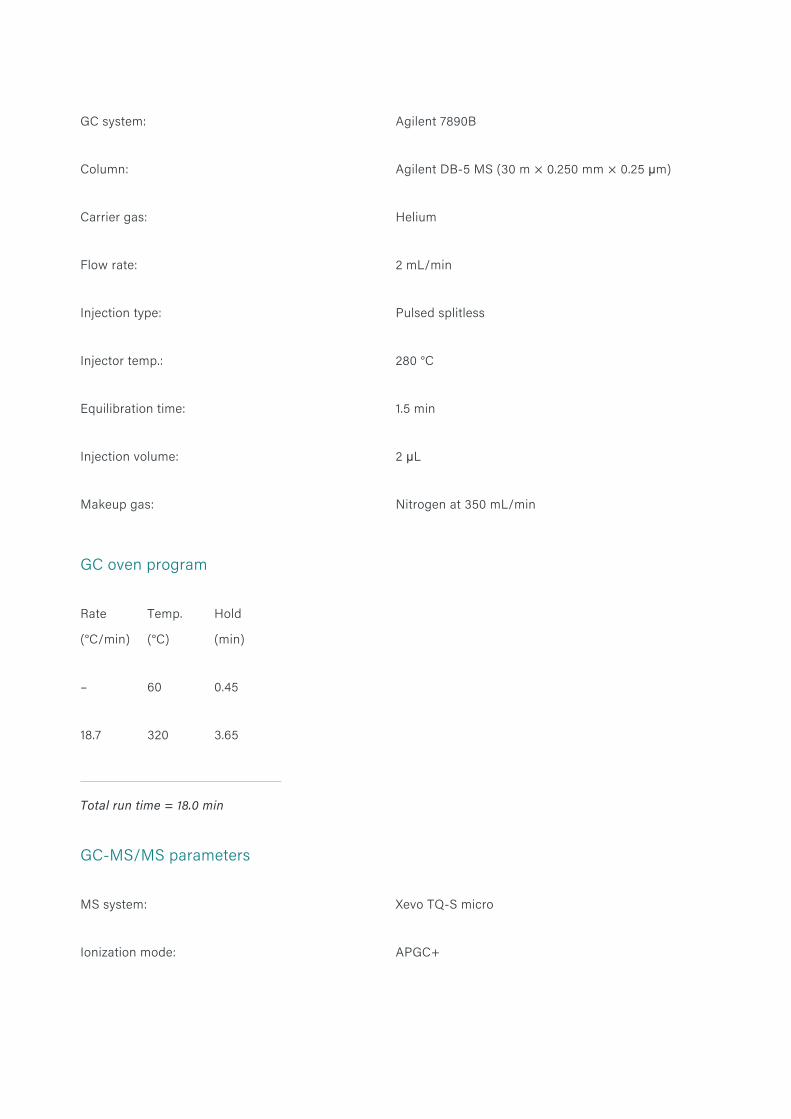
GC system: Agilent 7890B
Column: Agilent DB-5 MS (30 m × 0.250 mm × 0.25 μm)
Carrier gas: Helium
Flow rate: 2 mL/min
Injection type: Pulsed splitless
Injector temp.: 280 °C
Equilibration time: 1.5 min
Injection volume: 2 μL
Makeup gas: Nitrogen at 350 mL/min
GC oven program
Rate
(°C/min)
Temp.
(°C)
Hold
(min)
– 60 0.45
18.7 320 3.65
Total run time = 18.0 min
GC-MS/MS parameters
MS system: Xevo TQ-S micro
Ionization mode: APGC+
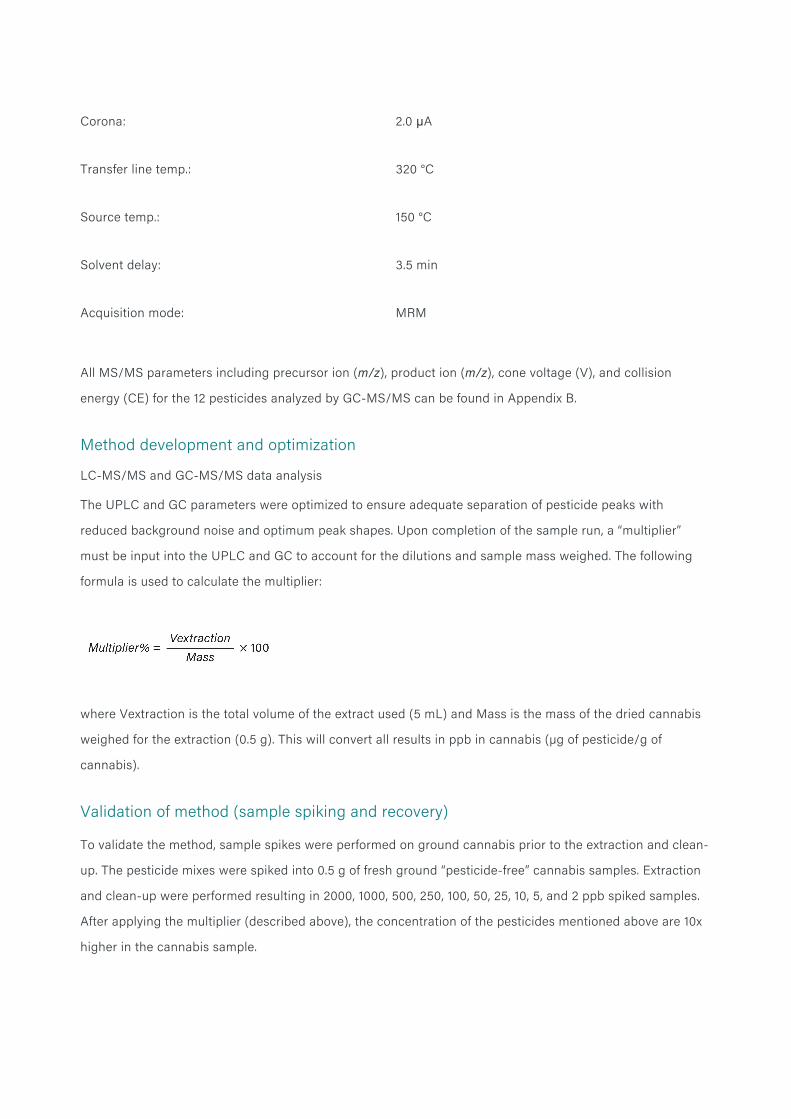
Corona: 2.0 μA
Transfer line temp.: 320 °C
Source temp.: 150 °C
Solvent delay: 3.5 min
Acquisition mode: MRM
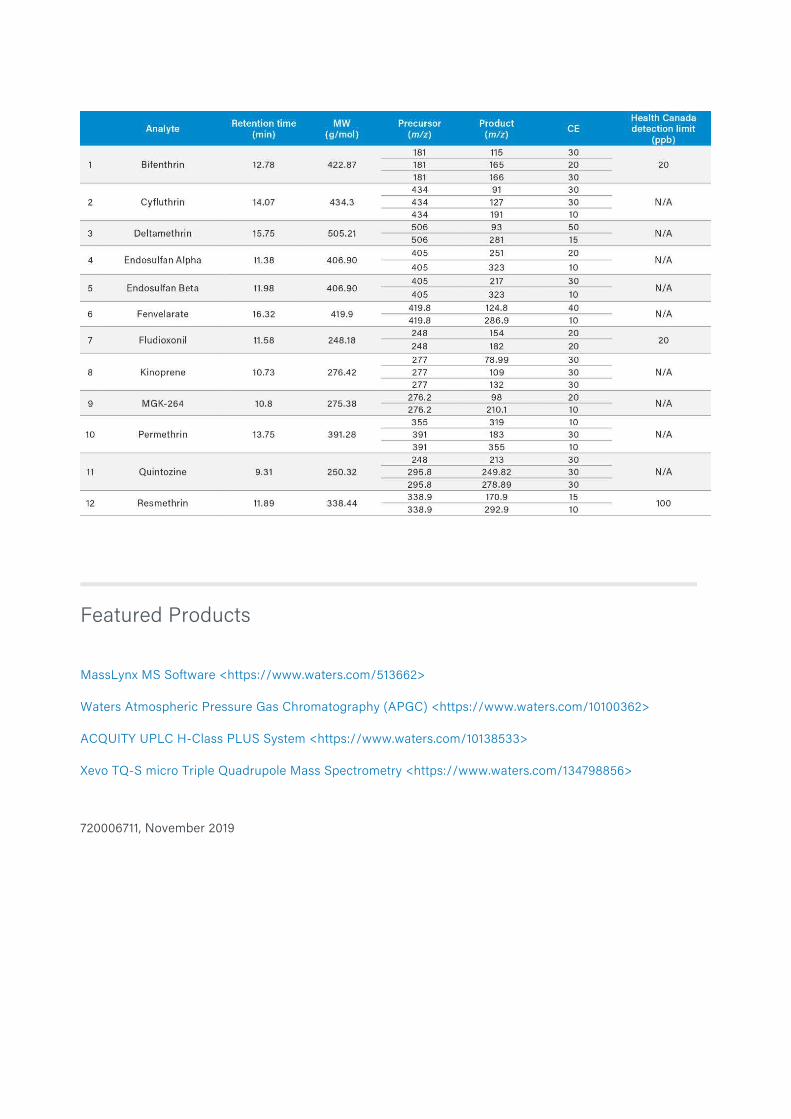
All MS/MS parameters including precursor ion (m/z), product ion (m/z), cone voltage (V), and collision
energy (CE) for the 12 pesticides analyzed by GC-MS/MS can be found in Appendix B.
Method development and optimization
LC-MS/MS and GC-MS/MS data analysis
The UPLC and GC parameters were optimized to ensure adequate separation of pesticide peaks with
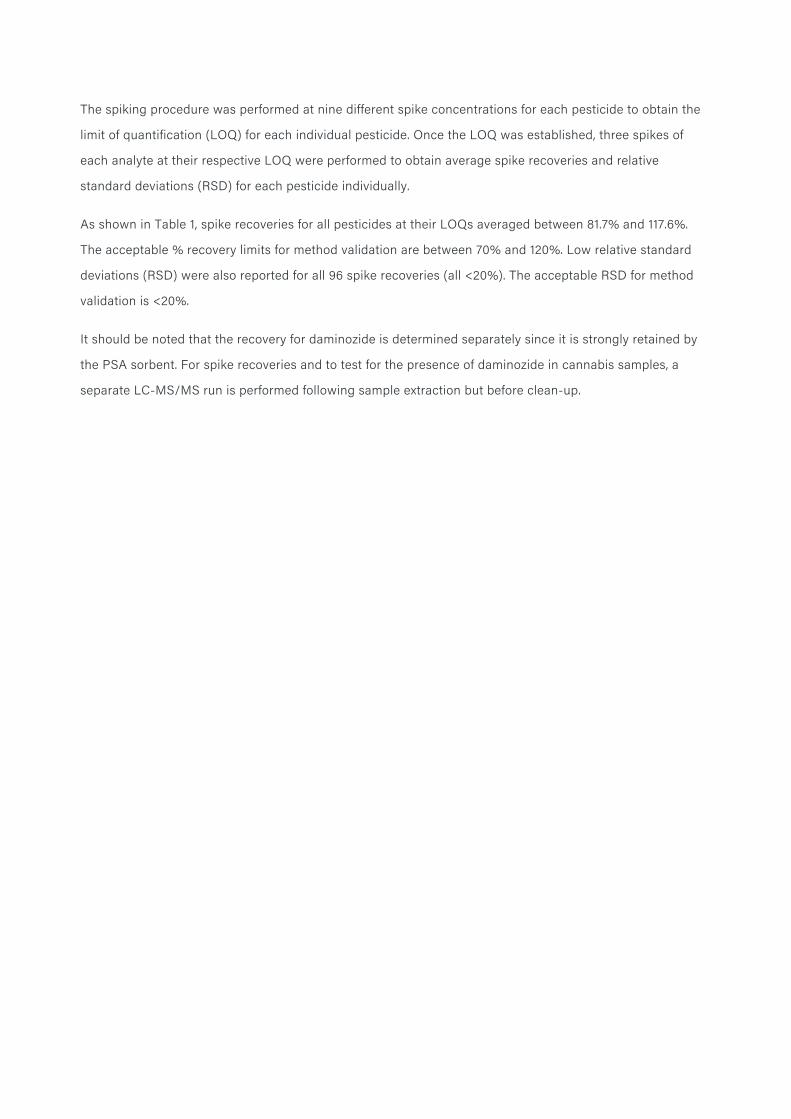
reduced background noise and optimum peak shapes. Upon completion of the sample run, a “multiplier”
must be input into the UPLC and GC to account for the dilutions and sample mass weighed. The following
formula is used to calculate the multiplier:
where Vextraction is the total volume of the extract used (5 mL) and Mass is the mass of the dried cannabis
weighed for the extraction (0.5 g). This will convert all results in ppb in cannabis (µg of pesticide/g of
cannabis).
Validation of method (sample spiking and recovery)
To validate the method, sample spikes were performed on ground cannabis prior to the extraction and clean-
up. The pesticide mixes were spiked into 0.5 g of fresh ground “pesticide-free” cannabis samples. Extraction
and clean-up were performed resulting in 2000, 1000, 500, 250, 100, 50, 25, 10, 5, and 2 ppb spiked samples.
After applying the multiplier (described above), the concentration of the pesticides mentioned above are 10x
higher in the cannabis sample.
The spiking procedure was performed at nine different spike concentrations for each pesticide to obtain the
limit of quantification (LOQ) for each individual pesticide. Once the LOQ was established, three spikes of
each analyte at their respective LOQ were performed to obtain average spike recoveries and relative
standard deviations (RSD) for each pesticide individually.
As shown in Table 1, spike recoveries for all pesticides at their LOQs averaged between 81.7% and 117.6%.
The acceptable % recovery limits for method validation are between 70% and 120%. Low relative standard
deviations (RSD) were also reported for all 96 spike recoveries (all <20%). The acceptable RSD for method
validation is <20%.
It should be noted that the recovery for daminozide is determined separately since it is strongly retained by
the PSA sorbent. For spike recoveries and to test for the presence of daminozide in cannabis samples, a
separate LC-MS/MS run is performed following sample extraction but before clean-up.
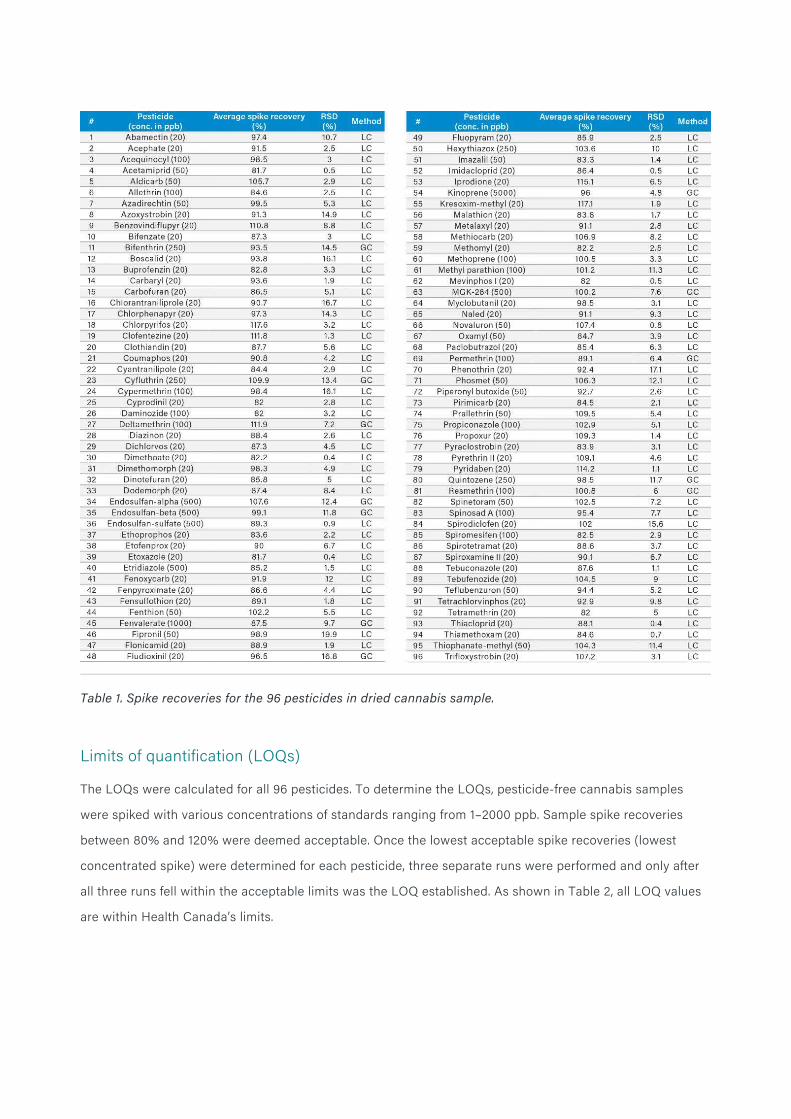
Table 1. Spike recoveries for the 96 pesticides in dried cannabis sample.
Limits of quantification (LOQs)
The LOQs were calculated for all 96 pesticides. To determine the LOQs, pesticide-free cannabis samples
were spiked with various concentrations of standards ranging from 1–2000 ppb. Sample spike recoveries
between 80% and 120% were deemed acceptable. Once the lowest acceptable spike recoveries (lowest
concentrated spike) were determined for each pesticide, three separate runs were performed and only after
all three runs fell within the acceptable limits was the LOQ established. As shown in Table 2, all LOQ values
are within Health Canada’s limits.
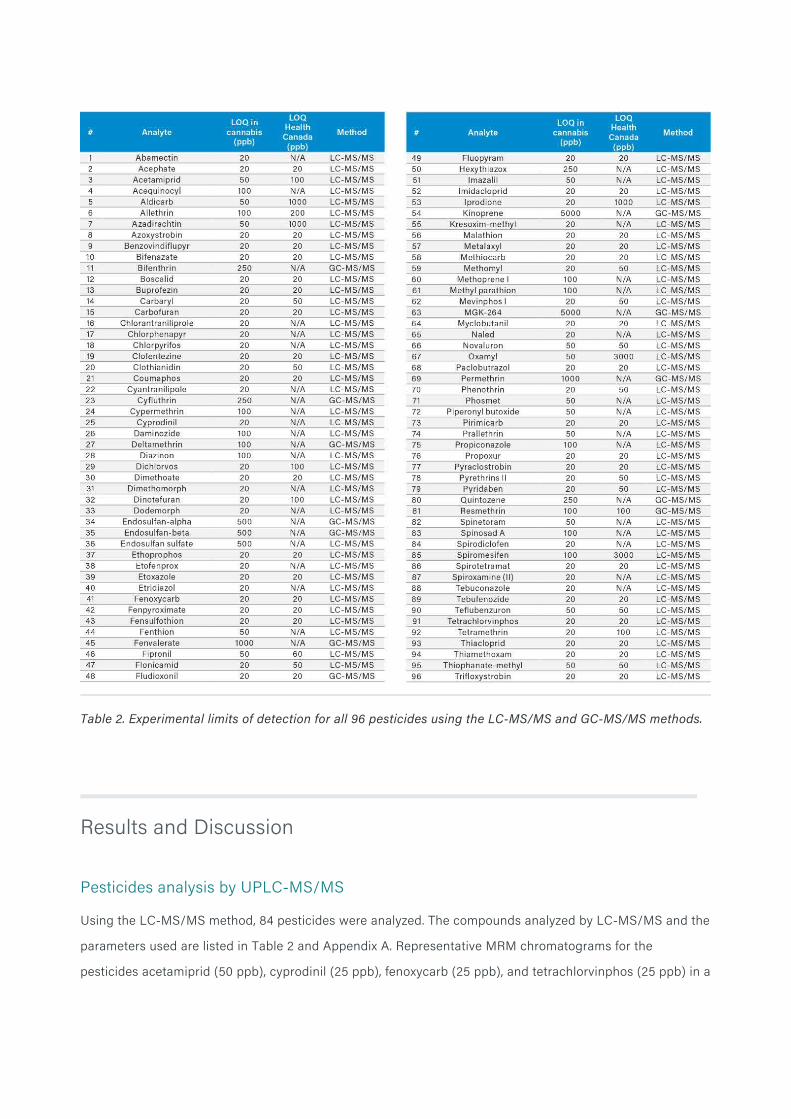
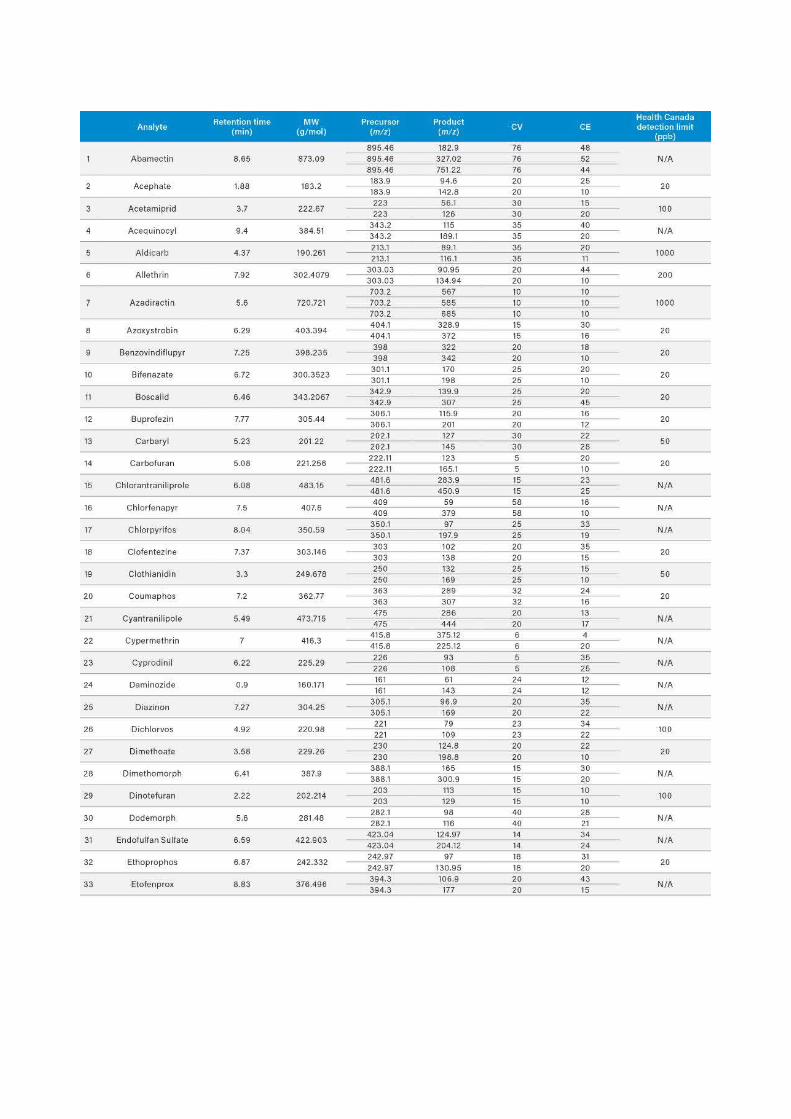
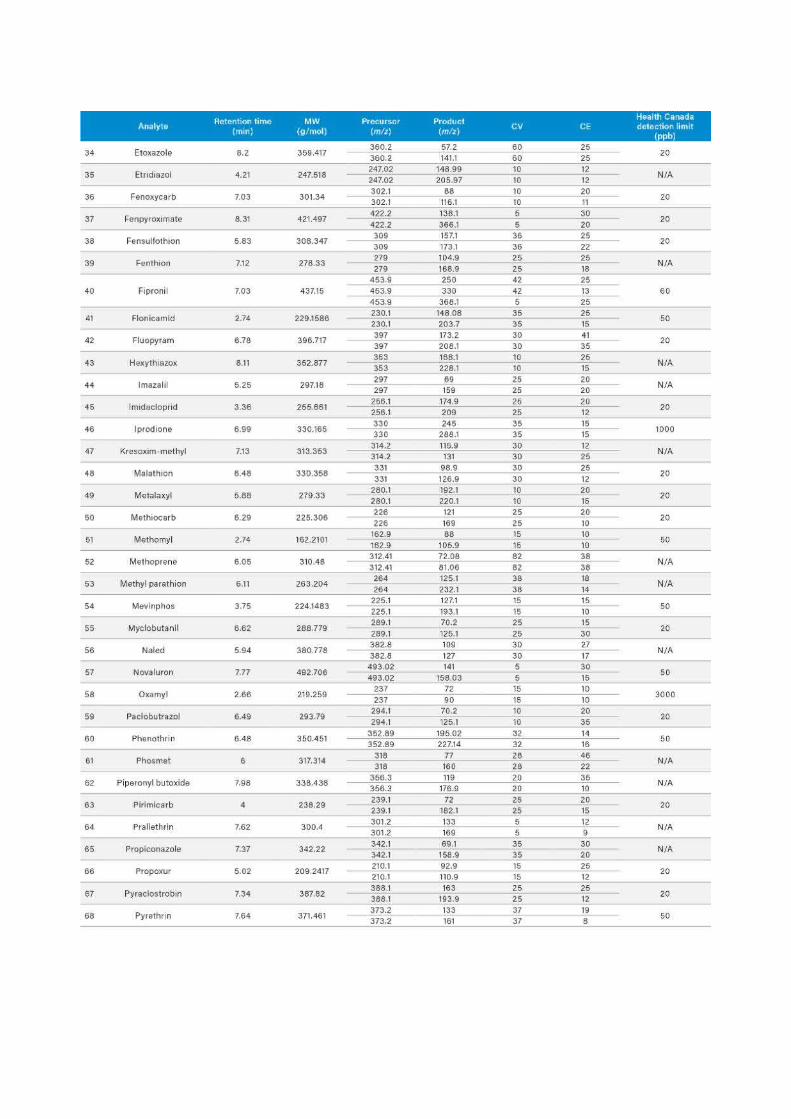
Table 2. Experimental limits of detection for all 96 pesticides using the LC-MS/MS and GC-MS/MS methods.
Results and Discussion
Pesticides analysis by UPLC-MS/MS
Using the LC-MS/MS method, 84 pesticides were analyzed. The compounds analyzed by LC-MS/MS and the
parameters used are listed in Table 2 and Appendix A. Representative MRM chromatograms for the
pesticides acetamiprid (50 ppb), cyprodinil (25 ppb), fenoxycarb (25 ppb), and tetrachlorvinphos (25 ppb) in a
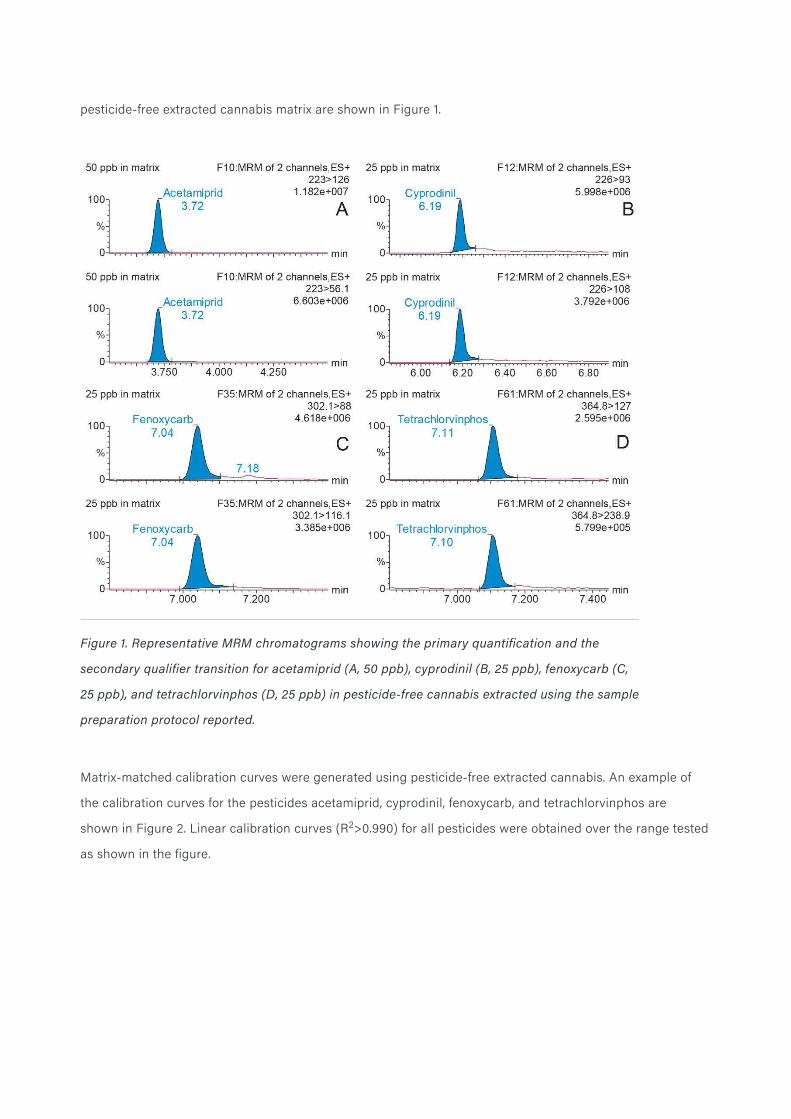
pesticide-free extracted cannabis matrix are shown in Figure 1.
Figure 1. Representative MRM chromatograms showing the primary quantification and the
secondary qualifier transition for acetamiprid (A, 50 ppb), cyprodinil (B, 25 ppb), fenoxycarb (C,
25 ppb), and tetrachlorvinphos (D, 25 ppb) in pesticide-free cannabis extracted using the sample
preparation protocol reported.
Matrix-matched calibration curves were generated using pesticide-free extracted cannabis. An example of
the calibration curves for the pesticides acetamiprid, cyprodinil, fenoxycarb, and tetrachlorvinphos are
shown in Figure 2. Linear calibration curves (R2>0.990) for all pesticides were obtained over the range tested
as shown in the figure.
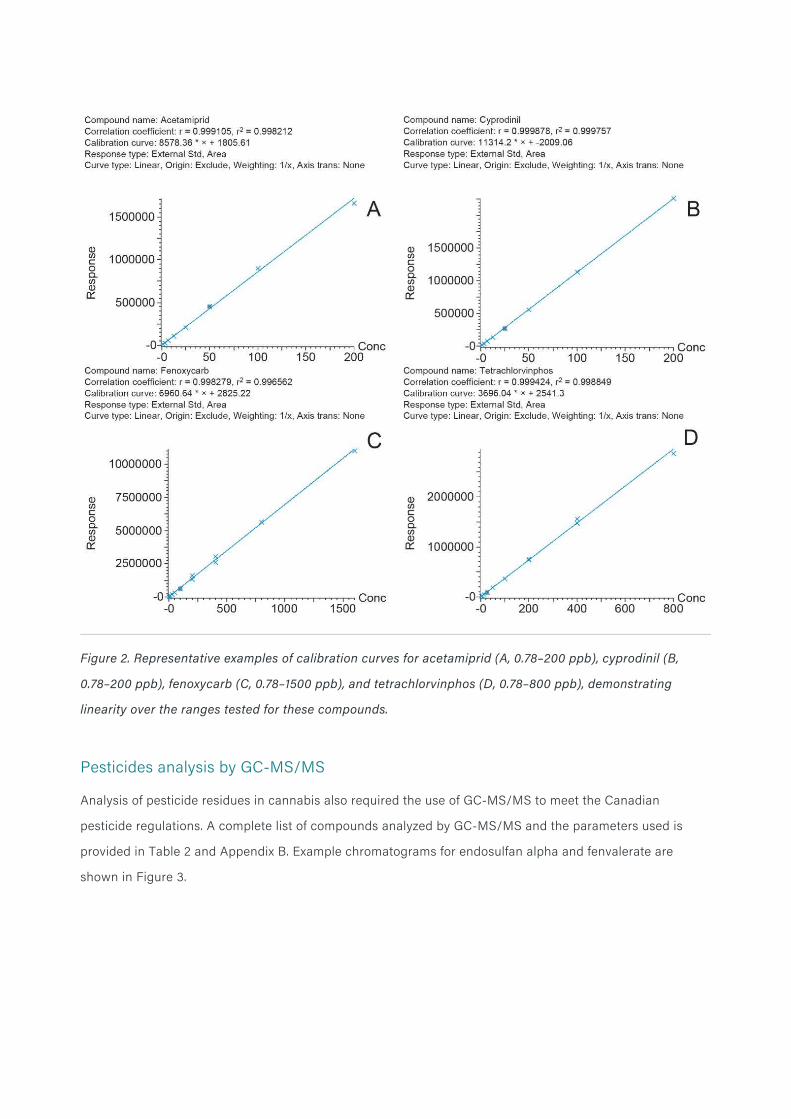
Figure 2. Representative examples of calibration curves for acetamiprid (A, 0.78–200 ppb), cyprodinil (B,
0.78–200 ppb), fenoxycarb (C, 0.78–1500 ppb), and tetrachlorvinphos (D, 0.78–800 ppb), demonstrating
linearity over the ranges tested for these compounds.
Pesticides analysis by GC-MS/MS
Analysis of pesticide residues in cannabis also required the use of GC-MS/MS to meet the Canadian
pesticide regulations. A complete list of compounds analyzed by GC-MS/MS and the parameters used is
provided in Table 2 and Appendix B. Example chromatograms for endosulfan alpha and fenvalerate are
shown in Figure 3.
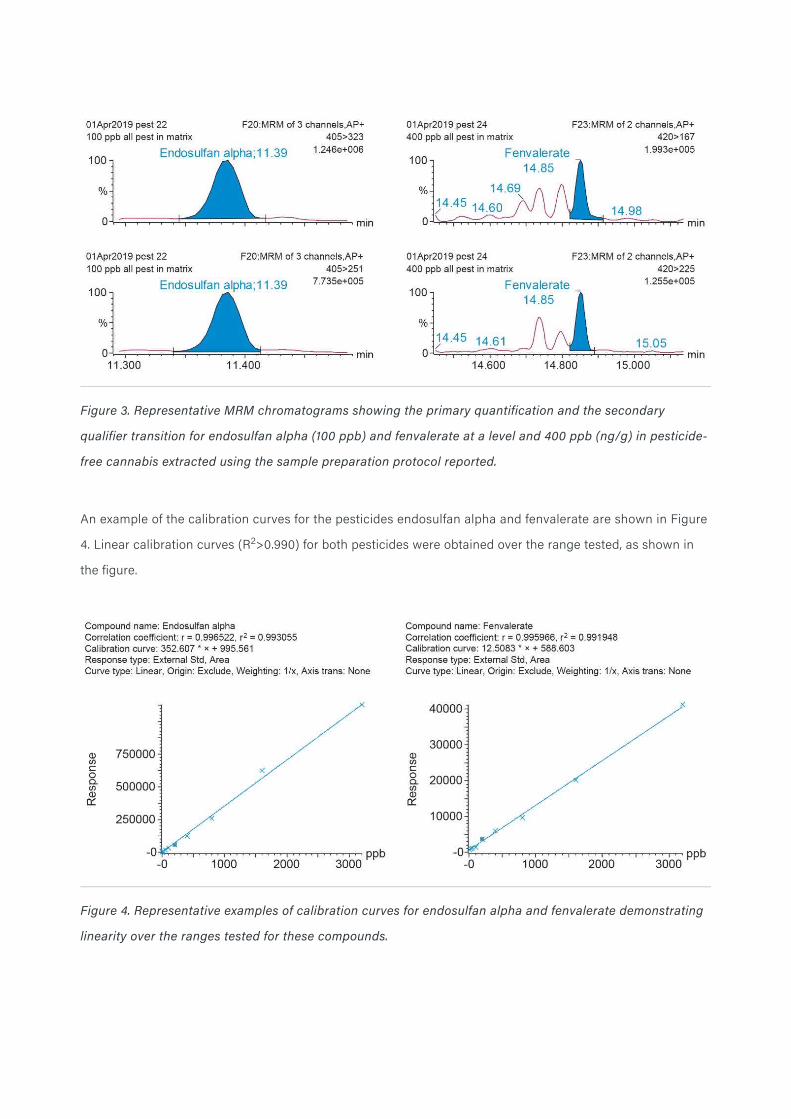
Figure 3. Representative MRM chromatograms showing the primary quantification and the secondary
qualifier transition for endosulfan alpha (100 ppb) and fenvalerate at a level and 400 ppb (ng/g) in pesticide-
free cannabis extracted using the sample preparation protocol reported.
An example of the calibration curves for the pesticides endosulfan alpha and fenvalerate are shown in Figure
4. Linear calibration curves (R2>0.990) for both pesticides were obtained over the range tested, as shown in
the figure.
Figure 4. Representative examples of calibration curves for endosulfan alpha and fenvalerate demonstrating
linearity over the ranges tested for these compounds.
Conclusion
The simple sample extraction and d-SPE clean-up method followed by UPLC-MS/MS and GC-MS/MS
analysis provides a rapid, sensitive, and robust workflow for the determination of the Canadian pesticide list
in challenging cannabis matrices. Complex multi-residue pesticide analysis in a cannabis matrix was
demonstrated using both UPLC and APGC analysis on the same tandem quadrupole instrument (Xevo TQ-S
micro) with detection at the maximum action levels for each of the 96 pesticides in the Canadian pesticide
list. Having the flexibility of universal source architecture to provide access to both UPLC-MS/MS and GC-
MS/MS on the same instrument, allows for an increase of laboratory efficiency, while maintaining required
sensitivity and repeatability. This method meets the action levels for the Canadian pesticide list and
mycotoxins in cannabis matrices.
References
Moulins, J. R.; Blais, M.; Montson, K.; Tully, J.; Mohan, W.; Gagnon, M.; McRitchie, T.; Kwong, K.; Snider, N.;
Blais, D. R. Multiresidue Method of Analysis of Pesticides in Medical Cannabis. J. AOAC 2018, 1101 (6),
1948–1960.
1.
Health Canada. (2018) Mandatory Cannabis Testing for Pesticide Active Ingredients.
https://www.canada.ca/content/dam/phac-aspc/documents/services/publications/drugs-health-
products/cannabis-testing-pesticide-requirements/cannabis-testing-pesticide-requirements.pdf
[accessed on June 11th 2019].
2.
Kovalczuk, T.; Jech, M.; Poustka, J.; Hajslova, J.; UPLC-MS/MS: A Novel Challenge in Multiresidue
Pesticide Analysis in Food Analytica Chimica Acta 2006, 577.
3.
Tienstra, M.; Portoles, T.; Hernandez, F.; Mol, J. G. J. Fast Gas Chromatographic Residue Analysis in
Animal Feed Using Split Injection and Atmospheric Pressure Chemical Ionization Tandem Mass
Spectrometry J. Chromatogr,. A 2015, 1422.
4.
Cherta, L.; Portoles, T.; Beltran, J.; Pitarch, E.; Mol, J. G. J.; Hernandez, F. Application of Gas
Chromatography – Mass Spectrometry with Atmospheric Pressure Chemical Ionization for the
Determination of Multiclass Pesticides in Fruits and Vegetables 2013, 1314.
5.

Appendix A.
MS/MS parameters for pesticides using UPLC.
Appendix B
MS/MS parameters for pesticides using GC.
Featured Products
MassLynx MS Software <https://www.waters.com/513662>
Waters Atmospheric Pressure Gas Chromatography (APGC) <https://www.waters.com/10100362>
ACQUITY UPLC H-Class PLUS System <https://www.waters.com/10138533>
Xevo TQ-S micro Triple Quadrupole Mass Spectrometry <https://www.waters.com/134798856>
720006711, November 2019

©2019 Waters Corporation. All Rights Reserved.