a multi-sensor approach to automating co-ordinate measuring machine-based reverse engineering
TRANSCRIPT

A multi-sensor approach to automating co-ordinate measuringmachine-based reverse engineering
V.H. Chana,*, C. Bradleyb, G.W. Vickersb
aDepartment of Mechanical Engineering, Ryerson Polytechnic University, 350 Victoria Street, Toronto, Ont., Canada M5B 2K3bDepartment of Mechanical Engineering, University of Victoria, Victoria, BC, Canada V8W 3P6
Received 6 December 1999; received in revised form 26 June 2000; accepted 1 December 2000
Abstract
Co-ordinate measuring machines (CMMs) have been widely used in industry for reverse engineering. In an ideal reverse
engineering system, the object would be automatically digitised, the data would be segmented into constituent surface patches,
and an accurate solid model would be generated. However, at present, the time-consuming manual digitisation of many
objects discourages the implementation of reverse engineering. As a major step toward attaining this goal, a charged coupled
device (CCD) camera and a CMM touch probe digitiser are used together in a novel reverse engineering process. Neural
network based stereo image processing is used to locate the object in the CMM work space, and to generate the CMM touch
probe path. Precise data is then collected using the CMM touch probe, from which a CAD/CAM model can be constructed.
# 2001 Elsevier Science B.V. All rights reserved.
Keywords: Machine vision; Reverse engineering; CMM programming; CAD/CAM; Neural networks
1. Introduction
The process of creating a geometric CAD solid
model from an existing physical part is often referred
to as geometric reverse engineering. Using 3-D data
collected by a tactile probe that is mounted on a
machine tool or a co-ordinate measuring machine
(CMM), a CAD model can be created and employed
in many subsequent manufacturing processes. Reverse
engineering applications can range from the creation
of drawings for an aircraft turbine engine air intake [1]
to the digitisation of a telephone handset for the
creation of a plastic injection mold [2]. An in-depth
review of reverse engineering is discussed in a paper
by Varady et al. [3].
Reverse engineering methods currently require that
the CMM operator, through the use of a pendant, to
manually guide a digitising sensor to gather hundreds,
or possibly thousands, of data points on the object to
accurately de®ne surface contours. This is a slow
process, requiring the use of an expensive piece of
equipment for what can be from hours to days.
Although research has been done in the past on
directing a CMM from CAD data [4] and using a
machine vision data to calculate the orientation of a
part on the CMM [5,6]. Research in directing a CMM
without prior knowledge of the part shape has not been
found. In this paper, a solution to this problem is
presented that utilises stereo vision to generate the
necessary spatial information to plan and control the
Computers in Industry 44 (2001) 105±115
* Corresponding author. Tel.: �1-416-979-5303;
fax: �1-416-979-5265.
E-mail address: [email protected] (V.H. Chan).
0166-3615/01/$ ± see front matter # 2001 Elsevier Science B.V. All rights reserved.
PII: S 0 1 6 6 - 3 6 1 5 ( 0 0 ) 0 0 0 8 7 - 7

movement of a tactile touch probe mounted on a
computer numerically controlled CMM.
1.1. Proposed digitisation methodology
In this work, two sensors are used to digitise an object
tobereverseengineered.First, achargedcoupled device
(CCD) camera is used as a low-level 3-D sensor, to
determine the spatial location of a part on the CMM
bed and to recognise individual surface patches on the
object's surface. Precise 3-D information is then
collected using a CMM touch probe. By using both
the CCD camera and the CMM touch probe together,
the following two main advantages are realised.
� The tool path for the CMM touch probe can be
programmed off-line, saving valuable machine time
on the CMM, and providing a more efficient use of
the CMM system.
� Different surfaces and types can be pre-determined
before digitisation by the touch probe, thus, allow-
ing the use of specialised touch probe routines.
A pair of images must be taken for each side of the
object for which surface data is required. Typically,
stereo images from the top, front, back, left and right
sides are taken with the CCD camera. Surface patch
location is achieved by matching the segmented
patches between the stereo image pairs. A Kohonen
neural network base segmentation algorithm is used to
segment the CCD images. Fig. 1 graphically illustrates
the two sensor reverse engineering process.
1.2. System description
A Renishaw touch probe system is mounted on the
z-axis arm of a gantry style CMM end effector for the
collection of 3-D data. The system components are
outlined in Table 1.
A silicon graphics indy (SGI) work station is used
for video image capturing and processing. A personal
computer connected to the CMM controller to allow
for programmed armature movements of the CMM. A
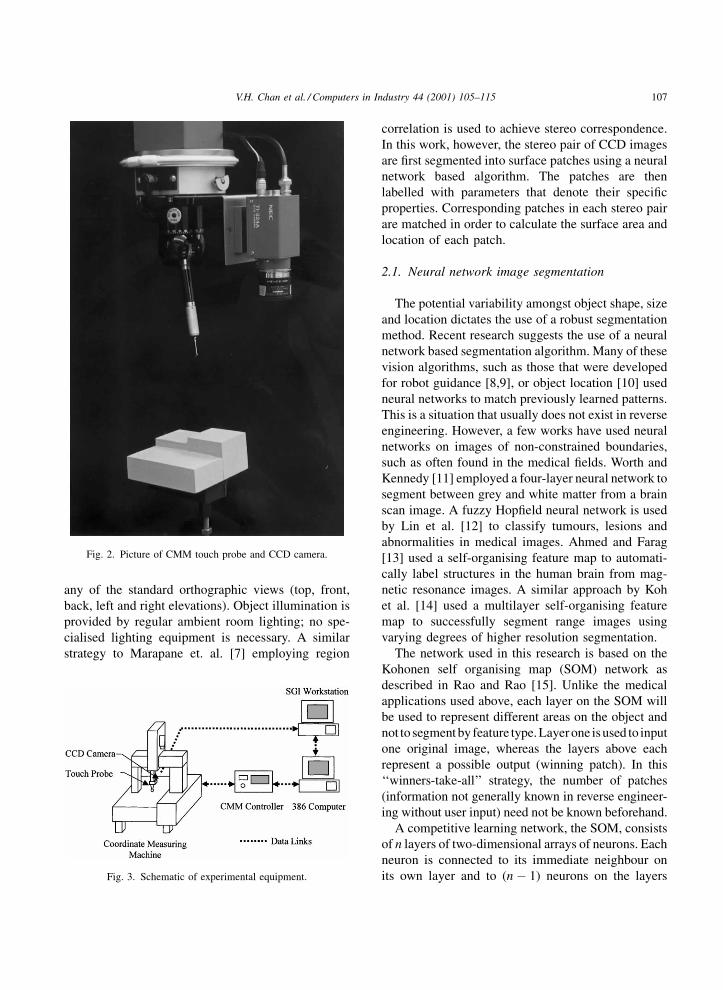
photograph of the CMM touch probe and the mounted
CCD camera is shown in Fig. 2 and Fig. 3 illustrates
the interconnection of the major components in the
system.
2. Applying stereo vision for object localisation
The CMM is employed to provide an accurate and
repeatable platform from which the stereo image pair
can be gathered. This allows the CCD camera to be in
Fig. 1. Two sensor reverse engineering process.
Table 1
Equipment speci®cations
Equipment Specifications
Mitutoyo BHN710 CMM Working volume: 700 mm� 1000 mm� 600 mm, encoder resolution: 0.5 mm, controller: CMMC 35
Renishaw touch trigger probe PH8 probe head, TP2 touch probe maximum repeatability at stylus 0.35 mm
Black and white CCD camera NEC model TI-324A, 380,000 pixels, Computer 8.5 mm f/1.3 close focus lens
PC 386 based PC, linked to CMM controller
Work station Silicon graphics indy, VINO video capture board
106 V.H. Chan et al. / Computers in Industry 44 (2001) 105±115
any of the standard orthographic views (top, front,
back, left and right elevations). Object illumination is
provided by regular ambient room lighting; no spe-
cialised lighting equipment is necessary. A similar
strategy to Marapane et. al. [7] employing region
correlation is used to achieve stereo correspondence.
In this work, however, the stereo pair of CCD images
are ®rst segmented into surface patches using a neural
network based algorithm. The patches are then
labelled with parameters that denote their speci®c
properties. Corresponding patches in each stereo pair
are matched in order to calculate the surface area and
location of each patch.
2.1. Neural network image segmentation
The potential variability amongst object shape, size
and location dictates the use of a robust segmentation
method. Recent research suggests the use of a neural
network based segmentation algorithm. Many of these
vision algorithms, such as those that were developed
for robot guidance [8,9], or object location [10] used
neural networks to match previously learned patterns.
This is a situation that usually does not exist in reverse
engineering. However, a few works have used neural
networks on images of non-constrained boundaries,
such as often found in the medical ®elds. Worth and
Kennedy [11] employed a four-layer neural network to
segment between grey and white matter from a brain
scan image. A fuzzy Hop®eld neural network is used
by Lin et al. [12] to classify tumours, lesions and
abnormalities in medical images. Ahmed and Farag
[13] used a self-organising feature map to automati-
cally label structures in the human brain from mag-
netic resonance images. A similar approach by Koh
et al. [14] used a multilayer self-organising feature
map to successfully segment range images using
varying degrees of higher resolution segmentation.
The network used in this research is based on the
Kohonen self organising map (SOM) network as
described in Rao and Rao [15]. Unlike the medical
applications used above, each layer on the SOM will
be used to represent different areas on the object and
not to segment by feature type.Layerone isused to input
one original image, whereas the layers above each
represent a possible output (winning patch). In this
`̀ winners-take-all'' strategy, the number of patches
(information not generally known in reverse engineer-
ing without user input) need not be known beforehand.
A competitive learning network, the SOM, consists
of n layers of two-dimensional arrays of neurons. Each
neuron is connected to its immediate neighbour on
its own layer and to (nÿ 1) neurons on the layers
Fig. 2. Picture of CMM touch probe and CCD camera.
Fig. 3. Schematic of experimental equipment.
V.H. Chan et al. / Computers in Industry 44 (2001) 105±115 107

immediately below and above its location, as shown in
Fig. 4. The input neurons �x; y; 0� includes the CCD
image on the bottom layer. The (nÿ 1) neurons
located above each input neuron are locked in a
competition to be the winning neuron for the input.
Each winning neuron excites (strengthens) connectors
in a neighbourhood on its own layer but inhibits the
neurons on other layers from being declared winners
for that speci®c input neuron. Once the network is
initialised, the learning of the network is self-organis-
ing. Iteration is complete when the output converges,
i.e. no new or different winning neurons are declared.
For each image pixel �x; y; 0� location, either the
strongest neuron for that pixel location �x; y; k� is
declared the winner or no winner is declared (where
k represents the patch layer). The maximum number of
patches that can be found is limited to the number of
layers on which the neural network is built. Ten layers
are used in this work, one layer for the input image and
the remaining nine layers for the output. Each neuron
has 24 excitatory connectors arranged in a square
neighbourhood around itself (see Fig. 4). Excitatory
connectors gain strength only if they are attached to a
winning neuron. The rate at which the excitatory
connectors are strengthened, dx/dt, is given below
(Eq. (1)):
dx�x;y�;�i;j�dt
��Ax�x;y�;�i;j��Bsgrey�Cymomentum�Zi; j (1)
After each iteration dt, the strength of the connector
between central pixel �x; y� and neighbouring pixel
�i; j� is increased by dx. Constant A in the ®rst term of
Eq. (1) represents the learning rate. The second term
increases the strength of the connectors in areas where
input neurons (image pixels) are of similar intensity.
The value of s is dependent on the difference in grey
level intensity of neighbouring pixels. The last term
provides additional momentum for the growth of large
patches (bigger patches have higher y values and, thus,
can eliminate smaller patches). There are (nÿ 2)
inhibitory connections for each pixel location �x; y�.Initially, the inhibitory connectors are all set equal to
one. The rate at which the inhibitory connectors
change is (Eq. (2))
dg�x;y;k�dg
� �Dg�x;y;k�; for Z�x;y;k� � 0;
dg�x;y;k�dg
� ÿDg�x;y;k�; for Z�x;y;k� � 0 (2)
The inhibitory connectors in Eq. (2) change by a value
of dg for each iteration of dt. The constant D represents
the learning rate and g is the strength of the inhibitory
connector at (t ÿ 1).
The strength of the connectors determines which
neuron �x; y; k� will be the winner for that particular
pixel �x; y� location, as expressed in Eq. (3):
Zvalue�x; y; k�
�X5
m�1
X5
n�1
�x�x;y�;�xÿ2�m;yÿ2�m� ÿ g�x;y;k�Z�x;y;k�� (3)
Employing the `̀ winners-take-all'' strategy, the neu-
ron at position �x; y; k� for k � 1 to 9, with the max-
imum value that is larger than other values for that
location, is declared the winner (1) while all other
neurons on the other layers at pixel location �x; y; k�are losers (0). The connectors are iterated until the
values converge (i.e. no more winning neurons are
declared).
To determine the appropriate values for constants A,
B, C and D, each was ®rst set to unity. Starting at
constant A, different values were tested and the effects
observed. Though examination of various images, the
values for A � 1:0, B � 2:0, C � 10 and D � 0:1gave the best results.
In summary, each iteration of the algorithm consist
of three steps. First, the excitatory connectors,
Fig. 4. Kohonen neural network con®guration.
108 V.H. Chan et al. / Computers in Industry 44 (2001) 105±115
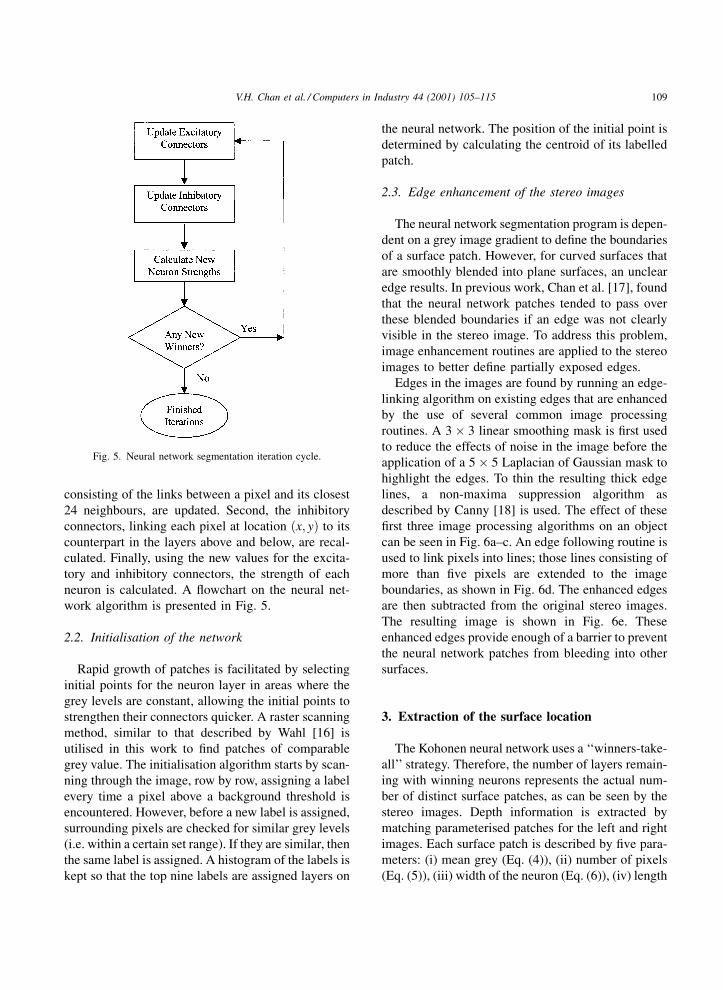
consisting of the links between a pixel and its closest
24 neighbours, are updated. Second, the inhibitory
connectors, linking each pixel at location �x; y� to its
counterpart in the layers above and below, are recal-
culated. Finally, using the new values for the excita-
tory and inhibitory connectors, the strength of each
neuron is calculated. A ¯owchart on the neural net-
work algorithm is presented in Fig. 5.
2.2. Initialisation of the network
Rapid growth of patches is facilitated by selecting
initial points for the neuron layer in areas where the
grey levels are constant, allowing the initial points to
strengthen their connectors quicker. A raster scanning
method, similar to that described by Wahl [16] is
utilised in this work to ®nd patches of comparable
grey value. The initialisation algorithm starts by scan-
ning through the image, row by row, assigning a label
every time a pixel above a background threshold is
encountered. However, before a new label is assigned,
surrounding pixels are checked for similar grey levels
(i.e. within a certain set range). If they are similar, then
the same label is assigned. A histogram of the labels is
kept so that the top nine labels are assigned layers on
the neural network. The position of the initial point is
determined by calculating the centroid of its labelled
patch.
2.3. Edge enhancement of the stereo images
The neural network segmentation program is depen-
dent on a grey image gradient to de®ne the boundaries
of a surface patch. However, for curved surfaces that
are smoothly blended into plane surfaces, an unclear
edge results. In previous work, Chan et al. [17], found
that the neural network patches tended to pass over
these blended boundaries if an edge was not clearly
visible in the stereo image. To address this problem,
image enhancement routines are applied to the stereo
images to better de®ne partially exposed edges.
Edges in the images are found by running an edge-
linking algorithm on existing edges that are enhanced
by the use of several common image processing
routines. A 3� 3 linear smoothing mask is ®rst used
to reduce the effects of noise in the image before the
application of a 5� 5 Laplacian of Gaussian mask to
highlight the edges. To thin the resulting thick edge
lines, a non-maxima suppression algorithm as
described by Canny [18] is used. The effect of these
®rst three image processing algorithms on an object
can be seen in Fig. 6a±c. An edge following routine is
used to link pixels into lines; those lines consisting of
more than ®ve pixels are extended to the image
boundaries, as shown in Fig. 6d. The enhanced edges
are then subtracted from the original stereo images.
The resulting image is shown in Fig. 6e. These
enhanced edges provide enough of a barrier to prevent
the neural network patches from bleeding into other
surfaces.
3. Extraction of the surface location
The Kohonen neural network uses a `̀ winners-take-
all'' strategy. Therefore, the number of layers remain-
ing with winning neurons represents the actual num-
ber of distinct surface patches, as can be seen by the
stereo images. Depth information is extracted by
matching parameterised patches for the left and right
images. Each surface patch is described by ®ve para-
meters: (i) mean grey (Eq. (4)), (ii) number of pixels
(Eq. (5)), (iii) width of the neuron (Eq. (6)), (iv) length
Fig. 5. Neural network segmentation iteration cycle.
V.H. Chan et al. / Computers in Industry 44 (2001) 105±115 109

(Eq. (7)) and (v) co-ordinates of the centroid (Eq. (8)).
Gmean;k �Pm
x�0
Pny�0Z�x;y;k�Z�x;y;0�Psum;k
; for layer k (4)
Psum;k �Xm
x�0
Xn
y�0
Z�x;y;k�; for layer k (5)
width�max�x�ÿmin�x� of Z�x;y;k� for layer k (6)
length�max�y�ÿmax�y� of Z�x;y;k� for layer k (7)
centroid i �Xm
x�0
Xn
y�0
Z�x;y;k�xPsum;k
; for layer k;
centroid j �Xm
x�0
Xn
y�0
Z�x;y;k�yPsum;k
; for layer k (8)
It was found that a maximum of 10% error allowed
between the matched parameters allowed for correct
results from the stereo image pairs. Displacement of
the CCD camera along the cartesian axis of the CMM
ensures that the co-ordinates of the centroids will lie
on the epipolar line on both images.
The distance from the camera lens to the surface of
the matched pairs is calculated as shown in Fig. 7. The
co-ordinates of the camera is readily available from
the CMM controller.
Using the centroid of the patches as the base dis-
placement between the image pairs, the distance of the
patch from the camera can be calculated as
z � bf
x0l ÿ x0r(9)
4. Location of concavities on the patch surface
One important use for a CMM is to locate con-
cavities on an object being reverse engineered. Often,
Fig. 6. Image edge enhancements.
Fig. 7. Calculation of stereo depth.
110 V.H. Chan et al. / Computers in Industry 44 (2001) 105±115

concavities are used as bearing surfaces or for locating
pins. In this work, holes are found by searching for
voids inside the patch boundaries previously de®ned
through the neural network segmentation as shown in
Fig. 8. A ¯owchart of the concavity-®nding algorithm
can be seen in Fig. 9.
The location and radius of the holes found is derived
from the co-ordinate information already calculated
for each patch. It is assumed that the top of the hole
begins at the same height as the patch surface. A
speci®c-hole measuring routine is then incorporated
into the CMM probe tool path.
5. Testing of the algorithm
The algorithm was assessed with four different test
objects. The ®rst two objects are without holes, to test
the ability to ®nd individual patches. To begin with,
the L-shaped blended surface discussed in Section 2.3
was used to test the algorithm ability to work with
smoothed surfaces (Fig. 10).
The neural network algorithm identi®ed the top
surface; 37 iterations for the right and 35 iterations
for the left were required to complete the segmenta-
tion. This difference in the number of iterations is due
to the pixel grey level variance created by shadows
from the CMM end effector. The number of iterations
and patches found for the other sides of the object are
shown in Table 2.
At this stage in the reverse engineering process, the
algorithm has generated the following information.
� The number of surfaces on the object.
� The number of holes in the object.
Fig. 8. Raster scan for potential concavities.
Fig. 9. Surface hole location algorithm.
Fig. 10. Picture of L-shaped object with blended surfaces.
V.H. Chan et al. / Computers in Industry 44 (2001) 105±115 111
� The centroid (Xc, Yc, Zc) of each patch and the
location of each hole.
� The length and width of each patch and the radii of
each hole.
� The orientation of the patches and holes relative to
the CCD camera position at which the stereo image
was taken.
Thus, the object and its constituent features have been
described by the stereo vision system; this data are used
by the CMM control system to govern the location,
orientation and movement of the touch probe.
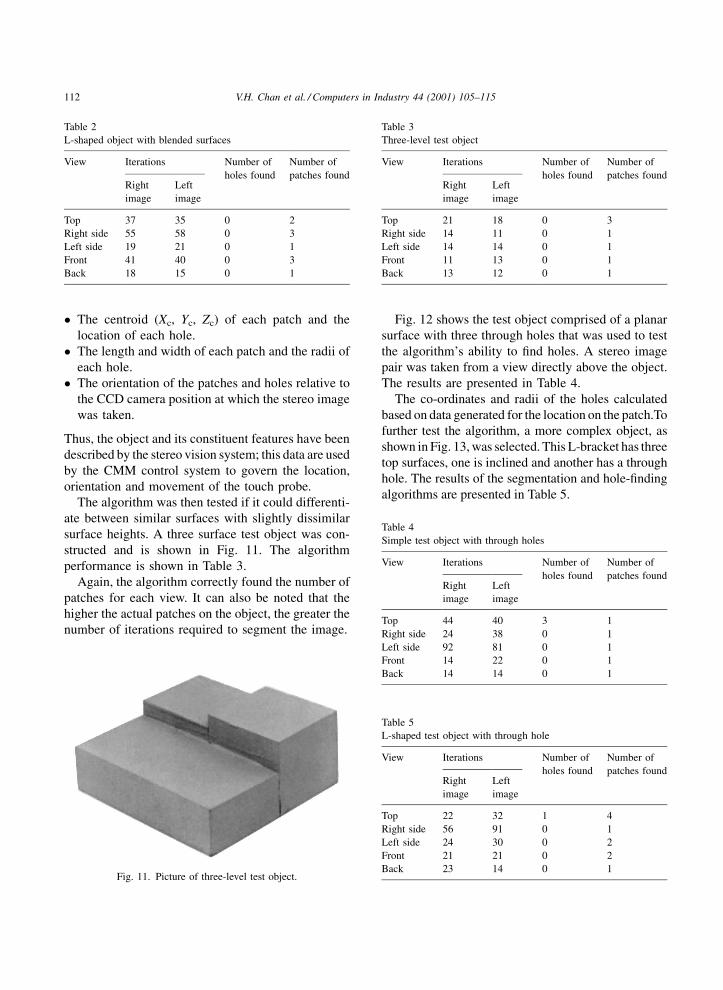
The algorithm was then tested if it could differenti-
ate between similar surfaces with slightly dissimilar
surface heights. A three surface test object was con-
structed and is shown in Fig. 11. The algorithm
performance is shown in Table 3.
Again, the algorithm correctly found the number of
patches for each view. It can also be noted that the
higher the actual patches on the object, the greater the
number of iterations required to segment the image.
Fig. 12 shows the test object comprised of a planar
surface with three through holes that was used to test
the algorithm's ability to ®nd holes. A stereo image
pair was taken from a view directly above the object.
The results are presented in Table 4.
The co-ordinates and radii of the holes calculated
based on data generated for the location on the patch.To
further test the algorithm, a more complex object, as
shown in Fig. 13, was selected. This L-bracket has three
top surfaces, one is inclined and another has a through
hole. The results of the segmentation and hole-®nding
algorithms are presented in Table 5.
Table 2
L-shaped object with blended surfaces
View Iterations Number of
holes found
Number of
patches foundRight
image
Left
image
Top 37 35 0 2
Right side 55 58 0 3
Left side 19 21 0 1
Front 41 40 0 3
Back 18 15 0 1
Fig. 11. Picture of three-level test object.
Table 3
Three-level test object
View Iterations Number of
holes found
Number of
patches foundRight
image
Left
image
Top 21 18 0 3
Right side 14 11 0 1
Left side 14 14 0 1
Front 11 13 0 1
Back 13 12 0 1
Table 4
Simple test object with through holes
View Iterations Number of
holes found
Number of
patches foundRight
image
Left
image
Top 44 40 3 1
Right side 24 38 0 1
Left side 92 81 0 1
Front 14 22 0 1
Back 14 14 0 1
Table 5
L-shaped test object with through hole
View Iterations Number of
holes found
Number of
patches foundRight
image
Left
image
Top 22 32 1 4
Right side 56 91 0 1
Left side 24 30 0 2
Front 21 21 0 2
Back 23 14 0 1
112 V.H. Chan et al. / Computers in Industry 44 (2001) 105±115

As indicated in Table 5, the algorithm found one
more patch than actually existed. This problem
occurred due to the large upright portion of the test
object casting a large shadow area with even surface
intensity.
Comparing the results from Tables 2±5, a number of
interesting observations can be made. It is seen that the
number of iterations between right and left images is
usually not the same. This is a result of shadows cast
by the armature of the CMM gantry, causing a change
of the grey level gradient in the images. Because of the
placement of the object on the CMM deck, the right
side of the object is usually in shadow, thus, resulting
in less image contrast. This lack of image contrast
required longer iteration times to segment the image.
The larger patch sizes on the surface of the simple test
object increased the number of iteration cycles
required for the algorithm to cover the surface. With
the exception of the images from the top view of the
complex test object (Fig. 13), the algorithms correctly
identi®ed the number of patches and holes on all the
surfaces of both test objects. Due to the height of the
L-bracket, shadows from the vertical part of the
bracket cast strong shadows onto the top surface, thus,
misrepresenting the actual number of surfaces from
that view.
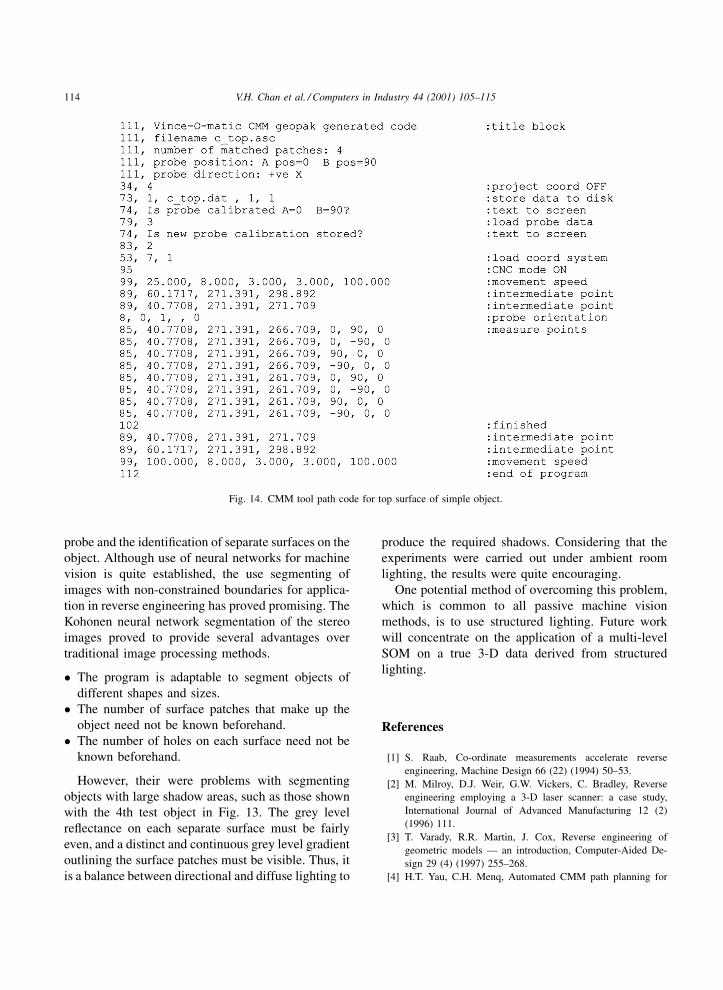
With the size and location of each patch known, the
path for a CMM touch probe can be programmed.
Each is directed to measure each patch in a grid like
manner. The relative locations between each patch is
considered to avoid collision of the CMM touch probe
stylus. A travelling salesman algorithm is used to
optimise the path of the touch probe. A sample tool
path code for the top surface of the simple test object is
presented in Fig. 14.
6. Conclusions and recommendations
Two primary aspects of reverse engineering are
accomplished by the incorporation of a CCD camera
into the CMM system: tool path planning for the touch
Fig. 12. Picture of simple test object with multiple holes.
Fig. 13. Picture of L-shaped test object with hole.
V.H. Chan et al. / Computers in Industry 44 (2001) 105±115 113
probe and the identi®cation of separate surfaces on the
object. Although use of neural networks for machine
vision is quite established, the use segmenting of
images with non-constrained boundaries for applica-
tion in reverse engineering has proved promising. The
Kohonen neural network segmentation of the stereo
images proved to provide several advantages over
traditional image processing methods.
� The program is adaptable to segment objects of
different shapes and sizes.
� The number of surface patches that make up the
object need not be known beforehand.
� The number of holes on each surface need not be
known beforehand.
However, their were problems with segmenting
objects with large shadow areas, such as those shown
with the 4th test object in Fig. 13. The grey level
re¯ectance on each separate surface must be fairly
even, and a distinct and continuous grey level gradient
outlining the surface patches must be visible. Thus, it
is a balance between directional and diffuse lighting to
produce the required shadows. Considering that the
experiments were carried out under ambient room
lighting, the results were quite encouraging.
One potential method of overcoming this problem,
which is common to all passive machine vision
methods, is to use structured lighting. Future work
will concentrate on the application of a multi-level
SOM on a true 3-D data derived from structured
lighting.
References
[1] S. Raab, Co-ordinate measurements accelerate reverse
engineering, Machine Design 66 (22) (1994) 50±53.
[2] M. Milroy, D.J. Weir, G.W. Vickers, C. Bradley, Reverse
engineering employing a 3-D laser scanner: a case study,
International Journal of Advanced Manufacturing 12 (2)
(1996) 111.
[3] T. Varady, R.R. Martin, J. Cox, Reverse engineering of
geometric models Ð an introduction, Computer-Aided De-
sign 29 (4) (1997) 255±268.
[4] H.T. Yau, C.H. Menq, Automated CMM path planning for
Fig. 14. CMM tool path code for top surface of simple object.
114 V.H. Chan et al. / Computers in Industry 44 (2001) 105±115

dimensional inspection of dies and molds having complex
surfaces, International Journal of Machine Tool Manufac-
turers 35 (6) (1995) 861±876.
[5] Y. Takeuchi, H. Shimizu, I. Mukai, Automatic measurement
of three-dimensional co-ordinate measuring machine by
means of CAD and image data, Annals of the CIRP 39 (1)
(1990) 565±568.
[6] M.W. Cho, M.K. Kim, K. Kim, Flexible inspection system
based on a vision guided co-ordinate measuring machine,
International Journal of Production Research 33 (5) (1995)
1433±1488.
[7] S.B. Marapane, M.M. Trivedi, Region-based stereo analysis
for robotic applications, IEEE transactions on systems, Man
and Cybernetics 19 (6) (1989) 1447±1464.
[8] S.S. Christensen, A.W. Andersen, T.M. Jorgensen, C.
Liisberg, Visual guidance of a pig evisceration robot using
neural networks, Pattern Recognition Letters 17 (1996) 345±
355.
[9] S. Baek, D.S. Park, J. Cho, Y.B. Lee, A robot endeffector
tracking system based on feedforward neural networks,
Robotics and Autonomous Systems 28 (1999) 43±52.
[10] M.B. Lynch, C.H. Dagli, Stereoscopic neuro-vision for three-
dimensional object recognition, Mathematical and Computer
Modelling 21 (1/2) (1995) 185±215.
[11] A.J. Worth, D.N. Kennedy, Segmentation of magnetic
resonance brain images using analogue constraint satisfaction
neural networks, Image and Vision Computing 12 (6) (1994)
345±354.
[12] J.S. Lin, K.S. Cheng, C.W. Mao, Multispectral magnetic
resonance images segmentation using fuzzy Hop®eld neural
network, International Journal of Bio-Medical Computing 42
(1996) 205±214.
[13] M.N. Ahmed, A.A. Farag, Two-stage neural network for
volume segmnetation of medical images, Pattern Recognition
Letters 18 (1997) 1143±1151.
[14] J. Koh, M. Suk, S. Bhandorkar, A multilayer self-organising
feature map for range image segmentation, Neural Networks
8 (1) (1995) 67±86.
[15] V.B. Rao, H.V. Rao, Neural Networks and Fuzzy Logic, 2nd
Edition, MIS Press, New York, 1995.
[16] F.M. Wahl, Digital Image Signal Processing, Artech House,
Boston, 1987.
[17] V. Chan, C. Bradley, G.W. Vickers, Automation of laser
scanning for reverse engineering, in: Proceedings of the SPIE
conference Ð Rapid Product Development Technologies,
Boston, 18±22 November 1996.
[18] J. Canny, A computational approach to edge detection, IEEE
Transactions on Pattern Analysis and Machine Intelligence
PAMI-8 (6) (1986) 679±698.
Dr. Vincent H Chan is an assistant pro-
fessor in the Department of Mechanical
Engineering at Ryerson Polytechnic Uni-
versity, in Toronto, Canada. He received
his BASc degree from the University of
Waterloo, MSc from Queen's University
at Kingston, and PhD from the University
of Victoria. He has worked as a design
engineer in the automotive industry and
is presently performing research in the
areas of machine vision and advanced
manufacturing.
Dr. Colin Bradley is an associate pro-
fessor in the Department of Mechanical
Engineering at the University of Victoria,
BC, Canada. He completed his BASc
degree from the University of British
Columbia, MSc from Heriot-Watt Uni-
versity and PhD from the University of
Victoria. His research work has centered
on industrial machine vision, computer-
aided manufacturing and advanced
industrial sensors.
Geoffrey W Vickers is a professor of
mechanical engineering at the University
of Victoria. He has a strong background
in computer-aided design and manufac-
ture. His research on the de®nition and
numerically controlled (CNC) machining
of curved surfaces, which was published
by Ellis Horwood Ltd., has found appli-
cation in mould and die making, in pro-
peller manufacture, in ship building, and
in the marine industry. The integrated
surface fairing and manufacturing program, marketed by Albacore
Research Ltd., has been installed in over a hundred shipyards world-
wide and has been used to produce a range of production vessels.
Some of Professor Vickers' patented inventions are the centrifuge
reverse osmosis desalination unit, the cavitation liquid-jet cleaning
lance, and the ice-blasting device.
V.H. Chan et al. / Computers in Industry 44 (2001) 105±115 115