a multivariate approach to determine the effect of doses ...jpacd.org/downloads/vol7/v7_7.pdfa...
TRANSCRIPT

A Multivariate Approach to Determine the Effect of Doses and Sources of N, P, and K in Opuntia ficus-indica L. Mill.♦
Bernardo Murillo-Amador1*, José Luis García-Hernández1, Narciso Ysac Ávila-Serrano2, Ignacio Orona-Castillo3, Enrique Troyo-Diéguez1, Alejandra Nieto-Garibay1,
Francisco H. Ruiz-Espinoza2, and Sergio Zamora-Salgado2
1 Centro de Investigaciones Biológicas del Noroeste, S.C. Mar Bermejo No. 195 Col. Playa Palo de Santa Rita. La Paz, Baja California Sur, México, 23090.
Tel. +52-612-123-84-84 Ext. 3440. Fax. +52-612-123-85-25
2 Universidad Autónoma de Baja California Sur. Apdo. Postal 19B. La Paz, Baja California Sur, México.
3 Instituto Nacional de Investigaciones Forestales, Agrícolas y Pecuarias. Centro Nacional de Investigación Disciplinaria en la Relación Agua, Suelo, Planta y Atmósfera.
Apartado Postal No. 41, CP 35150. Cd. Lerdo, Durango, México.
*Corresponding author. e-mail: [email protected]
ABSTRACT
In this work, the effect of doses and sources of nitrogen, phosphorus, and potassium in the production of young cladodes (nopalitos) (cladode sprouts) in prickly pear var. Italiana were studied. The treatments were combinations of doses and sources of commercial fertilizers: T1 = 120 kg N ha-1 (urea), T2 = 120 kg N ha-1 (ammonium nitrate), T3 = 240 kg N ha-1 (urea), T4 = 240 kg N ha-1 (ammonium nitrate), T5 = 100 kg P ha-1 (triple 17), T6 = 100 kg P ha-
1 (mono-ammonium phosphate), T7 = 200 kg P ha-1 (triple 17), T8 = 200 kg P ha-1 (mono-ammonium phosphate), T9 = 90 kg K ha-1 (NKS), T10 = 90 kg K ha-1 (potassium sulphate), T11 = 180 kg K ha-1 (NKS), T12 = 180 kg K ha-
1 (potassium sulphate), and T13 = control (without fertilizer), which were arranged in a complete randomized block design with four replications. The data were analyzed using univariate and multivariate analysis of variance and multiple comparison means (LSD p=0.05) when the variables showed significant statistical differences among treatments. Results of the univariate and multivariate analysis showed that all variables were significantly different among treatments. The best treatment was T4 [240 kg N ha-1 (ammonium nitrate)], where at least six variables showed the highest values. In general terms, the highest values of the majority of variables were in treatments T1, T2, T3, and T4, which are represented by N; followed by treatments T5, T6, T7, and T8, where the fertilizer was P; treatments T9, T10, T11, and T12, represented by K; and, finally, by the plants of the control (T13). In this sense, results showed a positive effect of N in the production of nopalitos. The three canonical variables explain 94% of the variability due to the treatments, showing that the response of the majority of variables was according the sources of mineral (N, P, and K), where treatments with N were related to the most important canonical variable (CAN1), treatments with P were related to CAN3, and treatments with K were related with CAN2. According to the use of multivariate analysis of variance, we conclude that it was possible to resume and to corroborate our results using this methodology. Although this study is not conclusive, it was a good exploratory method to design the next experiments in the field under the environmental conditions of Baja California Sur using the combination of N, P, and K and different doses of commercial fertilizer. Keywords: multivariate analysis, chemical fertilization, prickly pear, young harvested cladodes, nopalitos.
♦ Received 15 July 2005
J. PACD – 2005 110
INTRODUCTION
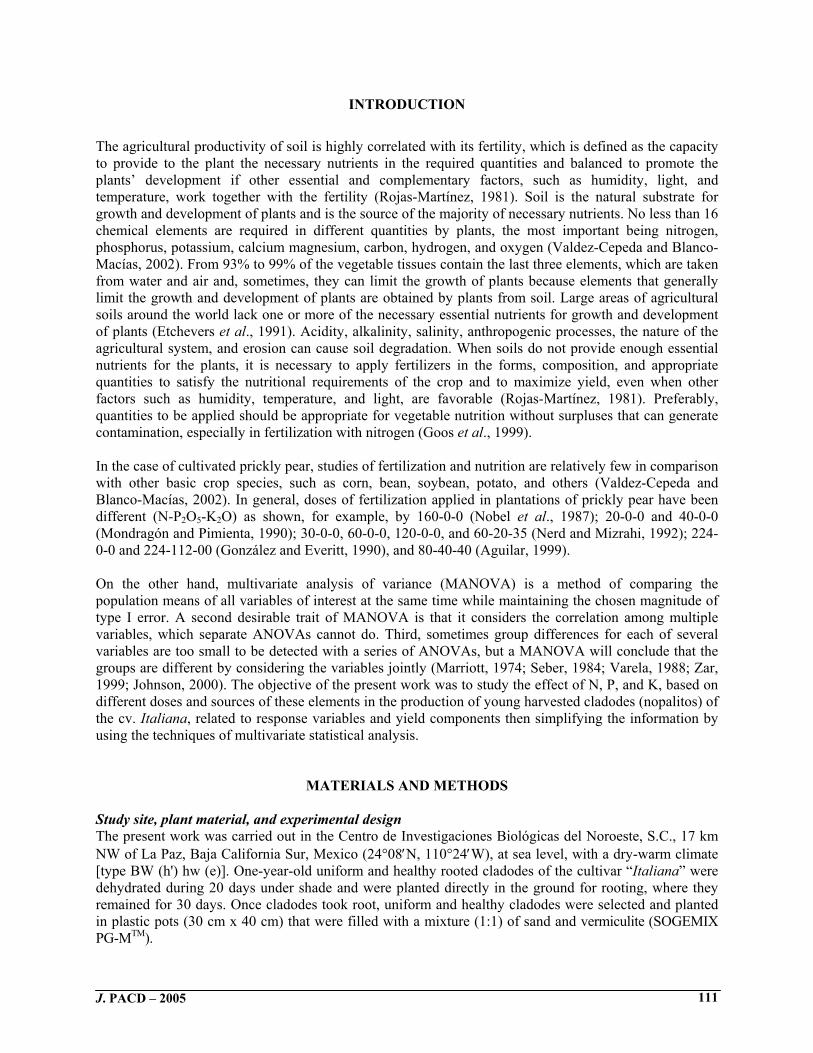
The agricultural productivity of soil is highly correlated with its fertility, which is defined as the capacity to provide to the plant the necessary nutrients in the required quantities and balanced to promote the plants’ development if other essential and complementary factors, such as humidity, light, and temperature, work together with the fertility (Rojas-Martínez, 1981). Soil is the natural substrate for growth and development of plants and is the source of the majority of necessary nutrients. No less than 16 chemical elements are required in different quantities by plants, the most important being nitrogen, phosphorus, potassium, calcium magnesium, carbon, hydrogen, and oxygen (Valdez-Cepeda and Blanco-Macías, 2002). From 93% to 99% of the vegetable tissues contain the last three elements, which are taken from water and air and, sometimes, they can limit the growth of plants because elements that generally limit the growth and development of plants are obtained by plants from soil. Large areas of agricultural soils around the world lack one or more of the necessary essential nutrients for growth and development of plants (Etchevers et al., 1991). Acidity, alkalinity, salinity, anthropogenic processes, the nature of the agricultural system, and erosion can cause soil degradation. When soils do not provide enough essential nutrients for the plants, it is necessary to apply fertilizers in the forms, composition, and appropriate quantities to satisfy the nutritional requirements of the crop and to maximize yield, even when other factors such as humidity, temperature, and light, are favorable (Rojas-Martínez, 1981). Preferably, quantities to be applied should be appropriate for vegetable nutrition without surpluses that can generate contamination, especially in fertilization with nitrogen (Goos et al., 1999). In the case of cultivated prickly pear, studies of fertilization and nutrition are relatively few in comparison with other basic crop species, such as corn, bean, soybean, potato, and others (Valdez-Cepeda and Blanco-Macías, 2002). In general, doses of fertilization applied in plantations of prickly pear have been different (N-P2O5-K2O) as shown, for example, by 160-0-0 (Nobel et al., 1987); 20-0-0 and 40-0-0 (Mondragón and Pimienta, 1990); 30-0-0, 60-0-0, 120-0-0, and 60-20-35 (Nerd and Mizrahi, 1992); 224-0-0 and 224-112-00 (González and Everitt, 1990), and 80-40-40 (Aguilar, 1999). On the other hand, multivariate analysis of variance (MANOVA) is a method of comparing the population means of all variables of interest at the same time while maintaining the chosen magnitude of type I error. A second desirable trait of MANOVA is that it considers the correlation among multiple variables, which separate ANOVAs cannot do. Third, sometimes group differences for each of several variables are too small to be detected with a series of ANOVAs, but a MANOVA will conclude that the groups are different by considering the variables jointly (Marriott, 1974; Seber, 1984; Varela, 1988; Zar, 1999; Johnson, 2000). The objective of the present work was to study the effect of N, P, and K, based on different doses and sources of these elements in the production of young harvested cladodes (nopalitos) of the cv. Italiana, related to response variables and yield components then simplifying the information by using the techniques of multivariate statistical analysis.
MATERIALS AND METHODS Study site, plant material, and experimental design The present work was carried out in the Centro de Investigaciones Biológicas del Noroeste, S.C., 17 km NW of La Paz, Baja California Sur, Mexico (24°08′N, 110°24′W), at sea level, with a dry-warm climate [type BW (h') hw (e)]. One-year-old uniform and healthy rooted cladodes of the cultivar “Italiana” were dehydrated during 20 days under shade and were planted directly in the ground for rooting, where they remained for 30 days. Once cladodes took root, uniform and healthy cladodes were selected and planted in plastic pots (30 cm x 40 cm) that were filled with a mixture (1:1) of sand and vermiculite (SOGEMIX PG-MTM).
J. PACD – 2005 111

The treatments consisted of applying different doses and sources (commercial fertilizers) of nitrogen, phosphorus, and potassium (N, P, and K) for a total of 13 treatments, including the control: T1 = 120 kg N ha-1 (urea), T2 = 120 kg N ha-1 (ammonium nitrate), T3 = 240 kg N ha-1 (urea), T4 = 240 kg N ha-1 (ammonium nitrate), T5 = 100 kg P ha-1 (triple 17), T6 = 100 kg P ha-1 (mono-ammonium phosphate), T7 = 200 kg P ha-1 (triple 17), T8 = 200 kg P ha-1 (mono-ammonium phosphate), T9 = 90 kg K ha-1 (NKS), T10 = 90 kg K ha-1 (potassium sulphate), T11 = 180 kg K ha-1 (NKS), T12 = 180 kg K ha-1 (potassium sulphate), T13 = control (without fertilizer). The experiment had a completely random block design with four replications containing two rooted cladodes per replication for each treatment for a total of 104 rooted cladodes in the experiment. Variables measured in harvested nopalitos Well developed nopalitos were sampled each week from 15 April 1999 to 23 August 1999 and the following variables were measured: number of harvested nopalitos (NC); fresh weight (FW, in g); dry weight (DW, in g) which were determined using an electronic balance (Portable OAHUS Advanced Model No. CT600-S). Dry weight was determined after oven drying (BLUE M UL 543H, Blue Island, Ilinois, U.S.A.) to constant weight at 80°C. The pad thickness of cladodes (PT, in cm) was measured using a digital caliper (GENERAL No. 143, General Tools Manufacturing Co., Inc., New York, U.S.A.); width of cladodes (WC, in cm); length of cladodes (LC, in cm); stem area of harvested young cladodes (SA, in cm2) were measured using a portable leaf-area meter Li-Cor Model Li-3000A (Li-Cor Lincoln, Nebraska, U.S.A.). Average weight (CAW, in g) of harvested young cladodes was calculated using the equation: CAW = total fresh weight of harvested nopalitos divided by the number of harvested nopalitos. Data analysis All statistical analyses were done using univariate and multivariate analysis of variance [ANOVA and MANOVA procedures in SAS (SAS Institute, 1988)]. P ≤ 0.05 was used to define statistical significance. Least-significant differences among means of treatments were compared using the LSD Multiple Range Test at 5% probability.
RESULTS AND DISCUSSION Results of the univariate analysis of variance showed significant differences of all variables between the treatments of the combinations of sources and doses of the commercial fertilizers: NC (p=0.0001), LC (p=0.02), WC (p=0.0001), SA (p=0.001), FW (p=0.0001), DW (p=0.0001), PT (p=0.0001), and CAW (p=0.0004). In this analysis, at least six response variables showed the highest values or were equal statistically to the superior treatment, treatment T4, which corresponds to 240 kg N ha-1, whose source is ammonium nitrate (Table 1). Multivariate analysis of variance showed that the relationship of the possibilities of Wilks’ Lambda was significant at p=0.0001, showing that there were differences among treatments in some response variables, and confirms that the differences found in the univariate analysis are real and positive [that is, no false differences or simply differences that are only random (Johnson, 1998)].
J. PACD – 2005 112

Table 1. Number, length, width, stem area, fresh weight, dry weight, average weight and pad thickness of harvested nopalitos under 13 chemical fertilization treatments
Treatments NC LC WC SA FW DW PT CAW
T1 120 kg N ha-1 (urea) 27.2 d 14.90 bcd 7.10 a 84.4 q 982 cd 37.1 fg 0.572bcde 36.41 cd
T2 120 kg N ha-1 (ammonium nitrate) 34.2 bc 14.85 cd 7.08 ab 83.5 a 1203 b 49.9 b 0.557 def 35.21 de
T3 240 kg N ha-1 (urea) 32.2 c 15.05 abcd 7.0 abcd 83.3 a 1210 b 45.7 c 0.552 ef 37.79 bcd
T4 240 kg N ha-1 (ammonium nitrate) 36.7 ab 15.37 ab 7.05 abc 85.7 a 1381 a 56.2 a 0.557 def 37.79 bcd
T5 100 kg P ha-1 (triple 17)
27.2 d 15.32 abc 7.02 abc 85.1 a 1026 c 43.4 cd 0.550 f 37.72 bcd
T6 100 kg P ha-1 (mono-ammonium
phosphate) 19.7 ef 15.31 abc 6.97 abcd 84.7 a 867 f 40.6 de 0.550 f 44.26 a
T7 200 kg P ha-1 (triple 17) 18.0 f 15.34 ab 6.81 bcd 82.8 ab 789 g 35 g 0.547 f 43.87 a
T8 200 kg P ha-1 (mono-ammonium
phosphate) 22.0 e 15.54 a 6.79 cde 83.9 a 950 cde 39.4 ef 0.562 cdef 43.71 ab
T9 90 kg K ha-1 (NKS) 20.2 ef 15.35 ab 6.73 def 82.1 ab 875 ef 39.7 ef 0.575 bcd 43.56 ab
T10 90 kg K ha-1 (potassium sulfate) 21.7 ef 14.91 bcd 6.52 efg 77.1 bc 948 de 41.5 de 0.580 abc 43.64 ab
T11 180 kg K ha-1 (NKS) 39.5 a 14.92 bcd 6.46 fg 75.7 c 1171 b 49.3 b 0.587 ab 30.1 e
T12 180 kg K ha-1 (potassium sulfate) 21.2 ef 14.84 cd 6.42 g 74.7 c 878 ef 38.8 ef 0.597 a 42.07 abc
T13 control (without fertilizer) 22.2 e 14.81 d 6.50 g 75.4 c 884 ef 36.9 fg 0.592 ab 39.84 abcd
Means in the same column followed by the same letter indicates no significant differences between treatments (LSD p=0.05). NC=number of cladodes, LC=length of cladodes, WC=width of cladodes, SA=stem area of cladodes, FW=fresh weight of cladodes, DW=dry weight of cladodes, PT=pad thickness of cladodes, CAW=cladodes average weight. Also, statistical tests of the possibilities relationship showed that the first three canonical variables were statistically significant with p=0.0001 for CAN1, CAN2, and CAN3, suggesting a three-dimensional alternative space of the eight response variables. It was found that these three canonical variables explain 94.0% of the variability (Table 2) among the means of the response variables under the treatments with different doses and sources of N, P, and K.
Table 2. Proportion of the variance explained by means of canonical variables in the production of harvested nopalitos under different treatments of doses and sources of N, P, and K
Canonical Variable Eigenvalue Difference Proportion Cumulative 1 29.8534 25.3494 0.7629 0.7629 2 4.5041 2.0800 0.1151 0.8780 3 2.4241 1.1430 0.0620 0.9400 4 1.2810 0.5893 0.0327 0.9727 5 0.6917 0.4914 0.0177 0.9904 6 0.2003 0.0659 0.0051 0.9955 7 0.1344 0.0939 0.0034 0.9990 8 0.0405 …. 0.0010 1.0000
J. PACD – 2005 113

Considering the three canonical variables, the raw canonical coefficients were used (Table 3) to get the values for each experimental unit in the space of the three canonical variables and to calculate the means of groups of treatments of the doses and sources of N, P, and K in this canonical space and to represent them graphically. Figure 1 shows that the best treatment, which showed the higher values for the three canonical variables, was treatment T4 [(240 kg N ha-1, ammonium nitrate)], followed by treatment T11 [180 kg K ha-1 (NKS)]. Although, this treatment (T11) did not show high values in CAN3, it did show higher values in the first two canonical variables. The treatments T2, T3, and T1 showed higher values in CAN1. There are clusters between the treatments according to the sources of each fertilizer. For example, treatments with the source of N are located at the extreme right side of the graph (Figure 1), in the central area of the graph are located the rest of the treatments following a cluster for source of the respective mineral (P or K), while treatment T13 (control) was located in the inferior half part of the graph, with the lower values for the three canonical variables. The previous results were evaluated statistically and the confidence of the approximate regions was calculated around the means of the treatments in the canonical space, which showed significant differences among the treatments for the three canonical variables (CAN1: F=89.56, p=0.0001; CAN2: F=13.51, p=0.0001; and CAN3: F=7.27, p=0.0001) whose values show the maximum values of prime “F” that are reached when the linear combinations of the eight response variables are considered in the plants of prickly pear for this experiment. The quadratic errors of the three canonical variables showed values of 1.00, verifying that the three vectors that define the three canonical variables were selected appropriately. The multiple comparisons of means in the canonical variables showed that in the first canonical variable (CAN1) the first four treatments with the higher values were T4, T2, T11, and T3 that, with the exception of treatment T11, all correspond to the fertilizers whose main source is nitrogen, showing that CAN1 is defined for this mineral. Table 3. Raw canonical coefficients showing the proportion of participation by each of the determining variables of production of harvested nopalitos in each of the canonical variables
Variable CAN1 CAN2 CAN3 CAN4 CAN5 CAN6 CAN7 CAN8 NC 0.0907 0.1320 -0.0506 -0.1500 -0.6490 0.5664 -0.2219 -0.2608LC 1.0607 1.3091 0.0567 -3.5559 0.5955 -1.0986 3.3847 -3.6435WC 5.0166 -3.4183 -3.3910 4.5464 -0.6428 -0.2368 5.4684 -10.1844SA -0.2510 -0.0526 0.2376 0.0297 -0.0606 0.2274 -0.3293 0.7078FW 0.0224 -0.0165 -0.0060 -0.0111 0.0209 -0.0107 0.0019 0.0057DW -0.0805 0.5254 0.2428 0.4030 -0.0178 -0.0685 0.0643 0.0274PT 14.9213 17.0314 -54.2942 29.1672 6.8239 37.4194 27.2664 -6.8222CAW -0.1424 0.1262 -0.0101 -0.0531 -0.3259 0.5270 -0.2380 -0.2397
NC=number of cladodes, LC=length of cladodes, WC=width of cladodes, SA=stem area of cladodes, FW=fresh weight of cladodes, DW=dry weight of cladodes, PT=pad thickness of cladodes, CAW=cladodes average weight. For CAN2, the first four treatments with the higher values were T11, T12, T10, and T4, corresponding in their majority to the fertilizers whose main source is potassium, showing that this variable is defined by this mineral. For CAN3, the first four treatments with higher values were T6, T4, T7, and T5, corresponding to the fertilizers whose main source is phosphorus, showing that this canonical variable is defined with this mineral.
J. PACD – 2005 114

T1
T12
T10
T9
T6
T7
T13
T8
T11
T5
T2
T4
T3
N
C
K
P
Figure 1. Graphical representation of the means of different treatments of doses and sources
of N, P, and K in its canonical three-dimensional space. N=nitrogenous, P=phosphorus, K=potassium, and C=control
On the other hand, when the standardized canonical coefficients were considered, response variables FW and WC showed a positive relationship with CAN1. Also, variables NC, LC, and PT were related positively with CAN1, with lower values comparatively with the values that these variables showed with CAN2 (Table 4). Variables SA, DW, and CAW were related negatively with CAN1, estimating that the higher values of FW and WC will be found in treatments T4, T2, T11, and T3 represented (except T11) by the sources of nitrogen and located in the extreme right side of the graph, with higher values in the variable CAN1 (Figure 1). Variables DW, NC, CAW, LC, and PT presented positive relationship with CAN2 and showed higher values comparatively with CAN1 and CAN3 but WC, SA, and FW were related negatively with CAN2 (Table 4). With these results, it is possible to estimate that the higher values of these variables (DW, NC, CAW, LC, and PT) will be found in treatments T11, T12, T10, and T4, where the main fertilization
J. PACD – 2005 115

source is potassium (except T4), are located in the center of the graph in the three-dimensional space (Figure 1). Variables SA and DW were related positively with CAN3. The value of the relationship of DW with CAN3 is lower than shown by this variable with CAN2, estimating that DW will have higher values in treatments T6, T4, T7, and T5, defined in its majority by the treatments where the main fertilization source is phosphorus.
Table 4. Standardized canonical coefficients that show the relationship of the determining variables of production of harvested nopalitos to each canonical variable
Variable CAN1 CAN2 CAN3 CAN4 CAN5 CAN6 CAN7 CAN8
NC 0.6655 0.9686 -0.3718 -1.1007 -4.7621 4.1560 -1.6282 -1.9138 LC 0.4705 0.5807 0.0252 -1.5773 0.2642 -0.4873 1.5014 -1.6162 WC 1.5276 -1.0409 -1.0326 1.3844 -0.1957 -0.0721 1.6652 -3.1012 SA -1.3588 -0.2847 1.2860 0.1612 -0.3284 1.2311 -1.7822 3.8307 FW 3.9652 -2.9337 -1.0688 -1.9779 3.7149 -1.9037 0.3512 1.0183 DW -0.5173 3.3763 1.5606 2.5897 -0.1143 -0.4401 0.4134 0.1764 PT 0.3599 0.4108 -1.3095 0.7035 0.1646 0.9025 0.6576 -0.1645
CAW -0.7866 0.6972 -0.0562 -0.2933 -1.7997 2.9102 -1.3145 -1.3237 NC=number of cladodes, LC=length of cladodes, WC=width of cladodes, SA=stem area of cladodes, FW=fresh weight of cladodes, DW=dry weight of cladodes, PT=pad thickness of cladodes, CAW=cladodes average weight.
Table 5. Correlation analysis between the determining original response variables of the production of harvested nopalitos and the three main canonical variables
Variable
NC LC WC SA FW DW PT CAW CAN1 CAN2 CAN3
NC 1.00 -0.18 NS -0.21 NS -0.15 NS -0.09 NS 0.02 NS 0.07 NS .0.82 * 0.96* 0.11 NS -0.06 NS LC 1.00 0.64* 0.85* -0.07 NS 0.12 NS 0.10 NS 0.09 NS -0.17 NS -0.02 NS 0.81*WC 1.00 0.88* 0.05 NS 0.18 NS -0.24 NS 0.14 NS 0.39 NS -0.66 * 0.53 NS SA 1.00 0.04 NS 0.16 NS 0.06 NS 0.07 NS 0.23NS -0.55 * 0.73*FW 1.00 0.74* -0.22 NS 0.53 * 0.98* 0.07 NS 0.11NS DW 1.00 -0.24 NS 0.32* 0.89* 0.34 NS 0.26 NS PT 1.00 -0.23 NS -0.15 NS 0.45 NS -0.85*
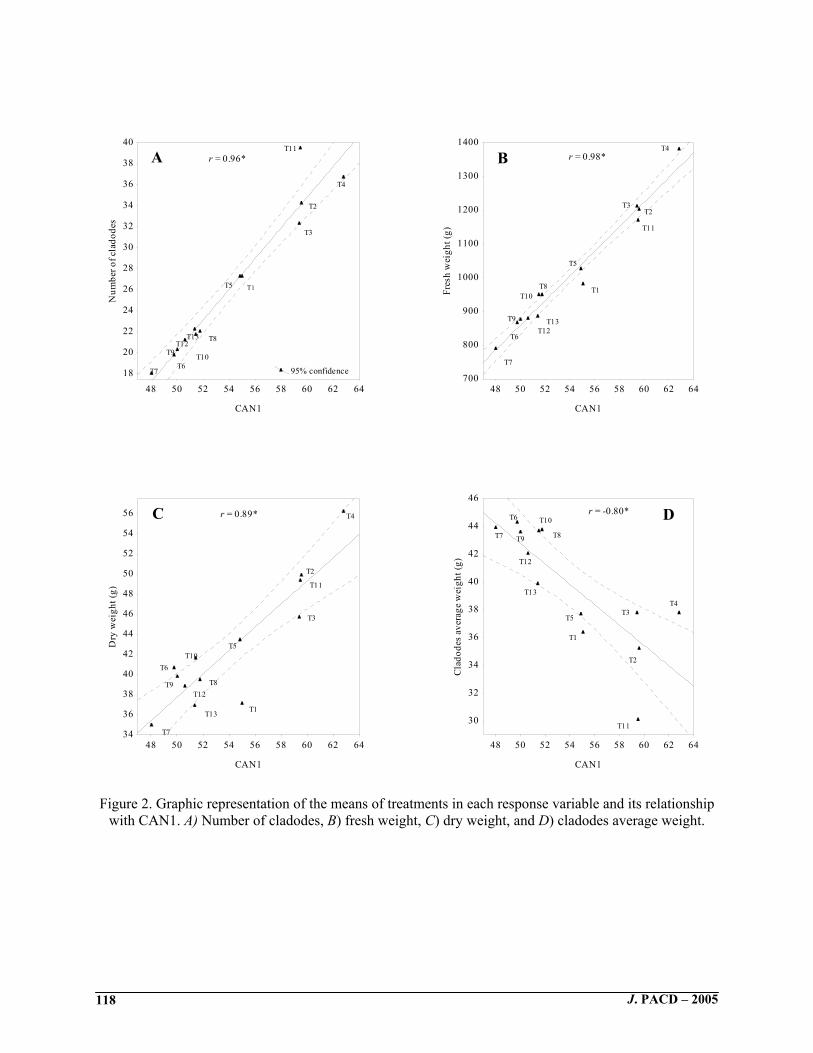
CAW 1.00 -0.80* -0.002NS 0.32 NS * Significant differences (p<0.05) and NS=Non significant differences (p>0.05). NC=number of cladodes, LC=length of cladodes, WC=width of cladodes, SA=stem area, FW=fresh weight, DW=dry weight, PT=pad thickness, CAW=cladodes average weight. Results of the correlations among the means of the treatments and CAN1 showed that response variables NC, FW, DW, and CAW were correlated significantly with CAN1, with absolute values ranging from 0.80 to 0.98, where variable CAW showed a negative correlation (-0.80) (Table 5). A linear trend was observed (Figure 2) among all the significant variables with CAN1, where the strongest relationship was shown in the response variables whose means were significantly different (NC, FW, and DW). However, CAW showed significant differences, but these were not so contrasting (Table 1) and, considering the standardized canonical coefficients, this variable was related with CAN2. On the other hand, treatments T4, T2, T11, and T3, seemed to be suspended together in each of the response variables, being located to the extreme superior right side of the graph in those correlated positively, while with CAW they are located in the inferior right side of the graph. Treatments T7 and the rest of the treatments are located in the extreme left side of the graphs. Treatments in which the main
J. PACD – 2005 116
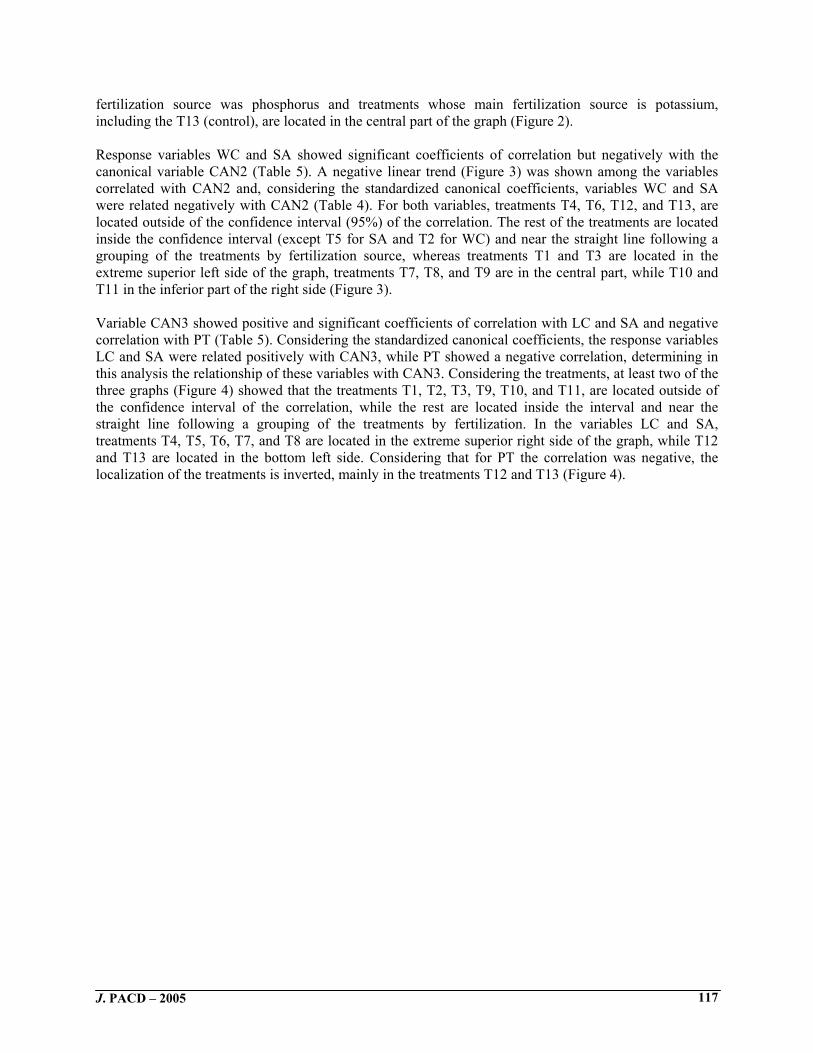
fertilization source was phosphorus and treatments whose main fertilization source is potassium, including the T13 (control), are located in the central part of the graph (Figure 2). Response variables WC and SA showed significant coefficients of correlation but negatively with the canonical variable CAN2 (Table 5). A negative linear trend (Figure 3) was shown among the variables correlated with CAN2 and, considering the standardized canonical coefficients, variables WC and SA were related negatively with CAN2 (Table 4). For both variables, treatments T4, T6, T12, and T13, are located outside of the confidence interval (95%) of the correlation. The rest of the treatments are located inside the confidence interval (except T5 for SA and T2 for WC) and near the straight line following a grouping of the treatments by fertilization source, whereas treatments T1 and T3 are located in the extreme superior left side of the graph, treatments T7, T8, and T9 are in the central part, while T10 and T11 in the inferior part of the right side (Figure 3). Variable CAN3 showed positive and significant coefficients of correlation with LC and SA and negative correlation with PT (Table 5). Considering the standardized canonical coefficients, the response variables LC and SA were related positively with CAN3, while PT showed a negative correlation, determining in this analysis the relationship of these variables with CAN3. Considering the treatments, at least two of the three graphs (Figure 4) showed that the treatments T1, T2, T3, T9, T10, and T11, are located outside of the confidence interval of the correlation, while the rest are located inside the interval and near the straight line following a grouping of the treatments by fertilization. In the variables LC and SA, treatments T4, T5, T6, T7, and T8 are located in the extreme superior right side of the graph, while T12 and T13 are located in the bottom left side. Considering that for PT the correlation was negative, the localization of the treatments is inverted, mainly in the treatments T12 and T13 (Figure 4).
J. PACD – 2005 117
48 50 52 54 56 58 60 62 64
CAN1
18
20
22
24
26
28
30
32
34
36
38
40
Num
ber o
f cla
dode
s
48 50 52 54 56 58 60 62 64
CAN1
700
800
900
1000
1100
1200
1300
1400
Fres
h w
eigh
t (g)
48 50 52 54 56 58 60 62 64
CAN1
34
36
38
40
42
44
46
48
50
52
54
56
Dry
wei
ght (
g)
48 50 52 54 56 58 60 62 64
CAN1
30
32
34
36
38
40
42
44
46
Cla
dode
s av
erag
e w
eigh
t (g)
95% confidence
r = 0.96*
T1
T13T12
T11
T10T9
T8
T7T6
T5
T4
T3
T2
r = 0.98*
T1
T13T12
T11
T10
T9
T8
T7
T6
T5
T4
T3T2
r = 0.89*
T1T13
T12
T11
T10
T9 T8
T7
T6
T5
T4
T3
T2
r = -0.80*
T1
T13
T12
T11
T10
T9 T8T7
T6
T5
T4T3
T2
A
DC
B
Figure 2. Graphic representation of the means of treatments in each response variable and its relationship with CAN1. A) Number of cladodes, B) fresh weight, C) dry weight, and D) cladodes average weight.
J. PACD – 2005 118

12 13 14 15 16 17 18 19 20
CAN2
74
76
78
80
82
84
86
88
Stem
are
a of
cla
dode
s (cm
2 )
11 12 13 14 15 16 17 18 19 20
CAN2
6.3
6.4
6.5
6.6
6.7
6.8
6.9
7.0
7.1
7.2
7.3
Wid
th o
f cla
dode
s (cm
)
r = -0.55*
T1
T13T12
T11
T10
T9
T8
T7
T6T5T4
T3 T2
r = -0.66*
T1
T13
T12T11
T10
T9T8
T7
T6T5
T4
T3
T2
95% confidence
A
B
Figure 3. Graphic representation of the means of treatments in each response variable and its relationship
with CAN2. A) Stem area of cladodes and B) width of cladodes
J. PACD – 2005 119

-33.5 -33.0 -32.5 -32.0 -31.5 -31.0 -30.5 -30.0 -29.5 -29.0
CAN3
14.7
14.8
14.9
15.0
15.1
15.2
15.3
15.4
15.5
15.6L
engt
h of
cla
dode
s (c
m)
-33.5 -33.0 -32.5 -32.0 -31.5 -31.0 -30.5 -30.0 -29.5 -29.0
CAN3
74
76
78
80
82
84
86
Stem
are
a (c
m2 )
-33.5 -33.0 -32.5 -32.0 -31.5 -31.0 -30.5 -30.0 -29.5 -29.0
CAN3
0.54
0.55
0.56
0.57
0.58
0.59
0.60
Pad
thic
knes
s (c
m)
r = 0.81*
T1
T13
T12
T11 T10
T9
T8
T7 T6T5
T4
T3
T2
r = 0.73*T1
T13
T12
T11
T10
T9
T8
T7
T6
T5T4
T3 T2
r = -0.85*
T1
T13T12 T11
T10
T9
T8
T7T6T5
T4T3 T2
A
C
B
Figure 4. Graphic representation of the means of treatments in each response variable
and its relationship with CAN3. A) Length of cladodes, B) stem area, and C) pad thickness
J. PACD – 2005 120

In general, results demonstrate that the response variables showed higher values in treatments in which the main fertilization source is nitrogen, whereas treatment T4 showed the higher values in the three canonical variables, with a high relationship with CAN1 than with the other canonical variables. The source of nitrogen of this treatment was ammonium nitrate, which has demonstrated that it is one of the sources of nitrogen that contributes more quickly and, therefore, has an important effect on production (Teucher and Adler, 1981). It is important to consider that ammonium nitrate has faster solubility, giving almost immediately the required nitrogen and has better availability of nitrate compared with other fertilizers. On the other hand, Jara et al. (1981) demonstrated that the physical state and the presentation form of fertilizers with nitrogen have a great influence on the response of the soils and the plants. Also, Gordon and Barden (1979) showed that the water potential decreases with a deficiency of nitrogen, causing the water to be more restrictive for the plant, which leads to toxicity, economical losses, and degradation of the soils, which affects crop yield. Nitrogen is also the most important required element for the plants because it is a structural constituent of components of the cell (cellular wall), as well as nonstructural components (enzyme, chlorophyll, and nucleic acids). Inorganic nitrogen is absorbed by the plants in the form of NO3
-, although in some circumstances ions of NH4+can be assimilated. The
abundance and mobility of the nitrate ion has a very important position in the normal metabolism of the superior plants, being the higher nutrient in most soils as a nitrogen form and frequently it is the main limiting factor in plant growth. Also, nitrogen limits strongly the productivity of the plants. Therefore, any improvement in the absorbed efficiency of NO3
-, can produce higher protein content and high yields (Gallegos-Vázquez, 1999). Other positive responses to the application of fertilizers with nitrogen are shown in terms of the number of harvested cladodes and new buds in Opuntia engelmannii (Nobel et al., 1987) and O. ficus-indica Esmeralda cv. (Mondragón and Pimienta, 1990), production of floral buds in O. ficus-indica (Nerd et al., 1991; Nerd and Mizrahi, 1992), and total dry matter in Opuntia engelmannii and Opuntia rastrera (Nobel et al., 1987). Fertilization with inorganic products that contain nitrates or cow manure increases the growth of agaves and cacti (Nobel, 1998). However, caution should be exercised regarding nitrogen fertilization because prickly pear nopal has the particularity to absorb and to accumulate nitrates easily in its nopalitos. Therefore, rooted cladodes can have toxic levels of nitrates for people and animals that consume them (Valdez-Cepeda and Blanco-Macías, 2002). As for the treatments whose main fertilization source was potassium, the majority showed higher values in CAN2, where treatment T11 showed higher values in CAN1 but in CAN3 showed the lower values. In this sense, the results seem to indicate that the applications in the doses and sources of potassium do not represent a favorable effect on the response variables of prickly pear. The results are in agreement with Méndez (1990) who demonstrated that no positive effect exists in prickly pear when applying potassium. Also, Nerd and Mizrahi (1992) reported that applying phosphorus and potassium to plants of O. ficus-indica did not significantly affect production of floral buds. However, in another experiment under drought conditions results showed a positive response of floral buds with N, P, and K fertilization (Nerd et al., 1991). For the treatments whose main fertilization source was phosphorus, results showed that these were most closely associated with canonical variable CAN3, where the higher values were obtained, although, practically, the effect of this element was not significant as those shown in treatments based on nitrogen. In this sense and according to other studies in arid areas, it should be considered that in calcareous and saline soils the fertilization with phosphorus should be eliminated or reduced and the same recommendation should be followed for nitrogen fertilizers with a high saline residual (Aquino and Barcenas, 1999).
J. PACD – 2005 121

Considering that prickly pear is a species with a high interaction with environmental conditions, absorption of nutrients and vegetative growth will be a function of the genotype. It is convenient to consider that the nutritional requirements of the prickly pear depend on the purpose of the production (forage, nopalitos, or cactus-pear fruits), the variety and the species. Then, it is important to considerer the variations of the soil in the capacity to satisfy the nutritional demand of the plants. In the same way, we have to considerer the purpose of production to generate the recommendation of the particular fertilization for each soil, reducing the risk of over-fertilizing or under-fertilizing. Also, it is necessary to define the need for fertilization based on the chemical composition of the young harvested cladodes of different ages because fertilization must change according the production system. For example, for prickly-pear fruit (tuna) production the nitrogen requirement is lower than for that of harvested nopalitos or cladodes for propagation and animal consumption (Valdez-Cepeda and Blanco-Macias, 2002). Because of the great number of positive and negative interactions between nutrients and several interactions between yield and several nutrients, these topics should be studied in order to have a better understanding of the nutrient roles (Valdez-Cepeda et al., 2004). Studies on relations between nutrients and quality parameters also are needed, as Galizzi et al (2004) did, because quality of the product determines success in modern markets.
CONCLUSIONS Based on the use of multivariate analysis of variance, we conclude that it is possible to resume and to corroborate our results using this methodology. Although this study is not conclusive, it is a good exploratory method to design the next experiments in the field under the environmental conditions of Baja California Sur, using combinations of N, P, K, and different doses of commercial fertilizer in nopal production.
ACKNOWLEDGEMENTS
We would like to thank to Dr. Peter Felker (Editor of JPACD) and two anonymous reviewers for their kind and helpful suggestions to greatly improve an early version of the manuscript. This research was supported by three grants: ZA1 from the Programa de Agricultura de Zonas Áridas del Centro de Investigaciones Biológicas del Noroeste (CIBNOR), 042S from the Sistema de Investigación del Mar de Cortés; and 2442 from Fundación Produce Baja California Sur, A.C. The authors gratefully acknowledge the assistance of James Moss for editing the English-language text.
J. PACD – 2005 122

REFERENCES Aguilar, Z.A.A. 1999. Generación, validación y transferencia de tecnología del componente riego y fertilización para adelantar la floración del nopal tunero en el Estado de Hidalgo. En: Aguirre, R. y Reyes A.J.A. (Editores). Memoria. VIII Congreso Nacional y VI Internacional sobre el conocimiento y aprovechamiento de nopal. Universidad Autónoma de San Luis Potosí, S. L. P. México. p. 48-49. Aquino, P.G., Barcenas, O.N.M. 1999. Cría de cochinilla para la producción de grana y sus posibilidades de resurgimiento en México. En: Aguirre, R. J. R. y Reyes, A. J. A. (Editores).Memoria. VIII Congreso Nacional y VI Internacional sobre el conocimiento y aprovechamiento de nopal. Universidad Autónoma de San Luis Potosí, S. L. P. México. p. 288. Etchevers B., J.D., J. Rodríguez S. Y A. Galvis S. 1991. Generación de Recomendaciones de fertilización mediante un enfoque sistémico racional. TERRA: 9(1):3-10. Galizzi, F.A., Felker, P., González, C., Gardiner, D. 2004. Correlations between soil and cladode nutrient concentrations and fruit yield and quality in cactus pears, Opuntia ficus-indica in a traditional farm setting in Argentina. Journal of Arid Environments. 59:115-132. Gallegos-Vázquez, C. 1999. Estado del conocimiento sobre metabolismo del nitrógeno en nopal. En: Aguirre, R.J.R. y Reyes, A.J.A. (Editores). Memoria. VIII Congreso Nacional y VI Internacional sobre el conocimiento y aprovechamiento de nopal. Universidad Autónoma de San Luis Potosí. S. L. P. México. p. 173, 183. González, C.L., Everitt, J.H. 1990. Fertilizer effects on the quality and production of prickly pear cactus and its wildlife value. In: Proc. First Annual Texas Prickly Pear Council. Kingsville, TX. pp. 3-13. Goos, R.J., Schimelfenig, J.A., Bock, B.R., Johnson, B.E. 1999. Response of spring wheat to nitrogen fertilizers of different nitrification rates. Agron. J. 91:287-293. Gordon H.R., Barden J.A. 1979. Horticulture. Mcgraw-Hill College Edit. 722 pp. Jara, F. R. R., Meléndez G., Martínez H. J.J. 1981. Efecto de las fuentes y dosis de fertilización sólida y fluida en la producción de maíz, bajo condiciones de temporal. En: Resumen XIV Congreso Nacional de la Ciencia del Suelo. Sociedad Mexicana de la Ciencia del Suelo. San Luis Potosí, S. L. P., México. Johnson, D.E. 1998. Métodos multivariados aplicados al análisis de datos. Thomson Ed. 566 pp. Marriott, F.H.C. 1974. The interpretation of multiple observations. Fellow of Wolfson College, Oxford. Academic Press Inc. Letchworth, Hertfordshire, United Kingdom. 117 p. Méndez, G. 1990. Efecto de la fertilización química y orgánica en tres formas de nopal (Opuntia spp.) sobre el rendimiento, en una plantación comercial de Ojocaliente, Zacatecas. Memorias, 1a. Reunión internacional sobre el Nopal su conocimiento y aprovechamiento. Edit. Univ. Aut. Agraria “Antonio Narro”. Buenavista Saltillo, Coahuila, México. pp. 207-213. Mondragón, C., Pimienta E. 1990. Corrección del amarillamiento del nopal tunero: una posible deficiencia nutrimental. In: memorias del IV Congreso Nacional y II Congreso Internacional sobre el conocimiento y aprovechamiento del nopal. Zacatecas, Zacatecas, México. pp. 26-27. Nerd, A., Mizrahi, Y. 1992. Effects of fertilization on prickly pear production in Israel. In: Proc. 3rd Annual Texas Prickly Pear Council. Kingsville, Texas. pp. 1-4.
J. PACD – 2005 123

Nerd, A., Karady, A, Mizrahi, Y. 1991. Out-of-season prickly pear: fruit characteristics and effect of fertilization and short droughts on productivity. Hort Science 26 (5): 527-529. Nobel, P.S., Russell, E. Ch., P. Felker, P., Galo, J., Acuña E. 1987. Nutrient relations and productivity of prickly pear cacti. Agron. J. 79(3): 550-555. Nobel, P.S.1998. Los incomparables agaves y cactos. 1era Edición. Edit. Trillas, S.A. de C.V., México, D.F. p. 111,112. Rojas-Martínez, B.A. 1981. Planeación y análisis de los experimentos de fertilizantes. SARH-INIA. Folleto Misceláneo No. 41. México, D.F. 45 p. SAS Institute Inc. 1998. SAS for Windows. Release 6.12. Version 4. Cary, N.C. Seber, G.A.F. 1984. Multivariate observations. J. Wiley. New York. 686 p. Teuscher, H. Adler, R. 1981. El suelo y su fertilidad. Ed. CECSA. México. Valdez-Cepeda, R., Blanco-Macías, F. 2002. Fertilización-nutrición en nopal. En: Murillo-Amador, B. y Troyo-Diéguez, E. (Editores). Actualización en el manejo del cultivo del nopal. Segundo taller de divulgación y actualización sobre nuevos cultivos para zonas semiáridas. Centro de Investigaciones Biológicas del Noroeste, S.C. La Paz, B.C.S. México. p. 6-14. Valdez-Cepeda, R., Blanco-Macías, F., Murillo-Amador, B., García-Hernández, J.L., Magallanes-Quintanar, R., Macías-Rodríguez, F.J. 2004. Advances in cultivated nopal (Opuntia spp.) nutrition. In: Esparza-Frausto, G., Valdez-Cepeda, R., Méndez-Gallegos, S.J. (Editores). El Nopal, tópicos de actualidad. Edit. Universidad Autónoma Chapingo (Centro Regional Universitario Centro Norte), Colegio de Postgraduados (Campus San Luis Potosí). México. P. 155-166. Varela-Nualles, M. 1998. Análisis multivariado de datos. Aplicación a las ciencias agrícolas. Instituto Nacional de Ciencias Agrícolas (INCA). La Habana, Cuba. 55 p. Zar, J.H. 1999. Biostatistical analysis. Fourth edition. Prentice-Hall, Inc. New Jersey 07458, USA. 312-323.
J. PACD – 2005 124