a n n u a l · 2018-04-02 · hamad bin abdulla bin khalifa al-thani chairman the compound annual...
TRANSCRIPT

REPORT
2017
MANNAI
CORPORATION Q.P.S.C.
ANNUAL
Your Trusted Partner

His Highness The Father EmirSheikh Hamad Bin Khalifa Al-Thani
His Highness The Emir Sheikh Tamim Bin Hamad Al-Thani

45
46
52
54
55
56
58
60
4
6
7
8
10
12
14
16
18
20
22
Consolidated Financial Statements
Independent Auditor’s Report
Consolidated Statement of Financial Position
Consolidated Statement of Profit or Loss
Consolidated Statement of Profit or Loss and
Other Comprehensive Income
Consolidated Statement of Changes in Equity
Consolidated Statement of Cash Flows
Notes to the Consolidated Financial Statements
Mannai Group
Chairman’s Report
Director and Group Chief Executive Officer’s Report
Vision and Mission
Financial Highlights
Board of Directors
Executive Committee
Awards Received by Mannai Corporation
The Mannai Way
Corporate Governance
Business Review 2017

Auto Group » Automotive Group, Qatar » Heavy Equipment Group, Qatar » GTC Automotiv AS, Turkey
Information Technology » Information and Communication
Technology, Qatar » Gfi Informatique, Europe,
Latin America » Gfi Informatique Pvt. Ltd., India » NYX Bilisim Teknolojileri AS, Turkey
Jewellery » Damas International LLC, UAE & GCC
Other Business » Gulf Laboratories WLL » Travel Group » Energy & Industrial Markets » Manweir LLC » Qatar Logistics WLL » Home Appliances and Electronics
Division
Joint Venture / Associate Companies » Cofely Besix Mannai Facility
Management LLC » Axiom Telecom, UAE
Mannai Group
Auto Group
Information Technology
Jewellery
Other Business
Joint Venture / Associate Companies
4 Mannai Corporation Q.P.S.C

Chairman’sReport
2017 proved to be a challenging year for business conditions in the Gulf and this is the first time since Mannai Corporation listed on the Qatar Exchange in 2007 that the Company is reporting a slight dip in Net Profit compared with the previous year, although the Group Net Profit before Tax increased by 3% compared to the previous year.
The economic climate was particularly tough for our retail businesses ( B2C ) due to subdued consumer sentiment in the GCC. Our Business to Business ( B2B ) segment revenues were down slightly year on year , except in our ICT businesses where I am pleased to say that our expanding ICT services delivered a strong and healthy performance.
Overall the Net Profit of the Mannai Group in 2017 of QR 506 Million was 5 percent below the QR 535 Million achieved in 2016.
To put the 2017 performance in a broader context the Compound Annual Growth Rate of Mannai’s Net Profits since listing in 2007, including 2017, has been an average of 18% per annum, which has enabled the Board to declare dividends to its shareholders amounting to QR 1.90 Billion over that period.
The foundation for our long term growth record stems from the remarkable development of the economy in Qatar over that time, thanks to the inspired leadership in Qatar, and the sound and stable business environment that has been established, which continues today, even in the face of recent challenges.
Taking a medium term view the Board has recommended maintaining the dividend at 40 percent in respect of 2017, being QR 4 per share, the same level as the previous year.
I would like to express my appreciation to the managers and staff throughout the Group for their support and personal contributions to our business.
In July 2017 Mannai increased its shareholding in Gfi Informatique from 51 percent to 81 percent, and it is now consolidated in Mannai Corporation’s 2017 balance sheet. This consolidation is also reflected in Group revenue increasing from QR 4.9 Billion to QR 7.04 Billion in 2017.
Gfi Informatique is a Public Company listed in France, operating mainly in Europe and North Africa.
The combined revenues of our ICT businesses, Mannai in Qatar and Gfi in Europe delivered significant growth. In terms of scale, Mannai has 1140 employees in ICT, in Qatar and India, and Gfi has 14,800 ICT employees throughout its international network, giving the Mannai Group a powerful and growing presence in the ICT sector both regionally and internationally.
The Board considers technology and innovation has high growth potential. Accordingly, we propose to continue to develop our ICT business as opportunities arise.
I have commented in the past that the diversification of Mannai’s business in terms of products, services and geographic spread has underpinned its strength and this policy will continue.
Regionally, the introduction of a 5 percent Value Added Tax (VAT) in the UAE and Saudi Arabia in January 2018 may have a bearing on consumer demand in these countries in the near term and later in other GCC markets as VAT is more widely implemented.
However, the more positive outlook for energy prices together with the fiscal actions being taken in the Gulf to balance State budgets should, in time, produce an economic climate good for both business, and consumer confidence.
Internationally, our ICT business in Gfi should benefit from the improving economic outlook in Europe, including the business-friendly policies being introduced by the Macron government in France.
I remain confident that the diversity of our business will be an enduring strength of Mannai which will continue to support the Group’s growth and development going forward and throughout the economic cycle.
Hamad Bin Abdulla Bin Khalifa Al-Thani Chairman
The Compound Annual Growth Rate of Mannai’s Net Profits since listing in 2007, including 2017, has been an average of 18% per annum, which has enabled the Board to declare dividends to its shareholders amounting to QR 1.90 Billion over that period.
6 Mannai Corporation Q.P.S.C
Director and Group Chief Executive Officer’s Report
Our strength, as a conglomerate which is geographically diversified, is a testimony to our resilient business model.
In what proved to be a most challenging year for the region and Qatar in particular, Mannai under the circumstances had an impressive year declaring a net profit of QR 506 Million. Our strength, as a conglomerate which is geographically diversified, is a testimony to our resilient business model.
We increased our shareholding in Gfi Informatique to 81.21% and consolidated its results from July 2017 which helped balance the decline in earnings from our other businesses. Gfi had another year of excellent growth in net profit of €37.3 million representing a 16.2% increase over the previous year. Gfi successfully integrated the international operations of both Roff (Portugal) and Efron (Spain) acquired at the end of 2016. Gfi’s revenue for the year was €1.1 billion, up by 11.5% compared with the previous year. Gfi will continue to expand its international presence in 2018.
The ICT business under new leadership delivered a record breaking performance and further consolidated its position as Qatar’s leading systems integrator that has built its reputation on service, trust and quality. The business is ideally positioned to provide the highest quality solutions to its customers throughout the entire technology stack.
Our other Qatar based businesses were impacted by the boycott of the country by its neighbours. This initially caused supply chain issues for our Auto business and other businesses, which had suppliers and manufacturers based in the boycotting countries. Net profit further declined compared to previous years due to the lack of new infrastructure projects being released as well as low consumer confidence as businesses in the country were downsizing.
During the year Qatar Logistics opened a warehouse facility of more than 20,000 sq. m of rentable storage to handle the growing requirements of our clients. Gulf Laboratories relocated to a brand new facility and increased their physical, chemical, oil, environmental testing laboratory capacity while expanding their testing services offerings.
Internationally, Damas had a challenging year as the economic climate coupled with low consumer sentiment in the GCC resulted in a further decline in net profit. The company has taken out significant costs from their business model including closing unviable stores. Damas is in the process of realigning its design and product portfolio to cater to the changing needs of its client base. These initiatives will ensure more robust earnings in the years to come.
Our associate company Axiom telecom where Mannai has a minority stake has started improving its performance having restructured its business last year. It is on track to continue to grow its profitability in the coming years.
PERFORMANCE
The Group performance:• Group Turnover: QR 7.04 Billion• EBITDA for the year: QR 850 Million• Pre tax Profit: QR 553 Million• Return on Equity is 18%• Earnings Per Share: QR 11.09
DIVERSITY OF BUSINESS
Mannai Corporation is a conglomerate operating within a single set of values that we call the "Mannai Way." We work with an array of leading globally recognised brands and international partners.
Our diverse range of trading, retail and service businesses deal with customers in the Oil & Gas industry, the Commercial and Government sector and through Gfi with a range of blue chip corporates in continental Europe, as well as retail clients’ throughout the GCC and Turkey. We aim to continue to provide a platform for future profitable growth, listening and responding to the changing needs of our customers and clients while staying true to our core values of quality, value, service and trust.
AWARDS
We sincerely appreciate the recognition accorded to us by our multinational principals for our on- going commitment to Service and Quality, which are listed later in this report.
FUTURE OUTLOOK
The near term economic outlook remains challenging however, the increase in energy prices should translate into a positive economic climate for businesses and improve consumer confidence in the GCC. We remain committed to taking advantage of every opportunity available to us as we continue to build our business for profitable growth over the long term.
Alekh GrewalDirector & Group Chief Executive Officer
7Annual Report 2017

OUR VISION
OUR MISSION
Through exceptional service and added value, build Mannai to be the most dependable business partner in the region.
To create an environment which will attract and retain a committed team of talented professionals who will place Mannai at the forefront in our chosen markets.
8 Mannai Corporation Q.P.S.C

9Annual Report 2017

Financial Highlights
Total Revenue QR Billions
2007 2011 2017
1.58
9.73
43.90
Total AssetsQR Billions
2007 2011 2017
1.01
2.89
11.70
Total Cash DividendsQR Millions
2007 2011 2017
48
568
1,902
Total Net ProfitQR Millions
2007 2011 2017
101
941
3,887
Financial Highlights since listing
REVENUE
QR
Bill
ion
7.04
NET PROFIT
QR
Mill
ion
506EBITDA
QR
Mill
ion
850
EARNINGS
PER SHAREQ
R 11.09
10 Mannai Corporation Q.P.S.C

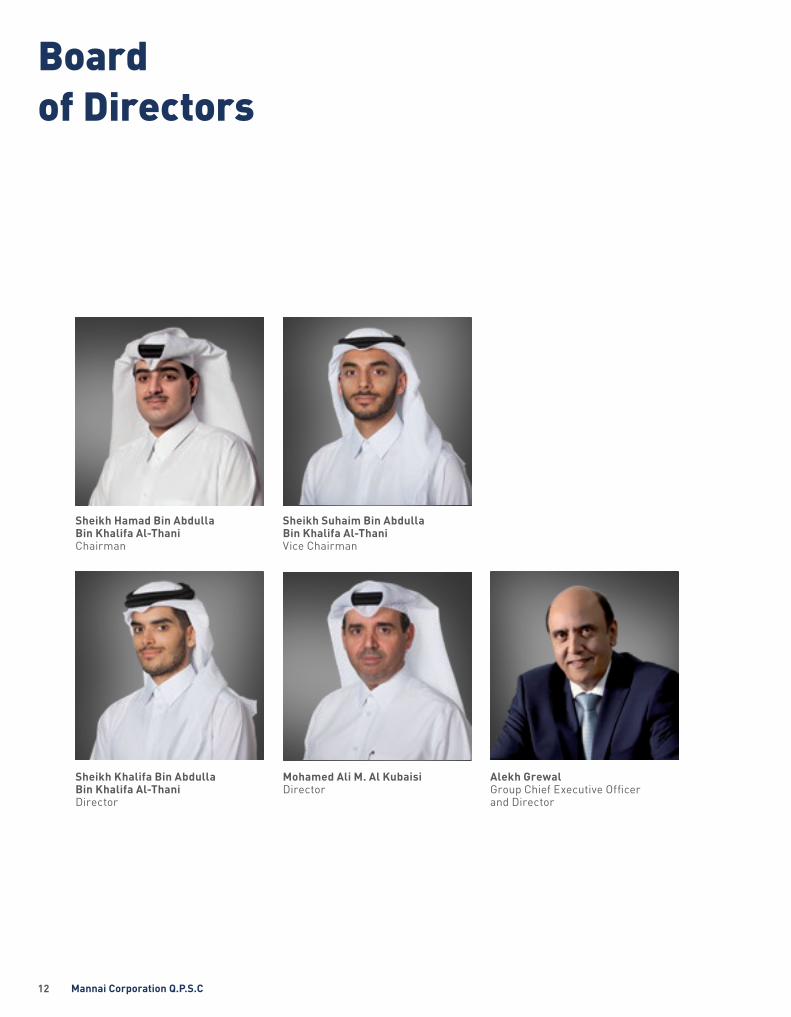
Boardof Directors
Alekh Grewal Group Chief Executive Officerand Director
Sheikh Hamad Bin Abdulla Bin Khalifa Al-ThaniChairman
Mohamed Ali M. Al Kubaisi Director
Sheikh Suhaim Bin Abdulla Bin Khalifa Al-Thani Vice Chairman
Sheikh Khalifa Bin Abdulla Bin Khalifa Al-ThaniDirector
12 Mannai Corporation Q.P.S.C
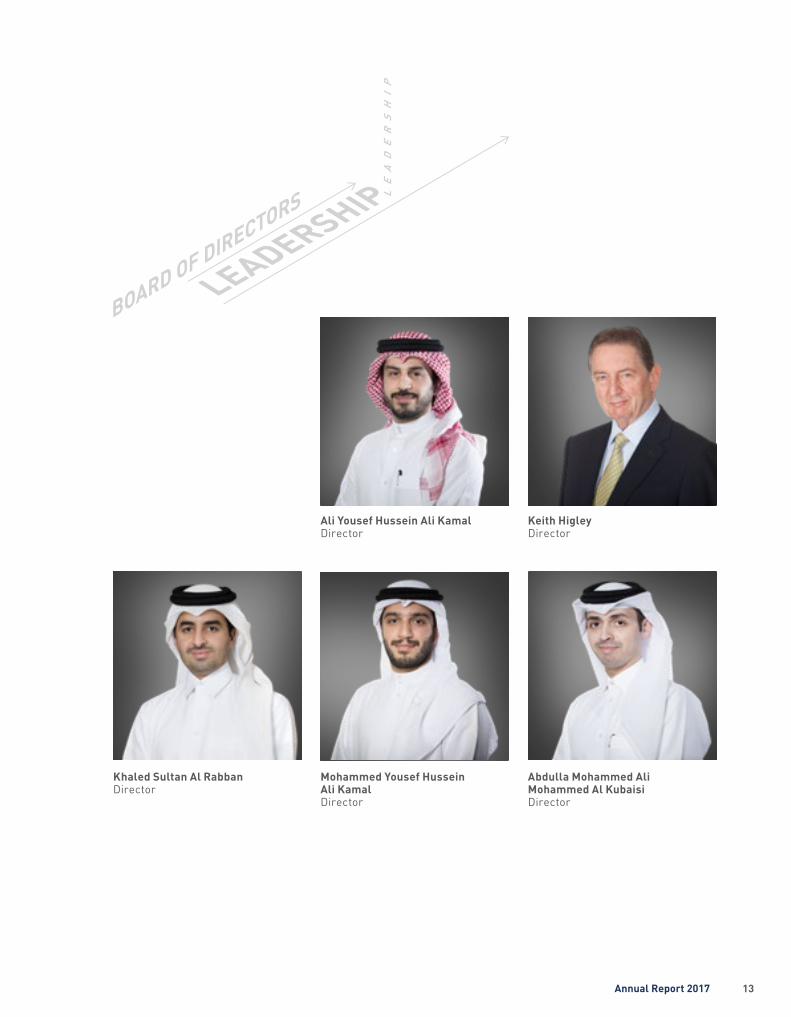
Khaled Sultan Al Rabban Director
Abdulla Mohammed AliMohammed Al Kubaisi Director
Keith Higley Director
Ali Yousef Hussein Ali Kamal Director
Mohammed Yousef HusseinAli Kamal Director
13Annual Report 2017

Khalid MannaiVice Chairman of the Executive Committee
Mohamed HelmyGroup General Manager,Automotive
Alekh GrewalGroup Chief ExecutiveOfficer and Director
Sheikh Suhaim Bin Abdulla Bin Khalifa Al-Thani Chairman of the Executive Committee
ExecutiveCommittee
14 Mannai Corporation Q.P.S.C
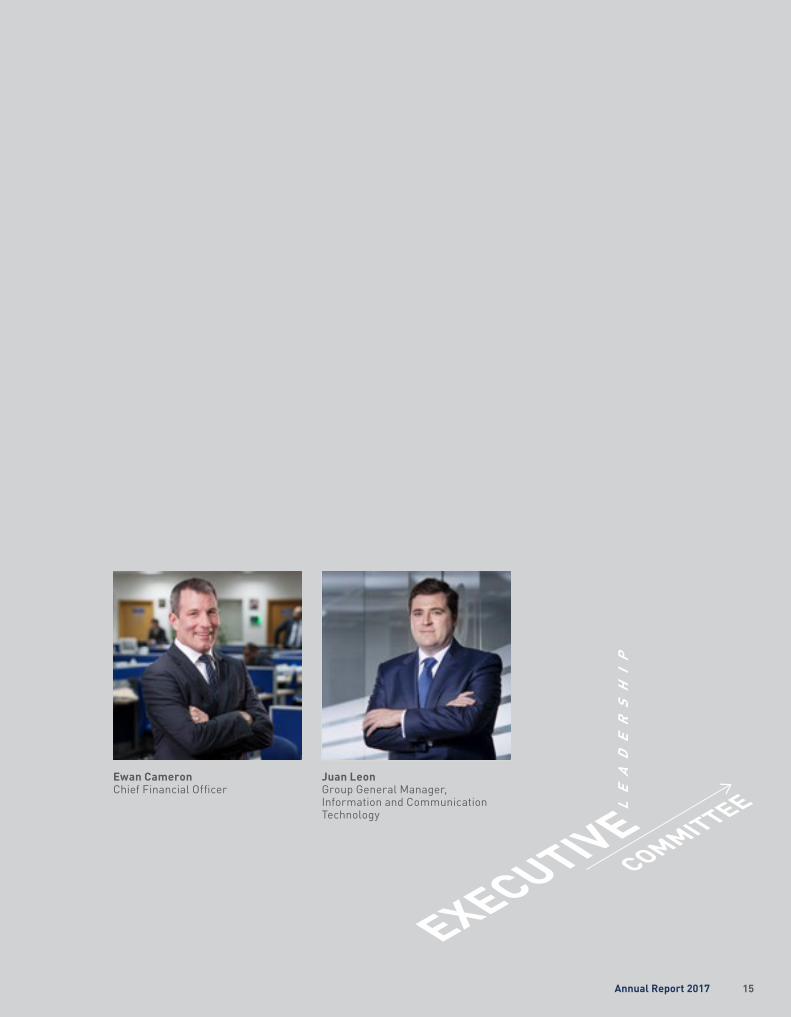
Ewan CameronChief Financial Officer
Juan LeonGroup General Manager,Information and Communication Technology
15Annual Report 2017

Awardsreceived in 2017Auto Group
• 2017 Cadillac Grandmaster Award
• Mannai Automotive was awarded with 64 year Service Award, as a General Motors Dealer in Qatar
• Mannai Aftersales achieved the first and second places in Q1 2017 in the “Service and Parts Excellence Program” under Parts Manager & Service Manager categories respectively (for Qatar, Kuwait and UAE League)
• Auto Parts secured the first place for “Retail Parts Consultant” category
• Heavy Equipment Division won the annual Gold Award for being the top Chevron distributor in the Gulf and Middle East for the third year in a row
• Heavy Equipment Division won Grove Elite Dealer in (Middle East and Africa) for five consecutive years in a row
• Heavy Equipment Division achieves “Bronze Level Certification” for Thermoking for outstanding knowledge and customer support
Information & Communication Technology Group
• HP Reseller of the Year Award 2017 - GCC, Egypt, Jordan & Levant
• Cisco Middle East Enterprise Partner of the Year 2017
• Panduit Only PLATINUM Partner in the Middle East Region 2017
• VMWARE Technology Partner of the Year for MENA Region for VSAN 2017
• HP Reseller of the Year Award 2016, GCC, Egypt & Levant
• NEXThink Partner of the Year Award 2017, Middle East
• Best Mobile Application of the Year in the State of Qatar – MoTC Award
• HP Enterprise Partner of the Year 2017 Award for Qatar
• HP Computing Partner of the Year 2017 Award for the CEMA Region (Central Europe, Middle East and Africa)
• Microsoft Partner of the Year 2017
Manweir
• Certificate of Appreciation, Excellent Performance in Valve Overhauling Services of Arab-D Plant Major Shutdown (RGTA 2017)
Travel Group
• Turkish Airlines’ Plaque of Appreciation for ranking third
Energy & Industrial Markets
• Quds Paints - Best Distributor of Construction Material in Qatar during the years 2012 to 2017
• Best Distributor of Lama Exported Products for the year 2017
16 Mannai Corporation Q.P.S.C


The Mannai Way
We want Mannai to be clearly recognised as the standard of excellence.
CUSTOMERS
Delighted customers are our future and we are judged by how well we:
• Exceed our customers’ expectations through listening and understanding
• Earn our customers loyalty and trust through honesty and courtesy
• Commit to the highest standards in quality of customer care, timely delivery and after sales service
• Become the customers first choice each and every time because of our passion for excellence
• Anticipate and respond to customer needs
LEADERSHIP
Everyone in Mannai is a leader. Leaders are judged by the standards they set for themselves. Leaders in Mannai:
• Share knowledge and ideas openly• Treat everyone equally with fairness
and integrity• Motivate and inspire to get results• Embrace and adapt to change • Empower people to take
responsibility
COMMUNITY
Mannai aims to promote the interests of the countries in which we operate and will be judged by:
• Our contribution to the local economy
• Our adherence to practices that protect and support our natural environment
SHAREHOLDERS
We aim to meet the expectations of our shareholders, and we will be judged by:
• Our ability to deliver consistent long-term value
• Our high standards of corporate governance
BUSINESS PARTNERS
We believe in an open partnership with our suppliers and can be judged by how well we:
• Deliver our best in class solutions to our customers
• Develop our long-term relationships as partner of choice
• Build competitive advantage for the businesses we represent
TEAMS
Mannai is a team. Our team is judged by how well we work together. We aim to:
• Practice open and clear communication
• Help one another to deliver benefits for the whole group
• Show respect for each other and take pride in our achievements
• Treat mistakes as an opportunity to learn, not to blame
• Create a stimulating environment where people are proud to work
18 Mannai Corporation Q.P.S.C

19Annual Report 2017
Mannai Corporation is committed to having a high level of corporate governance practices and procedures in a way which maintains the company’s standards and enhances shareholder value.
The Board of Directors (the “Board of Directors”) of Mannai Corporation QPSC (the “Company”), considering Corporate Governance as a “system by which a company is directed and controlled”, has always appreciated the importance of the principles of Corporate Governance and recognized the importance of their application even before issuance of the previous “Corporate Governance Code for Shareholding Companies Listed on the Main Market” issued during 2009 by Qatar Financial Markets Authority (“QFMA”).
The Report of the Board of Directors for the year 2007, when the company was first listed, stressed on the need for “expansion of the Board of Directors and strengthening Corporate Governance in the Company.”
Guided by and seeking to promote Corporate Governance values, the Board of Directors is in continuous pursuit of maintaining a high level of Corporate Governance Practices through the sound application of Corporate Governance rules and procedures provided for in the various related laws and regulations and Company’s Articles of Association.
CorporateGovernance
Such application shall not be viewed merely as respect of a set of rules and provisions, but also as a culture and method in controlling the relationship between the various stakeholders to ensure that the Management makes right use of Company property to optimize profitability and achieve effective control.
Progress in implementation of such rules is annually reported in the Corporate Governance Report to keep the shareholders, stakeholders and public abreast of all its policies and practices in order to enable them to assess abidance of the Company by Corporate Governance principles in general.
Following the coming into effect of the QFMA Board’s decision No. 5 of 2016 concerning the Issuance of Governance Code for Companies & Legal Entities Listed on the Main Market (the “New Code”), the Board of Directors held an Extraordinary General Assembly meeting on 3 December, 2017 particularly for amending the Articles of Association of the Company, as required by the New Code, to fall in line with the New Code, whereby the Assembly passed all proposals of the Board of Directors in this respect.
The company is in the process of amending all documents, policies and procedures to reflect the procedures and principles of the New Code and these documents would be made available on the Company’s website www.mannai.com
20 Mannai Corporation Q.P.S.C

Dividend Policy Article 28 of the Corporate Governance Code requires that the Board of Directors shall submit to the General Assembly a clear policy on Dividend Distribution.
This shall include the background and rationale of such policy in terms of the best interest of the Company and the shareholders.
The payment of dividends is subject to the recommendation of the Board of Directors and approval by the Company’s shareholders.
Since becoming a Listed Company the company paid the following Cash dividend and Bonus Shares:
The declaration of dividends is discretionary and generally in line with market practice. Any future dividend payments by the Company will depend on a number of factors including but not limited to the company’s operational performance, financial results, financial condition and prospects, as well as cash and liquidity requirements (including capital expenditure and investment plans) the market situation, legal regulatory and other such factors as the Board may deem relevant at the time.
The Company believes that the payment of dividends is an important element in creating shareholder value for its investors and subject to the above, it is the policy of the company at this time, which may be subject to changes in the future, to propose to the shareholders cash dividends generally in line with the market.
Remuneration Policy
Mannai Corporation aims to remunerate fairly and responsibly by ensuring reward for performance is competitive and by aligning executive reward with shareholders interests.
Remuneration takes into account the responsibilities and scope of the functions at all levels as well as the performance of the company.
Compensation at Management and Senior Executive level includes fixed and performance related components in order to motivate the achievement of objectives and to link rewards to corporate and individual performance. It may also include a component based on long term performance of the company.
No Senior Executive or Director should decide his or her own remuneration.
Board Committees
Years Cash Dividend Bonus Shares
2007 40% 20%
2008 60% 10%
2009 50% 50%
2010 70% 20%
2011 55% -
2012 47.5% -
2013 55% -
2014 60% -
2015 50% -
2016 40% -
2017 40% -
AUDIT COMMITTEE NOMINATION COMMITTEE
Mr. Mohamed Al Kubaisi
Mr. Ali Yousef Kamal
Mr. Keith Higley
Mr. Alekh Grewal
Chairman
Member
Member
Member
Sheikh Khalifa Bin Abdulla Al-Thani
Mr. Mohamed Al Kubaisi
Mr. Ali Yousef Kamal
Chairman
Member
Member
REMUNERATION COMMITTEE CORPORATE GOVERNANCE COMMITTEE
Sheikh Suhaim Bin Abdulla Al-Thani
Sheikh Khalifa Bin Abdulla Al-Thani
Mr. Mohamed Al Kubaisi
Mr. Keith Higley
Chairman
Member
Member
Member
Mr. Keith Higley
Mr. Abdulla Al Kubaisi
Chairman
Member
21Annual Report 2017

BusinessReview 2017
22 Mannai Corporation Q.P.S.C
Mannai Automotive Group in Qatar is constituted of two broad segments - the Passenger & Commercial vehicles segment and the Heavy Equipment & Construction Machinery segment; over the decades, together they have been representing more than forty principals that are based across the globe.
Mannai Automotive Group has been consistently delivering exceptional service and added value, in line with Mannai’s Vision Statement, making Mannai the most dependable business partner in the region. The aforementioned pursuit is achieved by offering all its clients the widest range of vehicles, heavy equipment and machinery, well supported by an extensive network of after sales service centres and deploying mobile service vans to assure all its customers convenience, speed of execution and quality of service.
In line with Corporation’s strategy to operate in emerging markets as well as the geographical diversification of revenues, GTC Otomotiv, Mannai’s wholly owned subsidiary in Turkey, consolidated its operations in a market that provides high growth rate and potential for expansion.
New Vehicle Sales
Mannai Automotive Group is the exclusive franchisee for General Motors’ leading vehicle brands, Cadillac and GMC, and is also the sole distributor in Qatar for Subaru vehicles, the premium Japanese manufacturer. General Motors’ conferred upon Mannai Automotive Group “64 Years’ Service Award”, for being GM dealer in the State of Qatar rendering excellent sales and aftersales to customers.
Severing of relations with Qatar by few GCC countries, had a major impact on Auto business. The Automotive sector in Qatar dropped significantly by almost one-fourth, however, Mannai’s Automotive Group still managed to safeguard and retain its market share across almost all carlines.
Mannai’s flagship vehicles, namely Escalades, Yukons and Sierras, continue to be customers’ favourites and drive the numbers; these carlines are expected to continue their stellar performance in the years ahead as well. Further, recent launches like CT6 & XT5 in Cadillac; Terrains and Acadias in GMC received high praises from both, customers as well as automotive critics, given the technological advancements and industry first features.
The year also witnessed the launch of the all-new Subaru XV powered with the Eyesight Technology. Having received an overwhelming praise in the local and international markets, the vehicle is destined to be one of the strongest pillars of Subaru sales.
Service and Parts
Mannai Aftersales achieved the first and second places in Q1 2017 in the “Service and Parts Excellence Program” under Parts Manager & Service Manager categories respectively (for Qatar, Kuwait and UAE League). Besides, Auto Parts also secured the first place for “Retail Parts Consultant” category. For H1 2017, Auto Parts topped the “GM MEO Accessories” scorecard and were ranked the best in the Middle East. Mannai was also ranked in the Top 5 GM Middle East Dealers in the 5 years’ service retention Key Performance Indicator and GM Middle East Service Satisfaction Survey.
With a geographical spread network comprising of main Auto-Service Center in Salwa Industrial Area, duly supported by Quick Service Centres in Wakrah, Um Al-Afaei & Umm Salal and mobile Service Vans, Mannai strives to achieve the highest standards of customer convenience, loyalty and satisfaction of customer.
General Motors’ conferred upon Mannai Automotive Group “64 Years’ Service Award”, for being GM dealer in the State of Qatar rendering excellent sales and aftersales to customers.
Automotive Group
23Annual Report 2017

Heavy Equipment GroupFor the fifth consecutive year, we were certified by Grove Cranes as an "Elite Dealer", a feat won by no other Dealer in the whole of Middle East and Africa.
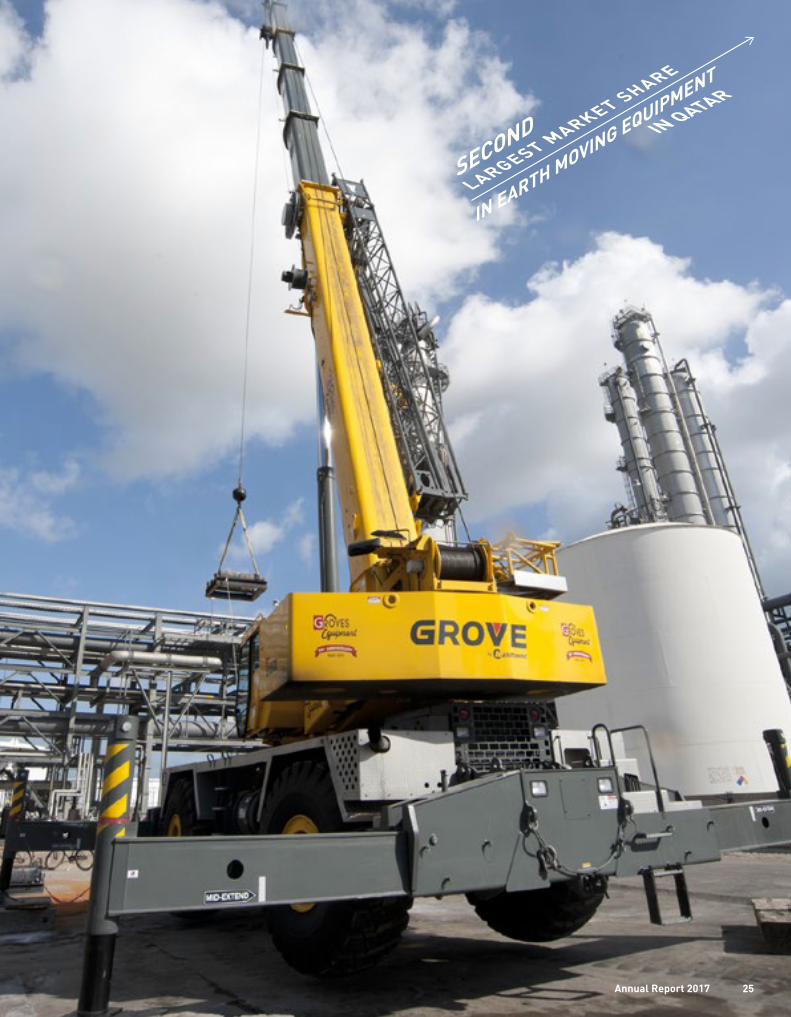
Heavy Equipment Group (HEG), a business segment within Mannai Automotive Group specialises in the sales and marketing of heavy equipment and construction machinery, catering to the construction and industrial sectors. The product line includes Grove cranes, JCB units, TCM forklifts, Massey Ferguson agricultural tractors and farm equipment, generators, Daewoo and Eicher Buses, Dulevo, Mathieu and Elgin Sweepers, DAF and Eicher Trucks, Comp Air-Holman air compressors, Thermo King Transport refrigeration, Allison fully automatic Transmissions, Chalwyn Safety Valves and MTU Diesel industrial/marine engines.
HEG continue to hold on to the second largest market share in earth moving equipment in Qatar in a market size that is shrinking.
Even under depressed market conditions, HEG recorded substantial growth in market share of JCB units and managed to not only secure 2nd place in the Qatari market but also beat the top player of 2016. JCB parts and attachments continue to hold the highest sales in the world for JCB heavy line breakers and accordingly, HEG was awarded “Highest Growth in sale of Attachments” by JCB.
HEG, for the fifth consecutive year, was certified by Grove Cranes as an "Elite Dealer", a feat won by no other Dealer in the whole of Middle East and Africa. This recognition was awarded for the robust efforts and marked improvements in developing sales and after sales support for its customers in Qatar.
HEG won the largest deal for sale of Trucks with Trailers (in the 4 X 2 segment) in Qatar, resulting in an increased market share in this segment. Besides, HEG had tangible increase in
sale of Massey Ferguson Agricultural Tractors, CompAir Compressors and Daewoo Buses.
HEG also provides an efficient aftersales support with adequate stock of spares and components maintained in the warehouse and specialised workshop services for repairs and maintenance.
In 2017, HEG became the official partners in Qatar for sale of Texaco products, a family brand of Chevron and Caltex.
For increasing customer satisfaction and convenience, HEG has been investing in after-sales operations by operating dedicated Service Center in the Industrial area, primarily focused on Trucks, Buses and Refrigeration Units. HEG is also expanding its operations at Berkat Al Awamer with the intent to provide even better service to its customers.
For outstanding level of product knowledge and customer support, HEG was:
• Awarded “Bronze Level Certification” by Thermoking. HEG has been continuously scoring higher in the customer satisfaction surveys / index published by Thermoking as well as DAF.
• Awarded a five-year maintenance contract by a very reputable customer.
HEG aims to continuously provide world class solutions to the construction and infrastructure segment in Qatar by growing the customer base and after sales support. HEG is proud to contribute to the Qatar National Vision 2030 of long term development strategy of Qatar.
24 Mannai Corporation Q.P.S.C
25Annual Report 2017

Damas InternationalLimited
Retail conditions in the GCC remained challenging, similar to 2016, as the regional economies continued to rebalance their budgets to adjust to the drop in oil prices. Accordingly, consumers remained cautious in their spending in 2017.
The subdued consumer sentiment and market conditions resulted in a sales level of AED 1.57 Billion, almost 8 percent below the previous year. However, sales activity increased towards the year-end, which may have been a surge in purchases prior to the introduction of 5 percent VAT in Saudi Arabia and the UAE in January 2018.
The fiscal changes being made in the GCC States, together with the improved outlook for energy prices, should ultimately prove good for business and consumer confidence going forward.
Following on from the operational cost cutting initiatives in the previous year, costs were further trimmed in 2017, in line with changing economic conditions.
During 2017 Damas maintained its position as the leading jewellery retailer in the Gulf region, reaching out to consumers on a variety of digital platforms. This resulted in a highly effective level of customer engagement, particularly in relation to seasonal events and special promotions.
The Damas in-house manufacturing unit in the UAE not only assists in competitive pricing, it also contributes to cost effectiveness, particularly following government GSP certification, providing an exemption from customs duties on jewellery produced in our factory for export to our stores in certain GCC countries.
The introduction of the ‘Retail Footprint’ initiative, planned last year, is enabling Damas to optimise its retail network, identifying clusters of stores where less profitable stores can be closed selectively, and our customers business redirected to the neighbouring Damas store in the cluster. In parallel with this initiative Damas has focused on its brand development and retail strategy, opening new stores in Saudi Arabia and Qatar, and relocating some stores in a Mall location to more prominent positions. Malls continue to deliver strong sales potential, whereas the performance of stores within hotels has been less encouraging and some hotel stores leases have not been renewed.
Our retail network comprises 215 Damas stores spread throughout the GCC, plus stores managed with Roberto Coin, and for Graff, Mikimoto and the new store being opened for Faberge in Dubai.
GCC residents are the heart of our customer base and careful attention is given to our in-house jewellery collections for this important and enduring part of our business.
Inventory management and highly selective purchasing has also been important in order to optimise stock levels in our stores and ensure a healthy balance of fresh and replenished stock, so loyal repeat customers are constantly intrigued with product offerings and new collections in their favourite store.
With approximately 1900 employees, Damas remains committed to people development, with a continued emphasis on in-store customer oriented coaching initiatives. Damas maintains its market leading percentage of front-line staff qualified by the Gemological Institute of America, GIA Accredited Jewellery Professional Diploma, and the training programme continues.
The ‘Our Damas’ programme, concentrating on the Company’s values and future plans was given a fresh approach in 2017. Whilst senior management continued with their annual involvement in each region, the event now also has a competitive sporting aspect which allows staff to enjoy participating in their favourite sport and at the same time encourage team building across retail and office support staff.
Damas financials remained strong, with the balance sheet debt gearing improving further to 0.2:1.0 during 2017.
Our surveys show that Damas continues to be a highly trusted jewellery retailer in the region with a reputation for quality, craftsmanship, and customer service, which will underpin its success in 2018 and beyond.
27Annual Report 2017

Information and Communication Technology
Mannai ICT Group has further increased its share of the Qatari ICT market and continues to be the leader in ICT segment . All of Mannai ICT’s major business units increased their market share as a result of successful business development and sales efforts. The biggest contributors were once again Networks and Data Center, while Integrated IT Solutions reported the highest growth due to significant additions to its vendor portfolio. Mannai ICT Group has firmly established itself as Qatar’s leading systems integrator, extending its reputation of trust and quality to successfully serve the IT needs of the public and private sector companies in the State of Qatar and to contribute to a knowledge-based, diversified economy.
The ICT Group is organised into the following business units: Networks & Data Center provides CISCO based voice and data solutions, structured cabling, storage and CCTV to key customers in Qatar; Mannai InfoTech with its key principal ORACLE is in an ideal position to add value to its customers’ businesses by providing optimally integrated end-to-end solutions. The division is leaving a distinct mark with its excellent professional skills relating to application development and implementation. The Integrated IT Solutions division provides comprehensive hardware, storage, virtualization and security solutions from, DELL-EMC, Microsoft, SAP, VMWare, Palo Alto Networks, Symantec and a host of other vendors; Finally, HP Solutions has done a remarkable job to represent the portfolio of HP Enterprise and HP Inc. in the State of Qatar and to ensure that its broad capabilities in the realm of Hardware, Software, Printing and Computing Systems are well positioned to meet customer needs at all times.
Networks & Data Center division provides innovative next generation technology solutions that involve Networking, Cybersecurity, IP Telephony, Unified Collaboration, Computing, Virtualization, Storage, Backup, DR Automation, Managed Services which are provided by Market Leaders like Cisco, NetApp, VMware, Veeam, Pure Storage, Rubrik, F5, Infoblox, CheckPoint, CA Technologies, MobileIron, McAfee, Splunk, Frequentis, VOSS, Adeya, AppSpace for IT Infrastructure catering to the needs of Small, Medium, Enterprise, Government, Defense and Service-Provider customers.
Mannai Networks & Data Center also has extensive experience in supplying, installing and commissioning a range of ELV and security systems enabling it to meet the clients’ requirements in a variety of sectors encompassing CCTV networks, integrated command control center, public announcement systems, audio/video, access control, IP Lighting, and other smart solutions.
Networks & Data Center is a CISCO Gold Certified Partner and has been honoured as Cisco Middle East Enterprise Partner of the Year 2017 for its innovative approach towards delivering business value and its commitment to quality and support.
Mannai InfoTech is offering a broad spectrum of IT services including Application Implementation, bespoke Application Development, Systems Integration, Mobility, Master Data Management, Enterprise Content Management, Data Warehousing, Enterprise Resource Planning (ERP), and Customer Relationship Management (CRM) using on-premises and/or cloud architecture. Mannai InfoTech with its key principal Oracle, has established itself firmly as the most sophisticated next generation IT service provider in the State of Qatar.
Mannai InfoTech takes special pride in being OpenText Platinum Partner for Enterprise Information Management (EIM), the country’s only Gold Partner of Kony for delivering Mobile Applications
and Esri® Strategic Business Partner & Esri® Sole Distributor for the State of Qatar. Additionally, Mannai InfoTech is ideally positioned to benefit from the global expertise of its sister company Gfi Informatique and is leveraging the special know-how and intellectual property of Gfi in various projects in Qatar and beyond. In 2017, Mannai InfoTech received the IT Business Award for the ‘Best Mobile Application’ of the Year, an honor bestowed by the Ministry of Transportation & Communication in Qatar.
Integrated IT Solutions division is a “turn-key solution provider”, integrating disparate technologies to provide cost efficient solutions and support in the most effective manner. Integrated IT Solutions has evolved from a systems Integrator to a next generation hyper-converged solution provider, encompassing partnership with 20+ technology vendors under one roof. The division has an excellent prowess in the field of cybersecurity, where it is combining strong in-house expertise with world class international solutions to address every stage of the attack and lifecycle with industry’s leading threat intelligence, advanced monitoring, incident response, and cyber skills development services.
The division remains in the highest partnership status in the region with its diverse range of specialized vendors and world-class technology partners. Integrated IT Solutions division has received several awards and special accolades, including awards from Barracuda, CITRIX, Fluke Networks, Microsoft, Nutanix, Palo Alto Networks, Riverbed, Symantec, Vision Solutions and VMWare. In 2017, Mannai Integrated IT Solutions received "Microsoft Partner of the Year 2017" award for Qatar.
HP Solutions division is the only Platinum Partner in Qatar for both HP Enterprise and HP Inc. covering full portfolio of Hardware, Software, Security, Networking, Compute and Print Solutions with experience in providing state-of-the-art IT Solutions to all market segments and industries in Qatar.
Mannai’s ICT Group once again performed strongly in 2017, with revenues of above 1.65 billion QAR.
28 Mannai Corporation Q.P.S.C

This dominant market position is the result of meticulous approach to delivering value to customers and to keeping its highly qualified workforce abreast of all technological trends and developments in HP Enterprise & HP Inc.’s impressive solution portfolio. The strong focus the division puts on training and continuous professional development together with its comprehensive sales achievements has ensured that Platinum Partner status has been retained for both HP Enterprise & HP Inc. On the basis of these unique competences many major turnkey solution projects were successfully delivered to Qatar’s public and private sector in 2017 and the business is ideally positioned to enter 2018 with a strong order book.
Travelport division had another successful year as Qatar’s premier provider of Global Distribution System (GDS) services to Qatar’s travel industry. In a challenging environment which was affected by the unjust siege imposed on the State of Qatar the division has focused on improving its operating efficiency and customer satisfaction metrics.
ICT’s Office Equipment division has achieved solid results in terms of revenue and net profits in 2017 and is expanding its offerings in the areas of print-as-a-service and other innovative delivery models. The division is geared to continue success in 2018 and beyond.
The Medical and Scientific Equipment division is a technology leader with advanced standards of technological solutions and proven services and application competence. The division has continued to make important contributions to Qatar’s growing and ambitious healthcare and scientific research sector.
The division is at the pulse of medical and scientific innovation to bring new technologies to the State of Qatar and to grow its business portfolio. Being a well-established player in Qatar the division is in an outstanding position to boost its pipeline, revenue and contribution to public health.
29Annual Report 2017
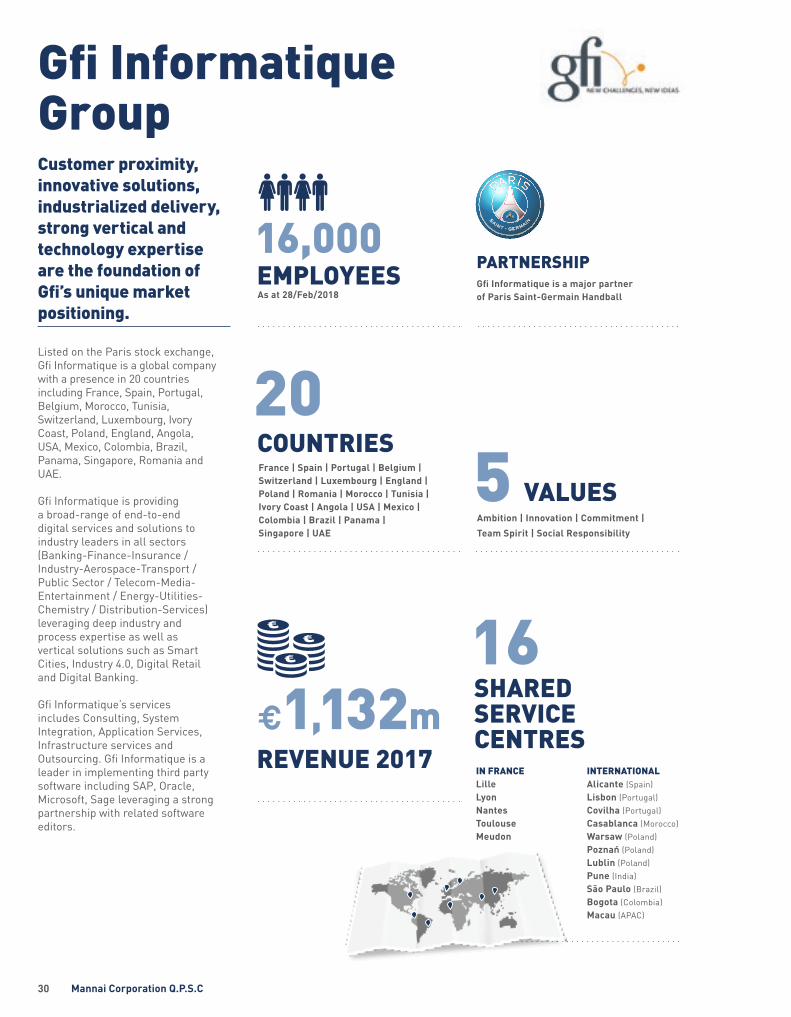
16,000 EMPLOYEES
PARTNERSHIPGfi Informatique is a major partner of Paris Saint-Germain Handball
20 COUNTRIESFrance | Spain | Portugal | Belgium | Switzerland | Luxembourg | England | Poland | Romania | Morocco | Tunisia | Ivory Coast | Angola | USA | Mexico | Colombia | Brazil | Panama | Singapore | UAE
5 VALUESAmbition | Innovation | Commitment |
Team Spirit | Social Responsibility
REVENUE 2017€1,132m
INTERNATIONALAlicante (Spain)Lisbon (Portugal)Covilha (Portugal)Casablanca (Morocco)Warsaw (Poland)Poznań (Poland)Lublin (Poland)Pune (India)São Paulo (Brazil)Bogota (Colombia)Macau (APAC)
16 SHARED SERVICECENTRESIN FRANCELilleLyonNantesToulouseMeudon
As at 28/Feb/2018
Gfi Informatique Group
Listed on the Paris stock exchange, Gfi Informatique is a global company with a presence in 20 countries including France, Spain, Portugal, Belgium, Morocco, Tunisia, Switzerland, Luxembourg, Ivory Coast, Poland, England, Angola, USA, Mexico, Colombia, Brazil, Panama, Singapore, Romania and UAE.
Gfi Informatique is providing a broad-range of end-to-end digital services and solutions to industry leaders in all sectors (Banking-Finance-Insurance / Industry-Aerospace-Transport / Public Sector / Telecom-Media-Entertainment / Energy-Utilities-Chemistry / Distribution-Services) leveraging deep industry and process expertise as well as vertical solutions such as Smart Cities, Industry 4.0, Digital Retail and Digital Banking.
Gfi Informatique’s services includes Consulting, System Integration, Application Services, Infrastructure services and Outsourcing. Gfi Informatique is a leader in implementing third party software including SAP, Oracle, Microsoft, Sage leveraging a strong partnership with related software editors.
Customer proximity, innovative solutions, industrialized delivery, strong vertical and technology expertise are the foundation of Gfi’s unique market positioning.
30 Mannai Corporation Q.P.S.C

16,000 EMPLOYEES
PARTNERSHIPGfi Informatique is a major partner of Paris Saint-Germain Handball
20 COUNTRIESFrance | Spain | Portugal | Belgium | Switzerland | Luxembourg | England | Poland | Romania | Morocco | Tunisia | Ivory Coast | Angola | USA | Mexico | Colombia | Brazil | Panama | Singapore | UAE
5 VALUESAmbition | Innovation | Commitment |
Team Spirit | Social Responsibility
REVENUE 2017€1,132m
INTERNATIONALAlicante (Spain)Lisbon (Portugal)Covilha (Portugal)Casablanca (Morocco)Warsaw (Poland)Poznań (Poland)Lublin (Poland)Pune (India)São Paulo (Brazil)Bogota (Colombia)Macau (APAC)
16 SHARED SERVICECENTRESIN FRANCELilleLyonNantesToulouseMeudon
As at 28/Feb/2018
www.gfi.world
STOCK EXCHANGEGfi Informatique is listed on the Euronext Paris Market.Code ISIN: FR 0004038099
6 Banking-Finance-InsuranceIndustry-Aerospace-TransportPublic Sector Telecom-Media-Entertainment Energy-Utilities-ChemicalsDistribution-Services
BUSINESSSECTORS
BUSINESSLINESConsulting | Application Services |Infrastructure Services |Business Solutions | Software | SAP
6
BUSINESSSOLUTIONSInsuranceDistribution-ServicesHealth-SocialPublic SectorTelecom
5 INNOVATION
PROXIMITY
INDUSTRIALISATION
8 Cybersecurity
DevOpsDigital TransformationDigital BankingIndustry 4.0
IoTOmni Commerce
Smart Cities
GROUPPRACTICES
2017 has been another year of great achievements for Gfi Informatique
Gfi completed the successful integration of the Efron and Roff Groups. Efron is a reputed Spanish digital services firm with nearly 750 employees and revenue of €37 million. This acquisition greatly strengthens Gfi Informatique’s position in Spain (+30%) and reinforced its presence in the banking, insurance and healthcare sectors. Roff is a Top European players in the SAP solutions integration and maintenance market, based in Portugal.
It signed major contracts with some new customers including the major transformation of the Kidiliz and Tartine & Chocolat group’s IT systems (i.e 1000 outlets across 20 countries), SNCF (French Railways), EDF (French Electricity utilities), Boiron (Pharmaceutical leader), Roll Royce (Poland and UK), Toyota (Belgium) and the Ministry of Justice in Portugal.
Gfi Informatique extended its FabLab facilities, a space for immersive and collaborative joint innovation workshops with customers, opening 4 new Fablabs in France (Nantes, Lille, Lyon, Montpellier) and one in Portugal (Lisbon).
31Annual Report 2017
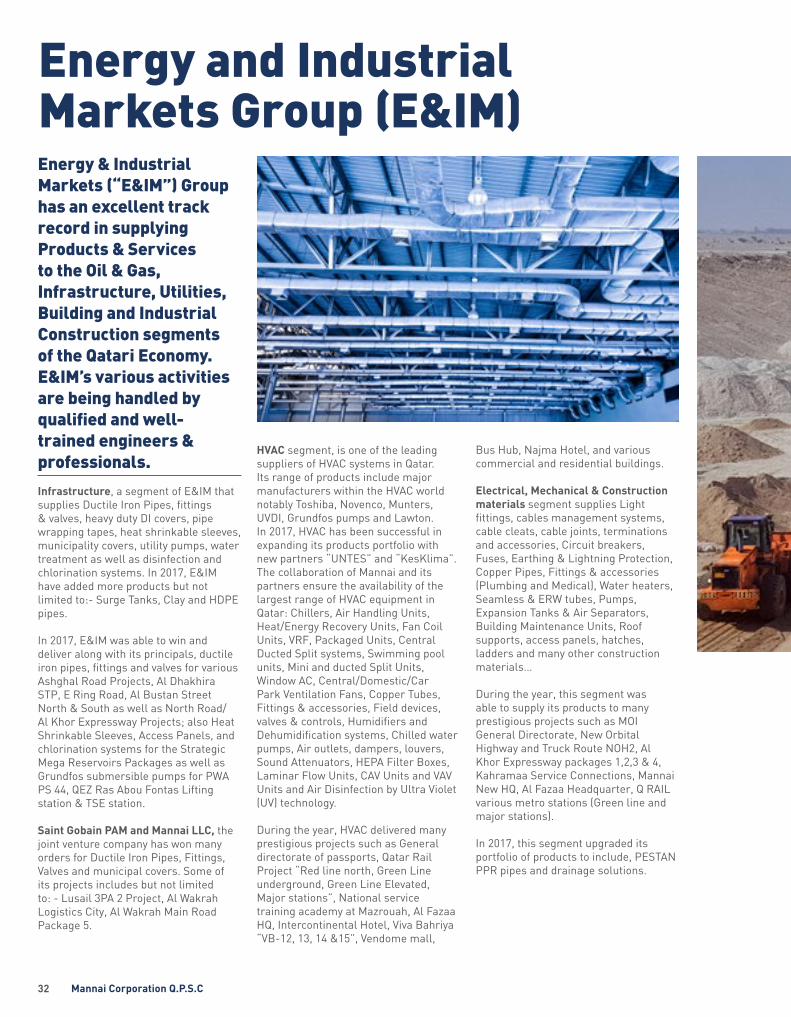
Energy and Industrial Markets Group (E&IM)Energy & Industrial Markets (“E&IM”) Group has an excellent track record in supplying Products & Services to the Oil & Gas, Infrastructure, Utilities, Building and Industrial Construction segments of the Qatari Economy. E&IM’s various activities are being handled by qualified and well-trained engineers & professionals.
Infrastructure, a segment of E&IM that supplies Ductile Iron Pipes, fittings & valves, heavy duty DI covers, pipe wrapping tapes, heat shrinkable sleeves, municipality covers, utility pumps, water treatment as well as disinfection and chlorination systems. In 2017, E&IM have added more products but not limited to:- Surge Tanks, Clay and HDPE pipes.
In 2017, E&IM was able to win and deliver along with its principals, ductile iron pipes, fittings and valves for various Ashghal Road Projects, Al Dhakhira STP, E Ring Road, Al Bustan Street North & South as well as North Road/Al Khor Expressway Projects; also Heat Shrinkable Sleeves, Access Panels, and chlorination systems for the Strategic Mega Reservoirs Packages as well as Grundfos submersible pumps for PWA PS 44, QEZ Ras Abou Fontas Lifting station & TSE station.
Saint Gobain PAM and Mannai LLC, the joint venture company has won many orders for Ductile Iron Pipes, Fittings, Valves and municipal covers. Some of its projects includes but not limited to: - Lusail 3PA 2 Project, Al Wakrah Logistics City, Al Wakrah Main Road Package 5.
HVAC segment, is one of the leading suppliers of HVAC systems in Qatar. Its range of products include major manufacturers within the HVAC world notably Toshiba, Novenco, Munters, UVDI, Grundfos pumps and Lawton. In 2017, HVAC has been successful in expanding its products portfolio with new partners “UNTES” and “KesKlima”. The collaboration of Mannai and its partners ensure the availability of the largest range of HVAC equipment in Qatar: Chillers, Air Handling Units, Heat/Energy Recovery Units, Fan Coil Units, VRF, Packaged Units, Central Ducted Split systems, Swimming pool units, Mini and ducted Split Units, Window AC, Central/Domestic/Car Park Ventilation Fans, Copper Tubes, Fittings & accessories, Field devices, valves & controls, Humidifiers and Dehumidification systems, Chilled water pumps, Air outlets, dampers, louvers, Sound Attenuators, HEPA Filter Boxes, Laminar Flow Units, CAV Units and VAV Units and Air Disinfection by Ultra Violet (UV) technology.
During the year, HVAC delivered many prestigious projects such as General directorate of passports, Qatar Rail Project “Red line north, Green Line underground, Green Line Elevated, Major stations”, National service training academy at Mazrouah, Al Fazaa HQ, Intercontinental Hotel, Viva Bahriya “VB-12, 13, 14 &15”, Vendome mall,
Bus Hub, Najma Hotel, and various commercial and residential buildings.
Electrical, Mechanical & Construction materials segment supplies Light fittings, cables management systems, cable cleats, cable joints, terminations and accessories, Circuit breakers, Fuses, Earthing & Lightning Protection, Copper Pipes, Fittings & accessories (Plumbing and Medical), Water heaters, Seamless & ERW tubes, Pumps, Expansion Tanks & Air Separators, Building Maintenance Units, Roof supports, access panels, hatches, ladders and many other construction materials…
During the year, this segment was able to supply its products to many prestigious projects such as MOI General Directorate, New Orbital Highway and Truck Route NOH2, Al Khor Expressway packages 1,2,3 & 4, Kahramaa Service Connections, Mannai New HQ, Al Fazaa Headquarter, Q RAIL various metro stations (Green line and major stations).
In 2017, this segment upgraded its portfolio of products to include, PESTAN PPR pipes and drainage solutions.
32 Mannai Corporation Q.P.S.C

Oil & Gas segment continue to execute many turbines and plate heat exchangers maintenance contracts with major Oil and Gas companies like QP, Qatargas and Rasgas.
O&G won several projects of heat tracing systems, gas flow meters and gas chromatographs. Its range of products include major manufacturers within the O&G industry notably Alfa Laval, SPX Clyde Union Pumps, Howden compressors, Quartzelec and David Brown Gearbox.
E&IM strives to continuously upgrade its capabilities and provide value added services and products for its customers and Principals alike.
33Annual Report 2017

Building & Construction Materials
This segment caters to the requirement of local infrastructure projects by supplying high quality waterproofing membranes and construction chemicals from renowned manufacturers from Italy, Turkey, Poland, India and Jordan, which greatly enhances the durability of buildings. Additionally, it also offers many other products such as Expansion Joint Fillers, Non-woven Geotextiles, and Protection Boards, etc…
In 2017, we received Appreciation Certificates of Excellence in Sales and Marketing from LAMA-Jordan Bituminous Products, QUDS Paints etc.
Tools & Machinery segment deals with various type of Tools & Machineries catering to the industrial and construction sectors:
• Plumbing, Air conditioning & Refrigeration, Copper pipes and fittings
• PVC, PPR, HTPP & HDPE pipes• Personal Protection Equipment• General hand tools• Pipe tools and pipe cutters, threading
and grooving machines, measuring equipment
• Equipment for construction, Bar bending and cutting machines, portable bender and cutters, as well as equipment for concrete tiles cutting, concrete coring machine, diamond cutting blades, concrete core cutters as well as Steel rebar coupling systems
• Various consumables, cutting and grinding discs, flap wheels, flap disc, carbide burrs, abrasive material etc.
• Air operated diaphragm pumps, Pneumatic Pumps and submersible pumps
• Various types of industrial bearings
• Wide range pneumatic tools• And much more...
Power Generation segment deals with Electrical and Engine Driven Mobile Screw Air Compressors, Generators and Tower Lights.
• Electrical and Engine Driven Mobile Screw Air Compressors. Electrical Compressor Range from 1.1KW -132KW / Portable Compressor Range from 175 – 750 cfm.
• Diesel Power Generators ranging from 10KVA up to 700 KVA for prime and standby applications for commercial, Industrial and Construction purposes.
• A complete range of Tower Lights from the standard metal halide to Hybrid / Hydro Lighting Towers. Also offers ATEX version Link towers meeting requirements of Zone-II Hazardous area classification.
Our After Sales Services are provided to our clients by dedicated, factory-trained service personnel.
Welding Equipment & Consumables segment offers a wide range of welding equipment from standard MMA, TIG, MIG/MAG to high-tech portable /synergic inverter welding machines and all types of welding consumables for use in small to heavy fabrication and manufacturing industries, constructions and oil & gas projects.
Various Gas and Plasma Cutting equipment including portable CNC Cutting machines to High performance CNC Cutting machines for use in shipbuilding, steel construction, manufacturing and fabrication industries.
engineered by nature
34 Mannai Corporation Q.P.S.C

Gulf Laboratories Co. WLL
Gulf Laboratories Co. WLL, a wholly owned subsidiary of Mannai Corporation, provides ground investigation, borehole drilling and laboratory testing services to international and local clients within the State of Qatar. The business has provided its specialist services to a large proportion of civil engineering, water resource and development projects within Qatar for over 35 years.
Activities include onshore and offshore ground investigations, water-well drilling and testing, earthing and cathodic protection borehole drilling, geophysical surveys, hydrogeological investigations and mineral resource studies. During 2017, ground investigations have been performed to support engineering design activities for various infrastrucuture and development projects including E-Ring Road, Lusail Development Infrastructure, Mega Reservoirs Pipelines, Al Bustan Street South, Lusail Hotel, etc as well as geo-environmental investigations associated with several petrol station rehabilitations. Water wells, soakaway, earthing and cathodic protection borehole drilling works are also routinely carried out as part of construction projects.
Laboratory testing services offered the physical and chemical analysis of construction materials including soil, rock, aggregate, cement, concrete, steel and asphalt. These services are performed at a new extensive physical testing laboratory located at St.13, and newly reconfigured chemical, environmental and oil testing facility at St.2 Salwa Industrial Area, as well as at project sites where temporary laboratory facilities are established.
On-site material testing laboratories and call-off testing services provide ongoing involvement at the Doha Metro Project, New Port Project, New Orbital Highway, West Corridor Project, Lusail Development Project, Doha Expressway, Dukhan Highway, QEZ3 and various Sewage Treatment Plants.
The company also carries out a wide range of environmental testing activities including chemical and microbiological testing of groundwater, seawater, potable water and treated and untreated effluent. The services are performed either to support initial baseline environmental surveys or as part of long term environmental monitoring plans. The environmental testing laboratory continues to be involved with various monitoring and testing programmes for Ashghal, Dolphin Gas, Pearl GTL, Qatar Petroleum, Qatar Airways and a number of Ashghal sewage treatment plants and groundwater monitoring well networks.
Petroleum testing services are also offered, including the physical and chemical analyses of transformer and lubricant oils. The range of services offered is currently being expanded in order to provide a comprehensive range of diagnostic testing for transformer insulating oils.
During early 2017, Gulf Laboratories relocated their physical testing laboratory and main offices to a brand new facility located on St.13 Salwa Industrial Area.
During early 2017, Gulf Laboratories relocated their physical testing laboratory and main offices to a brand new facility located on St.13 Salwa Industrial Area. The original laboratory at St.2 has been newly reconfigured to become a dedicated chemical, environmental testing facility and petroleum testing laboratory. Also at St.2, the upper floor has been totally reconfigured as a food testing laboratory, which will allow a wide range of microbiological and chemical analysis of foodstuffs, swab samples and for hotels, catering companies, labour camps, restaurant and supermarkets as part of their food safety monitoring programmes. In total, Gulf Laboratories have an area of over 1,500m2 of laboratory testing space.
The company’s quality and occupational health, safety and environmental management systems are certified to ISO 9001, OHSAS 18001 and ISO 14001 standards. The laboratories have over 470 tests accredited to BS EN ISO 17025:2005 and continue to add further test parameters to the accreditation every year.
35Annual Report 2017
Manweir LLC
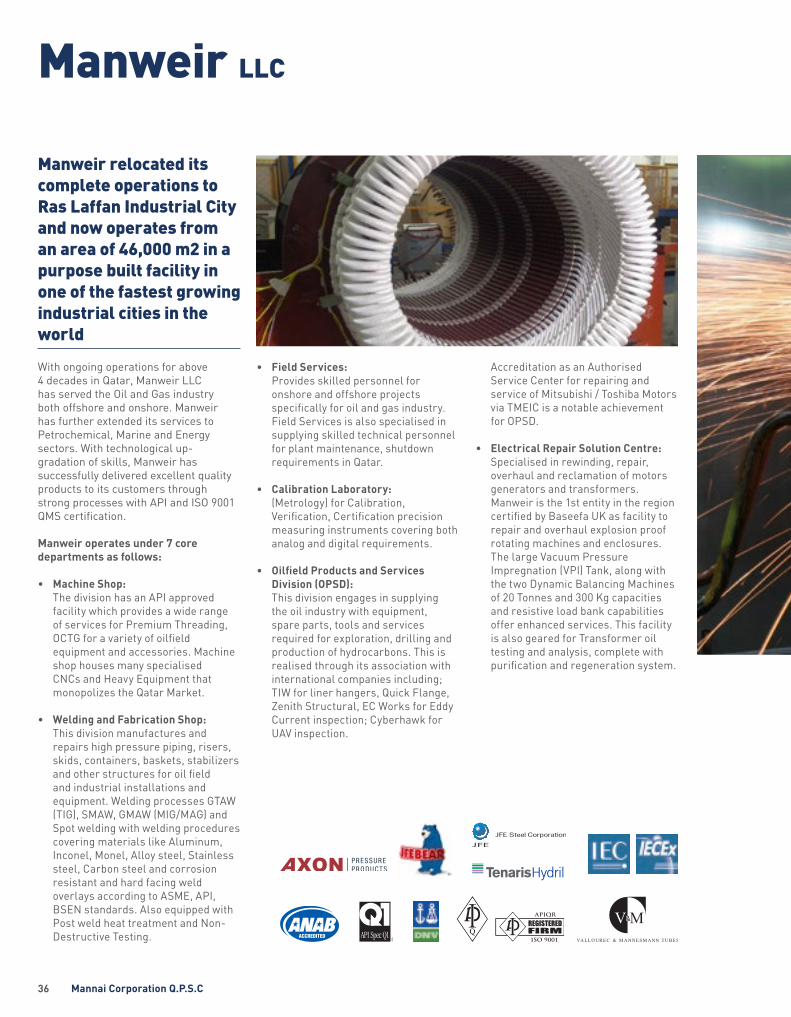
Manweir relocated its complete operations to Ras Laffan Industrial City and now operates from an area of 46,000 m2 in a purpose built facility in one of the fastest growing industrial cities in the world
With ongoing operations for above 4 decades in Qatar, Manweir LLC has served the Oil and Gas industry both offshore and onshore. Manweir has further extended its services to Petrochemical, Marine and Energy sectors. With technological up- gradation of skills, Manweir has successfully delivered excellent quality products to its customers through strong processes with API and ISO 9001 QMS certification.
Manweir operates under 7 core departments as follows:
• Machine Shop: The division has an API approved facility which provides a wide range of services for Premium Threading, OCTG for a variety of oilfield equipment and accessories. Machine shop houses many specialised CNCs and Heavy Equipment that monopolizes the Qatar Market.
• Welding and Fabrication Shop: This division manufactures and repairs high pressure piping, risers, skids, containers, baskets, stabilizers and other structures for oil field and industrial installations and equipment. Welding processes GTAW (TIG), SMAW, GMAW (MIG/MAG) and Spot welding with welding procedures covering materials like Aluminum, Inconel, Monel, Alloy steel, Stainless steel, Carbon steel and corrosion resistant and hard facing weld overlays according to ASME, API, BSEN standards. Also equipped with Post weld heat treatment and Non- Destructive Testing.
• Field Services: Provides skilled personnel for onshore and offshore projects specifically for oil and gas industry. Field Services is also specialised in supplying skilled technical personnel for plant maintenance, shutdown requirements in Qatar.
• Calibration Laboratory: (Metrology) for Calibration, Verification, Certification precision measuring instruments covering both analog and digital requirements.
• Oilfield Products and Services Division (OPSD): This division engages in supplying the oil industry with equipment, spare parts, tools and services required for exploration, drilling and production of hydrocarbons. This is realised through its association with international companies including; TIW for liner hangers, Quick Flange, Zenith Structural, EC Works for Eddy Current inspection; Cyberhawk for UAV inspection.
Accreditation as an Authorised Service Center for repairing and service of Mitsubishi / Toshiba Motors via TMEIC is a notable achievement for OPSD.
• Electrical Repair Solution Centre: Specialised in rewinding, repair, overhaul and reclamation of motors generators and transformers. Manweir is the 1st entity in the region certified by Baseefa UK as facility to repair and overhaul explosion proof rotating machines and enclosures. The large Vacuum Pressure Impregnation (VPI) Tank, along with the two Dynamic Balancing Machines of 20 Tonnes and 300 Kg capacities and resistive load bank capabilities offer enhanced services. This facility is also geared for Transformer oil testing and analysis, complete with purification and regeneration system.
36 Mannai Corporation Q.P.S.C
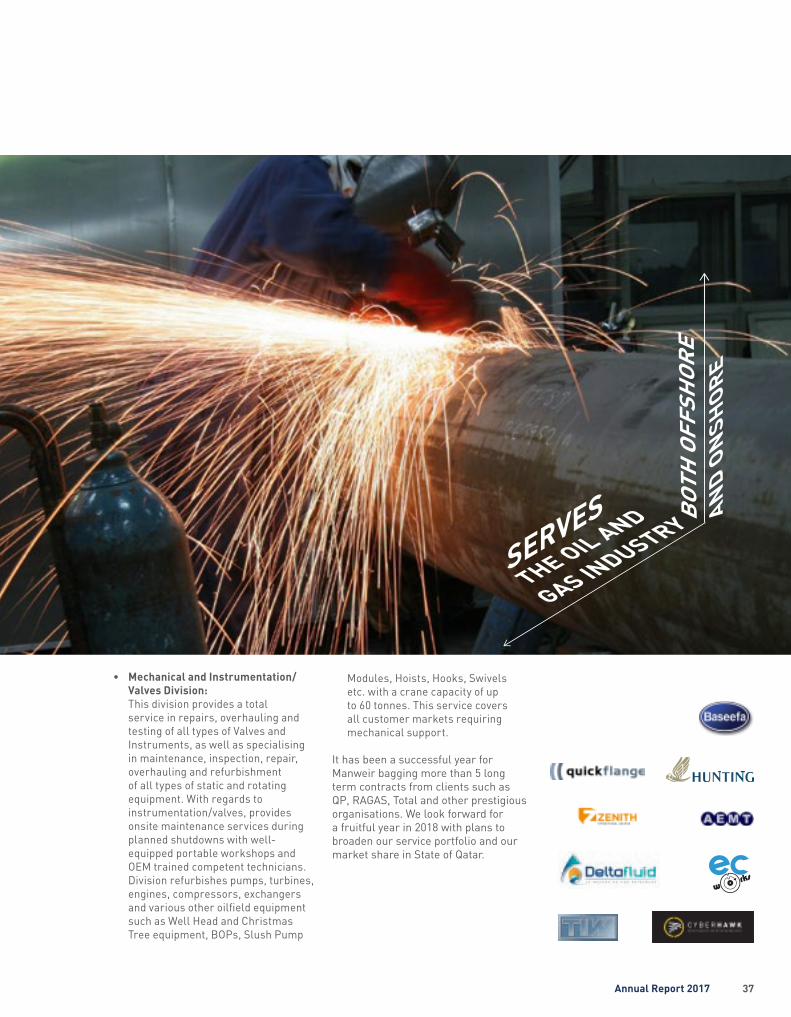
• Mechanical and Instrumentation/ Valves Division: This division provides a total service in repairs, overhauling and testing of all types of Valves and Instruments, as well as specialising in maintenance, inspection, repair, overhauling and refurbishment of all types of static and rotating equipment. With regards to instrumentation/valves, provides onsite maintenance services during planned shutdowns with well- equipped portable workshops and OEM trained competent technicians. Division refurbishes pumps, turbines, engines, compressors, exchangers and various other oilfield equipment such as Well Head and Christmas Tree equipment, BOPs, Slush Pump
Modules, Hoists, Hooks, Swivels etc. with a crane capacity of up to 60 tonnes. This service covers all customer markets requiring mechanical support.
It has been a successful year for Manweir bagging more than 5 long term contracts from clients such as QP, RAGAS, Total and other prestigious organisations. We look forward for a fruitful year in 2018 with plans to broaden our service portfolio and our market share in State of Qatar.
37Annual Report 2017
Travel Group
The year of 2017 started on a low key for the travel industry on the whole due to the rationalization of travel spends by major customers on account of the drop in the oil prices. In spite of the shortcomings, we managed to gain a decent share of the market with our years of experience & diversity of the business. We have always strived to retain our leadership position as an IATA and a ISO 9001 certified travel service provider. The Travel Group since its inception, from an in-house service provider has grown and diversified into few other travel related services viz., Mannai Air Travel (IATA), Space Travel (General Sales Agent representing airlines viz., Philippine Airlines, Kenya Airways, Korean Air and flydubai), Cargo (Airline Representation and General Services), Mannai Holidays (Inbound and Outbound tourism) and VFS (Visa Facilitation Services).
Mannai Air Travel as an IATA agent is one of the most trusted Travel Management Companies in the region, offering services to a range of large corporate clientele in the Oil and Gas industry, Educational sector, Banks and SMEs. Mannai Air Travel has a global reach through its affiliation with BCD Travel, a global Travel Management Company providing strong support to
service the multinational companies as well as local and regional corporate business clients.
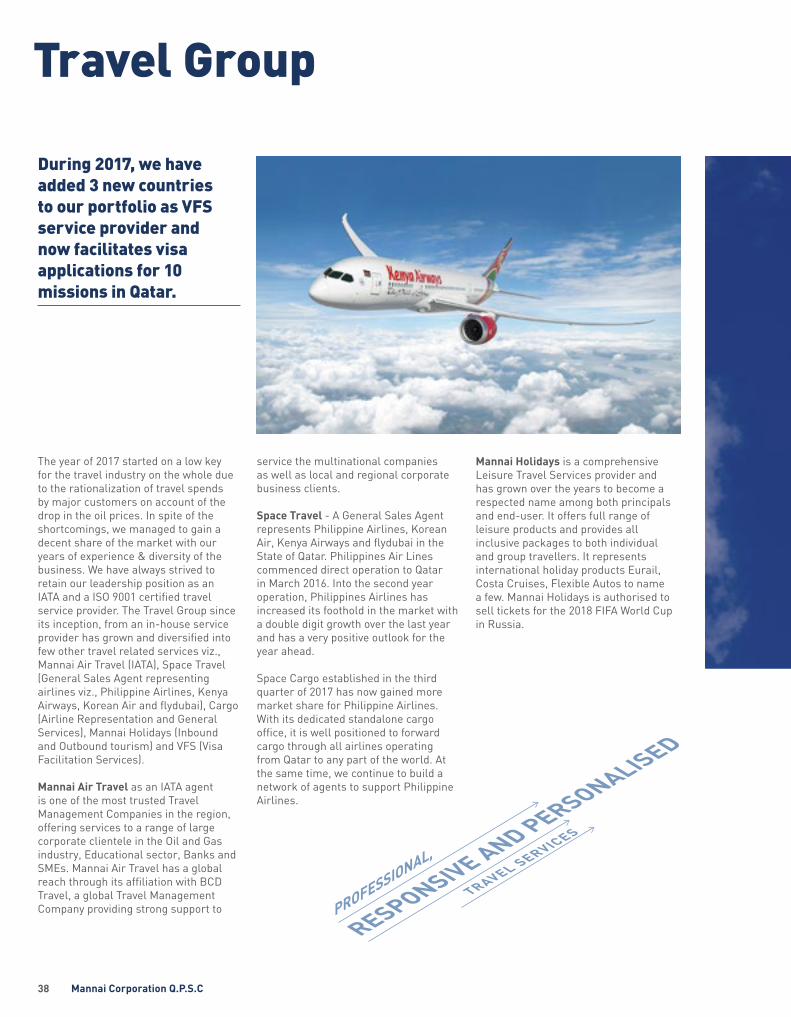
Space Travel - A General Sales Agent represents Philippine Airlines, Korean Air, Kenya Airways and flydubai in the State of Qatar. Philippines Air Lines commenced direct operation to Qatar in March 2016. Into the second year operation, Philippines Airlines has increased its foothold in the market with a double digit growth over the last year and has a very positive outlook for the year ahead.
Space Cargo established in the third quarter of 2017 has now gained more market share for Philippine Airlines. With its dedicated standalone cargo office, it is well positioned to forward cargo through all airlines operating from Qatar to any part of the world. At the same time, we continue to build a network of agents to support Philippine Airlines.
During 2017, we have added 3 new countries to our portfolio as VFS service provider and now facilitates visa applications for 10 missions in Qatar.
Mannai Holidays is a comprehensive Leisure Travel Services provider and has grown over the years to become a respected name among both principals and end-user. It offers full range of leisure products and provides all inclusive packages to both individual and group travellers. It represents international holiday products Eurail, Costa Cruises, Flexible Autos to name a few. Mannai Holidays is authorised to sell tickets for the 2018 FIFA World Cup in Russia.
38 Mannai Corporation Q.P.S.C

We as a local VFS representative are the most recognised and established business process support company for acceptance of visa applications on behalf of several European Missions, Australia and Canada. During 2017, we added 3 new countries to our portfolio as VFS service provider and now we serve a total of 10 missions in Qatar.
Our goal is to expand the travel Group activities within GCC region by broadening our reach in the regional market and stay competitive.
By the second quarter of 2018 we will provide an online booking platform with which our corporates and retail customers will be able to purchase all the travel services in an easy manner.
39Annual Report 2017

Home Appliances & Electronics DivisionWith a primary focus on the Home Appliances and Electronics, HAED (Home Appliances and Electronics Division) has taken on the highly responsible role of distributor to several leading global home appliance and electronics brands of the world.
Though having a mainstream recognition as a prominent regional distributor and retailer of well-known global consumer electronics brands, HAED has also made its mark as a dependable provider of professional and commercial electronics and home appliances products and services.
As a "Total Home Solutions provider" Mannai HAED has been continuously improving and setting new standards in the quality of its services and support structure. HAED as been successfully meeting customer expectations in an environment that is rapidly changing and expanding.
In the commercial and professional sphere, HAED is able to provide products and solutions in the project business. With a team of highly skilled sales personnel, technicians, logistics and after-sales team, it has been awarded and successfully completed several prestigious projects.
In the retail segment HAED represents global Brands like TCL, Toshiba, Moulinex, White-Westinghouse, AEG, Seiko etc., presenting a whole range of product categories including Audio and Video, small and large domestic appliances, Air Conditioners, watches, to name a few.
HAED’s products and services are available to its customers throughout Qatar, through its wide network of retailers and dealers. The Turnaround time for servicing of appliances and electronics has been reduced by well-trained technical team.
40 Mannai Corporation Q.P.S.C

Qatar Logistics WLL
Qatar Logistics WLL is a wholly owned subsidiary of Mannai Corporation. Qatar Logistics is an exclusive partner of “Hellmann Worldwide Logistics” one of the top freight forwarding networks globally. Through this partnership Qatar Logistics is able to offer its services in 157 countries supported by over 20,000 logistics personnel employed in over 400 offices. 2017 was a challenging year for the Logistics industry in Qatar.
Qatar Logistics was well positioned and fully equipped to deliver solutions to large and SME businesses in Qatar and was very successful in maintaining continuity of both inbound and outbound cargo.
During the year, Qatar Logistics opened a warehouse facility of more than 20,000 SQM of rental storage to handle the growing requirements of our clients. It is licensed to store and handle chemical materials, in addition to ambient and temperature control facilities, which allows it to cater to an expanded potential customer base in Qatar.
Qatar Logistics also offers exclusive warehousing and storage services to
In 2018, Qatar Logistics will continue to maintain its rank as one of the top logistics providers in the State of Qatar and serve its expanding customer base.
Oil & Gas sector through a state-of-art and licensed facility located in Ras Laffan Industrial area. This facility is fully equipped to facilitate storage and handling of materials and equipment.
In 2018, Qatar Logistics will continue to maintain its rank as one of the top logistics providers in the state of Qatar and serve its expanding customer base.
41Annual Report 2017
Cofely Besix Mannai Facility Management LLC
As a leading integrated facilities management service provider in Qatar, Cofely Besix Mannai Facility Management continues to offer a wide range of FM services. The company currently provides technical maintenance, MEP, HVAC, electrical, cleaning, as well as front office help-desk service and management to a diverse range of customers from the oil and gas sector, to commercial, residential, retail and other industrial facilities across the country. In 2017, the FM market in Qatar proved to be a challenging year due to further constraints in the reduction of operating expense budgets across the market, from both the public and private sector. Furthermore, the unexpected boycott from surrounding GCC countries, had a very negative impact to the business, both financially due to cost increases, as well as operationally, from a logistical point of view.
Despite these challenges, CBMFM succeeded in growing their business by successfully managing existing projects, whilst mobilising new projects, as well as being re-awarded contracts with clients that were up for renewal.
To further strengthen our market position, CBMFM has successfully completed the necessary FM Industry ISO re-certification, and the company has also recently been awarded as a BICSc Accredited Training Organisation from the British Institute of Cleaning Science. We are very pleased with our achievements in 2017, and look forward to pursuing many new opportunities in 2018.
Despite these challenges, CBMFM succeeded in growing their business by successfully managing existing projects, whilst mobilising new projects, as well as being re-awarded contracts with clients that were up for renewal.
42 Mannai Corporation Q.P.S.C
Axiom Telecom
Mannai Corporation has a 35% shareholding interest in Axiom Limited (Axiom).
Axiom is the Middle East’s leading multi-brand, multi-channel distributor of mobile telecommunications handsets, accessories and telecom services.
Axiom employs over 1,876 employees, a portfolio of 350 retail points and reaches over 6,000 points of sale across the region. The Company has a presence in the United Arab Emirates (UAE) & Saudi Arabia (KSA). Axiom generates revenue from the sale and service of mobile handsets and accessories (referred to as "mobile devices") and telecommunications services via its partnerships with mobile telecommunications operators (referred to as "telecom services").
The Company is a strategic partner of major telecommunication operator such as du and Virgin Mobile in the UAE and Zain and STC (KSA). Axiom Telecom sells a full range of products from major brands, including Samsung, Apple, BlackBerry, Huawei, Lenovo, Microsoft, HTC, Sony and LG.
Key strengths:• Middle East handset and telecom
services market leader• Unique partnerships with world’s top
mobility businesses• Multi-brand, omni-channel strategy• Reputation for innovation, including
introducing key products to market ahead of its competitors such as Switch, a mobile phone and gadgets customization service launched earlier this year
• Customer loyalty continually bolstered via a unique range of value-added services
Throughout 2018 and beyond, Axiom aims to ramp up its business by:• Centralizing all their operations in
a newly opened and state of the art Head Offices located in Dubai Silicon Oasis
• Fine-tuning and developing new value added services to pre-empt or to react to customer needs
• Plan to aggressively grow the Ecommerce business and more than double the topline of the business in 2018 across UAE and KSA
• Further develop Switch unique offering by bringing unique customisation services and products
• Continue to leverage existing distribution channels to bring must have products to market ahead of the curve. Some examples are shown below
• Retail Digital Signage (screens): optimization of the new visual language introduced in 2017, placing the customers at the center of the experience
• New Head office to open a Digital Studio, allowing Axiom to produce more engaging and relevant content for its customers such as video reviews, Test Lab reviews and more
• Omni-channel capabilities will be further developed integrating E-commerce, Social Media, Contact Center and Brick & Mortar stores through initiatives such as Click & Collect, 2 hour delivery for online order
• NPS (Net Promoter Score): introduced in 2017 & used to measure customer experience, gain detailed consumer insight, recognize employees who have delivered great service as well as devise action plans over how Axiom can strive to exceed consumer expectations in today’s competitive retail landscape.
Switch:Switch was launched in 2017 as a one-stop-shop for gadget customisation that includes a wide array of customisation services including gold plating, in-store printing of mobile phone cases and AirPods, phone protection services, engraving, and UAE’s first custom paint service for gadgets.
The brand has created awareness primarily through social media and participating in events such as Comic Con that target the millennial generation. Switch’s ecommerce website justswitch.com along with Axiomtelecom.com, has further strengthened the brand’s online presence through ecommerce. Switch has expanded its reach by partnering with online retailers such as Souq, Wadi and Noon.
For 2018, Switch’s focus would be to continue to expand within the region through online and organised retail outlets, including Amazon and Carrefour. There will also be a focus on expanding the customisation offering into more gadgets and specialised products such as gaming consoles, for which there is an increasing demand across the region.
Four mobile:Four was born out of a deep desire to offer mobility to everyone with no restriction on expressing their personalities across all aspects of their lives. Four offers fulfillment and relates to engaging with life (across all four corners of the globe) with energy and self-expression.
Four Mobile continues to reshape itself by providing more advanced products at affordable prices.
The brand continues to grow in the region and has aggressive plans for 2018; both in terms of the range and resources that will be driving the brand strategy.
SalikAxiom has been a distributor for Salik (toll gate) top up vouchers to customers from all points of presence in UAE. Another great initiative from Axiom which provides further convenience to customers who need to top up the credit on their Salik tag.
Axiom Telecom sells a full range of products from major brands, including Samsung, Apple, BlackBerry, Huawei, Lenovo, Microsoft, HTC, Sony and LG.
43Annual Report 2017

44 Mannai Corporation Q.P.S.CMannai Corporation Q.P.S.C

CONSOLIDATED FINANCIAL STATEMENT ANDINDEPENDENT AUDITOR’S REPORTFor the year ended 31 December, 2017
Independent Auditor’s Report
Consolidated Statement of Financial Position
Consolidated Statement of Profit or Loss
Consolidated Statement of Profit or Loss and Other Comprehensive Income
Consolidated Statement of Changes in Equity
Consolidated Statement of Cash Flows
Notes to the Consolidated Financial Statements
46 |
52 |
54 |
55 |
56 |
58 |
60 |
INDEX
45Annual Report 2017

Mannai Corporation Q.P.S.C.
INDEPENDENT AUDITOR’S REPORT
To the Shareholders of Mannai Corporation Q.P.S.C. Doha, State of Qatar
Report on the audit of the consolidated financial statements
Opinion
We have audited the consolidated financial statements of Mannai Corporation Q.P.S.C. (“the Company”), and its subsidiaries (together “the Group”), which comprise the consolidated statement of financial position as at 31 December 2017, the consolidated statements of profit or loss, other comprehensive income, changes in equity and cash flows for the year then ended, and notes, comprising significant accounting policies and other explanatory information.
In our opinion, the accompanying consolidated financial statements present fairly, in all material respects, the consolidated financial position of the Group as at 31 December 2017, and its consolidated financial performance and its consolidated cash flows for the year then ended in accordance with International Financial Reporting Standards (IFRSs).
Basis for opinion
We conducted our audit in accordance with International Standards on Auditing (ISAs). Our responsibilities under those standards are further described in the Auditor’s responsibilities for the audit of the consolidated financial statements section of our report. We are independent of the Group in accordance with the International Ethics Standards
Board for Accountants Code of Ethics for Professional Accountants (IESBA Code) and the ethical requirements that are relevant to our audit of the consolidated financial statements in the State of Qatar, and we have fulfilled our other ethical responsibilities in accordance with these requirements and the IESBA Code. We believe that the audit evidence we have obtained is sufficient and appropriate to provide a basis for our opinion.
Other matter
The consolidated financial statements of the Company as at and for the year ended 31 December 2016 were audited by another auditor who expressed an unmodified opinion on those consolidated financial statements dated 28 February 2017.
Key audit matters
Key audit matters are those matters that, in our professional judgment, were of most significance in our audit of the consolidated financial statements of the current period. These matters were addressed in the context of our audit of the consolidated financial statements as a whole, and in forming our opinion thereon, and we do not provide a separate opinion on these matters.
46 Mannai Corporation Q.P.S.C

Key audit matters How our audit addressed the key audit matters
Carrying value of intangibles with indefinite useful lives and business combination – refer to notes 12,13 and 32 to the consolidated financial statements
We focused on this area because:
• the consolidated financial statements include goodwill and other intangibles (“intangibles”) of QR 4,333 million, including the goodwill embedded in carrying value of investment in an associate company. This represents 37.73% of the Group’s total assets, and hence, a material portion of the consolidated financial position.
• an impairment assessment is required annually to establish whether this intangibles should continue to be recognized at its carrying value or if any impairment is necessary. The impairment assessment relies on evaluation of the recoverable amount of the intangibles in cash generating units (‘CGUs’) using valuation techniques such as discounted future cash flows. The evaluation of the recoverable amount of the intangibles requires significant judgment and estimates, especially on the assumptions used in determining discounted future cash flows.
• the Group acquired an additional 19.9 million shares of Gfi Informatique or “Gfi” during 2017 for a consideration of QR 699 million. In July 2017, the Group obtained control over Gfi and as at 31 December 2017, the Group held 81.21% equity interest in Gfi. The acquisition of Gfi was achieved in stages and management had accounted for the acquisition as a step acquisition in accordance with IFRS 3 “Business Combination”. A goodwill of QR 1,150 million was recognized on this transaction.
• the accounting for this acquisition required fair valuation of the components of the business combination (i.e. assets acquired, liabilities assumed, consideration transferred, acquisition date and a gain or loss arising on derecognition of previously held interest). The fair valuation requires use of valuation techniques requiring significant judgment and estimates.
Our audit procedures in this area included, among other things:
• evaluating the Group’s controls around the budgeting process upon which the forecasts are based;
• obtaining and analyzing the approved business plans for each subject CGU;
• evaluating whether the impairment assessment models prepared by the management to determine recoverable amount is in accordance with steps mentioned in IAS 36 “Impairment of non-financial assets”;
• involving our own valuation specialists to assist us in:
› evaluating the appropriateness of methodology used by the Group in determining recoverable amount;
› evaluating key inputs and assumptions used by the management in preparing impairment assessment models such as growth rates in sales and margins, discount rates, terminal growth rates and comparing actual historic performance of the CGU against the stated business plans;
› testing the identification and fair valuation of the identifiable assets and liabilities against available market data;
› checking management computations of gain arising on derecognition of previously held interest upon step acquisition; and
› assessing the adequacy of the Group’s disclosures in relation to the intangibles impairment assessment and business combination achieved in stages by reference to the relevant accounting standards.
47Annual Report 2017
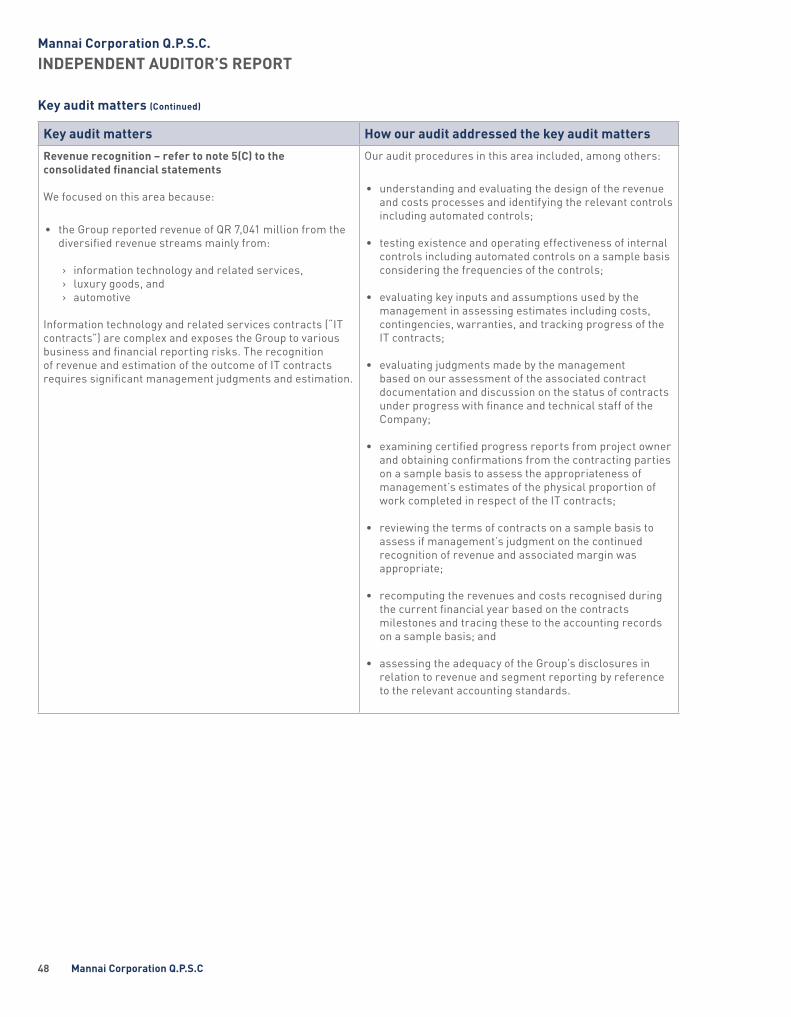
Mannai Corporation Q.P.S.C.
INDEPENDENT AUDITOR’S REPORT
Key audit matters How our audit addressed the key audit matters
Revenue recognition – refer to note 5(C) to the consolidated financial statements
We focused on this area because:
• the Group reported revenue of QR 7,041 million from the diversified revenue streams mainly from:
› information technology and related services, › luxury goods, and › automotive
Information technology and related services contracts (“IT contracts”) are complex and exposes the Group to various business and financial reporting risks. The recognition of revenue and estimation of the outcome of IT contracts requires significant management judgments and estimation.
Our audit procedures in this area included, among others:
• understanding and evaluating the design of the revenue and costs processes and identifying the relevant controls including automated controls;
• testing existence and operating effectiveness of internal controls including automated controls on a sample basis considering the frequencies of the controls;
• evaluating key inputs and assumptions used by the management in assessing estimates including costs, contingencies, warranties, and tracking progress of the IT contracts;
• evaluating judgments made by the management based on our assessment of the associated contract documentation and discussion on the status of contracts under progress with finance and technical staff of the Company;
• examining certified progress reports from project owner and obtaining confirmations from the contracting parties on a sample basis to assess the appropriateness of management’s estimates of the physical proportion of work completed in respect of the IT contracts;
• reviewing the terms of contracts on a sample basis to assess if management’s judgment on the continued recognition of revenue and associated margin was appropriate;
• recomputing the revenues and costs recognised during the current financial year based on the contracts milestones and tracing these to the accounting records on a sample basis; and
• assessing the adequacy of the Group’s disclosures in relation to revenue and segment reporting by reference to the relevant accounting standards.
Key audit matters (Continued)
48 Mannai Corporation Q.P.S.C

Mannai Corporation Q.P.S.C.
INDEPENDENT AUDITOR’S REPORT
Key audit matters How our audit addressed the key audit matters
Existence and valuation of inventories – refer to note 5(G) and note 9 to the consolidated financial statements
We focused on this area because:
• the consolidated financial statements include inventories of QR 2,083 million. This represents 17.73% of the Group’s total assets, hence, a material portion of the consolidated financial position.
• inventories mainly comprise work in progress related to IT contracts, luxury goods (gold and jewelleries), contracts and automotive inventories. Further, inventories are located in multiple locations.
• valuation of inventories, in particular gold and jewelleries and work in progress from IT contracts require significant management judgment and estimate
• Our audit procedures in this area included, among others:
• understanding and evaluating the design of the inventory processes and identifying the relevant controls including automated controls;
• testing existence and operating effectiveness of internal controls, including the automated controls, on samples of transactions based on the frequencies of the controls;
• evaluating the appropriateness of methodology used by the Group in estimating net realizable values for sample of transactions;
• assessing the adequacy of the management instructions sent to the staff responsible for physical counts at all the locations;
• observing the inventory counts performed by the management for all material location;
• evaluating key inputs and assumptions used by the management in assessing provision against slow and/or non-moving inventories;
• evaluating the recoverable amount of the work-in-progress recognized on the IT contracts by critically assessing management’s assessment of the risk of customers defaulting for a sample of contracts; and
• assessing the adequacy of the Group’s disclosures in relation to inventories by reference to the relevant accounting standards.
49Annual Report 2017

Mannai Corporation Q.P.S.C.
INDEPENDENT AUDITOR’S REPORT
Other information
The Board of Directors is responsible for the other information. The other information comprises the information included in the Group’s Annual Report of 2017 but does not include the consolidated financial statements and our auditor’s report thereon. Prior to date of this auditor’s report, we obtained the Board of Directors’ report which forms part of the Annual Report, and the remaining sections of the Annual Report are expected to be made available to us after that date.
Our opinion on the consolidated financial statements does not cover the other information and we do not express any form of assurance or conclusion thereon.
In connection with our audit of the consolidated financial statements, our responsibility is to read the other information identified above and, in doing so, consider whether the other information is materially inconsistent with the consolidated financial statements or our knowledge obtained in the audit, or otherwise appears to be materially misstated.
If, based on the work we have performed on the other information that we have obtained prior to the date of this auditor’s report, we conclude that there is a material misstatement of this other information, we are required to report that fact. We have nothing to report in this regard.
Responsibilities of the Board of Directors for the consolidated financial statements
The Board of Directors is responsible for the preparation and fair presentation of the consolidated financial statements in accordance with IFRS, and for such internal control as the Board of Directors determines is necessary to enable the preparation of consolidated financial statements that are free from material misstatement, whether due to fraud or error.
In preparing the consolidated financial statements, the Board of Directors is responsible for assessing the Group’s ability to continue as a going concern, disclosing, as applicable, matters related to going concern and using the going concern basis of accounting unless the Board of Directors either intends to liquidate the Group or to cease operations, or has no realistic alternative but to do so.
Auditor’s responsibilities for the audit of the consolidated financial statements
Our objectives are to obtain reasonable assurance about whether the consolidated financial statements as a whole are free from material misstatement, whether due to fraud or error, and to issue an auditor’s report that includes our opinion. Reasonable assurance is a high level of assurance, but is not a guarantee that an audit conducted in accordance with ISAs will always detect a material misstatement when
it exists. Misstatements can arise from fraud or error and are considered material if, individually or in the aggregate, they could reasonably be expected to influence the economic decisions of users taken on the basis of these consolidated financial statements.
As part of an audit in accordance with ISA’s, we exercise professional judgment and maintain professional scepticism throughout the audit. We also
• identify and assess the risks of material misstatement of the consolidated financial statements, whether due to fraud or error, design and perform audit procedures responsive to those risk, and obtain audit evidence that is sufficient and appropriate to provide a basis for our opinion. The risk of not detecting a material misstatement resulting from fraud is higher than the one resulting from error, as fraud may involve collusion, forgery, intentional omission, misrepresentations, or the override of internal control.
• obtain an understanding of internal control relevant to the audit in order to design audit procedures that are appropriate in the circumstances, but not for the purpose of expressing an opinion on the effectiveness of the internal control.
• evaluate the appropriateness of accounting policies used and the reasonableness of accounting estimates and related disclosures made by the Board of Directors.
• conclude on the appropriateness of the Board of Directors’ use of the going concern basis of accounting and based on the audit evidence obtained, whether a material uncertainty exists related to events or conditions that may cast significant doubt on the Group’s ability to continue as a going concern. If we conclude that a material uncertainty exists, we are required to draw attention in our auditor’s report to the related disclosures in the consolidated financial statements or, if such disclosure is inadequate, to modify our opinion. Our conclusions are based on the audit evidence obtained up to the date of our auditor’s report. However, future events or conditions may cause the Group to cease to continue as a going concern.
• evaluate the overall presentation, structure and content of the consolidated financial statements, including the disclosures, and whether the consolidated financial statements represent the underlying transactions and events in a manner that achieves fair presentation.
• obtain sufficient appropriate audit evidence regarding the financial information of the entities or business activities within the Group to express an opinion on the consolidated financial statements. We are responsible for the direction, supervision and performance of the group audit. We remain solely responsible for our audit opinion.
50 Mannai Corporation Q.P.S.C

Mannai Corporation Q.P.S.C.
INDEPENDENT AUDITOR’S REPORT
We communicate with the Board of Directors regarding, among other matters, the planned scope and timing of the audit and significant audit findings, including any significant deficiencies in internal control that we identify during our audit.
We also provide the Board of Directors with a statement that we have complied with relevant ethical requirements regarding independence, and to communicate with them all relationships and other matters that may reasonably be thought to bear on our independence, and where applicable, related safeguards.
From the matters communicated with the Board of Directors, we determine those matters that were of most significance in the audit of the consolidated financial statements of the current year and are therefore the key audit matters. We describe these matters in our auditor’s report unless law and regulations preclude public disclosure about the matter or when, in extremely rare circumstances, we determine that a matter should not be communicated in our report because the adverse consequences of doing so would reasonably be expected to outweigh the public interest benefits of such communication.
Report on other legal and regulatory requirements
We have obtained all the information and explanations we considered necessary for the purposes of our audit. The Company has maintained proper accounting records and its consolidated financial statements are in agreement therewith. Furthermore, the physical count of the Company’s inventories was carried out in accordance with the established principles. We have read the report of the Board of Directors to be included in the Annual Report and the financial information contained therein is in agreement with the books and records of the Company. We are not aware of any violations of the provisions of the Qatar Commercial Companies Law No. 11 of 2015 or the terms of the Company’s Articles of Association and any amendments thereto having occurred during the year which might have had a material adverse effect on the Company or on its consolidated financial position as at 31 December 2017.
28 February 2018DohaState of Qatar
Gopal BalasubramaniamQatar Auditors’ Registry Number No. 251KPMGLicensed by QFMA: External Auditor’sLicense No. 120153
51Annual Report 2017
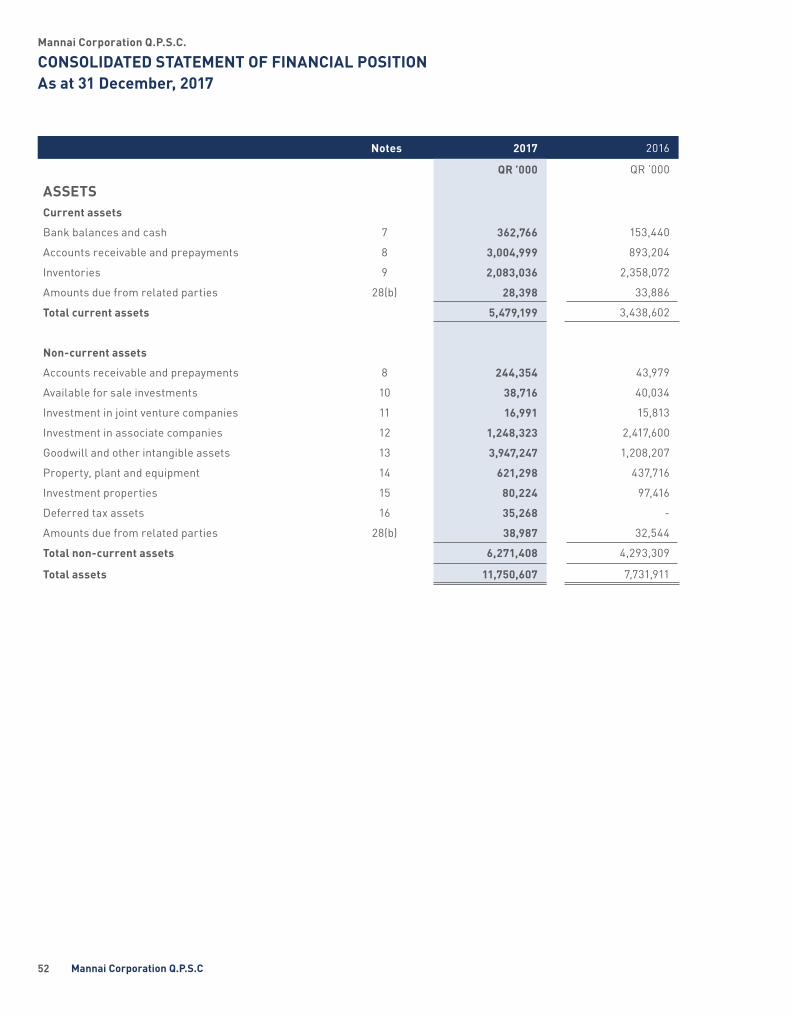
Mannai Corporation Q.P.S.C.
CONSOLIDATED STATEMENT OF FINANCIAL POSITIONAs at 31 December, 2017
Notes 2017 2016
QR ’000 QR ’000
ASSETSCurrent assets
Bank balances and cash 7 362,766 153,440
Accounts receivable and prepayments 8 3,004,999 893,204
Inventories 9 2,083,036 2,358,072
Amounts due from related parties 28(b) 28,398 33,886
Total current assets 5,479,199 3,438,602
Non-current assets
Accounts receivable and prepayments 8 244,354 43,979
Available for sale investments 10 38,716 40,034
Investment in joint venture companies 11 16,991 15,813
Investment in associate companies 12 1,248,323 2,417,600
Goodwill and other intangible assets 13 3,947,247 1,208,207
Property, plant and equipment 14 621,298 437,716
Investment properties 15 80,224 97,416
Deferred tax assets 16 35,268 -
Amounts due from related parties 28(b) 38,987 32,544
Total non-current assets 6,271,408 4,293,309
Total assets 11,750,607 7,731,911
52 Mannai Corporation Q.P.S.C

Mannai Corporation Q.P.S.C.
CONSOLIDATED STATEMENT OF FINANCIAL POSITIONAs at 31 December, 2017
Notes 2017 2016
QR ’000 QR ’000
LIABILITIES AND EQUITYLiabilities
Current liabilities
Bank overdrafts 7 385,164 165,213
Interest bearing loans and borrowings 17 2,113,609 1,377,917
Accounts payable and accruals 18 3,284,101 1,171,587
Amounts due to related parties 28(b) 5,280 2,426
Total current liabilities 5,788,154 2,717,143
Non-current liabilities
Deferred tax liabilities 16 9,571 -
Interest bearing loans and borrowings 17 2,548,272 2,306,310
Accounts payable and accruals 18 148,798 18,066
Employees’ end of service benefits 19 311,913 112,235
Total non-current liabilities 3,018,554 2,436,611
Total liabilities 8,806,708 5,153,754
Equity
Share capital 20 456,192 456,192
Legal reserve 21(a) 1,083,456 1,083,456
Acquisition reserve 21(b) (588,058) (588,058)
Other reserve 21(c) (371,203) 4,630
Foreign currency translation reserve 21(d) 12,550 (143,743)
Proposed dividends 182,477 182,477
Retained earnings 1,900,164 1,583,312
Equity attributable to shareholders of the Company 2,675,578 2,578,266
Non-controlling interests 268,321 (109)
Total equity 2,943,899 2,578,157
Total liabilities and equity 11,750,607 7,731,911
These consolidated financial statements were approved by the Board of Directors and authorised for issue on 28 February 2018.
……………………………………… …………………………………..
Sheikh Suhaim Bin Abdulla Al-ThaniVice Chairman
Alekh GrewalDirector and Group Chief Executive Officer
53Annual Report 2017
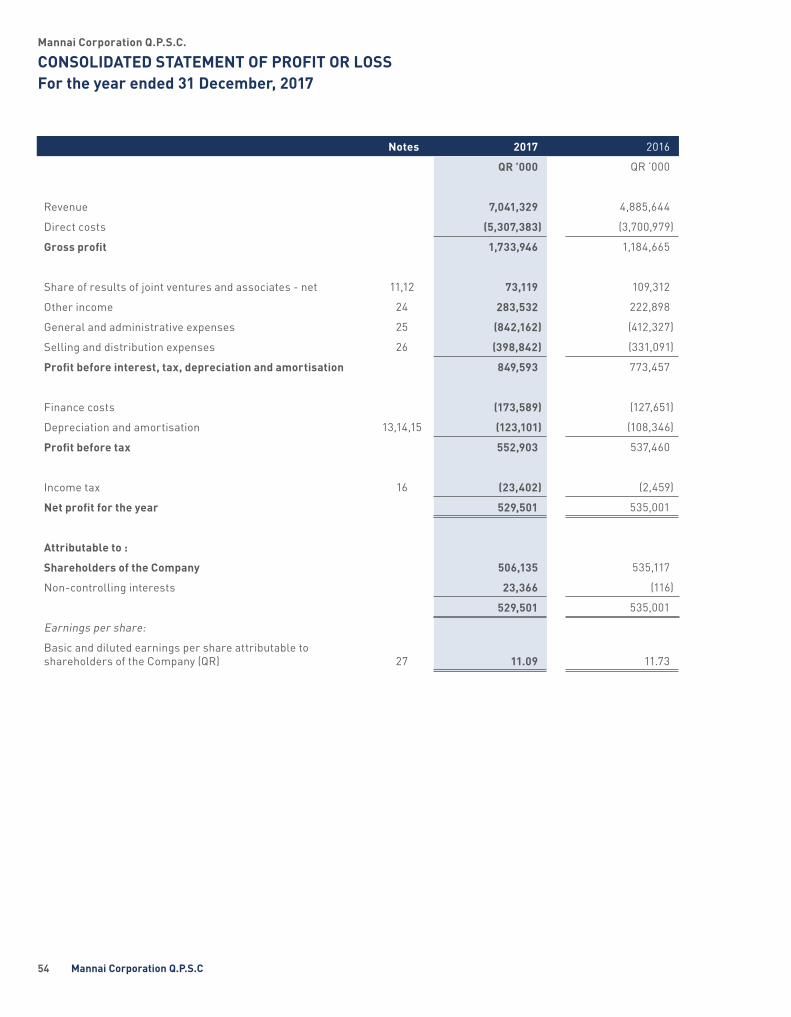
Mannai Corporation Q.P.S.C.
CONSOLIDATED STATEMENT OF PROFIT OR LOSSFor the year ended 31 December, 2017
Notes 2017 2016
QR ’000 QR ’000
Revenue 7,041,329 4,885,644
Direct costs (5,307,383) (3,700,979)
Gross profit 1,733,946 1,184,665
Share of results of joint ventures and associates - net 11,12 73,119 109,312
Other income 24 283,532 222,898
General and administrative expenses 25 (842,162) (412,327)
Selling and distribution expenses 26 (398,842) (331,091)
Profit before interest, tax, depreciation and amortisation 849,593 773,457
Finance costs (173,589) (127,651)
Depreciation and amortisation 13,14,15 (123,101) (108,346)
Profit before tax 552,903 537,460
Income tax 16 (23,402) (2,459)
Net profit for the year 529,501 535,001
Attributable to :
Shareholders of the Company 506,135 535,117
Non-controlling interests 23,366 (116)
529,501 535,001
Earnings per share:
Basic and diluted earnings per share attributable to shareholders of the Company (QR) 27
11.09
11.73
54 Mannai Corporation Q.P.S.C
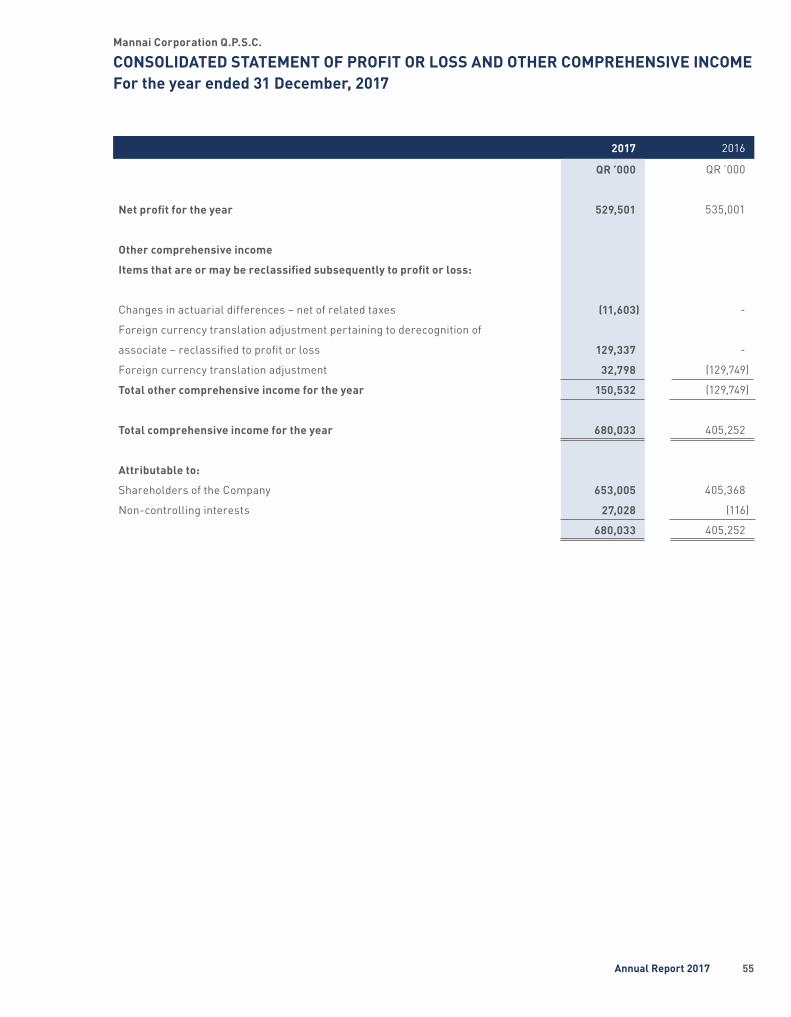
Mannai Corporation Q.P.S.C.
CONSOLIDATED STATEMENT OF PROFIT OR LOSS AND OTHER COMPREHENSIVE INCOMEFor the year ended 31 December, 2017
2017 2016
QR ’000 QR ’000
Net profit for the year 529,501 535,001
Other comprehensive income
Items that are or may be reclassified subsequently to profit or loss:
Changes in actuarial differences – net of related taxes (11,603) -
Foreign currency translation adjustment pertaining to derecognition of
associate – reclassified to profit or loss 129,337 -
Foreign currency translation adjustment 32,798 (129,749)
Total other comprehensive income for the year 150,532 (129,749)
Total comprehensive income for the year 680,033 405,252
Attributable to:
Shareholders of the Company 653,005 405,368
Non-controlling interests 27,028 (116)
680,033 405,252
55Annual Report 2017
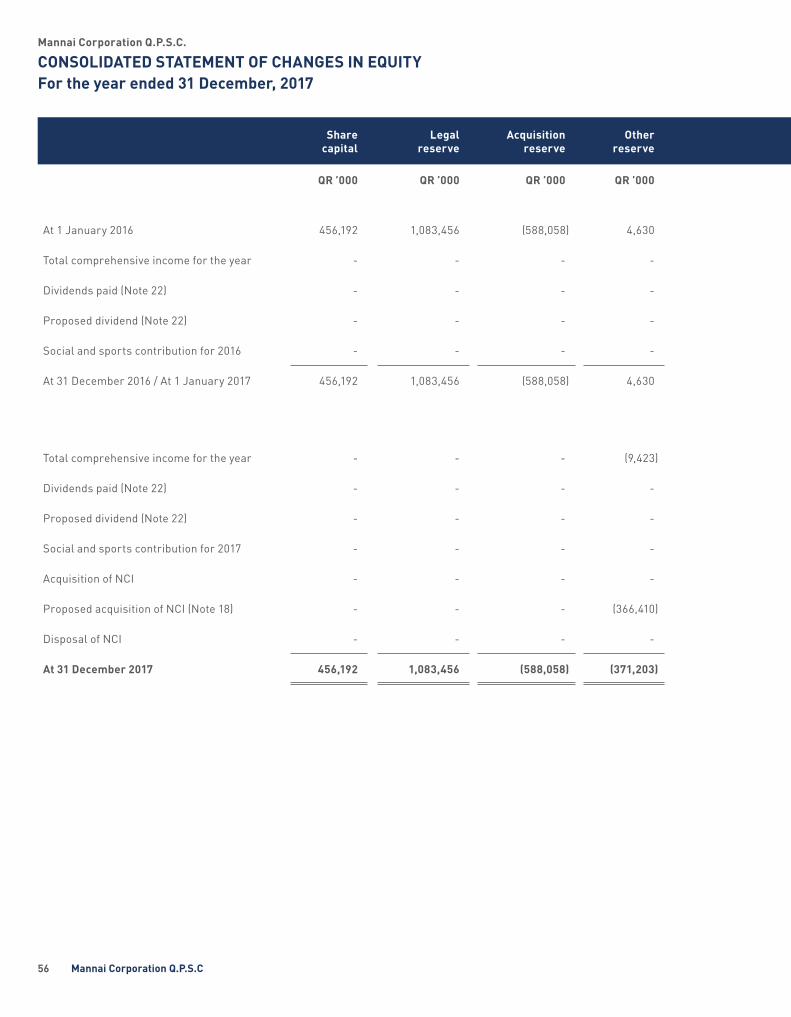
Mannai Corporation Q.P.S.C.
CONSOLIDATED STATEMENT OF CHANGES IN EQUITYFor the year ended 31 December, 2017
Sharecapital
Legalreserve
Acquisition reserve
Other reserve
Foreign currency translation
reserve
Proposed dividends
Retained earnings
Equity attributable to shareholders of the
Company
Non-controlling interests Total
QR ’000 QR ’000 QR ’000 QR ’000 QR ’000 QR ’000 QR ’000 QR ’000 QR ’000 QR ’000
At 1 January 2016 456,192 1,083,456 (588,058) 4,630 (13,994) 228,096 1,238,093 2,408,415 7 2,408,422
Total comprehensive income for the year - - - - (129,749) - 535,117 405,368 (116) 405,252
Dividends paid (Note 22) - - - - - (228,096) - (228,096) - (228,096)
Proposed dividend (Note 22) - - - - - 182,477 (182,477) - - -
Social and sports contribution for 2016 - - - - - - (7,421) (7,421) - (7,421)
At 31 December 2016 / At 1 January 2017 456,192 1,083,456 (588,058) 4,630 (143,743) 182,477 1,583,312 2,578,266 (109) 2,578,157
Total comprehensive income for the year - - - (9,423) 156,293 - 506,135 653,005 27,028 680,033
Dividends paid (Note 22) - - - - - (182,477) - (182,477) - (182,477)
Proposed dividend (Note 22) - - - - - 182,477 (182,477) - - -
Social and sports contribution for 2017 - - - - - - (6,806) (6,806) - (6,806)
Acquisition of NCI - - - - - - - - 241,393 241,393
Proposed acquisition of NCI (Note 18) - - - (366,410) - - - (366,410) - (366,410)
Disposal of NCI - - - - - - - - 9 9
At 31 December 2017 456,192 1,083,456 (588,058) (371,203) 12,550 182,477 1,900,164 2,675,578 268,321 2,943,899
56 Mannai Corporation Q.P.S.C
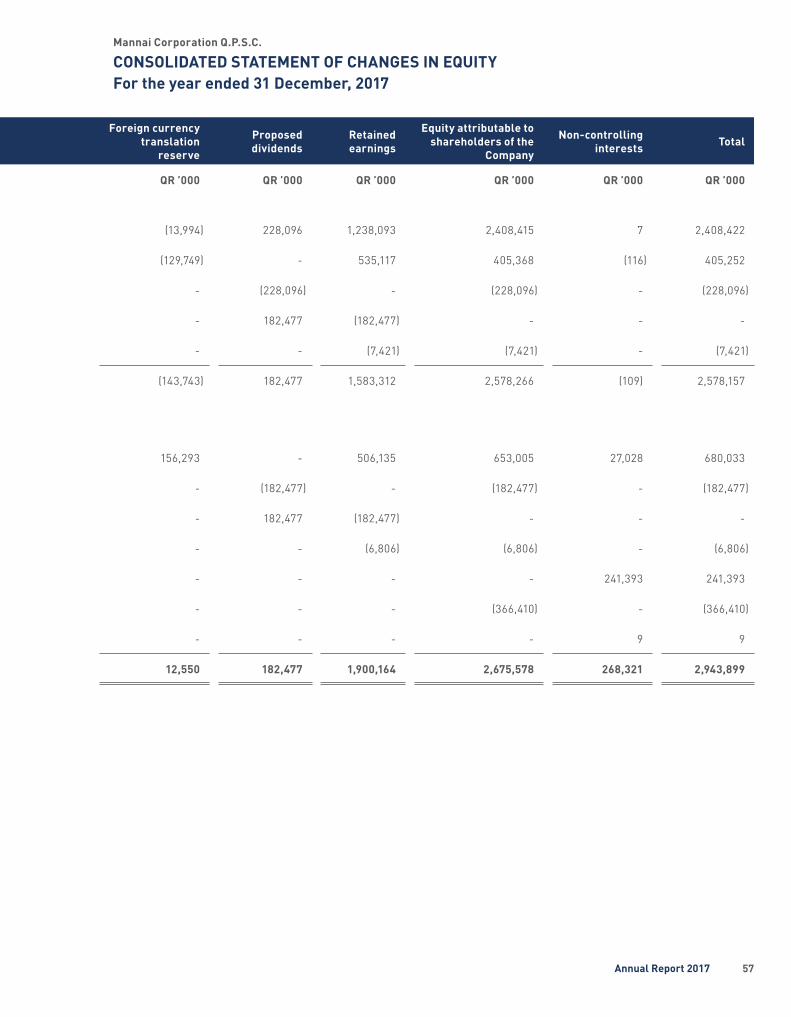
Mannai Corporation Q.P.S.C.
CONSOLIDATED STATEMENT OF CHANGES IN EQUITYFor the year ended 31 December, 2017
Sharecapital
Legalreserve
Acquisition reserve
Other reserve
Foreign currency translation
reserve
Proposed dividends
Retained earnings
Equity attributable to shareholders of the
Company
Non-controlling interests Total
QR ’000 QR ’000 QR ’000 QR ’000 QR ’000 QR ’000 QR ’000 QR ’000 QR ’000 QR ’000
At 1 January 2016 456,192 1,083,456 (588,058) 4,630 (13,994) 228,096 1,238,093 2,408,415 7 2,408,422
Total comprehensive income for the year - - - - (129,749) - 535,117 405,368 (116) 405,252
Dividends paid (Note 22) - - - - - (228,096) - (228,096) - (228,096)
Proposed dividend (Note 22) - - - - - 182,477 (182,477) - - -
Social and sports contribution for 2016 - - - - - - (7,421) (7,421) - (7,421)
At 31 December 2016 / At 1 January 2017 456,192 1,083,456 (588,058) 4,630 (143,743) 182,477 1,583,312 2,578,266 (109) 2,578,157
Total comprehensive income for the year - - - (9,423) 156,293 - 506,135 653,005 27,028 680,033
Dividends paid (Note 22) - - - - - (182,477) - (182,477) - (182,477)
Proposed dividend (Note 22) - - - - - 182,477 (182,477) - - -
Social and sports contribution for 2017 - - - - - - (6,806) (6,806) - (6,806)
Acquisition of NCI - - - - - - - - 241,393 241,393
Proposed acquisition of NCI (Note 18) - - - (366,410) - - - (366,410) - (366,410)
Disposal of NCI - - - - - - - - 9 9
At 31 December 2017 456,192 1,083,456 (588,058) (371,203) 12,550 182,477 1,900,164 2,675,578 268,321 2,943,899
57Annual Report 2017

Mannai Corporation Q.P.S.C.
CONSOLIDATED STATEMENT OF CASH FLOWSFor the year ended 31 December, 2017
Notes 2017 2016
QR ’000 QR ’000
OPERATING ACTIVITIES
Profit for the year before tax 552,903 537,460
Adjustments for:
Impairment loss on accounts receivables, net 8 4,131 8,621
Share of results from joint ventures and associates 11,12 (73,119) (109,312)
Depreciation and amortisation 13,14,15 123,101 108,346
Impairment of property, plant and equipment 625 3,160
Reversal of impairment on investment properties 15 (8,901) -
Provision for employees’ end of service benefits 19 30,513 20,390
Gain on previously held interest in an acquired subsidiary 24 (165,950) -
Impairment on available for sale investment, associates and joint ventures, net 1,776 2,384
Allowance for doubtful advance 4,358 1,641
Write back of provisions/liabilities no longer required (13,901) (7,663)
Write back of provision for obsolete and slow moving items, net (6,683) (6,854)
Gain on disposals of property, plant and equipment (9,035) (3,407)
Gain on disposals of investment properties - (28)
Gain on operating lease premium received on closed shops (6,318) (6,909)
Finance income (4,320) (2,342)
Finance costs 173,589 127,651
Operating profit before working capital changes 602,769 673,138
Working capital changes:
Accounts receivables and prepayments (156,694) 92,200
Inventories 284,764 278,931
Amounts due from/to related parties 4,326 (11,743)
Accounts payable and accruals (215,278) (365,489)
Cash from operations 519,887 667,037
Finance costs paid (168,328) (119,508)
Employees’ end of service benefits paid 19 (26,439) (20,706)
Social and sports contribution paid (7,421) (7,579)
Net cash generated from operating activities 317,699 519,244
58 Mannai Corporation Q.P.S.C

Mannai Corporation Q.P.S.C.
CONSOLIDATED STATEMENT OF CASH FLOWSFor the year ended 31 December, 2017
Notes 2017 2016
QR ’000 QR ’000
INVESTING ACTIVITIES
Dividend received from joint ventures and associates 12 70,755 87,827
Acquisition of investment in associates 12 (1,703) (1,329,726)
Addition to intangible assets 13 (53,616) (559)
Purchases of property, plant and equipment 14 (176,831) (143,777)
Proceeds from disposal of property, plant and equipment 53,220 16,531
Proceeds from disposal of investment properties - 594
Proceeds from available for sale of investment - 2,032
Proceeds from disposal of operating lease premium 6,318 6,941
Interest received 1,639 2,134
Net cash outflows from acquisition of a subsidiary (699,397) -
Net cash used in investing activities (799,615) (1,358,003)
FINANCING ACTIVITIES
Net movements in interest bearing loans and borrowings 653,890 1,187,493
Dividend paid 22 (182,477) (227,858)
Net cash generated from financing activities 471,413 959,635
NET CHANGE IN CASH AND CASH EQUIVALENTS (10,503) 120,876
Cash and cash equivalents at the beginning of the year (25,032) (145,908)
CASH AND CASH EQUIVALENTS AT THE END OF THE YEAR 7 (35,535) (25,032)
59Annual Report 2017

Mannai Corporation Q.P.S.C.
NOTES TO THE CONSOLIDATED FINANCIAL STATEMENTSFor the year ended 31 December, 2017
01. REPORTING ENTITY
Mannai Corporation Q.P.S.C. (the “Company”) is registered as a Qatari Shareholding Company in the State of Qatar with the Ministry of Economy and Commerce under Commercial Registration Number 12. The registered office of the Company is situated in Doha, State of Qatar. The Company is listed on the Qatar Stock Exchange.
The core activities of the Company and its subsidiaries (together referred to as the “Group”) include information and communication technology, automotive and heavy equipment distribution and service, geotechnical, geological, environmental and material testing services, engineering
services to the oil and gas sector, logistics and warehousing, office systems, medical equipment, building materials, travel services, home appliances and electronics, trading and representation, facilities maintenance and management services and trading in gold and gold jewellery, diamond jewellery, pearls, watches, silver and precious stones on wholesale and retail basis.
The consolidated financial statements include the financial statements of the Company and its controlled subsidiaries listed below:
Group’s effective shareholding percentage
Name of subsidiaries Principal Activities Country of incorporation 2017 2016
Mannai Trading Company W.L.L. Trading and services Qatar 100 100
Manweir L.L.C. Engineering Qatar 100 100
Gulf Laboratories Company W.L.L. Geotechnical services Qatar 100 100
Space Travel W.L.L. Travel Qatar 100 100
Al Mannai Travels L.L.C. Travel UAE 100 -
Qatar Logistics W.L.L. Logistics Qatar 100 100
Technical Services Company W.L.L. Representations Qatar 100 100
Mansoft Qatar W.L.L. Information technology Qatar 100 100
Mansoft Solutions and Systems (UAE) L.L.C. Information technology UAE 100 100
Gfi Informatique India Private Limited Information technology India 100 100
Gulf Geotechnical Services and Material Testing L.L.C. Geotechnical services Oman 100 100
Global Trading Center FZCO Auto UAE - 100
Damas International Limited Jewellery trading UAE 100 100
Global Motor Sports S.P.C. Auto Qatar 100 100
NYX Information Technology Information technology Turkey 100 100
GTC Otomotiv Anonim Sirketi Auto Turkey 100 100
Mannai Network & Solution L.L.C. Information technology Oman 100 100
Damas L.L.C. Jewellery trading UAE 100 100
Damas Jewellery L.L.C. Jewellery trading UAE 100 100
Damas Jewellery D.M.C.C. Jewellery trading UAE 100 100
Damas Folli Follie L.L.C. Jewellery trading UAE 100 100
Ayodhya Jewellers L.L.C. Jewellery trading UAE 100 100
The Watch Studio L.L.C. Jewellery trading UAE 100 100
Arshi Jewellery L.L.C. Jewellery trading UAE - 75
60 Mannai Corporation Q.P.S.C

Mannai Corporation Q.P.S.C.
NOTES TO THE CONSOLIDATED FINANCIAL STATEMENTSFor the year ended 31 December, 2017
Group’s effective shareholding percentage
Name of subsidiaries Principal Activities Country of incorporation 2017 2016
Damas Jewellery Manufacturing Company Jewellery trading UAE 100 100
Damas SPV Jewellery L.L.C. Jewellery trading UAE 100 100
Premium Investments International L.L.C. Jewellery trading UAE 100 100
Damas SPV Jewellery L.L.C. Jewellery trading UAE 100 100
Gem Universe L.L.C. Jewellery trading Oman 100 100
Damas Company W.L.L. Jewellery trading Bahrain 100 100
Damas Jewellery Kuwait Company W.L.L. Jewellery trading Kuwait 100 100
Damas Saudi Arabia Company Limited Jewellery trading KSA 100 100
Damas Accessories L.L.C. Jewellery trading KSA 100 100
Ayodhya Jewellery L.L.C. Jewellery trading KSA 100 100
Golden Investments Limited Investing UAE 100 100
Golden Investments Holdings Limited Investing UAE 100 100
Golden Investments Services Limited Investing UAE 100 100
Gfi Informatique SA Information technology France 81.21 -
Gfi Progiciels SAS Software services France 81.21 -
Cognitis France SAS Consulting, Applications services and Business solutions France 81.21 -
Addstones SAS Consulting, Applications services and Business solutions France 81.21 -
Gfi Informatique Telecom SASU Consulting, Applications Services and Business solutions France 81.21 -
Business Document SAS Software services France 81.21 -
Gfi Infogen Systems SAS Consulting, Applications Services and Business solutions France 81.21 -
Gfi Informatique Production SA Infrastructures Services France 81.05 -
Gfi Informatique Enterprise Solutions SA Software services France 81.21 -
Novulys SA Applications services France 52.79 -
Metaware Technologies SA Applications services France 81.21 -
Gfi Business - Transformation SAS Consulting, Applications Services and Business solutions France 81.21 -
S.C.I. Gifimo Real estate company France 81.21 -
SCI via Domitia Real estate company France 81.21 -
Awak'IT (S&I) SAS Consulting, Applications services and Business solutions France 81.21 -
Tikawa Productions SARL Consulting, Applications services and Business solutions France 81.21 -
ITN Consultants SAS Software services France 81.21 -
Gfi 7 SARL Consulting services France 81.21 -
61Annual Report 2017

Mannai Corporation Q.P.S.C.
NOTES TO THE CONSOLIDATED FINANCIAL STATEMENTSFor the year ended 31 December, 2017
Group’s effective shareholding percentage
Name of subsidiaries Principal Activities Country of incorporation 2017 2016
Gfi 8 SARL Consulting services France 81.21 -
Gfi 9 SARL Consulting services France 81.21 -
Gfi Conseil et Integration de Solutions SASU Consulting services France 56.85 -
Gfi Benelux Consulting, Applications services and Business solutions Belgium 81.21 -
Gfi NV Consulting, Applications services and Business solutions Belgium 81.21 -
Gfi PSF SARL Software services Luxembourg 81.21 -
Gfi Infrastructure Services SA Consulting, Applications services and Business solutions Luxembourg 81.21 -
Impaq Sp. z.o.o. Consulting, Applications services and Business solutions Poland 81.21 -
IT skills Sp. z.o.o. Applications services Poland 81.21 -
Impaq UK Limited Business solutions United Kingdom 81.21 -
Gfi International Applications services Switzerland 81.21 -
Impaq AG Consulting services Switzerland 81.21 -
Grupo Corporativo Gfi Informatica SA Applications and Infrastructures services Spain 81.21 -
Gfi Levante SL Consulting, Applications services and Business solutions Spain 81.21 -
Gfi Cataluna Grupo Corporativo SA Applications and Infrastructures services Spain 81.21 -
Gfi Cataluna Grupo Corporativo Gfi Norte Applications and Infrastructures services Spain 81.21 -
Advanced Software Technologies SA SAP services Spain 81.21 -
Savac Consultores SL Software services Spain 81.21 -
Efron Consulting SL Applications and Infrastructures services Spain 81.21 -
Efron Colombia SAS Applications and Infrastructures services Colombia 81.21 -
Efromex Consulting SA Applications and Infrastructures services Mexico 81.21 -
Efron Consulting Inc. Applications and Infrastructures services USA 81.21 -
Gfi Portugal - Technologias de Informacao, SA Consulting, Applications services and Business solutions Portugal 81.21 -
Roff Consultores Independetes SA SAP services Portugal 81.21 -
Roff SDF lda Consulting services Portugal 81.21 -
RoffMex Consulting SA de C.V. SAP services Mexico 56.85 -
01. REPORTING ENTITY (Continued)
62 Mannai Corporation Q.P.S.C
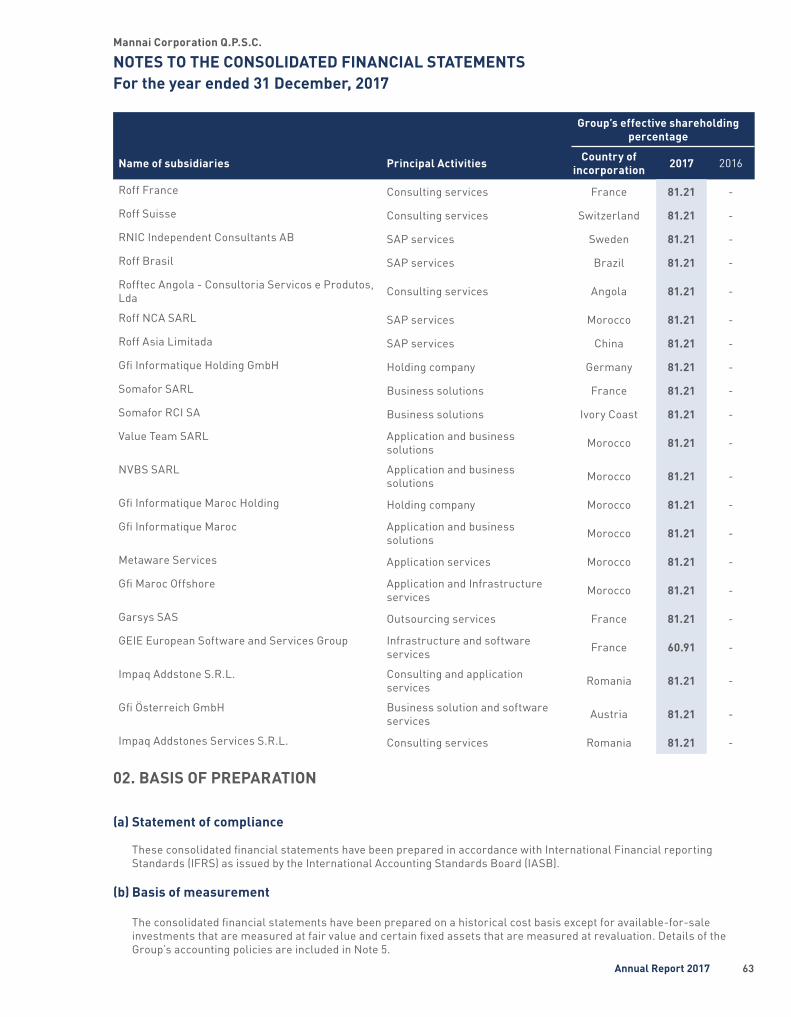
Mannai Corporation Q.P.S.C.
NOTES TO THE CONSOLIDATED FINANCIAL STATEMENTSFor the year ended 31 December, 2017
Group’s effective shareholding percentage
Name of subsidiaries Principal Activities Country of incorporation 2017 2016
Roff France Consulting services France 81.21 -
Roff Suisse Consulting services Switzerland 81.21 -
RNIC Independent Consultants AB SAP services Sweden 81.21 -
Roff Brasil SAP services Brazil 81.21 -
Rofftec Angola - Consultoria Servicos e Produtos, Lda Consulting services Angola 81.21 -
Roff NCA SARL SAP services Morocco 81.21 -
Roff Asia Limitada SAP services China 81.21 -
Gfi Informatique Holding GmbH Holding company Germany 81.21 -
Somafor SARL Business solutions France 81.21 -
Somafor RCI SA Business solutions Ivory Coast 81.21 -
Value Team SARL Application and business solutions Morocco 81.21 -
NVBS SARL Application and business solutions Morocco 81.21 -
Gfi Informatique Maroc Holding Holding company Morocco 81.21 -
Gfi Informatique Maroc Application and business solutions Morocco 81.21 -
Metaware Services Application services Morocco 81.21 -
Gfi Maroc Offshore Application and Infrastructure services Morocco 81.21 -
Garsys SAS Outsourcing services France 81.21 -
GEIE European Software and Services Group Infrastructure and software services France 60.91 -
Impaq Addstone S.R.L. Consulting and application services Romania 81.21 -
Gfi Österreich GmbH Business solution and software services Austria 81.21 -
Impaq Addstones Services S.R.L. Consulting services Romania 81.21 -
02. BASIS OF PREPARATION
(a) Statement of compliance
These consolidated financial statements have been prepared in accordance with International Financial reporting Standards (IFRS) as issued by the International Accounting Standards Board (IASB).
(b) Basis of measurement
The consolidated financial statements have been prepared on a historical cost basis except for available-for-sale investments that are measured at fair value and certain fixed assets that are measured at revaluation. Details of the Group’s accounting policies are included in Note 5.
63Annual Report 2017

Mannai Corporation Q.P.S.C.
NOTES TO THE CONSOLIDATED FINANCIAL STATEMENTSFor the year ended 31 December, 2017
03. FUNCTIONAL AND PRESENTATION CURRENCY
These consolidated financial statements are presented in Qatari Riyals, which is the Company’s functional and presentation currency. All amounts have been rounded to the nearest thousand, unless otherwise indicated.
04. APPLICATION OF NEW AND REVISED INTERNATIONAL FINANCIAL REPORTING STANDARDS (IFRSs)
4.1 New standards, amendments and interpretations effective from 1 January 2017
The following standards, amendments and interpretations, which became effective as of 1 January 2017, are relevant to the Group:
a) Disclosure Initiative (Amendments to IAS 7)
The amendments require disclosures that enable users of financial statements to evaluate changes in liabilities arising from financing activities, including both changes arising from cash flow and non-cash changes.
The amendments are effective for annual periods beginning on or after 1 January 2017 on prospective basis.
b) Recognition of Deferred Tax Assets for Unrealised Losses (Amendments to IAS 12)
The amendments clarify the accounting for deferred tax assets for unrealised losses on debt instruments measured at fair value.
The amendments clarify that the existence of a deductible temporary difference depends solely on a comparison of the carrying amount of an asset and its tax base at the end of the reporting period, and is not affected by possible future changes in the carrying amount or expected manner of recovery of the asset. Therefore, assuming that the tax base remains at the original cost of the debt instrument, there is a temporary difference.
The amendments are effective for annual periods beginning on or after 1 January 2017.
The adoption of this standard had not significant impact on the consolidated financial statements.
c) Annual Improvements to IFRSs 2012–2014 Cycle – various standards.
The annual improvements to IFRSs to 2014-2016 cycles include certain amendments to various
IFRSs earlier application is permitted (along with the special transitional requirement in each case) in which case the related consequential amendments to other IFRSs would also apply.
The following are the key amendments in brief:
• IFRS 1 First-time Adoption of IFRS – Outdated exemptions for first-time adopters of IFRS are removed. Effective for annual periods beginning on or after 1 January 2018.
• IFRS 12 Disclosure of Interests in Other Entities – The disclosure requirements for interests in other entities also apply to interests that are classified as held for sale or distribution. Effective retrospectively for annual periods beginning on or after 1 January 2017.
• IAS 28 Investments in Associates and Joint Ventures – A venture capital organisation, or other qualifying entity, may elect to measure its investments in an associate or joint venture at fair value through profit or loss. This election can be made on an investment-by-investment basis. A non-investment entity investor may elect to retain the fair value accounting applied by an investment entity associate or investment entity joint venture to its subsidiaries. This election can be made separately for each investment entity associate or joint venture. Effective retrospectively for annual periods beginning on or after 1 January 2018; early application is permitted.
The adoption of these amendments had no significant impact on the consolidated financial statements.
4.2 New standards, amendments and interpretations issued but not yet effective
IFRS 9 Financial Instruments
In July 2014, the International Accounting Standards Board issued the final version of IFRS 9 Financial Instruments.
IFRS 9 is effective for annual periods beginning on or after 1 January 2018, with early adoption permitted. The Group currently plans to apply IFRS 9 initially on 1 January 2018.
Classification and measurementIFRS 9 contains a new classification and measurement approach for financial assets that reflects the business model in which financial assets are managed and the underlying cash flow characteristics. IFRS 9 contains three principal classification categories for financial assets: (a) measured at Amortised Cost (AC), Fair Value through Other Comprehensive Income (FVTOCI) and Fair Value through Profit or Loss (FVTPL). Under IFRS 9, derivatives embedded in contracts where the host is a financial asset are no longer bifurcated. Instead, the hybrid financial instrument as a whole is assessed for classification.
64 Mannai Corporation Q.P.S.C
Mannai Corporation Q.P.S.C.
NOTES TO THE CONSOLIDATED FINANCIAL STATEMENTSFor the year ended 31 December, 2017
Expected credit lossesIFRS 9 replaces the ‘incurred loss’ model in IAS 39 with a forward-looking ‘expected credit loss’ (ECL) model. The new impairment model will apply to financial assets measured at amortised cost or FVTOCI, except for investments in equity instruments. A number of significant judgments are also required in applying the accounting requirements for measuring ECL, such as:
• Determining criteria for significant increase in credit risk (SICR);
• Choosing appropriate models and assumptions for the measurement of ECL;
• Establishing groups of similar financial assets for the purposes of measuring ECL; and
• Establishing the number and relative weightings of forward-looking scenarios for each type of product/market and the associated ECL.
Financial liabilitiesMost of the requirements in IAS 39 for classification and measurement of financial liabilities were carried forward unchanged to IFRS 9. The key change is that an entity will be required to present the effects of changes in own credit risk of financial liabilities designated at fair value through profit or loss in other comprehensive income.
No significant changes are expected for financial liabilities, other than changes in the fair value of financial liabilities designated at FVTPL that are attributable to changes in the instrument’s credit risk, which will be presented in other comprehensive income.
Hedge accountingIFRS 9’s hedge accounting requirements are designed to align the accounting more closely to the risk management framework; permit a greater variety of hedging instruments; and remove or simplify some of the rule-based requirements in IAS 39. The elements of hedge accounting: fair value, cash flow and net investment hedges are retained.
When initially applying IFRS 9, the Group has the option to continue to apply the hedge accounting requirements of IAS 39 instead of the requirements in IFRS 9. The new hedge accounting requirements under IFRS 9 will not have impact on the consolidated financial statements of the Group as the Group does not hold any hedge instrument at present.
DisclosureIFRS 9 also introduces expanded disclosure requirements and changes in presentation. These are expected to change the nature and extent of the Group’s disclosures about its financial instruments particularly in the year of the adoption of IFRS 9.
IFRS 15 Revenue from Contracts with Customers
IFRS 15 establishes a comprehensive framework for determining whether, how much and when revenue is recognised. It replaces existing revenue recognition guidance, including IAS 18 Revenue, IAS 11 Construction Contracts and IFRIC 13 Customer Loyalty Programmes.
IFRS 15 is effective for annual reporting periods beginning on or after 1 January 2018, with early adoption permitted.
IFRS 16 Leases
IFRS 16 introduces a single, on-balance sheet lease accounting model for lessees. A lessee recognises a right-of-use asset representing its right to use the underlying asset and a lease liability representing its obligation to make lease payments. There are optional exemptions for short-term leases and leases of low value items. Lessor accounting remains similar to the current standard- i.e. lessors continue to classify leases as finance or operating leases.
IFRS 16 replaces existing leases guidance including IAS 17 Leases, IFRIC 4 Determining whether an Arrangement contains a Lease, SIC-15 Operating Leases-Incentives and SIC-27 Evaluating the Substance of Transactions Involving the Legal Form of a Lease.
The standard is effective for annual periods beginning on or after 1 January 2019. Early adoption is permitted for entities that apply IFRS 15 Revenue from Contracts with Customers at or before the date of initial application of IFRS 16.
The Group has initiated an assessment of the potential impact of these new standards (IFRS 9, 15 and 16) and any material impacts, will be addressed in the future consolidated financial statements in accordance with those new standards.
Classification and Measurement of Shared-based Payment Transactions (Amendments to IFRS 2)
Currently, there is ambiguity over how a company should account for certain types of share-based payment arrangements. The IASB has responded by publishing amendments to IFRS 2 Share-based Payment.
The amendments cover three accounting areas: › measurement of cash-settled share-based payments; › classification of share-based payments settled net of tax
withholdings; and › accounting for a modification of a share-based payment
from cash-settled to equity-settled.
The new requirements could affect the classification and/or measurement of these arrangements – and potentially the timing and amount of expense recognised for new and outstanding awards. There is currently no guidance in IFRS 2 on how to measure the fair value of the liability incurred in a cash-settled share-based payment.
65Annual Report 2017
Mannai Corporation Q.P.S.C.
NOTES TO THE CONSOLIDATED FINANCIAL STATEMENTSFor the year ended 31 December, 2017
04. APPLICATION OF NEW AND REVISED INTERNATIONAL FINANCIAL REPORTING STANDARDS (IFRSs) (Continued)
The amendments clarify that a cash-settled share-based payment is measured using the same approach as for equity-settled share-based payments – i.e. the modified grant date method. Therefore, in measuring the liability:
• market and non-vesting conditions are taken into account in measuring its fair value; and
• the number of awards to receive cash is adjusted to reflect the best estimate of those expected to vest as a result of satisfying service and any non-market performance conditions
The amendments can be applied prospectively so that amounts presented in the prior periods do not have to be restated. Retrospective, or early, application is permitted if companies have the required information. The amendments are effective for annual periods commencing on or after 1 January 2018.
The above amendment is not expected to have any impact on the consolidated financial statements of the Group.
Sale or Contribution of Assets between an Investor and its Associate or Joint Venture (Amendments to IFRS 10 and IAS 28)
The IASB has made limited scope amendments to IFRS 10 Consolidated financial statements and IAS 28 Investments in associates and joint ventures.
Where the non-monetary assets constitute a business, the investor will recognise the full gain or loss on the sale or contribution of assets. If the assets do not meet the definition of a business, the gain or loss is recognised by the investor only to the extent of the other investor’s interest in the associate or joint venture.
The effective date for these changes has now been postponed until the completion of a broader review – which the IASB hopes will result in the simplification of accounting for such transactions and of other aspects of accounting for associates and joint ventures. However, early adoption continues to be permitted.
The Group is assessing the potential impact on its consolidated financial statements resulting from the amendment.
Long term interests in associates and joint ventures
An amendment to IAS 28 Investments in Associates and Joint Ventures will affect companies that finance such entities with preference shares or with loans for which repayment is not expected in the foreseeable future (referred to as long-term interests or ‘LTI’). The amendment, which addresses equity-accounted loss absorption by LTI, involves the dual application of IAS 28 and IFRS 9 Financial Instruments.
The amendment and accompanying example state that LTI are in the scope of both IFRS 9 and IAS 28 and explain the annual sequence in which both standards are to be applied.
In effect, this is a three-step annual process:
• Apply IFRS 9 independently• True up past allocations• Book current year equity share
The amendment applies for annual periods beginning on or after 1 January 2019. Early adoption is permitted. There are transitional reliefs.
The Group does not expect to have a significant impact on its consolidated financial statements.
05. SIGNIFICANT ACCOUNTING POLICIES
A. Basis of consolidation
The consolidated financial statements comprise the financial statements of Mannai Corporation Q.P.S.C and its subsidiaries (together referred to as the “Group”). The accounting policies set out below have been applied consistently to all the periods presented in these consolidated financial statements, and have been applied consistently by the Group entities, where necessary, adjustments are made to the financial statements of the subsidiaries to bring their accounting policies in line with those used by the Group.
i. Business combinations
The Group accounts for business combinations using the acquisition method when control is transferred to the Group. The consideration transferred in the acquisition is generally measured at fair value, as are the identifiable net assets acquired. Any goodwill that arises is tested annually for impairment. Any gain on a bargain purchase is recognised in profit or loss immediately. Transaction costs are expensed as incurred, except if related to the issue of debt or equity securities.
The consideration transferred does not include amounts related to the settlement of pre-existing relationships. Such amounts are generally recognised in profit or loss.
When a business combination is achieved in stages, the Group’s previously held equity interest in the acquiree is remeasured to its acquisition-date fair value and the resulting gain or loss, if any, is recognised in the statement of profit or loss. Amounts arising from interests in the acquiree prior to the acquisition date that have previously been recognized in other comprehensive income are reclassified to profit or loss where such treatment would be appropriate if that interest were disposed off. If the initial accounting for a business combination is incomplete by the end of the reporting period in which the combination occurs, the Group reports provisional amounts for the items for which the accounting is incomplete. Those provisional amounts are adjusted during the measurement period (12 months after the acquisition) to reflect new information 66 Mannai Corporation Q.P.S.C
Mannai Corporation Q.P.S.C.
NOTES TO THE CONSOLIDATED FINANCIAL STATEMENTSFor the year ended 31 December, 2017
obtained about facts and circumstances that existed at the acquisition date that, if known, would have affected the amounts recognised at that date.
Any contingent consideration is measured at fair value at the date of acquisition. If an obligation to pay contingent consideration that meets the definition of a financial instrument is classified as equity, then it is not remeasured and settlement is accounted for within equity. Otherwise, other contingent consideration is remeasured at fair value at each reporting date and subsequent changes in the fair value of the contingent consideration are recognised in profit or loss.
ii. Subsidiaries
Subsidiaries are entities controlled by the Group. The Group controls an entity when it is exposed to, or has rights to, variable returns from its involvement with the entity and has the ability to affect those returns through its power over the entity. The financial statements of subsidiaries are included in the consolidated financial statements from the date on which control commences until the date on which control ceases.
iii. Non-controlling interests (“NCI”)
NCI are measured initially at their proportionate share of the acquiree’s identifiable net assets at the date of acquisition. Changes in the Group’s interest in a subsidiary that do not result in a loss of control are accounted for as equity transactions.
iv. Loss of control
When the Group loses control over a subsidiary, it derecognises the assets and liabilities of the subsidiary, and any related NCI and other components of equity. Any resulting gain or loss is recognised in profit or loss. Any interest retained in the former subsidiary is measured at fair value when control is lost.
v. Interests in equity-accounted investees
The Group’s interests in equity-accounted investees comprise interests in associates and joint ventures.
Associates are those entities in which the Group has significant influence, but not control or joint control, over the financial and operating policies. A joint venture is an arrangement in which the Group has joint control, whereby the Group has rights to the net assets of the arrangement, rather than rights to its assets and obligations for its liabilities.
Interests in associates and the joint venture are accounted for using the equity method. They are initially recognised at cost, which includes transaction costs. Subsequent to initial recognition, the consolidated financial statements include the Group’s share of the profit or loss and OCI of equity-accounted investees, until the date on which significant influence or joint control ceases.
vi. Transactions eliminated on consolidation
Intra-group balances and transactions, and any unrealised income and expenses arising from intra-group transactions, are eliminated. Unrealised gains arising from transactions with equity-accounted investees are eliminated against the investment to the extent of the Group’s interest in the investee. Unrealised losses are eliminated in the same way as unrealised gains, but only to the extent that there is no evidence of impairment.
B. Foreign currency
i. Foreign currency transactions
Transactions in foreign currencies are translated into the respective functional currencies of Group companies at the exchange rates at the dates of the transactions.
Monetary assets and liabilities denominated in foreign currencies are translated into the functional currency at the exchange rate at the reporting date. Non-monetary assets and liabilities that are measured at fair value in a foreign currency are translated into the functional currency at the exchange rate when the fair value was determined. Non-monetary items that are measured based on historical cost in a foreign currency are translated at the exchange rate at the date of the transaction. Foreign currency differences are generally recognised in profit or loss.
However, foreign currency differences arising from the translation of the following items are recognised in OCI:
• available-for-sale equity investments (except on impairment, in which case foreign currency differences that have been recognised in OCI are reclassified to profit or loss);
ii. Foreign operations
The assets and liabilities of foreign operations, including goodwill and fair value adjustments arising on acquisition, are translated into Qatari Riyals at the exchange rates at the reporting date. The income and expenses of foreign operations are translated into Qatari Riyals at the exchange rates at the dates of the transactions.
Foreign currency differences are recognised in OCI and accumulated in the translation reserve, except to the extent that the translation difference is allocated to NCI.
When a foreign operation is disposed off in its entirety or partially such that control, significant influence or joint control is lost, the cumulative amount in the translation reserve related to that foreign operation is reclassified to profit or loss as part of the gain or loss on disposal. If the Group disposes off part of its interest in a subsidiary but retains control, then the relevant proportion of the cumulative amount is reattributed to NCI. When the Group disposes off only part of an associate or joint venture while retaining significant influence or joint control, the relevant proportion of the cumulative amount is reclassified to profit or loss.
67Annual Report 2017
Mannai Corporation Q.P.S.C.
NOTES TO THE CONSOLIDATED FINANCIAL STATEMENTSFor the year ended 31 December, 2017
05. SIGNIFICANT ACCOUNTING POLICIES (Continued)
C. Revenue
i. Sale of goods
Revenue is recognised when the significant risks and rewards of ownership have been transferred to the customer, recovery of the consideration is probable, the associated costs and possible return of goods can be estimated reliably, there is no continuing management involvement with the goods and the amount of revenue can be measured reliably. Revenue is measured net of returns, trade discounts and volume rebates.
ii. Rendering of services
Revenue from rendering of services is recognised when the outcome of the transaction can be estimated reliably, by reference to the stage of completion of the transaction at the reporting date.
iii. Investment income
Income from investments other than associates and joint ventures are either accounted for on an accrual basis or when right to receive the income is established.
iv. Investment property rental income
Rental income from investment property is recognised as revenue on a straight-line basis over the term of the lease. Lease incentives granted are recognised as an integral part of the total rental income, over the term of the lease.
Rental income from other property is recognised as other income.
D. Employee benefits
i. Short-term employee benefits
Short-term employee benefits are expensed as the related service is provided. A liability is recognised for the amount expected to be paid if the Group has a present legal or constructive obligation to pay this amount as a result of past service provided by the employee and the obligation can be estimated reliably.
ii. Defined contribution plans
Obligations for contributions to defined contribution plans are expensed as the related service is provided. Prepaid contributions are recognised as an asset to the extent that a cash refund or a reduction in future payments is available.
iii. Defined benefit plans
The Group’s net obligation in respect of defined benefit plans is calculated separately for each plan by estimating the amount of future benefit that employees have earned in the current and prior periods, discounting that amount and deducting the fair value of any plan assets.
The calculation of defined benefit obligations is performed annually by a qualified actuary using the projected unit credit method. The projected unit credit sees each period of service as giving rise to an additional unit of benefit entitlement applying the plan’s vesting formula, taking into account the linearization effect when the rights do not vest uniformly over subsequent vesting periods.
Future payments corresponding to the benefits granted to employees are determined using various assumptions (rate of increase in salaries, retirement age, mortality, etc.) and these defined benefit obligations are then discounted to their present value using market yields on high quality corporate bonds as the discount rate.
When assumptions are revised, this results in actuarial differences that are recognised in the period in which they arise, not to profit or loss but directly to equity.
When the benefits of a plan are changed or when a plan is curtailed, the resulting change in benefit that relates to past service or the gain or loss on curtailment is recognised immediately in profit or loss. The Group recognises gains and losses on the settlement of a defined benefit plan when the settlement occurs.
iv. Termination benefits
Termination benefits are expensed at the earlier of when the Group can no longer withdraw the offer of those benefits and when the Group recognises costs for a restructuring. If benefits are not expected to be settled wholly within 12 months of the reporting date, then they are discounted.
v. Qatari nationals (Defined contribution plans)
With respect to the Qatari nationals, the Company makes contributions to Qatar Retirement and Pension Authority as a percentage of the employees’ salaries in accordance with the requirements of respective local laws pertaining to retirement and pensions. The Company’s share of contributions to these schemes are charged to profit or loss in the year they relate.
vi. Expatriate employees (Defined benefit plan)
With respect to the expatriate employees, the Company provides for employees’ end of service benefits determined in accordance with the requirements of Qatar Labour Law No. 14 of 2004. These unfunded charges are made by the Company on the basis of employees’ salaries and the number of years of service at the statement of financial position date.
68 Mannai Corporation Q.P.S.C

Mannai Corporation Q.P.S.C.
NOTES TO THE CONSOLIDATED FINANCIAL STATEMENTSFor the year ended 31 December, 2017
E. Finance income and finance costs
Interest income or expense is recognised using the effective interest method. Interest received under instalment credit sale agreement and bank deposits is accounted for on a time proportion basis taking into account the principal outstanding and interest rate applicable.
F. Income tax
Income tax expense comprises current and deferred tax. It is recognised in profit or loss except to the extent that it relates to a business combination, or items recognised directly in equity or in OCI. Interest and penalties related to income taxes, including uncertain tax treatments, are accounted for under IAS 37 Provisions, Contingent Liabilities and Contingent Assets.
i. Current tax
Current tax comprises the expected tax payable or receivable on the taxable income or loss for the year and any adjustment to the tax payable or receivable in respect of previous years. The amount of current tax payable or receivable is the best estimate of the tax amount expected to be paid or received that reflects uncertainty related to income taxes, if any, and is measured using tax rates enacted or substantively enacted at the reporting date. Current tax also includes any tax arising from dividends.
Current tax assets and liabilities are offset only if certain criteria are met.
ii. Deferred tax
Deferred tax is recognised in respect of temporary differences between the carrying amounts of assets and liabilities for financial reporting purposes and the amounts used for taxation purposes.
Deferred tax is not recognised for:
• temporary differences on the initial recognition of assets or liabilities in a transaction that is not a business combination and that affects neither accounting nor taxable profit or loss;
• temporary differences related to investments in subsidiaries, associates and joint arrangements to the extent that the Group is able to control the timing of the reversal of the temporary differences and it is probable that they will not reverse in the foreseeable future; and
• taxable temporary differences arising on the initial recognition of goodwill.
Deferred tax assets are recognised for unused tax losses, unused tax credits and deductible temporary differences to the extent that it is probable that future taxable profits will be available against which they can be used. Future taxable profits are determined based on the reversal of relevant taxable temporary differences. If the amount of taxable temporary differences is insufficient to recognise a deferred tax asset in full, then future taxable profits, adjusted for reversals of existing temporary differences, are considered, based on the business plans for individual subsidiaries in the Group. Deferred tax assets are reviewed at each reporting date and are reduced to the extent that it is no longer probable that the related tax benefit will be realised; such reductions are reversed when the probability of future taxable profits improves.
Unrecognised deferred tax assets are reassessed at each reporting date and recognised to the extent that it has become probable that future taxable profits will be available against which they can be used.
Deferred tax is measured at the tax rates that are expected to be applied to temporary differences when they reverse, using tax rates enacted or substantively enacted at the reporting date.
The measurement of deferred tax reflects the tax consequences that would follow from the manner in which the Group expects, at the reporting date, to recover or settle the carrying amount of its assets and liabilities.
Deferred tax assets and liabilities are offset only if certain criteria are met.
Deferred tax assets and liabilities are not discounted to their present value and are therefore reported at the nominal value.
69Annual Report 2017

Mannai Corporation Q.P.S.C.
NOTES TO THE CONSOLIDATED FINANCIAL STATEMENTSFor the year ended 31 December, 2017
05. SIGNIFICANT ACCOUNTING POLICIES (Continued)
G. Inventories
Inventories are measured at the lower of cost and net realisable value. Costs are those expenses incurred in bringing each product to its present location and condition as follows:
Spare parts and merchandise
purchase cost on a weighted average cost basis
Vehicles purchase cost on specific identification basis
Work-in-progress cost of direct materials, labour and other direct costs
Diamond jewellery, pearl jewellery, watches and precious stones*
purchase cost on specific identification basis
Gold and gold jewellery purchase cost on a weighted average cost basis
Others purchase cost on a first-in-first-out (FIFO) basis
*Making charges related to inventory of own and unfixed gold jewellery is included in inventories. Net realizable value represents the estimated selling price less all cost expected to be incurred for completion and/or disposal.
H. Property, plant and equipment
i. Recognition and measurement
Items of property, plant and equipment are measured at cost, which includes capitalised borrowing costs, less accumulated depreciation and any accumulated impairment losses. The cost of certain items of property, plant and equipment at 1 January 2005, the Group’s date of transition to IFRS, was determined with reference to its fair value at that date.
Capital work-in-progress is stated at cost. When the asset is ready for intended use, it is transferred from capital work-in-progress to the appropriate category under property, plant and equipment and depreciated in accordance with the Group’s policies.
ii. Derecognition
An item of property, plant and equipment is derecognised upon disposal or when no future economic benefits are expected from its use. Profits and losses on disposals of items of property, plant and equipment are determined by comparing the proceeds from their disposals with their respective carrying amounts, and are recognised net within profit or loss.
An item of property, plant and equipment is transferred to inventories at net book values when its value is expected to recover through sale.
iii. Subsequent expenditure
Subsequent expenditure is capitalised only if it is probable that the future economic benefits associated with the expenditure will flow to the Group.
iv. Depreciation
Depreciation is calculated to write off the cost of items of property, plant and equipment less their estimated residual values using the straight-line method over their estimated useful lives, and is generally recognised in profit or loss. Leased assets are depreciated over the shorter of the lease term and their useful lives unless it is reasonably certain that the Group will obtain ownership by the end of the lease term. Land and Capital work-in-progress is not depreciated.
Depreciation is calculated on a straight-line basis over the estimated useful lives of the assets. The estimated useful lives of property, plant and equipment for current and comparative periods are as follows:
Buildings 10-40 years
Plant, machinery and equipment 03-20 years
Furniture and equipment 03-06 years
Motor vehicles 03-05 years
Assets on hire 03-05 years
Maintenance, repairs and minor improvements are charged to the statement of profit or loss as and when incurred. Major improvements and replacements are capitalised.
Depreciation methods, useful lives and residual values are reviewed at each reporting date and adjusted if appropriate.
v. Reclassification to investment property
When the use of a property changes from owner-occupied to investment property, the property is remeasured to fair value and reclassified accordingly. Any gain arising on this remeasurement is recognised in profit or loss to the extent that it reverses a previous impairment loss on the specific property, with any remaining gain recognised in OCI and presented in the revaluation reserve. Any loss is recognised in profit or loss.
70 Mannai Corporation Q.P.S.C

Mannai Corporation Q.P.S.C.
NOTES TO THE CONSOLIDATED FINANCIAL STATEMENTSFor the year ended 31 December, 2017
I. Intangible assets and goodwill
i. Recognition and measurement
Goodwill Goodwill arising on the acquisition of subsidiaries is measured at cost less accumulated impairment losses.
Research and development
Expenditure on research activities is recognised in profit or loss as incurred.
Development expenditure is capitalised only if the expenditure can be measured reliably, the product or process is technically and commercially feasible, future economic benefits are probable and the Group intends to and has sufficient resources to complete development and to use or sell the asset. Otherwise, it is recognised in profit or loss as incurred. Subsequent to initial recognition, development expenditure is measured at cost less accumulated amortisation and any accumulated impairment losses.
Other intangible Assets
Other intangible assets, including customer relationships, patents and trademarks, that are acquired by the Group and have finite useful lives are measured at cost less accumulated amortisation and any accumulated impairment losses.
ii. Subsequent expenditure
Subsequent expenditure is capitalised only when it increases the future economic benefits embodied in the specific asset to which it relates. All other expenditure, including expenditure on internally generated goodwill and brands, is recognised in profit or loss as incurred.
Subsequent to initial recognition, intangible assets acquired in a business combination are reported at cost less accumulated amortisation and impairment losses, on the same basis as intangible assets that are acquired separately.
iii. Amortisation
Amortisation is calculated to write off the cost of intangible assets less their estimated residual values using the straight-line method over their estimated useful lives, and is generally recognised in profit or loss. Goodwill is not amortised.
The useful lives of goodwill and trade name are for indefinite period whilst the estimated useful lives of other intangible assets for current and comparative periods are as follows:
Customer relationship 02-21 years
Order backlog 03 years
Other intangible assets 04 years
J. Investment property
Investment property comprises property held for capital appreciation, rental yields or both, but not for sale in the ordinary course of business, use in the production or supply of goods or services or for administrative purposes. Investment property is carried at cost less accumulated depreciation and impairment losses, if any. Land held for undetermined use is classified as investment property and is not depreciated.
When the development of investment property commences, it is transferred to capital work-in-progress until development is complete, at which time it is transferred to the respective category, and depreciated on the straight-line method, at the rate calculated to reduce the cost of the asset to its estimated residual value over its expected useful life, as follows:
Building 20 years
Any expenditure that results in the maintenance of property to an acceptable standard or specification is treated as repairs and maintenance and is expensed in the period in which it is incurred.
Any gain or loss on disposal of investment property (calculated as the difference between the net proceeds from disposal and the carrying amount of the item) is recognised in profit or loss. When investment property that was previously classified as property, plant and equipment is sold, any related amount included in the revaluation reserve is transferred to retained earnings.
K. Non-current assets held for sale
Non-current assets, or disposal groups comprising assets and liabilities, are classified as held-for-sale if it is highly probable that they will be recovered primarily through sale rather than through continuing use.
Such assets, or disposal groups, are generally measured at the lower of their carrying amount and fair value less costs to sell. Any impairment loss on a disposal group is allocated first to goodwill, and then to the remaining assets and liabilities on a pro rata basis, except that no loss is allocated to inventories, financial assets, deferred tax assets or investment property, which continue to be measured in accordance with the Group’s other accounting policies. Impairment losses on initial classification as held-for-sale or held-for-distribution and subsequent gains and losses on remeasurement are recognised in profit or loss.
Once classified as held-for-sale, intangible assets and property, plant and equipment are no longer amortised or depreciated, and any equity-accounted investee is no longer equity accounted.
71Annual Report 2017

Mannai Corporation Q.P.S.C.
NOTES TO THE CONSOLIDATED FINANCIAL STATEMENTSFor the year ended 31 December, 2017
05. SIGNIFICANT ACCOUNTING POLICIES (Continued)
L. Financial instruments
The Group classifies non-derivative financial assets into the following categories: financial assets at FVTPL, held-to-maturity financial assets, loans and receivables and available-for-sale financial assets.
The Group classifies non-derivative financial liabilities into the following categories: financial liabilities at FVTPL and other financial liabilities.
i. Non-derivative financial assets and financial liabilities – Recognition and derecognition
The Group initially recognises loans and receivables and debt securities issued on the date when they are originated. All other financial assets and financial liabilities are initially recognised on the trade date when the entity becomes a party to the contractual provisions of the instrument.
The Group derecognises a financial asset when the contractual rights to the cash flows from the asset expire, or it transfers the rights to receive the contractual cash flows in a transaction in which substantially all of the risks and rewards of ownership of the financial asset are transferred, or it neither transfers nor retains substantially all of the risks and rewards of ownership and does not retain control over the transferred asset. Any interest in such derecognised financial assets that is created or retained by the Group is recognised as a separate asset or liability.
The Group derecognises a financial liability when its contractual obligations are discharged or cancelled, or expire.
Financial assets and financial liabilities are offset and the net amount presented in the statement of financial position when, and only when, the Group currently has a legally enforceable right to offset the amounts and intends either to settle them on a net basis or to realise the asset and settle the liability simultaneously.
ii. Non-derivative financial assets – Measurement
Financial assets atFVTPL
A financial asset is classified as at FVTPL if it is classified as held-for-trading or is designated as such on initial recognition. Directly attributable transaction costs are recognised in profit or loss as incurred. Financial assets at FVTPL are measured at fair value and changes therein, including any interest or dividend income, are recognised in profit or loss.
Held-to-maturity financial assets
These assets are initially measured at fair value plus any directly attributable transaction costs. Subsequent to initial recognition, they are measured at amortised cost using the effective interest method.
Loans andReceivables
These assets are initially measured at fair value plus any directly attributable transaction costs. Subsequent to initial recognition, they are measured at amortised cost using the effective interest method.
Available-for-salefinancial assets
These assets are initially measured at fair value plus any directly attributable transaction costs. Subsequent to initial recognition, they are measured at fair value and changes therein, other than impairment losses, interest income and foreign currency differences on debt instruments, are recognised in OCI and accumulated in the fair value reserve. When these assets are derecognised, the gain or loss accumulated in equity is reclassified to profit or loss.
iii. Non-derivative financial liabilities – Measurement
A financial liability is classified as at FVTPL if it is classified as held-for-trading or is designated as such on initial recognition. Directly attributable transaction costs are recognised in profit or loss as incurred. Financial liabilities at FVTPL are measured at fair value and changes therein, including any interest expense, are recognised in profit or loss.
Other non-derivative financial liabilities are initially measured at fair value less any directly attributable transaction costs. Subsequent to initial recognition, these liabilities are measured at amortised cost using the effective interest method.
M. Impairment
i. Non-derivative financial assets
Financial assets not classified as at FVTPL, including an interest in an equity-accounted investee, are assessed at each reporting date to determine whether there is objective evidence of impairment.
72 Mannai Corporation Q.P.S.C

Mannai Corporation Q.P.S.C.
NOTES TO THE CONSOLIDATED FINANCIAL STATEMENTSFor the year ended 31 December, 2017
Objective evidence that financial assets are impaired includes:
• default or delinquency by a debtor;• restructuring of an amount due to the Group on terms
that the Group would not consider otherwise;• indications that a debtor or issuer will enter bankruptcy;• adverse changes in the payment status of borrowers or
issuers;• the disappearance of an active market for a security
because of financial difficulties; or• observable data indicating that there is a measurable
decrease in the expected cash flows from a group of financial assets.
For an investment in an equity security, objective evidence of impairment includes a significant or prolonged decline in its fair value below its cost.
Financial assets measured at amortised cost
The Group considers evidence of impairment for these assets at both an individual asset and a collective level. All individually significant assets are individually assessed for impairment. Those found not to be impaired are then collectively assessed for any impairment that has been incurred but not yet individually identified. Assets that are not individually significant are collectively assessed for impairment. Collective assessment is carried out by grouping together assets with similar risk characteristics.
In assessing collective impairment, the Group uses historical information on the timing of recoveries and the amount of loss incurred, and makes an adjustment if current economic and credit conditions are such that the actual losses are likely to be greater or lesser than suggested by historical trends.
An impairment loss is calculated as the difference between an asset’s carrying amount and the present value of the estimated future cash flows discounted at the asset’s original effective interest rate. Losses are recognised in profit or loss and reflected in an allowance account. When the Group considers that there are no realistic prospects of recovery of the asset, the relevant amounts are written off. If the amount of impairment loss subsequently decreases and the decrease can be related objectively to an event occurring after the impairment was recognised, then the previously recognised impairment loss is reversed through profit or loss.
Available-for-sale financial assets
Impairment losses on available-for-sale financial assets are recognised by reclassifying the losses accumulated in the fair value reserve to profit or loss. The amount reclassified is the difference between the acquisition cost (net of any principal repayment and amortisation) and the current fair value, less any impairment loss previously recognised in profit or loss. If the fair value of an impaired available-for-sale debt security subsequently increases and the increase can be related objectively to an event occurring after the impairment loss was recognised, then the impairment loss is reversed through profit or loss. Impairment losses recognised in profit or loss for an investment in an equity instrument classified as available-for-sale are not reversed through profit or loss.
Equity-accounted investees
An impairment loss in respect of an equity-accounted investee is measured by comparing the recoverable amount of the investment with its carrying amount. An impairment loss is recognised in profit or loss, and is reversed if there has been a favourable change in the estimates used to determine the recoverable amount.
ii. Non-financial assets
At each reporting date, the Group reviews the carrying amounts of its non-financial assets (other than investment property, inventories and deferred tax assets) to determine whether there is any indication of impairment. If any such indication exists, then the asset’s recoverable amount is estimated. Goodwill is tested annually for impairment.
For impairment testing, assets are grouped together into the smallest group of assets that generates cash inflows from continuing use that are largely independent of the cash inflows of other assets or CGUs. Goodwill arising from a business combination is allocated to CGUs or groups of CGUs that are expected to benefit from the synergies of the combination.
The recoverable amount of an asset or CGU is the greater of its value in use and its fair value less costs to sell. Value in use is based on the estimated future cash flows, discounted to their present value using a pre-tax discount rate that reflects current market assessments of the time value of money and the risks specific to the asset or CGU.
An impairment loss is recognised if the carrying amount of an asset or CGU exceeds its recoverable amount.
73Annual Report 2017
Mannai Corporation Q.P.S.C.
NOTES TO THE CONSOLIDATED FINANCIAL STATEMENTSFor the year ended 31 December, 2017
05. SIGNIFICANT ACCOUNTING POLICIES (Continued) M. Impairment (Continued)
Impairment losses are recognised in profit or loss. They are allocated first to reduce the carrying amount of any goodwill allocated to the CGU, and then to reduce the carrying amounts of the other assets in the CGU on a pro rata basis.
An impairment loss in respect of goodwill is not reversed. For other assets, an impairment loss is reversed only to the extent that the asset’s carrying amount does not exceed the carrying amount that would have been determined, net of depreciation or amortisation, if no impairment loss had been recognised.
N. Provisions
Provisions are recognised when the Group has a present obligation (legal or constructive) as a result of a past event, it is probable that the Group will be required to settle the obligation and a reliable estimate can be made of the amount of the obligation.
O. Leases
i. Determining whether an arrangement contains a lease
At inception of an arrangement, the Group determines whether the arrangement is or contains a lease. At inception or on reassessment of an arrangement that contains a lease, the Group separates payments and other consideration required by the arrangement into those for the lease and those for other elements on the basis of their relative fair values. If the Group concludes for a finance lease that it is impracticable to separate the payments reliably, then an asset and a liability are recognised at an amount equal to the fair value of the underlying asset; subsequently, the liability is reduced as payments are made and an imputed finance cost on the liability is recognised using the Group’s incremental borrowing rate.
ii. Leased assets
Leases of property, plant and equipment that transfer to the Group substantially all of the risks and rewards of ownership are classified as finance leases. The leased assets are measured initially at an amount equal to the lower of their fair value and the present value of the minimum lease payments. Subsequent to initial recognition, the assets are accounted for in accordance with the accounting policy applicable to that asset.
Assets held under other leases are classified as operating leases and are not recognised in the Group’s statement of financial position.
iii. Lease payments
Payments made under operating leases are recognised in profit or loss on a straight-line basis over the term of the lease. Lease incentives received are recognised as an integral part of the total lease expense, over the term of the lease.
Minimum lease payments made under finance leases are apportioned between the finance expense and the reduction of the outstanding liability. The finance expense is allocated to each period during the lease term so as to produce a constant periodic rate of interest on the remaining balance of the liability.
06. CRITICAL JUDGMENTS AND KEY SOURCES OF ESTIMATION UNCERTAINTY
In the application of the Group’s accounting policies, which are described in note 5, management is required to make judgments, estimates and assumptions about the carrying amounts of assets and liabilities that are not readily apparent from other sources. The estimates and associated assumptions are based on historical experience and other factors that are considered to be relevant. Actual results may differ from these estimates. The estimates and underlying assumptions are reviewed on an ongoing basis. Revisions to accounting estimates are recognised in the period in which the estimate is revised if the revision affects only that period or in the period of the revision and future periods if the revision affects both current and future periods.
Critical judgments and key sources of estimation in applying accounting policies
The following are the critical judgments and key sources of estimation, that management has made in the process of applying the Group’s accounting policies and that have the most significant effect on the amounts recognised in the consolidated financial statements:
Impairment of non-financial assetsThe Group assesses whether there are any indicators of impairment for all non-financial assets at each reporting date. Goodwill and other indefinite life intangibles are tested for impairment annually and at other times when such indicators exist. Other non-financial assets are tested for impairment when there are indicators that the carrying amounts may not be recoverable. When value in use calculations are undertaken, management must estimate the expected future cash flows from the asset or cash generating unit and choose a suitable discount rate in order to calculate the present value of those cash flows.
74 Mannai Corporation Q.P.S.C

Mannai Corporation Q.P.S.C.
NOTES TO THE CONSOLIDATED FINANCIAL STATEMENTSFor the year ended 31 December, 2017
Impairment of trade receivablesAn estimate of the collectible amount of trade receivables is made when collection of the full amount is no longer probable. For individually significant amounts, this estimation is performed on an individual basis. Amounts which are not individually significant, but which are past due, are assessed collectively and a provision applied according to the length of time past due, based on historical recovery rates.
Impairment of inventoriesInventories are held at the lower of cost and net realisable value. When inventories become old or obsolete, an estimate is made of their net realisable value. For individually significant amounts, this estimation is performed on an individual basis. Inventories which are not individually significant, but which are old or obsolete, are assessed collectively and a provision applied according to the inventory type and the degree of ageing or obsolescence, based on historical selling prices.
Fair value of unquoted equity investmentsWhere the fair value of financial assets and financial liabilities recorded in the statement of financial position cannot be derived from active markets, they are determined using valuation techniques including the discounted cash flows model. The inputs to these models are taken from observable markets where possible, but where this is not feasible, a degree of judgment is required in establishing fair values. The judgments include considerations of inputs such as liquidity risk, credit risk and volatility. Changes in assumptions about these factors could affect the reported fair value of financial instruments.
Useful lives of property, plant and equipment and investment propertyThe Group’s management determines the estimated useful lives of its property, plant and equipment and investment property for calculating depreciation. This estimate is determined after considering the expected usage of the asset, physical wear and tear, technical or commercial obsolescence.
Useful lives of intangible assetsThe Group’s management determines the estimated useful lives of its intangible assets for calculating amortisation. This estimate is determined after considering the expected usage of the asset, technical or commercial obsolescence.
Provision and contingent liabilitiesThe Group’s management determines provision on best estimate of the expenditure required to settle the present obligation as a result of the past event at the reporting date.
The Group’s management measures contingent liabilities as a possible obligation depending on whether some uncertain future event occurs or a present obligation but payment is not probable or the amount cannot be measured reliably.
Business combinationsThe recognition of business combinations requires the excess of the purchase price of acquisitions over the net book value of assets acquired to be allocated to the assets and liabilities of the acquired entity.
The Group makes judgments and estimates in relation to the fair value allocation of the purchase price. If any unallocated portion is positive it is recognised as goodwill and if negative, it is recognised in the consolidated statement of profit or loss.
Revenue recognition - Estimated stage of completionThe contract revenue associated with construction contract is recognised by reference to the stage of completion of the contract activity at the end of the reporting year.
Classification of associates, joint ventures and subsidiariesThe appropriate classification of certain investments as subsidiaries, associates and joint ventures requires significant analysis and management judgment as to whether the Group exercises control, significant influence or joint control over these investments. This may involve consideration of a number of factors, including ownership and voting rights, the extent of Board representation, contractual arrangements and indicators of de fact control.
Changes to these indicators and management’s assessment of the power to control or influence may have a material impact on the classification of such investments and the Group’s consolidated financial position, revenue and results.
75Annual Report 2017

Mannai Corporation Q.P.S.C.
NOTES TO THE CONSOLIDATED FINANCIAL STATEMENTSFor the year ended 31 December, 2017
07. CASH AND CASH EQUIVALENTS
2017 2016
QR ’000 QR ’000
Bank balances and cash 362,766 153,440
Less: Fixed and margin deposits under lien (13,137) (13,259)
349,629 140,181
Less: Bank overdrafts (385,164) (165,213)
Cash and cash equivalents (35,535) (25,032)
08. ACCOUNTS RECEIVABLE AND PREPAYMENTS
2017 2016
QR ’000 QR ’000
Trade accounts receivable 1,332,963 682,338
Receivables transferred to factoring companies* 548,512 -
Less : Allowance for impairment (67,163) (30,177)
1,814,312 652,161
Advances to suppliers, net 40,562 28,422
Notes receivable 180,780 99,048
Prepayments 126,364 64,730
Deposits 19,041 20,372
Accrued income 697,556 34,633
Tax receivable 257,815 -
Others 112,923 37,817
3,249,353 937,183
*Gfi lnformatique factors part of its receivables. Depending on the type of contract, the factoring company may be responsible for collecting the accounts receivable. Gfi lnformatique and its subsidiaries have drawing rights limited to a certain fraction of the receivables assigned.
Presented in the consolidated statement of financial position as follows:
2017 2016
QR ’000 QR ’000
Current 3,004,999 893,204
Non-current 244,354 43,979
3,249,353 937,183
76 Mannai Corporation Q.P.S.C

Mannai Corporation Q.P.S.C.
NOTES TO THE CONSOLIDATED FINANCIAL STATEMENTSFor the year ended 31 December, 2017
The movement in allowance for impairment is as follows:
2017 2016
QR ’000 QR ’000
At 1 January 30,177 22,796
Acquired through business combination 33,668 -
Provision during the year 6,075 8,621
Written off during the year (2,364) (1,240)
Write back during the year (1,944) -
Effect on foreign exchange translation 1,551 -
At 31 December 67,163 30,177
As at 31 December, the aging of unimpaired accounts receivable and notes receivable were as follows:
2017 2016
QR ’000 QR ’000
Aging of neither past due nor impaired
Up to 180 days 1,413,805 368,854
Aging of past due but not impaired
0 – 90 days 405,352 195,254
91 – 180 days 76,843 81,023
180 + days 99,092 106,078
Total 581,287 382,355
Aging of impaired receivables
Over 180 days 67,163 30,177
Unimpaired receivables are expected, on the basis of past experience, to be fully recoverable. It is not the practice of the Group to obtain collateral over receivables.
77Annual Report 2017

Mannai Corporation Q.P.S.C.
NOTES TO THE CONSOLIDATED FINANCIAL STATEMENTSFor the year ended 31 December, 2017
09. INVENTORIES
2017 2016
QR ’000 QR ’000
Gold and other jewellery (i) 1,159,585 1,279,243
Work-in-progress (ii) 466,539 581,671
Merchandises, spares and tools 464,990 429,726
Vehicles and heavy equipment 152,936 234,737
Industrial supplies 17,880 20,072
Others 4,549 6,740
2,266,479 2,552,189
Less: Provision for obsolete and slow moving items (183,443) (194,117)
2,083,036 2,358,072
(i) The Group in the normal course of business borrows gold on an unfixed basis which it converts into gold jewellery or trades as bullion. This jewellery and bullion is further used as stock in trade and is sold to various customers on a fixed or unfixed basis. The Group reduces the exposure to gold price by borrowing gold on an unfixed basis. These are then sold as manufactured jewellery or bullion, at which point, the price will be fixed at the spot rate on the sale date. The Group provides gold on an unfixed basis to various consignment ventures, debtors, associates and joint ventures without any margin and to certain parties against cash margin.
(ii) The work in progress relates to some of the ongoing projects which are yet to be acknowledged by the customers or milestones yet to be achieved as at 31 December 2017, which can take longer than one accounting period. As at reporting date, the Company has performed detailed assessment of open projects pending invoicing in light of all possible facts and circumstances, based on which the management is confident of converting work in progress balances into receivables in the future and expects full recovery against these open projects.
Movements in the provision for slow moving and obsolete inventories are as follows:
2017 2016
QR ’000 QR ’000
At 1 January 194,117 204,594
Acquired through business combination 150 -
Provision during the year 11,984 23,177
Write back during the year (16,549) (30,031)
Amount written off (6,615) (5,469)
Reclassification - 1,048
Exchange loss on foreign currency translation 356 798
At 31 December 183,443 194,117
78 Mannai Corporation Q.P.S.C

Mannai Corporation Q.P.S.C.
NOTES TO THE CONSOLIDATED FINANCIAL STATEMENTSFor the year ended 31 December, 2017
10. AVAILABLE FOR SALE INVESTMENTS
2017 2016
QR ’000 QR ’000
Unquoted investments :
At 1 January 40,034 43,688
Acquired through business combination 320 -
Disposals - (2,032)
Impairment loss (1,776) (1,700)
Exchange gain on foreign currency translation 138 78
At 31 December 38,716 40,034
Note (a) At 31 December 2017, available for sale investments include certain investments in unquoted equity shares and unquoted equity funds amounting to QR 11.6 million (2016: QR 13.4 million) carried at fair value. The fair value of the unquoted equity shares is based on the net asset value of the underlying investments provided by the fund manager/investee companies.
Note (b) At 31 December 2017, certain unquoted equity investments amounting to QR 26.6 million (2016: QR 26.6 million) were carried at cost less impairment due to non-availability of quoted market prices or other reliable measures of their fair value.
Note (c) At 31 December 2017, an impairment loss of QR 1.8 million (2016: QR 1.7 million) was recognised against available for sale investments based on the fair valuation and assessment of performance of those investments.
11. INVESTMENT IN JOINT VENTURE COMPANIES
The Group has investments in the following joint venture companies:
Name Country of incorporation Ownership interest
2017 2016
Cofely Besix Mannai Facility Management L.L.C. (i) Qatar 51% 51%
Gulf Land Survey W.L.L. (ii) Qatar 51% 51%
Saint-Gobain Pam and Mannai L.L.C. (iii) Qatar 51% 51%
Paspaley Pearl Jewellery L.L.C. (iv) UAE 51% 51%
Roberto Coin Middle East L.L.C. (iv) UAE 51% 51%
Principal activities of the Group’s joint ventures are as follows:
(i) Cofely Besix Mannai Facility Management L.L.C. is engaged in facilities and asset management business.
(ii) Gulf Land Survey W.L.L is primarily engaged in carrying on aerial, ground and underground survey business.
(iii) Saint-Gobain Pam and Mannai L.L.C. is engaged in distribution of ductile iron pipes, fittings and valves.
(iv) Paspaley Pearl Jewellery L.L.C. and Roberto Coin Middle East L.L.C. are engaged in trading in gold and gold jewellery, diamond jewellery, pearls, watches, silver and precious stones.
79Annual Report 2017
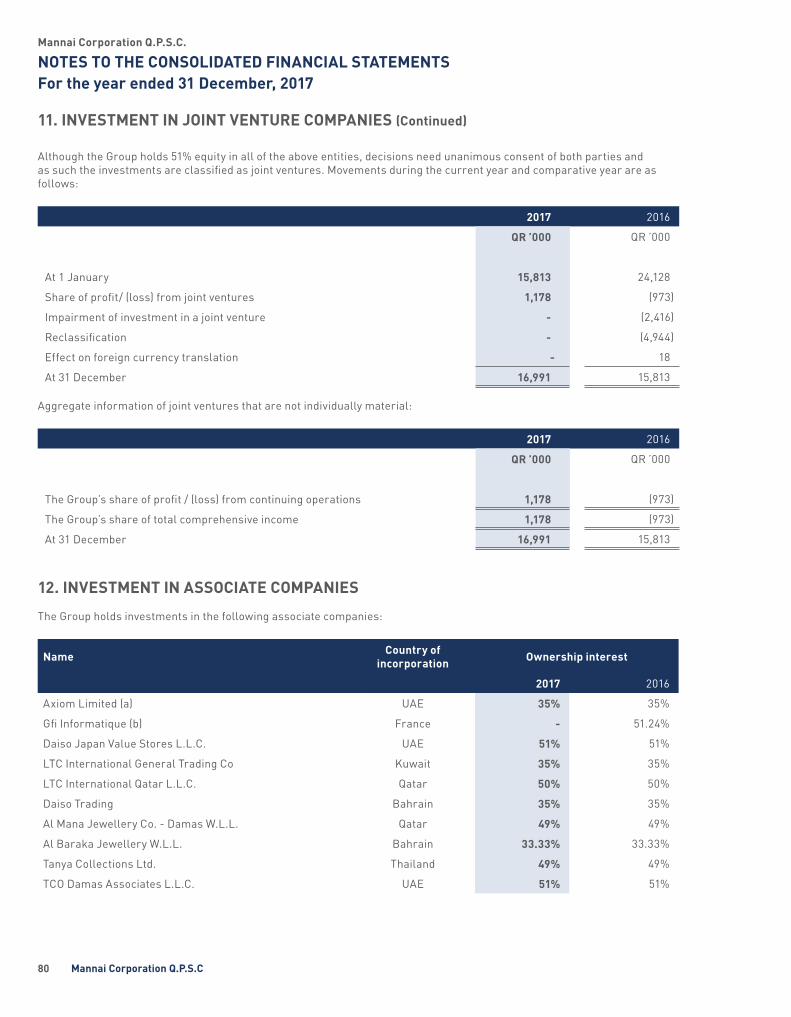
Mannai Corporation Q.P.S.C.
NOTES TO THE CONSOLIDATED FINANCIAL STATEMENTSFor the year ended 31 December, 2017
11. INVESTMENT IN JOINT VENTURE COMPANIES (Continued)
Although the Group holds 51% equity in all of the above entities, decisions need unanimous consent of both parties and as such the investments are classified as joint ventures. Movements during the current year and comparative year are as follows:
2017 2016
QR ’000 QR ’000
At 1 January 15,813 24,128
Share of profit/ (loss) from joint ventures 1,178 (973)
Impairment of investment in a joint venture - (2,416)
Reclassification - (4,944)
Effect on foreign currency translation - 18
At 31 December 16,991 15,813
Aggregate information of joint ventures that are not individually material:
2017 2016
QR ’000 QR ’000
The Group’s share of profit / (loss) from continuing operations 1,178 (973)
The Group’s share of total comprehensive income 1,178 (973)
At 31 December 16,991 15,813
12. INVESTMENT IN ASSOCIATE COMPANIES
The Group holds investments in the following associate companies:
Name Country of incorporation Ownership interest
2017 2016
Axiom Limited (a) UAE 35% 35%
Gfi Informatique (b) France - 51.24%
Daiso Japan Value Stores L.L.C. UAE 51% 51%
LTC International General Trading Co Kuwait 35% 35%
LTC International Qatar L.L.C. Qatar 50% 50%
Daiso Trading Bahrain 35% 35%
Al Mana Jewellery Co. - Damas W.L.L. Qatar 49% 49%
Al Baraka Jewellery W.L.L. Bahrain 33.33% 33.33%
Tanya Collections Ltd. Thailand 49% 49%
TCO Damas Associates L.L.C. UAE 51% 51%
80 Mannai Corporation Q.P.S.C
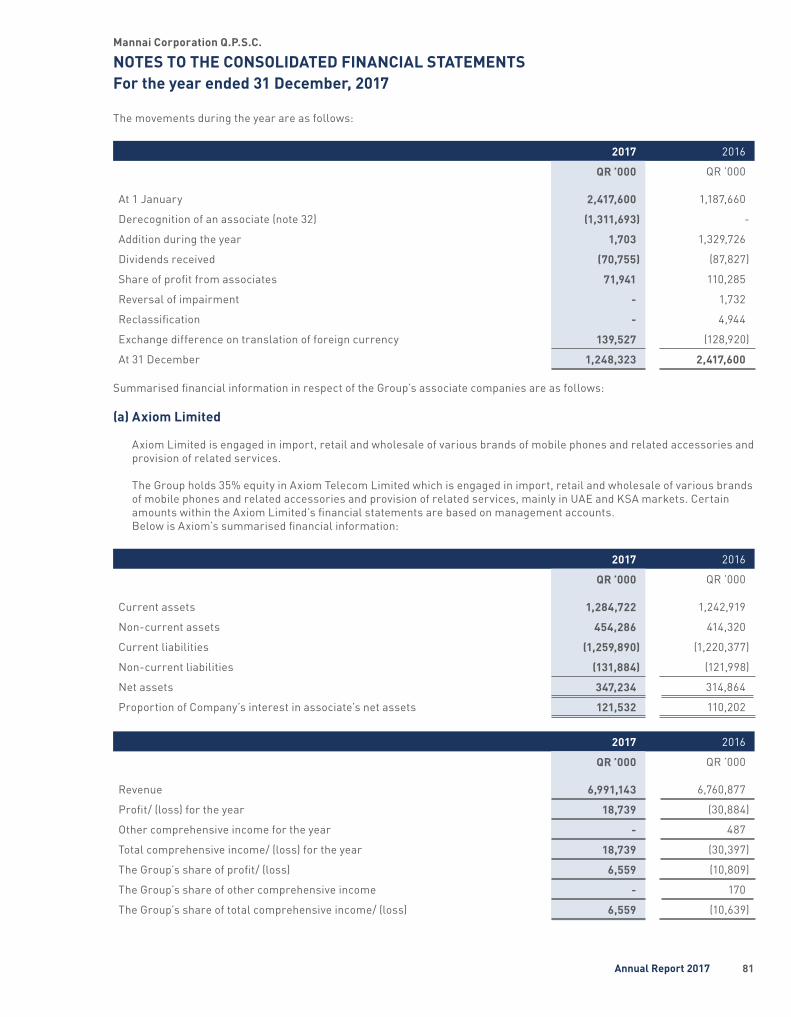
Mannai Corporation Q.P.S.C.
NOTES TO THE CONSOLIDATED FINANCIAL STATEMENTSFor the year ended 31 December, 2017
The movements during the year are as follows:
2017 2016
QR ’000 QR ’000
At 1 January 2,417,600 1,187,660
Derecognition of an associate (note 32) (1,311,693) -
Addition during the year 1,703 1,329,726
Dividends received (70,755) (87,827)
Share of profit from associates 71,941 110,285
Reversal of impairment - 1,732
Reclassification - 4,944
Exchange difference on translation of foreign currency 139,527 (128,920)
At 31 December 1,248,323 2,417,600
Summarised financial information in respect of the Group’s associate companies are as follows:
(a) Axiom Limited
Axiom Limited is engaged in import, retail and wholesale of various brands of mobile phones and related accessories and provision of related services.
The Group holds 35% equity in Axiom Telecom Limited which is engaged in import, retail and wholesale of various brands of mobile phones and related accessories and provision of related services, mainly in UAE and KSA markets. Certain amounts within the Axiom Limited’s financial statements are based on management accounts. Below is Axiom’s summarised financial information:
2017 2016
QR ’000 QR ’000
Current assets 1,284,722 1,242,919
Non-current assets 454,286 414,320
Current liabilities (1,259,890) (1,220,377)
Non-current liabilities (131,884) (121,998)
Net assets 347,234 314,864
Proportion of Company’s interest in associate’s net assets 121,532 110,202
2017 2016
QR ’000 QR ’000
Revenue 6,991,143 6,760,877
Profit/ (loss) for the year 18,739 (30,884)
Other comprehensive income for the year - 487
Total comprehensive income/ (loss) for the year 18,739 (30,397)
The Group’s share of profit/ (loss) 6,559 (10,809)
The Group’s share of other comprehensive income - 170
The Group’s share of total comprehensive income/ (loss) 6,559 (10,639)
81Annual Report 2017

Mannai Corporation Q.P.S.C.
NOTES TO THE CONSOLIDATED FINANCIAL STATEMENTSFor the year ended 31 December, 2017
12. INVESTMENT IN ASSOCIATE COMPANIES (Continued)
Reconciliation of the above summarised financial information to the carrying amount of the interest in Axiom Limited recognised in the consolidated financial statements:
2017 2016
QR ’000 QR ’000
Net assets of the associate 347,234 314,864
Proportion of the Group’s ownership interest 35% 35%
Share of net assets before goodwill 121,532 110,202
Goodwill 741,496 741,496
Other intangible assets identified 170,000 170,000
Other adjustments* 63,798 68,569
Carrying amount of the Group’s interest 1,096,826 1,090,267
*Other adjustments include minor exchange difference and purchase price allocation adjustment at acquisition date.
Allocation of goodwill to cash generating units and impairment assessment
Embedded goodwill, amounting to QR 741 million which is attributable to the acquisition of Axiom Telecom Limited is tested for impairment as part of impairment testing of Axiom Telecom Limited, UAE as the associate is considered as a single cash generating unit (Axiom CGU). The recoverable amount of this cash-generating unit is determined based on a value in use calculation which uses cash flow projections based on business plan and various scenarios of forecasts approved by the management covering a five-year period, and a discount rate of 9% (2016: 9%) per annum based on CAPM. The associate’s management has prepared Axiom’s business plan which is approved by the Group’s Board of Directors. The budgeted growth rate is assumed to be CAGR of 5% over the forecast period. The growth rate is based on Board of Directors’ strategy and is considered achievable by management considering the nature of the industry, Axiom’s positioning and the general growth in the economic activity witnessed in the countries where it operates. Terminal value has been derived by reference to the Gordon Growth Model assuming a steady level of operations beyond the discrete period using a terminal growth rate of 3% (2016: 3.5%).
Any change in key assumptions on which the recoverable amount is based may cause the aggregate carrying amount including goodwill to exceed the aggregate recoverable amount of the cash-generating unit.
(b) Gfi Informatique
During the year, the Group acquired additional 29.97% interest in Gfi Informatique (“Gfi”). This additional acquisition has resulted in the Group obtaining control over Gfi, and hence, Gfi has been accounted as an investment in subsidiary in the current year. The step acquisition details are further explained in note 32.
82 Mannai Corporation Q.P.S.C
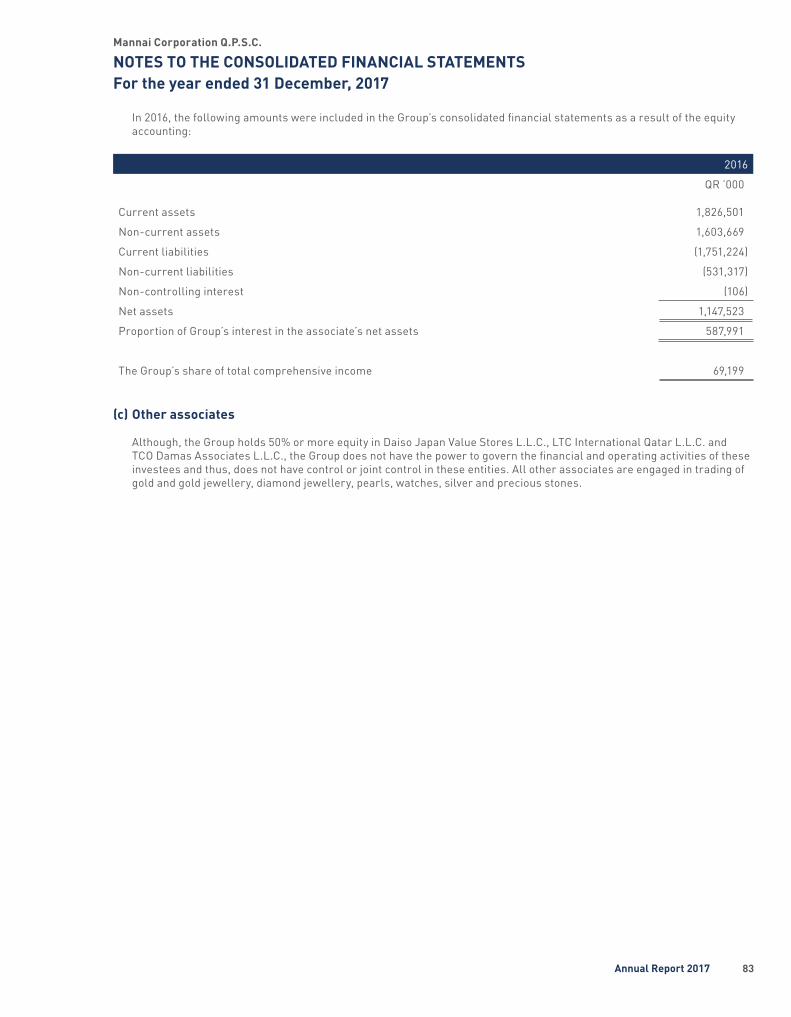
Mannai Corporation Q.P.S.C.
NOTES TO THE CONSOLIDATED FINANCIAL STATEMENTSFor the year ended 31 December, 2017
In 2016, the following amounts were included in the Group’s consolidated financial statements as a result of the equity accounting:
2016
QR ’000
Current assets 1,826,501
Non-current assets 1,603,669
Current liabilities (1,751,224)
Non-current liabilities (531,317)
Non-controlling interest (106)
Net assets 1,147,523
Proportion of Group’s interest in the associate’s net assets 587,991
The Group’s share of total comprehensive income 69,199
(c) Other associates
Although, the Group holds 50% or more equity in Daiso Japan Value Stores L.L.C., LTC International Qatar L.L.C. and TCO Damas Associates L.L.C., the Group does not have the power to govern the financial and operating activities of these investees and thus, does not have control or joint control in these entities. All other associates are engaged in trading of gold and gold jewellery, diamond jewellery, pearls, watches, silver and precious stones.
83Annual Report 2017

Mannai Corporation Q.P.S.C.
NOTES TO THE CONSOLIDATED FINANCIAL STATEMENTSFor the year ended 31 December, 2017
13. GOODWILL AND OTHER INTANGIBLE ASSETS
Goodwill Trade name Distribution rights
Other intangible
assetsTotal
QR ’000 QR ’000 QR ’000 QR ’000 QR ’000
Cost:
At 1 January 2016 530,342 670,000 24,339 12,412 1,237,093
Additions - - - 559 559
Disposal - - - (1,595) (1,595)
At 31 December 2016 530,342 670,000 24,339 11,376 1,236,057
Arising from business combination – net 2,459,599 - 733,932 3,193,531
Additions - - - 53,616 53,616
Disposal - - - (94,743) (94,743)
Effect of foreign exchange translation 31,840 - - 8,392 40,232
At 31 December 2017 3,021,781 670,000 24,339 712,573 4,428,693
Impairment/ amortisation:
At 1 January 2016 - - 24,339 2,027 26,366
Charge for the year - - - 3,142 3,142
Relating to disposal - - - (1,563) (1,563)
Effect of foreign exchange translation - - - (95) (95)
At 31 December 2016 - - 24,339 3,511 27,850
Arising from business combination – net 101,029 - - 402,194 503,223
Charge for the year - - - 41,353 41,353
Relating to disposal - - - (94,743) (94,743)
Effect of foreign exchange translation (843) - - 4,606 3,763
At 31 December 2017 100,186 - 24,339 356,921 481,446
Net carrying amounts
At 31 December 2017 2,921,595 670,000 - 355,652 3,947,247
At 31 December 2016 530,342 670,000 - 7,865 1,208,207
84 Mannai Corporation Q.P.S.C
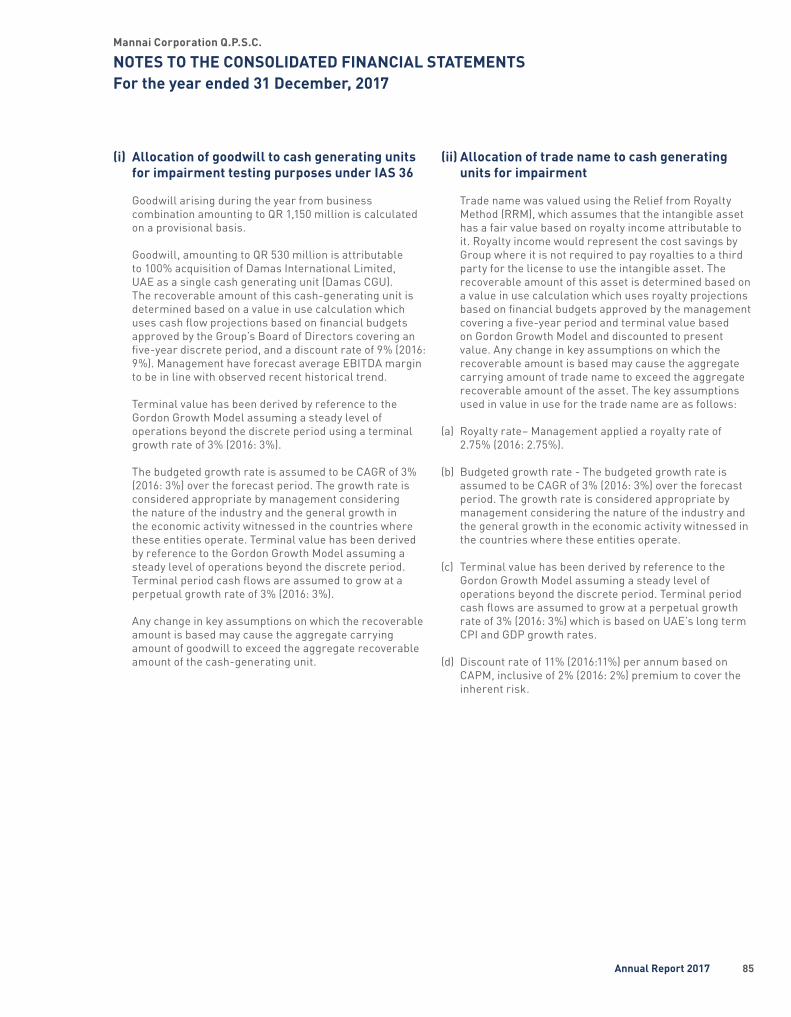
Mannai Corporation Q.P.S.C.
NOTES TO THE CONSOLIDATED FINANCIAL STATEMENTSFor the year ended 31 December, 2017
(i) Allocation of goodwill to cash generating units for impairment testing purposes under IAS 36
Goodwill arising during the year from business combination amounting to QR 1,150 million is calculated on a provisional basis.
Goodwill, amounting to QR 530 million is attributable to 100% acquisition of Damas International Limited, UAE as a single cash generating unit (Damas CGU). The recoverable amount of this cash-generating unit is determined based on a value in use calculation which uses cash flow projections based on financial budgets approved by the Group’s Board of Directors covering an five-year discrete period, and a discount rate of 9% (2016: 9%). Management have forecast average EBITDA margin to be in line with observed recent historical trend.
Terminal value has been derived by reference to the Gordon Growth Model assuming a steady level of operations beyond the discrete period using a terminal growth rate of 3% (2016: 3%).
The budgeted growth rate is assumed to be CAGR of 3% (2016: 3%) over the forecast period. The growth rate is considered appropriate by management considering the nature of the industry and the general growth in the economic activity witnessed in the countries where these entities operate. Terminal value has been derived by reference to the Gordon Growth Model assuming a steady level of operations beyond the discrete period. Terminal period cash flows are assumed to grow at a perpetual growth rate of 3% (2016: 3%).
Any change in key assumptions on which the recoverable amount is based may cause the aggregate carrying amount of goodwill to exceed the aggregate recoverable amount of the cash-generating unit.
(ii) Allocation of trade name to cash generating units for impairment
Trade name was valued using the Relief from Royalty Method (RRM), which assumes that the intangible asset has a fair value based on royalty income attributable to it. Royalty income would represent the cost savings by Group where it is not required to pay royalties to a third party for the license to use the intangible asset. The recoverable amount of this asset is determined based on a value in use calculation which uses royalty projections based on financial budgets approved by the management covering a five-year period and terminal value based on Gordon Growth Model and discounted to present value. Any change in key assumptions on which the recoverable amount is based may cause the aggregate carrying amount of trade name to exceed the aggregate recoverable amount of the asset. The key assumptions used in value in use for the trade name are as follows:
(a) Royalty rate– Management applied a royalty rate of 2.75% (2016: 2.75%).
(b) Budgeted growth rate - The budgeted growth rate is assumed to be CAGR of 3% (2016: 3%) over the forecast period. The growth rate is considered appropriate by management considering the nature of the industry and the general growth in the economic activity witnessed in the countries where these entities operate.
(c) Terminal value has been derived by reference to the Gordon Growth Model assuming a steady level of operations beyond the discrete period. Terminal period cash flows are assumed to grow at a perpetual growth rate of 3% (2016: 3%) which is based on UAE’s long term CPI and GDP growth rates.
(d) Discount rate of 11% (2016:11%) per annum based on CAPM, inclusive of 2% (2016: 2%) premium to cover the inherent risk.
85Annual Report 2017
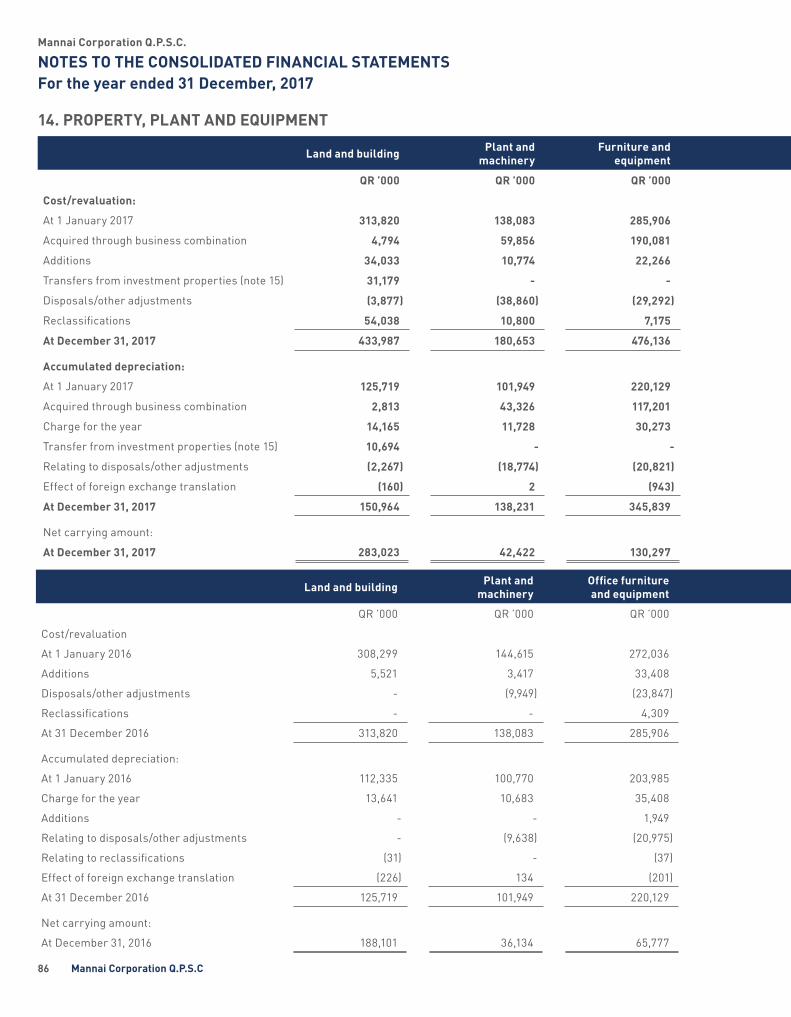
Mannai Corporation Q.P.S.C.
NOTES TO THE CONSOLIDATED FINANCIAL STATEMENTSFor the year ended 31 December, 2017
Land and building Plant and machinery
Office furniture and equipment Motor vehicles Assets on hire Capital
work-in-progress Total
QR ’000 QR ’000 QR ’000 QR ’000 QR ’000 QR ’000 QR ’000
Cost/revaluation
At 1 January 2016 308,299 144,615 272,036 65,109 109,268 9,534 908,861
Additions 5,521 3,417 33,408 9,711 37,051 54,669 143,777
Disposals/other adjustments - (9,949) (23,847) (10,685) (26,686) - (71,167)
Reclassifications - - 4,309 33 - (4,342) -
At 31 December 2016 313,820 138,083 285,906 64,168 119,633 59,861 981,471
Accumulated depreciation:
At 1 January 2016 112,335 100,770 203,985 39,570 41,074 (5) 497,729
Charge for the year 13,641 10,683 35,408 10,416 28,919 - 99,067
Additions - - 1,949 - - - 1,949
Relating to disposals/other adjustments - (9,638) (20,975) (7,399) (16,872) - (54,884)
Relating to reclassifications (31) - (37) 50 18 - -
Effect of foreign exchange translation (226) 134 (201) 224 - (37) (106)
At 31 December 2016 125,719 101,949 220,129 42,861 53,139 (42) 543,755
Net carrying amount:
At December 31, 2016 188,101 36,134 65,777 21,307 66,494 59,903 437,716
14. PROPERTY, PLANT AND EQUIPMENT
Land and building Plant and machinery
Furniture and equipment Motor vehicles Assets on hire Capital
work-in-progress Total
QR ’000 QR ’000 QR ’000 QR ’000 QR ’000 QR ’000 QR ’000
Cost/revaluation:
At 1 January 2017 313,820 138,083 285,906 64,168 119,633 59,861 981,471
Acquired through business combination 4,794 59,856 190,081 - - 14,025 268,756
Additions 34,033 10,774 22,266 10,635 28,035 71,088 176,831
Transfers from investment properties (note 15) 31,179 - - - - - 31,179
Disposals/other adjustments (3,877) (38,860) (29,292) (17,005) (32,958) - (121,992)
Reclassifications 54,038 10,800 7,175 - - (72,013) -
At December 31, 2017 433,987 180,653 476,136 57,798 114,710 72,961 1,336,245
Accumulated depreciation:
At 1 January 2017 125,719 101,949 220,129 42,861 53,139 (42) 543,755
Acquired through business combination 2,813 43,326 117,201 - - - 163,340
Charge for the year 14,165 11,728 30,273 3,377 16,309 - 75,852
Transfer from investment properties (note 15) 10,694 - - - - - 10,694
Relating to disposals/other adjustments (2,267) (18,774) (20,821) (11,657) (23,663) - (77,182)
Effect of foreign exchange translation (160) 2 (943) (257) - (154) (1,512)
At December 31, 2017 150,964 138,231 345,839 34,324 45,785 (196) 714,947
Net carrying amount:
At December 31, 2017 283,023 42,422 130,297 23,474 68,925 73,157 621,298
86 Mannai Corporation Q.P.S.C

Mannai Corporation Q.P.S.C.
NOTES TO THE CONSOLIDATED FINANCIAL STATEMENTSFor the year ended 31 December, 2017
Land and building Plant and machinery
Office furniture and equipment Motor vehicles Assets on hire Capital
work-in-progress Total
QR ’000 QR ’000 QR ’000 QR ’000 QR ’000 QR ’000 QR ’000
Cost/revaluation
At 1 January 2016 308,299 144,615 272,036 65,109 109,268 9,534 908,861
Additions 5,521 3,417 33,408 9,711 37,051 54,669 143,777
Disposals/other adjustments - (9,949) (23,847) (10,685) (26,686) - (71,167)
Reclassifications - - 4,309 33 - (4,342) -
At 31 December 2016 313,820 138,083 285,906 64,168 119,633 59,861 981,471
Accumulated depreciation:
At 1 January 2016 112,335 100,770 203,985 39,570 41,074 (5) 497,729
Charge for the year 13,641 10,683 35,408 10,416 28,919 - 99,067
Additions - - 1,949 - - - 1,949
Relating to disposals/other adjustments - (9,638) (20,975) (7,399) (16,872) - (54,884)
Relating to reclassifications (31) - (37) 50 18 - -
Effect of foreign exchange translation (226) 134 (201) 224 - (37) (106)
At 31 December 2016 125,719 101,949 220,129 42,861 53,139 (42) 543,755
Net carrying amount:
At December 31, 2016 188,101 36,134 65,777 21,307 66,494 59,903 437,716
14. PROPERTY, PLANT AND EQUIPMENT
Land and building Plant and machinery
Furniture and equipment Motor vehicles Assets on hire Capital
work-in-progress Total
QR ’000 QR ’000 QR ’000 QR ’000 QR ’000 QR ’000 QR ’000
Cost/revaluation:
At 1 January 2017 313,820 138,083 285,906 64,168 119,633 59,861 981,471
Acquired through business combination 4,794 59,856 190,081 - - 14,025 268,756
Additions 34,033 10,774 22,266 10,635 28,035 71,088 176,831
Transfers from investment properties (note 15) 31,179 - - - - - 31,179
Disposals/other adjustments (3,877) (38,860) (29,292) (17,005) (32,958) - (121,992)
Reclassifications 54,038 10,800 7,175 - - (72,013) -
At December 31, 2017 433,987 180,653 476,136 57,798 114,710 72,961 1,336,245
Accumulated depreciation:
At 1 January 2017 125,719 101,949 220,129 42,861 53,139 (42) 543,755
Acquired through business combination 2,813 43,326 117,201 - - - 163,340
Charge for the year 14,165 11,728 30,273 3,377 16,309 - 75,852
Transfer from investment properties (note 15) 10,694 - - - - - 10,694
Relating to disposals/other adjustments (2,267) (18,774) (20,821) (11,657) (23,663) - (77,182)
Effect of foreign exchange translation (160) 2 (943) (257) - (154) (1,512)
At December 31, 2017 150,964 138,231 345,839 34,324 45,785 (196) 714,947
Net carrying amount:
At December 31, 2017 283,023 42,422 130,297 23,474 68,925 73,157 621,298
87Annual Report 2017

Mannai Corporation Q.P.S.C.
NOTES TO THE CONSOLIDATED FINANCIAL STATEMENTSFor the year ended 31 December, 2017
14. PROPERTY, PLANT AND EQUIPMENT (Continued)
(i) Capital work in progress
Capital work-in-progress mainly includes the ongoing cost of new head office project.
(ii) Change in useful life of furniture and fixtures
During the year the Group re-assessed the useful life of furniture and fixtures. Based on this review, the estimated useful life of these assets was revised from 4 to 6 years to better reflect the expected pattern of consumption of future economic benefits embodied therein.
(iii) Transfer from investment property
During the year, the Group due to change of use, reclassified the Vault building, with a net carrying value of QR 20.45 million from investment properties (refer note 15).
15. INVESTMENT PROPERTIES
2017 2016
QR. ’000 QR. ’000
Cost:
At 1 January 225,089 224,680
Reclassification to property, plant and equipment (note 14) (31,179) -
Disposal/impairment - (780)
Reversal of impairment loss 8,901 -
Written-off in prior years (96,955) -
Effect of foreign exchange translation 612 1,189
At 31 December 106,468 225,089
Accumulated Depreciation/impairment:
At 1 January 127,673 121,113
Charge for the year 5,896 6,137
Reclassification to property, plant and equipment (note 14) (10,694) -
Disposal/impairment - (214)
Written-off in prior years (96,955) -
Effect of foreign exchange translation 324 637
At 31 December 26,244 127,673
Carrying amount as at 31 December 80,224 97,416
(a) Valuation
The group’s investment properties are stated at historical cost, less any accumulated depreciation and accumulated impairment losses. The fair value measurements of the group’s land and buildings as at 31 December 2017 were performed by a third party, independent valuator, who has appropriate qualifications and recent experience in the fair value measurement of the properties in the relevant locations. Valuation was conducted in line with practice guidelines set out in RCIS Valuation – Global Standards 2017, as issued by the Royal Institute of Chartered Surveyors by a third party independent valuator.
88 Mannai Corporation Q.P.S.C

Mannai Corporation Q.P.S.C.
NOTES TO THE CONSOLIDATED FINANCIAL STATEMENTSFor the year ended 31 December, 2017
The fair value of the land was determined, based on the market comparable approach that reflects recent transaction prices for similar properties, at QAR 12.90 million (2016: QAR 12.21 million). The fair value of the buildings was determined, using the market comparable approach or investment value approach that derives value based on expected rental yields, at QAR 109.92 million (2016: QAR 102.47 million) . The valuation approach is based on an individual assessment for each property type. Accordingly, the Group has reversed, previously recorded impairment loss of QAR 8.90 million in the current year and this is included in other income (refer note 24).
(b) Write off of investment properties
During the year the Group has written off of a number of properties that had previously been impaired in full as these were no longer under the control or ownership of the Group.
16. INCOME TAX EXPENSE
Accounting treatment of French Business Value Added Tax (CVAE)
The CVAE, which according to the Group’s analysis complies with the definition of an income tax asset forth in IAS 12, is recorded under income tax.
For the year ended 31 December 2017, the CVAE represented QR 44.9 million.
Tax PoolingAs at 31 December 2017, Gfi Informatique’s tax group in France comprised 16 companies. The existence of this tax group resulted in tax savings of QR 8.9 million for the Group over the year.
16.1 Reconciliation of theoretical and actual income tax expense The CVAE, which according to the Group’s analysis complies with the definition of an income tax asset forth in IAS 12, is recorded under income tax.
Income tax expense from subsidiaries
2017 2016
QR ’000 QR ’000
Gfi Informatique (i) 21,731 -
Other subsidiaries 1,671 2,459
23,402 2,459
(i) The reconciliation between the tax expense and the product of the accounting profit multiplied by the applicable tax rate is as follows:
2017
QR ’000
Profit before corporation tax 147,556
Tax rate 33.33%
Theoretical tax 49,180
Adjustments (27,450)
Income tax expense 21,731
Of which: Current tax 27,619
Deferred taxes (5,888)
21,731Adjustments include impact of permanent tax differences, impact of CVAE, tax savings from non-taxable income and other tax related adjustments. 89Annual Report 2017

Mannai Corporation Q.P.S.C.
NOTES TO THE CONSOLIDATED FINANCIAL STATEMENTSFor the year ended 31 December, 2017
16. INCOME TAX EXPENSE (Continued)
16.2 Deferred taxes At 31 December 2017, the sources of deferred taxes were as follows:
2017
QR ’000
Net deferred tax – French companies
Temporary differences arising from tax declarations 4,110
Temporary differences arising from consolidation adjustments 22,072
26,182
Net deferred tax – other foreign companies
Tax timing differences 3,816
Tax loss carry-forwards recognised 5,172
Customer relationships (7,330)
Others (2,143)
(485)
Net deferred tax – foreign companies 25,697
Presented in the consolidated financial statements as:
Deferred tax asset 35,268
Deferred tax liability (9,571)
25,697
17. INTEREST BEARING LOANS AND BORROWINGS
2017 2016
QR ’000 QR ’000
Working capital facilities and others (a) 1,631,690 1,088,581
Term loans (b) 3,030,191 2,423,798
Term loans (c) - 171,848
4,661,881 3,684,227
Presented in the consolidated statement of financial position as follows:
2017 2016
QR ’000 QR ’000
Current 2,113,609 1,377,917
Non-current 2,548,272 2,306,310
4,661,881 3,684,227
90 Mannai Corporation Q.P.S.C
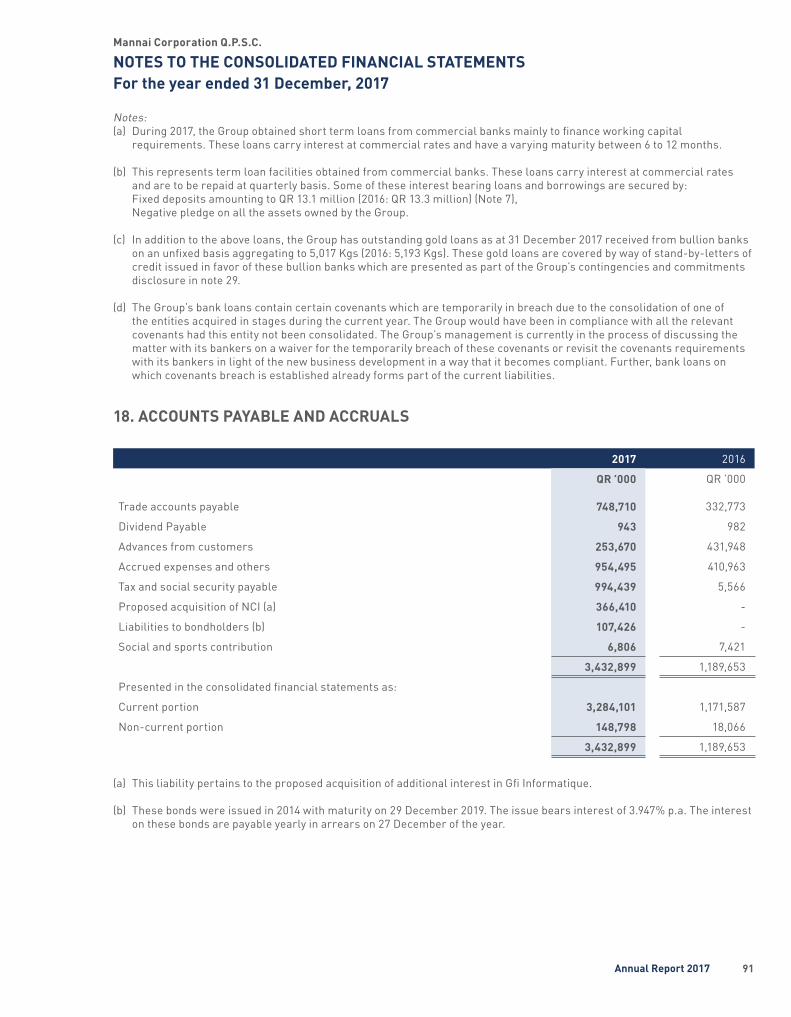
Mannai Corporation Q.P.S.C.
NOTES TO THE CONSOLIDATED FINANCIAL STATEMENTSFor the year ended 31 December, 2017
Notes:(a) During 2017, the Group obtained short term loans from commercial banks mainly to finance working capital
requirements. These loans carry interest at commercial rates and have a varying maturity between 6 to 12 months.
(b) This represents term loan facilities obtained from commercial banks. These loans carry interest at commercial rates and are to be repaid at quarterly basis. Some of these interest bearing loans and borrowings are secured by: Fixed deposits amounting to QR 13.1 million (2016: QR 13.3 million) (Note 7), Negative pledge on all the assets owned by the Group.
(c) In addition to the above loans, the Group has outstanding gold loans as at 31 December 2017 received from bullion banks on an unfixed basis aggregating to 5,017 Kgs (2016: 5,193 Kgs). These gold loans are covered by way of stand-by-letters of credit issued in favor of these bullion banks which are presented as part of the Group’s contingencies and commitments disclosure in note 29.
(d) The Group’s bank loans contain certain covenants which are temporarily in breach due to the consolidation of one of the entities acquired in stages during the current year. The Group would have been in compliance with all the relevant covenants had this entity not been consolidated. The Group’s management is currently in the process of discussing the matter with its bankers on a waiver for the temporarily breach of these covenants or revisit the covenants requirements with its bankers in light of the new business development in a way that it becomes compliant. Further, bank loans on which covenants breach is established already forms part of the current liabilities.
18. ACCOUNTS PAYABLE AND ACCRUALS
2017 2016
QR ’000 QR ’000
Trade accounts payable 748,710 332,773
Dividend Payable 943 982
Advances from customers 253,670 431,948
Accrued expenses and others 954,495 410,963
Tax and social security payable 994,439 5,566
Proposed acquisition of NCI (a) 366,410 -
Liabilities to bondholders (b) 107,426 -
Social and sports contribution 6,806 7,421
3,432,899 1,189,653
Presented in the consolidated financial statements as:
Current portion 3,284,101 1,171,587
Non-current portion 148,798 18,066
3,432,899 1,189,653
(a) This liability pertains to the proposed acquisition of additional interest in Gfi Informatique.
(b) These bonds were issued in 2014 with maturity on 29 December 2019. The issue bears interest of 3.947% p.a. The interest on these bonds are payable yearly in arrears on 27 December of the year.
91Annual Report 2017

Mannai Corporation Q.P.S.C.
NOTES TO THE CONSOLIDATED FINANCIAL STATEMENTSFor the year ended 31 December, 2017
19. EMPLOYEES’ END OF SERVICE BENEFITS
Movement in the provision recognised in the consolidated statement of financial position are as follows:
2017 2016QR ’000 QR ’000
Employees’ end of service benefits (a) 115,508 112,235
Retirement benefit plans (b) 196,405 -
At 31 December 311,913 112,235
(a) Employees’ end of service benefits
2017 2016QR ’000 QR ’000
At 1 January 112,235 112,312
Provided during the year 21,562 20,390
End of service benefits paid (18,403) (20,706)
Transfer from related party - 39
Exchange gain on translation of foreign currency 114 200
At 31 December 115,508 112,235
(b) Retirement benefit plan
The total value of the Group’s total retirement indemnities payable in France changed as follows:
2017QR ’000
Provision for retirement indemnities at 1 July 175,463
Newly consolidated companies and others 531
Cost of services rendered during the year 8,951
Amount paid for severance / retirement in the year (8,036)
Changes in actuarial differences 17,555
Exchange gain on translation of foreign currency 1,941
196,405
The legal and conventional indemnities are provisioned for each of the salaried employees of the Group present according to their theoretical seniority on the date of their retirement, according to IAS 19 revised.
These commitments are based on the assumption that in all cases employees will leave at their own initiative. The average rate of social security costs applied is 47%. The calculation of the commitments includes:
• An attendance coefficient based on turnover by age bracket; the average in 2017 was between 10.0% and 10.4% depending on the companies
• a wage rate of 2.25% to 3.00%• 2011-2013 INSEE mortality tables for both genders.
The life of the plan is estimated at 14 years, the discount rate used is 1.51%.
As regards to sensitivity, a drop in this discount rate of 0.25 basis points would generate a 3% increase in the commitment.
92 Mannai Corporation Q.P.S.C

Mannai Corporation Q.P.S.C.
NOTES TO THE CONSOLIDATED FINANCIAL STATEMENTSFor the year ended 31 December, 2017
20. SHARE CAPITAL
2017 2016
QR ’000 QR ’000
Authorised, issued and fully paid-up shares
45,619,200 shares of nominal value 10 QR each 456,192 456,192
21. RESERVES
(a) Legal reserveAs required by Qatar Commercial Companies Law, 10% of the profit for the year is required to be transferred to a legal reserve, until such reserve equals 50% of the issued share capital. The Group has resolved to cease such annual transfers as the legal reserve has reached the minimum required level. The reserve is not generally available for distribution except in the circumstances stipulated in the above law.
(b) Acquisition reserveIn case of acquisitions or disposal of subsidiaries without change in control, the difference between the decrease/increase in the non-controlling interests and the consideration paid or received is recognised as ‘acquisition reserve’ directly in equity attributed to the shareholders of the Company.
(c) Other reserveThis includes revaluation reserve amounting to QR 4.63 million, changes in actuarial differences – net of related tax amounting to QR 9.42 million and reserve created on proposed acquisition of NCI in Gfi Informatique amounting to QR 366.41 million which is expected to be completed in 2018.
(d) Foreign currency translation reserveThe translation reserve comprises all foreign currency differences arising from the translation of the financial statements of foreign operations.
22. DIVIDENDS PAID AND PROPOSED
The Board of Directors has proposed a cash dividend of QR 4 per share aggregating to QR 182.47 million for the year 2017, which is subject to the approval of the shareholders at the Annual General Assembly (2016: QR 4 per share totalling to QR 182.47 million).
During the year, the dividend paid amounted to QR 182.47 million (2016: QR 228.09 million).
23. SEGMENT INFORMATION
Management monitors the operating results of the operating segments to make decisions about resource allocation and performance assessment. Segment performance is evaluated based on operating profit or loss and is measured consistently with operating profit or loss in the consolidated financial statements. Transfer prices between operating segments are on an arm’s length basis in a manner similar to transactions with third parties.
Segment assets and liabilities comprise operating assets and liabilities which are directly handled by the operating segment and income or expenses that are attributed in line with the assets and liabilities allocated. The following table summarises the performance of the operating segments:
The Group classified the reporting segment based on its product and services as follows:
› Information technology› Auto group› Energy and industrial markets› Geotechnical services› Logistics› Travel› Engineering› Jewellery trading› Telecom retail› Others
93Annual Report 2017
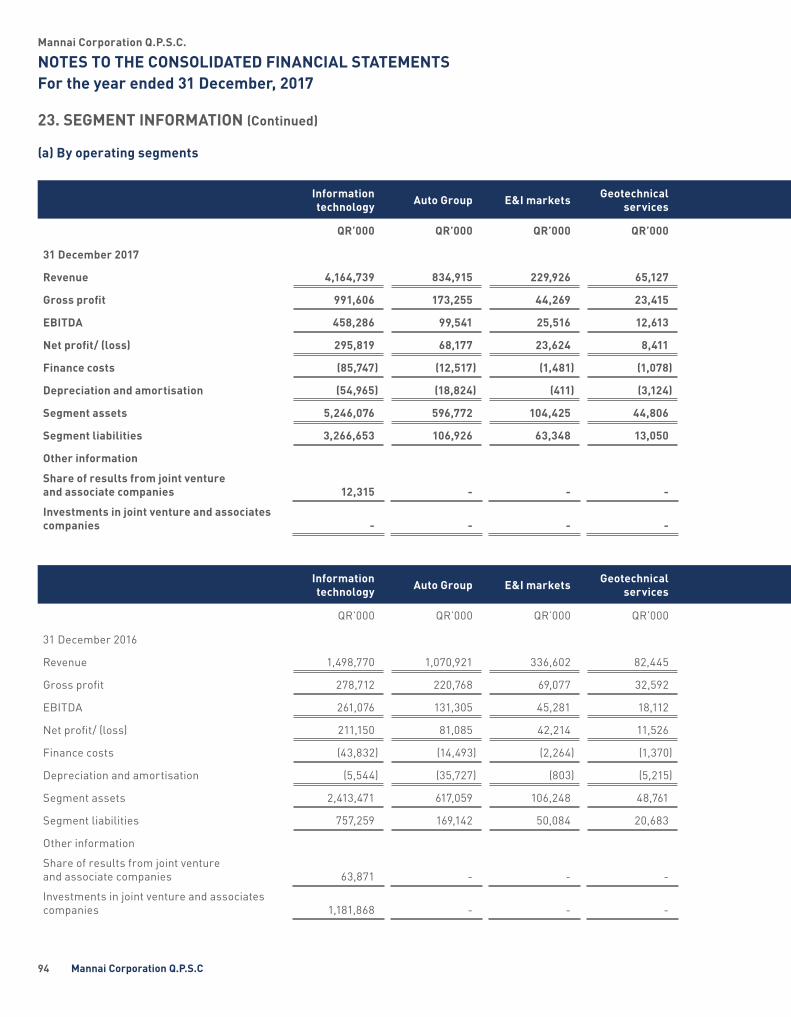
Mannai Corporation Q.P.S.C.
NOTES TO THE CONSOLIDATED FINANCIAL STATEMENTSFor the year ended 31 December, 2017
23. SEGMENT INFORMATION (Continued)
(a) By operating segments
Information technology Auto Group E&I markets Geotechnical
services Logistics Travel Engineering JewelleryTrading
Telecom retail Others Total
QR’000 QR’000 QR’000 QR’000 QR’000 QR’000 QR’000 QR’000 QR’000 QR’000 QR’000
31 December 2017
Revenue 4,164,739 834,915 229,926 65,127 33,276 27,606 64,118 1,570,504 - 51,118 7,041,329
Gross profit 991,606 173,255 44,269 23,415 11,398 23,838 6,245 436,761 - 23,159 1,733,946
EBITDA 458,286 99,541 25,516 12,613 6,091 5,943 6,182 171,156 6,559 57,706 849,593
Net profit/ (loss) 295,819 68,177 23,624 8,411 5,731 4,924 316 67,256 (5,780) 61,023 529,501
Finance costs (85,747) (12,517) (1,481) (1,078) (62) (663) (1,938) (72,484) (12,339) 14,720 (173,589)
Depreciation and amortisation (54,965) (18,824) (411) (3,124) (298) (356) (3,929) (29,791) - (11,403) (123,101)
Segment assets 5,246,076 596,772 104,425 44,806 17,460 39,315 69,864 1,705,822 1,096,826 2,829,241 11,750,607
Segment liabilities 3,266,653 106,926 63,348 13,050 13,236 16,936 64,676 531,733 - 4,730,150 8,806,708
Other information
Share of results from joint venture and associate companies 12,315 - - - 53,615 6,559 630 73,119
Investments in joint venture and associates companies - - - - 152,975 1,096,826 15,513 1,265,314
Information technology Auto Group E&I markets Geotechnical
services Logistics Travel Engineering JewelleryTrading
Telecom retail Others Total
QR’000 QR’000 QR’000 QR’000 QR’000 QR’000 QR’000 QR’000 QR’000 QR’000 QR’000
31 December 2016
Revenue 1,498,770 1,070,921 336,602 82,445 34,910 35,533 65,360 1,701,591 - 59,512 4,885,644
Gross profit 278,712 220,768 69,077 32,592 12,655 31,858 3,273 498,887 - 36,843 1,184,665
EBITDA 261,076 131,305 45,281 18,112 7,535 8,378 6,951 263,964 (10,809) 41,664 773,457
Net profit/ (loss) 211,150 81,085 42,214 11,526 7,176 6,724 278 145,693 (23,148) 52,303 535,001
Finance costs (43,832) (14,493) (2,264) (1,370) (33) (1,123) (2,220) (73,696) (12,339) 23,719 (127,651)
Depreciation and amortisation (5,544) (35,727) (803) (5,215) (326) (531) (4,453) (42,665) - (13,082) (108,346)
Segment assets 2,413,471 617,059 106,248 48,761 20,850 45,101 82,037 1,747,060 1,090,267 1,561,057 7,731,911
Segment liabilities 757,259 169,142 50,084 20,683 9,457 27,287 77,165 591,788 - 3,450,889 5,153,754
Other information
Share of results from joint venture and associate companies 63,871 - - - - - - 57,444 (10,809) (1,194) 109,312
Investments in joint venture and associates companies 1,181,868 - - - - - - 146,395 1,090,267 14,883 2,433,413
94 Mannai Corporation Q.P.S.C

Mannai Corporation Q.P.S.C.
NOTES TO THE CONSOLIDATED FINANCIAL STATEMENTSFor the year ended 31 December, 2017
23. SEGMENT INFORMATION (Continued)
(a) By operating segments
Information technology Auto Group E&I markets Geotechnical
services Logistics Travel Engineering JewelleryTrading
Telecom retail Others Total
QR’000 QR’000 QR’000 QR’000 QR’000 QR’000 QR’000 QR’000 QR’000 QR’000 QR’000
31 December 2017
Revenue 4,164,739 834,915 229,926 65,127 33,276 27,606 64,118 1,570,504 - 51,118 7,041,329
Gross profit 991,606 173,255 44,269 23,415 11,398 23,838 6,245 436,761 - 23,159 1,733,946
EBITDA 458,286 99,541 25,516 12,613 6,091 5,943 6,182 171,156 6,559 57,706 849,593
Net profit/ (loss) 295,819 68,177 23,624 8,411 5,731 4,924 316 67,256 (5,780) 61,023 529,501
Finance costs (85,747) (12,517) (1,481) (1,078) (62) (663) (1,938) (72,484) (12,339) 14,720 (173,589)
Depreciation and amortisation (54,965) (18,824) (411) (3,124) (298) (356) (3,929) (29,791) - (11,403) (123,101)
Segment assets 5,246,076 596,772 104,425 44,806 17,460 39,315 69,864 1,705,822 1,096,826 2,829,241 11,750,607
Segment liabilities 3,266,653 106,926 63,348 13,050 13,236 16,936 64,676 531,733 - 4,730,150 8,806,708
Other information
Share of results from joint venture and associate companies 12,315 - - - 53,615 6,559 630 73,119
Investments in joint venture and associates companies - - - - 152,975 1,096,826 15,513 1,265,314
Information technology Auto Group E&I markets Geotechnical
services Logistics Travel Engineering JewelleryTrading
Telecom retail Others Total
QR’000 QR’000 QR’000 QR’000 QR’000 QR’000 QR’000 QR’000 QR’000 QR’000 QR’000
31 December 2016
Revenue 1,498,770 1,070,921 336,602 82,445 34,910 35,533 65,360 1,701,591 - 59,512 4,885,644
Gross profit 278,712 220,768 69,077 32,592 12,655 31,858 3,273 498,887 - 36,843 1,184,665
EBITDA 261,076 131,305 45,281 18,112 7,535 8,378 6,951 263,964 (10,809) 41,664 773,457
Net profit/ (loss) 211,150 81,085 42,214 11,526 7,176 6,724 278 145,693 (23,148) 52,303 535,001
Finance costs (43,832) (14,493) (2,264) (1,370) (33) (1,123) (2,220) (73,696) (12,339) 23,719 (127,651)
Depreciation and amortisation (5,544) (35,727) (803) (5,215) (326) (531) (4,453) (42,665) - (13,082) (108,346)
Segment assets 2,413,471 617,059 106,248 48,761 20,850 45,101 82,037 1,747,060 1,090,267 1,561,057 7,731,911
Segment liabilities 757,259 169,142 50,084 20,683 9,457 27,287 77,165 591,788 - 3,450,889 5,153,754
Other information
Share of results from joint venture and associate companies 63,871 - - - - - - 57,444 (10,809) (1,194) 109,312
Investments in joint venture and associates companies 1,181,868 - - - - - - 146,395 1,090,267 14,883 2,433,413
95Annual Report 2017
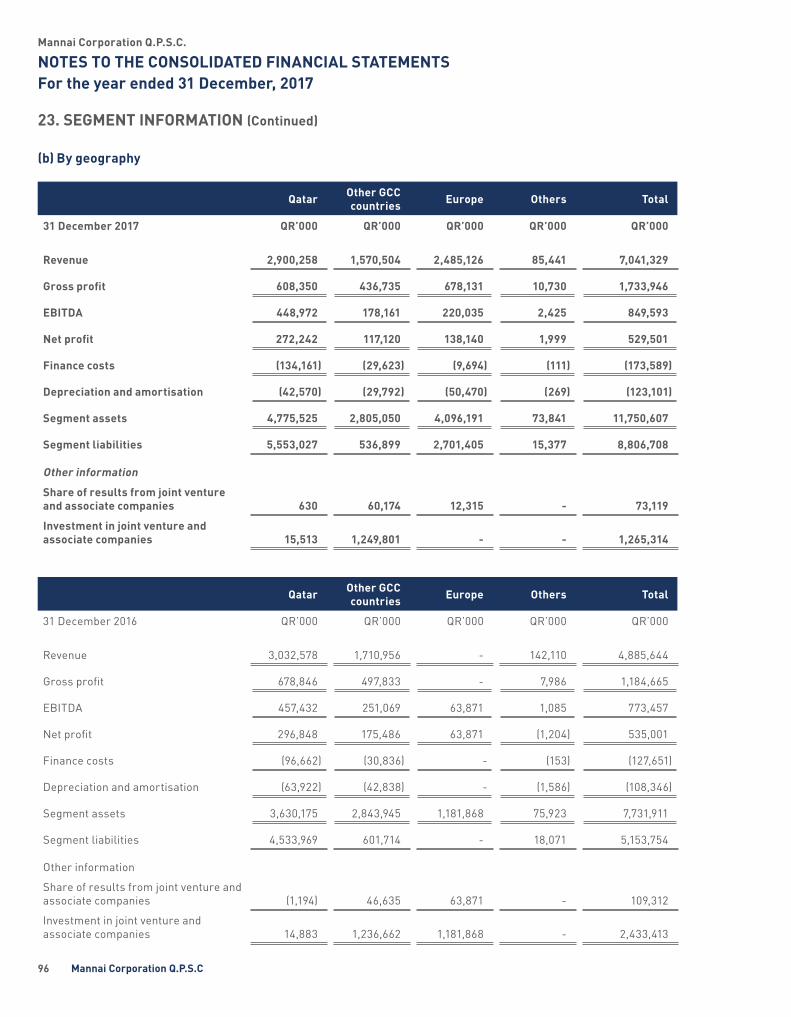
Mannai Corporation Q.P.S.C.
NOTES TO THE CONSOLIDATED FINANCIAL STATEMENTSFor the year ended 31 December, 2017
23. SEGMENT INFORMATION (Continued)
(b) By geography
Qatar Other GCC countries Europe Others Total
31 December 2017 QR’000 QR’000 QR’000 QR’000 QR’000
Revenue 2,900,258 1,570,504 2,485,126 85,441 7,041,329
Gross profit 608,350 436,735 678,131 10,730 1,733,946
EBITDA 448,972 178,161 220,035 2,425 849,593
Net profit 272,242 117,120 138,140 1,999 529,501
Finance costs (134,161) (29,623) (9,694) (111) (173,589)
Depreciation and amortisation (42,570) (29,792) (50,470) (269) (123,101)
Segment assets 4,775,525 2,805,050 4,096,191 73,841 11,750,607
Segment liabilities 5,553,027 536,899 2,701,405 15,377 8,806,708
Other information
Share of results from joint venture and associate companies 630 60,174 12,315 - 73,119
Investment in joint venture and associate companies 15,513 1,249,801 - - 1,265,314
Qatar Other GCC countries Europe Others Total
31 December 2016 QR’000 QR’000 QR’000 QR’000 QR’000
Revenue 3,032,578 1,710,956 - 142,110 4,885,644
Gross profit 678,846 497,833 - 7,986 1,184,665
EBITDA 457,432 251,069 63,871 1,085 773,457
Net profit 296,848 175,486 63,871 (1,204) 535,001
Finance costs (96,662) (30,836) - (153) (127,651)
Depreciation and amortisation (63,922) (42,838) - (1,586) (108,346)
Segment assets 3,630,175 2,843,945 1,181,868 75,923 7,731,911
Segment liabilities 4,533,969 601,714 - 18,071 5,153,754
Other information
Share of results from joint venture and associate companies (1,194) 46,635 63,871 - 109,312
Investment in joint venture and associate companies 14,883 1,236,662 1,181,868 - 2,433,413
96 Mannai Corporation Q.P.S.C

Mannai Corporation Q.P.S.C.
NOTES TO THE CONSOLIDATED FINANCIAL STATEMENTSFor the year ended 31 December, 2017
24. OTHER INCOME 2017 2016
QR ’000 QR ’000
Reversal of impairment/ recoveries of receivables 20,501 80,381Gain on disposal of property, plant and equipment 9,035 3,407Foreign exchange gain 19,396 70,865Gain on previously held interest in an acquired subsidiary 165,950 -Reversal of impairment on investment properties 8,901 -Miscellaneous income 59,749 68,245
283,532 222,898
25. GENERAL AND ADMINISTRATIVE EXPENSES2017 2016
QR ’000 QR ’000
Staff costs 387,489 215,268Legal and professional fees 58,433 30,883Rent 72,939 25,464Tax and levies 32,619 -Directors’ remuneration 23,981 25,353Repairs and maintenance 51,997 22,351Travelling 23,231 16,602Communication 26,610 13,395Equipment rent 12,455 -Utility charges 10,236 7,763Insurance 10,588 6,221Bank charges 8,759 5,947Printing and stationery 9,133 3,737Provision for settlement receivable 4,358 -Other administrative expenses and allowances 109,334 39,343
842,162 412,327
26. SELLING AND DISTRIBUTION EXPENSES2017 2016
QR ’000 QR ’000
Staff costs 226,687 140,448Rent 97,789 109,281Advertisement and other promotion expenses 74,366 81,362
398,842 331,091
27. EARNINGS PER SHAREBasic earnings per share is calculated by dividing the profit for the year by the weighted average number of ordinary shares outstanding during the year.
2017 2016
Profit for the year attributable to the shareholders of the Company (QR ’000) 506,135 535,117
Weighted average number of shares outstanding during the year (in thousands of shares) 45,619 45,619
Basic and diluted earnings per share (QR) (attributable to the shareholders of the Company) 11.09 11.73
97Annual Report 2017

Mannai Corporation Q.P.S.C.
NOTES TO THE CONSOLIDATED FINANCIAL STATEMENTSFor the year ended 31 December, 2017
28. RELATED PARTY DISCLOSURES
Related parties represent associated companies, major shareholders, directors and key management personnel of the Group and entities in which they are principal owners. Pricing policies and terms of these transactions are approved by the Group’s management.
(a) Related party transactionsTransactions with related parties included in the consolidated statement of profit or loss are as follows:
Nature Relationship 2017 2016QR ’000 QR ’000
Sales Affiliates 106,072 113,748
Purchases Affiliates 8,885 9,037
(b) Related party balances
2017 2016QR ’000 QR ’000
Due from related partiesReceivable from joint venture companies and associates 28,398 33,886Long term loans to joint venture companies and associates, net 38,987 32,544
67,385 66,430Presented in the financials as follows :Current 28,398 33,886Non-current 38,987 32,544
67,385 66,430
Due to related partiesPayable to joint venture companies and associates 5,280 2,426
5,280 2,426
Long term loans to related parties (associates and joint ventures) represent loans which are interest free, unsecured and have no fixed terms of repayment. These loans are in the nature of working capital advances and are not expected to be recalled within a period of twelve months from the reporting date.
Outstanding balances at 31 December 2017 arose in the normal course of business.
(c) Terms and conditions of transactions with related parties
The sales to and purchases from related parties are made at terms equivalent to those that prevail in arms-length transactions. Outstanding balances at the reporting date are unsecured, interest free and the settlement occurs in cash. There have been no guarantees provided or received for any related party receivables or payables.
(d) Compensation of key management personnel
The remuneration of key management personnel during the year is as follows:
2017 2016QR ’000 QR ’000
Short term benefits 12,854 12,958
Post-employment benefits 1,245 1,183
14,099 14,141
Directors’ remuneration 23,981 25,353
98 Mannai Corporation Q.P.S.C

Mannai Corporation Q.P.S.C.
NOTES TO THE CONSOLIDATED FINANCIAL STATEMENTSFor the year ended 31 December, 2017
29. CONTINGENCIES AND COMMITMENTS
(a) Contingent liabilities
Under the bank facilities agreement, cross guarantees exist between certain Group companies, which could be enforced by the financiers, if the borrowers were to be in default of the finance agreement. Each member of the Group is therefore irrevocably, unconditionally and jointly and severally liable as principal obligor. The amount of Group facilities outstanding is as follows:
2017 2016QR ’000 QR ’000
Letters of guarantees 407,027 478,162
Letters of credit 98,710 49,147
Stand-by letters of credit 733,905 731,916
1,239,642 1,259,225
The stand-by letters of credit are provided by commercial banks in favour of the suppliers of gold who have loaned gold on an unfixed basis to the Group (refer note 17 (c)).
(b) Commitments
Capital commitments 2017 2016
QR ’000 QR ’000
Capital work in progress – contracted but not provided for 140,078 181,197
Operating lease commitments under non-cancellable lease arrangements 2017 2016
QR ’000 QR ’000
Less than one year 169,980 137,371
1 to 5 years 231,564 99,996
Above five year 3,135 3,996
404,679 241,363
(c) Contingent liabilities and commitments related to joint ventures and associates
2017 2016QR ’000 QR ’000
Contingent liabilities› Guarantees 55,459 79,270
› Letters of credit 39,799 39,694
95,258 118,964
Operating lease commitments› Less than one year 14,233 42,951
› 1 to 5 years 16,150 80,401
› Above 5 years 18,160 18,012
48,543 141,364
Certain operating lease commitments relating to previously held interest in an associate have been reclassified due to conversion of associate to subsidiary during the year, hence, they are not comparable.
99Annual Report 2017

Mannai Corporation Q.P.S.C.
NOTES TO THE CONSOLIDATED FINANCIAL STATEMENTSFor the year ended 31 December, 2017
30. FINANCIAL INSTRUMENTS
Financial instruments represent any contractual agreement that creates a financial asset, financial liability or an equity instrument. The Group’s principal financial liabilities comprise interest bearing loans and borrowings, bank overdrafts, accounts payable, amounts due to related parties and other payables. The main purpose of these financial liabilities is to finance the Group’s operations. The Group’s financial assets comprise bank balances and cash, accounts and retention receivable, available for sale financial investments, amounts due from related parties and certain other receivables that arise directly from its operation.
Fair value measurements
This note provides information about how the Group determines fair values of various financial assets and financial liabilities.
Some of the Group’s financial assets and financial liabilities are measured at fair value at the end of each reporting period. The following table gives information about how the fair values of these financial assets and financial liabilities are determined.
Financial assets/financialliabilities Fair value as at December 31, Fair value
Hierarchy
2017 2016
QR ’000 QR ’000
Available-for-sale investments 11,639 13,367 Level 3
There is no in or out movement from Level 3 fair value measurements. The investments classified under Level 3 category have been fair-valued based on information available for each investment.
AFS investments amounting to QR 26.6 million (2016: QR 26.6 million) are carried at cost less impairment, since their fair value cannot be reliably estimated.
All other financial assets and liabilities are carried at amortized cost. The fair values of the financial assets and liabilities are not materially different from their carrying values in the consolidated statement of financial position, as these assets and liabilities are either of short term maturities or are re-priced frequently based on market movement in interest rates.
Fair value sensitivity analysis
The following table shows the sensitivity of fair values to 10% increase or decrease as at December 31:
2017 2016
Basis points +/-1,000 +/-1,000
Effect on equity (QR ’000) +/-1,164 +/-1,337
31. FINANCIAL RISK MANAGEMENT
The Group is exposed to credit risk, liquidity risk and market risks such as currency risk, price risk and interest rate risk. The Group monitors and manages the risks relating to its operations through internal risk reports. The major risks are discussed below.
Market risk
Market risk is the risk that the fair value or future cash flows of a financial instrument will fluctuate because of changes in market prices. Market prices comprise four types of risk: interest rate risk, currency risk, commodity price risk and other price risk, such as equity price risk.
100 Mannai Corporation Q.P.S.C
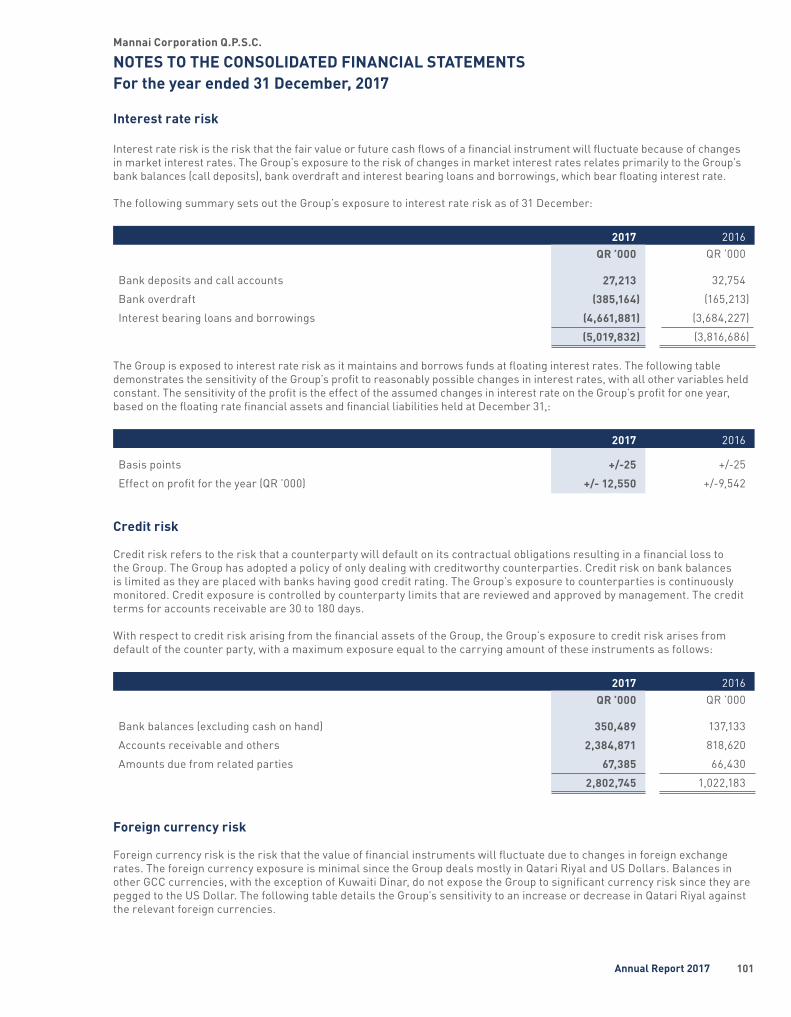
Mannai Corporation Q.P.S.C.
NOTES TO THE CONSOLIDATED FINANCIAL STATEMENTSFor the year ended 31 December, 2017
Interest rate risk
Interest rate risk is the risk that the fair value or future cash flows of a financial instrument will fluctuate because of changes in market interest rates. The Group’s exposure to the risk of changes in market interest rates relates primarily to the Group’s bank balances (call deposits), bank overdraft and interest bearing loans and borrowings, which bear floating interest rate.
The following summary sets out the Group’s exposure to interest rate risk as of 31 December:
2017 2016QR ’000 QR ’000
Bank deposits and call accounts 27,213 32,754
Bank overdraft (385,164) (165,213)
Interest bearing loans and borrowings (4,661,881) (3,684,227)
(5,019,832) (3,816,686)
The Group is exposed to interest rate risk as it maintains and borrows funds at floating interest rates. The following table demonstrates the sensitivity of the Group’s profit to reasonably possible changes in interest rates, with all other variables held constant. The sensitivity of the profit is the effect of the assumed changes in interest rate on the Group’s profit for one year, based on the floating rate financial assets and financial liabilities held at December 31,:
2017 2016
Basis points +/-25 +/-25
Effect on profit for the year (QR ’000) +/- 12,550 +/-9,542
Credit risk
Credit risk refers to the risk that a counterparty will default on its contractual obligations resulting in a financial loss to the Group. The Group has adopted a policy of only dealing with creditworthy counterparties. Credit risk on bank balances is limited as they are placed with banks having good credit rating. The Group’s exposure to counterparties is continuously monitored. Credit exposure is controlled by counterparty limits that are reviewed and approved by management. The credit terms for accounts receivable are 30 to 180 days.
With respect to credit risk arising from the financial assets of the Group, the Group’s exposure to credit risk arises from default of the counter party, with a maximum exposure equal to the carrying amount of these instruments as follows:
2017 2016QR ’000 QR ’000
Bank balances (excluding cash on hand) 350,489 137,133
Accounts receivable and others 2,384,871 818,620
Amounts due from related parties 67,385 66,430
2,802,745 1,022,183
Foreign currency risk
Foreign currency risk is the risk that the value of financial instruments will fluctuate due to changes in foreign exchange rates. The foreign currency exposure is minimal since the Group deals mostly in Qatari Riyal and US Dollars. Balances in other GCC currencies, with the exception of Kuwaiti Dinar, do not expose the Group to significant currency risk since they are pegged to the US Dollar. The following table details the Group’s sensitivity to an increase or decrease in Qatari Riyal against the relevant foreign currencies.
101Annual Report 2017

Mannai Corporation Q.P.S.C.
NOTES TO THE CONSOLIDATED FINANCIAL STATEMENTSFor the year ended 31 December, 2017
31. FINANCIAL RISK MANAGEMENT (Continued)Foreign currency risk (Continued)
The sensitivity analysis includes only outstanding foreign currency denominated monetary items and the impact of a change in the exchange rates are as follows:
Net Exposure (Liability) 2017 2016QR ’000 QR ’000
EURO 383,389 16,345
GBP 6,159 1,640
Other currencies 4,132 4,521
393,680 22,506
Increase/decrease in Euro, GBP and other
rates to the QR
Effect on profitbefore tax
QR ‘000
2017 +/- 3% +/- 11,810
2016 +/- 3% +/- 675
Liquidity risk
Liquidity risk is the risk that the Group will not be able to meet its obligations as they fall due. The Group’s approach to managing liquidity risk is to ensure, as far as possible, that it will always have sufficient liquidity to meet its liabilities when due, under both normal and stressed conditions, without incurring unacceptable losses or risking damage to the Group’s operations and reputation.
The Group limits its liquidity risk by ensuring bank facilities are available. The Group’s terms of sale require amounts to be paid within 30-180 days of the date of sale.
The table below summarises the maturities of the Group’s undiscounted financial liabilities at 31 December, based on contractual payment dates and current market interest rates.
Less than 1 year 1 to 5 years Total
At 31 December 2017 QR ’000 QR ’000 QR ’000
Accounts payable and accruals 3,030,431 148,798 3,179,229
Amounts due to related parties 5,280 - 5,280
Interest bearing loans and borrowings at gross 2,287,663 2,712,383 5,000,046
Bank overdrafts 385,164 - 385,164
Total 5,708,538 2,861,181 8,569,719
Less than 1 year 1 to 5 years Total
At 31 December 2016 QR ’000 QR ’000 QR ’000
Account payable and accruals 739,639 18,066 757,705
Amounts due to related parties 2,426 - 2,426
Interest bearing loans and borrowings at gross 1,485,694 2,414,479 3,900,173
Bank overdrafts 165,213 - 165,213
Total 2,392,972 2,432,545 4,825,517
102 Mannai Corporation Q.P.S.C

Mannai Corporation Q.P.S.C.
NOTES TO THE CONSOLIDATED FINANCIAL STATEMENTSFor the year ended 31 December, 2017
Capital management
The Group manages its capital structure to ensure that it will be able to continue as a going concern while maximizing the return to shareholders through the optimization of debt and equity balances. The Group’s overall strategy remains unchanged from 2016. The Group monitors its capital using a gearing ratio which is net debt divided by total equity. The Group includes within the net debt, interest bearing loans and borrowings (included in Note 17) and bank overdraft less bank balances and cash.
Gearing ratio The gearing ratio at December 31, is as follows:
2017 2016QR ‘000 QR ‘000
Debt 5,047,045 3,849,440
Bank balances and cash (362,766) (153,440)
Net debt 4,684,279 3,696,000
Total equity 2,943,899 2,578,157
Add: acquisition reserve 588,058 588,058
3,531,957 3,166,215
Gearing ratio 1.33:1 1.17:1
32. STEP ACQUISITION OF GFI INFORMATIQUE
In July 2017, the Group completed acquisition of 29.97% additional shareholding interest in Gfi Informatique (“Gfi”). As a result of the above, the Group’s ownership and voting interests in Gfi, previously treated as an associate and accounted for under equity accounting method, increased from 51.24% to 81.21%. Consequently, Gfi is fully consolidated within the Group’s consolidated financial statements for the year ended 31 December 2017 starting from the date of control has been obtained.
Moreover, the Group has re-measured its previously held interests in Gfi Informatique at fair value and recognised a revaluation gain of QR 165.9 million in the consolidated statement of profit or loss and other comprehensive income. The revaluation of previously held interests was based on the same price that was paid for the additional controlling interests acquired during the period, after adjusting for control premium.
Since the acquisition date and up to 31 December 2017, Gfi contributed a net profit of QR 102.2 million. The management expects that taking control of Gfi will enable the Group in expanding its Information Technology activities and operations in the French market.
103Annual Report 2017
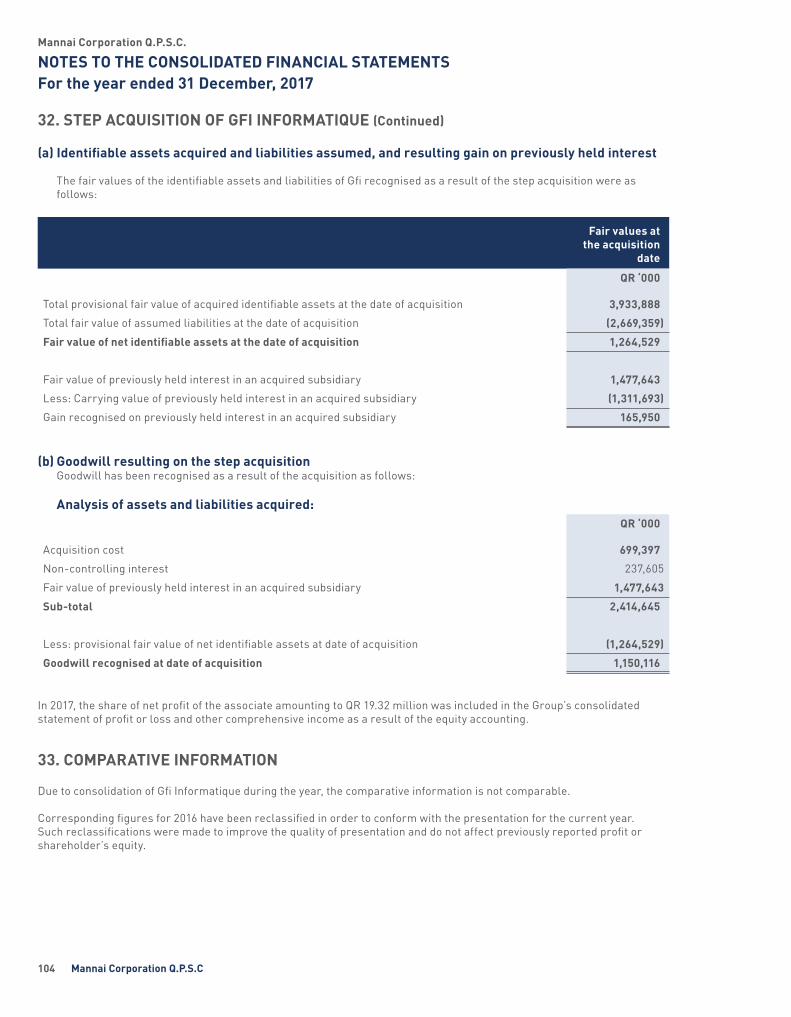
Mannai Corporation Q.P.S.C.
NOTES TO THE CONSOLIDATED FINANCIAL STATEMENTSFor the year ended 31 December, 2017
32. STEP ACQUISITION OF GFI INFORMATIQUE (Continued)
(a) Identifiable assets acquired and liabilities assumed, and resulting gain on previously held interest
The fair values of the identifiable assets and liabilities of Gfi recognised as a result of the step acquisition were as follows:
Fair values at the acquisition
date
QR ‘000
Total provisional fair value of acquired identifiable assets at the date of acquisition 3,933,888
Total fair value of assumed liabilities at the date of acquisition (2,669,359)
Fair value of net identifiable assets at the date of acquisition 1,264,529
Fair value of previously held interest in an acquired subsidiary 1,477,643
Less: Carrying value of previously held interest in an acquired subsidiary (1,311,693)
Gain recognised on previously held interest in an acquired subsidiary 165,950
(b) Goodwill resulting on the step acquisitionGoodwill has been recognised as a result of the acquisition as follows:
Analysis of assets and liabilities acquired:QR ‘000
Acquisition cost 699,397
Non-controlling interest 237,605
Fair value of previously held interest in an acquired subsidiary 1,477,643
Sub-total 2,414,645
Less: provisional fair value of net identifiable assets at date of acquisition (1,264,529)
Goodwill recognised at date of acquisition 1,150,116
In 2017, the share of net profit of the associate amounting to QR 19.32 million was included in the Group’s consolidated statement of profit or loss and other comprehensive income as a result of the equity accounting.
33. COMPARATIVE INFORMATION
Due to consolidation of Gfi Informatique during the year, the comparative information is not comparable.
Corresponding figures for 2016 have been reclassified in order to conform with the presentation for the current year. Such reclassifications were made to improve the quality of presentation and do not affect previously reported profit or shareholder’s equity.
104 Mannai Corporation Q.P.S.C

