a nanoplasmonic molecular ruler for measuring …nanobionano.unibo.it/nanotech/papers/5...black...
TRANSCRIPT
Black plate (47,1)
A nanoplasmonic molecular ruler formeasuring nuclease activity andDNA footprinting
GANG L. LIU1, YADONG YIN2,3‡, SIRI KUNCHAKARRA2, BIPASHA MUKHERJEE2, DANIELE GERION2,4,STEPHEN D. JETT5, DAVID G. BEAR5, JOE W. GRAY2, A. PAUL ALIVISATOS2,3, LUKE P. LEE1* ANDFANQING FRANK CHEN2*1Biomolecular Nanotechnology Center, Department of Bioengineering, University of California at Berkeley, Berkeley, California 94720, USA2Lawrence Berkeley National Laboratory, Berkeley, California 94720, USA3Department of Chemistry, University of California, Berkeley, California 94720, USA4Lawrence Livermore National Laboratory, Livermore, California 94551, USA5Department of Cell Biology and Physiology and the Cancer Research and Treatment Center, University of New Mexico Health Sciences Center, Albuquerque,
New Mexico 87131, USA‡Present address: Department of Chemistry, University of California at Riverside, Riverside, California 92521, USA
*e-mail: [email protected] and [email protected]
Published online: 4 October 2006; doi:10.1038/nnano.2006.51
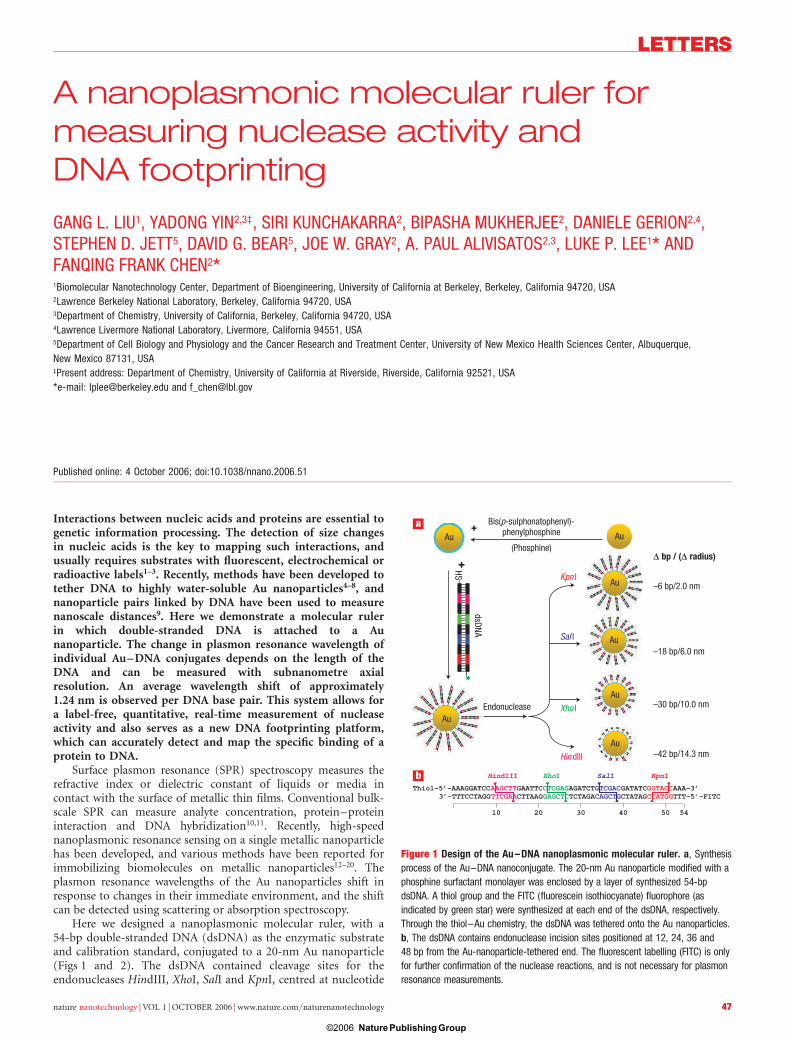
Interactions between nucleic acids and proteins are essential togenetic information processing. The detection of size changesin nucleic acids is the key to mapping such interactions, andusually requires substrates with fluorescent, electrochemical orradioactive labels1–3. Recently, methods have been developed totether DNA to highly water-soluble Au nanoparticles4–8, andnanoparticle pairs linked by DNA have been used to measurenanoscale distances9. Here we demonstrate a molecular rulerin which double-stranded DNA is attached to a Aunanoparticle. The change in plasmon resonance wavelength ofindividual Au –DNA conjugates depends on the length of theDNA and can be measured with subnanometre axialresolution. An average wavelength shift of approximately1.24 nm is observed per DNA base pair. This system allows fora label-free, quantitative, real-time measurement of nucleaseactivity and also serves as a new DNA footprinting platform,which can accurately detect and map the specific binding of aprotein to DNA.
Surface plasmon resonance (SPR) spectroscopy measures therefractive index or dielectric constant of liquids or media incontact with the surface of metallic thin films. Conventional bulk-scale SPR can measure analyte concentration, protein–proteininteraction and DNA hybridization10,11. Recently, high-speednanoplasmonic resonance sensing on a single metallic nanoparticlehas been developed, and various methods have been reported forimmobilizing biomolecules on metallic nanoparticles12–20. Theplasmon resonance wavelengths of the Au nanoparticles shift inresponse to changes in their immediate environment, and the shiftcan be detected using scattering or absorption spectroscopy.
Here we designed a nanoplasmonic molecular ruler, with a54-bp double-stranded DNA (dsDNA) as the enzymatic substrateand calibration standard, conjugated to a 20-nm Au nanoparticle(Figs 1 and 2). The dsDNA contained cleavage sites for theendonucleases HindIII, XhoI, SalI and KpnI, centred at nucleotide
Kpn I
Sal I
Hin dIII
Xho IEndonuclease
+
(Phosphine)
+Δ bp / (Δ radius)
–6 bp/2.0 nm
Au
Au
Au
Au
Au
Au
Au
HS
–18 bp/6.0 nm
–30 bp/10.0 nm
–42 bp/14.3 nm
Bis(p-sulphonatophenyl)-phenylphosphine
dsDNA
Thiol–5’–AAAGGATCCAAGCTTGAATTCCTCGAGAGATCTGTCGACGATATCGGTACCAAA–3’3’–TTTCCTAGGTTCGAACTTAAGGAGCTCTCTAGACAGCTGCTATAGCCATGGTTT–5’–FITC
HindIII XhoI SalI KpnI
*| | | | | | | | | | | | | | | | | | | | | | | | | | | | | | | | | | | *| | | | | | | | | | | | | | | | | | | | | | | | | | | | | | | | | | |
a
b
10 20 30 40 50 54
Figure 1 Design of the Au–DNA nanoplasmonic molecular ruler. a, Synthesis
process of the Au–DNA nanoconjugate. The 20-nm Au nanoparticle modified with a
phosphine surfactant monolayer was enclosed by a layer of synthesized 54-bp
dsDNA. A thiol group and the FITC (fluorescein isothiocyanate) fluorophore (as
indicated by green star) were synthesized at each end of the dsDNA, respectively.
Through the thiol–Au chemistry, the dsDNA was tethered onto the Au nanoparticles.
b, The dsDNA contains endonuclease incision sites positioned at 12, 24, 36 and
48 bp from the Au-nanoparticle-tethered end. The fluorescent labelling (FITC) is only
for further confirmation of the nuclease reactions, and is not necessary for plasmon
resonance measurements.
LETTERS
nature nanotechnology | VOL 1 | OCTOBER 2006 | www.nature.com/naturenanotechnology 47
Nature Publishing Group ©2006
Black plate (48,1)
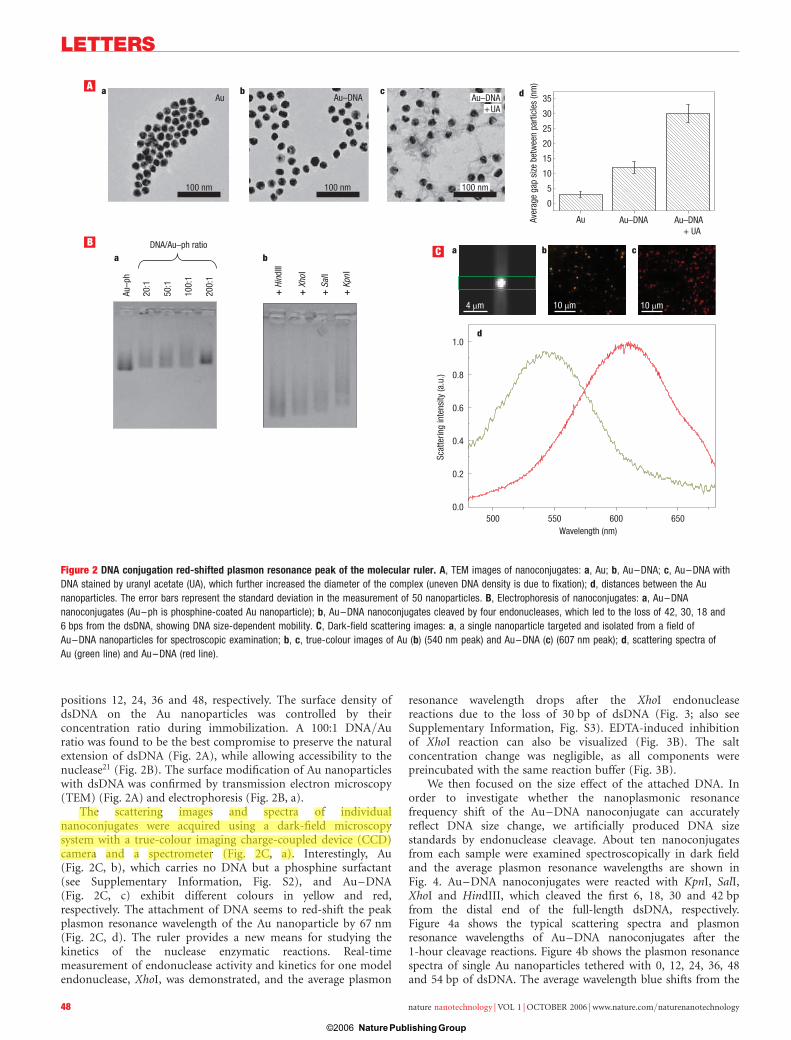
positions 12, 24, 36 and 48, respectively. The surface density ofdsDNA on the Au nanoparticles was controlled by theirconcentration ratio during immobilization. A 100:1 DNA/Auratio was found to be the best compromise to preserve the naturalextension of dsDNA (Fig. 2A), while allowing accessibility to thenuclease21 (Fig. 2B). The surface modification of Au nanoparticleswith dsDNA was confirmed by transmission electron microscopy(TEM) (Fig. 2A) and electrophoresis (Fig. 2B, a).
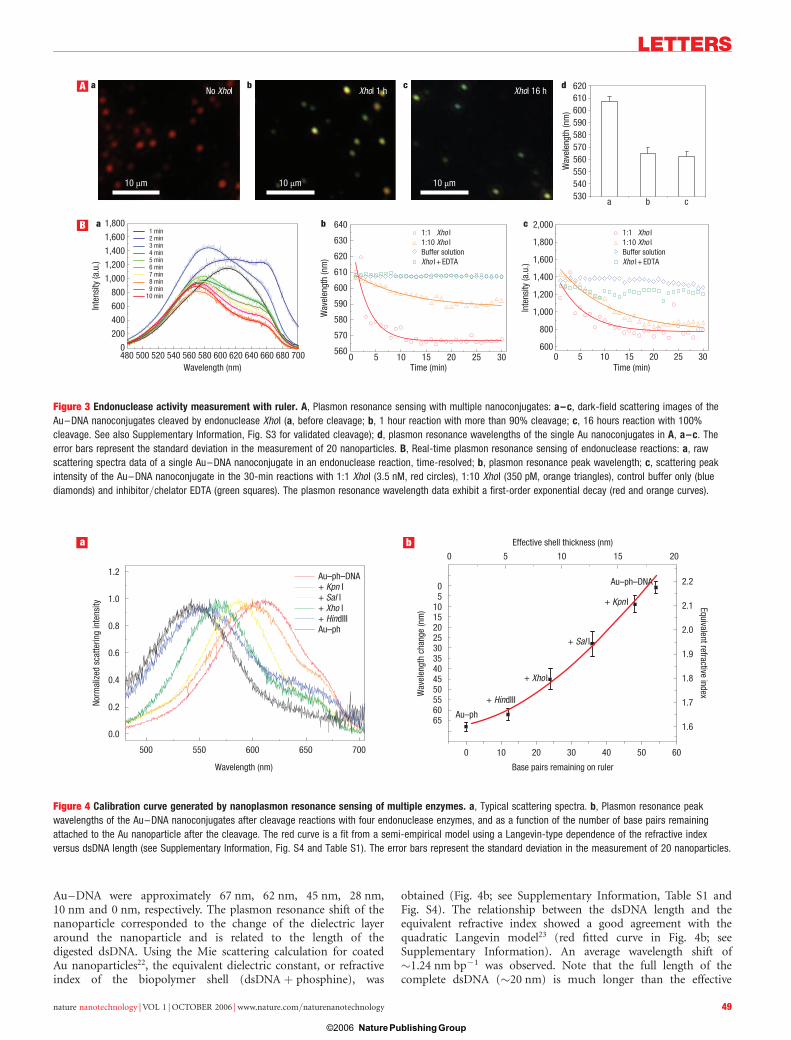
The scattering images and spectra of individualnanoconjugates were acquired using a dark-field microscopysystem with a true-colour imaging charge-coupled device (CCD)camera and a spectrometer (Fig. 2C, a). Interestingly, Au(Fig. 2C, b), which carries no DNA but a phosphine surfactant(see Supplementary Information, Fig. S2), and Au–DNA(Fig. 2C, c) exhibit different colours in yellow and red,respectively. The attachment of DNA seems to red-shift the peakplasmon resonance wavelength of the Au nanoparticle by 67 nm(Fig. 2C, d). The ruler provides a new means for studying thekinetics of the nuclease enzymatic reactions. Real-timemeasurement of endonuclease activity and kinetics for one modelendonuclease, XhoI, was demonstrated, and the average plasmon
resonance wavelength drops after the XhoI endonucleasereactions due to the loss of 30 bp of dsDNA (Fig. 3; also seeSupplementary Information, Fig. S3). EDTA-induced inhibitionof XhoI reaction can also be visualized (Fig. 3B). The saltconcentration change was negligible, as all components werepreincubated with the same reaction buffer (Fig. 3B).
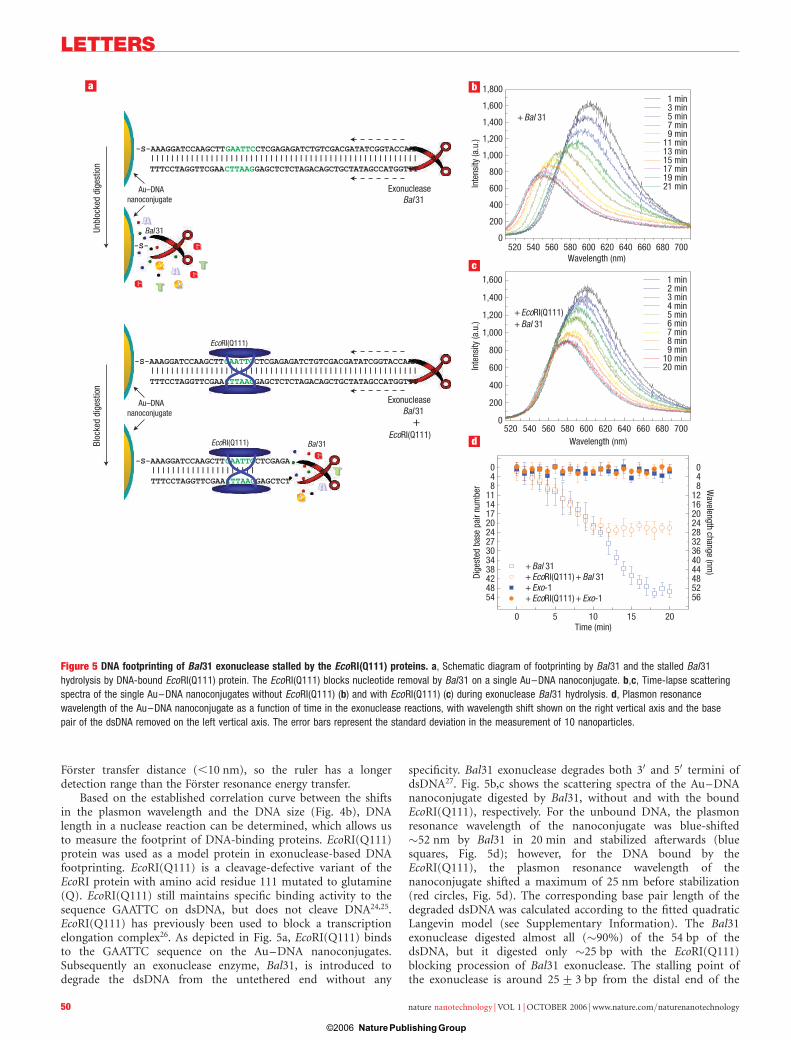
We then focused on the size effect of the attached DNA. Inorder to investigate whether the nanoplasmonic resonancefrequency shift of the Au–DNA nanoconjugate can accuratelyreflect DNA size change, we artificially produced DNA sizestandards by endonuclease cleavage. About ten nanoconjugatesfrom each sample were examined spectroscopically in dark fieldand the average plasmon resonance wavelengths are shown inFig. 4. Au–DNA nanoconjugates were reacted with KpnI, SalI,XhoI and HindIII, which cleaved the first 6, 18, 30 and 42 bpfrom the distal end of the full-length dsDNA, respectively.Figure 4a shows the typical scattering spectra and plasmonresonance wavelengths of Au–DNA nanoconjugates after the1-hour cleavage reactions. Figure 4b shows the plasmon resonancespectra of single Au nanoparticles tethered with 0, 12, 24, 36, 48and 54 bp of dsDNA. The average wavelength blue shifts from the
0.0500 550 600 650
0.2
0.4
0.6
0.8
1.0
Scat
terin
g in
tens
ity (a
.u.)
Wavelength (nm)
Au–p
h
20:1
50:1
100:
1
200:
1
DNA/Au–ph ratio
+ + + ++ H
in dI
II
+ X
ho I
+ S
al I
+ K
pn I
100 nm
Au
100 nm
Au–DNA
100 nm
Au–DNA+ UA
0
5
10
15
20
25
30
35
Aver
age
gap
size
bet
wee
n pa
rticl
es (n
m)
Au–DNA + UA
Au–DNAAu
ba
a b c d
d
A
BC
10 μm
b c
10 μm
a
4 μm
Figure 2 DNA conjugation red-shifted plasmon resonance peak of the molecular ruler. A, TEM images of nanoconjugates: a, Au; b, Au–DNA; c, Au–DNA with
DNA stained by uranyl acetate (UA), which further increased the diameter of the complex (uneven DNA density is due to fixation); d, distances between the Au
nanoparticles. The error bars represent the standard deviation in the measurement of 50 nanoparticles. B, Electrophoresis of nanoconjugates: a, Au–DNA
nanoconjugates (Au–ph is phosphine-coated Au nanoparticle); b, Au–DNA nanoconjugates cleaved by four endonucleases, which led to the loss of 42, 30, 18 and
6 bps from the dsDNA, showing DNA size-dependent mobility. C, Dark-field scattering images: a, a single nanoparticle targeted and isolated from a field of
Au–DNA nanoparticles for spectroscopic examination; b, c, true-colour images of Au (b) (540 nm peak) and Au–DNA (c) (607 nm peak); d, scattering spectra of
Au (green line) and Au–DNA (red line).
LETTERS
nature nanotechnology | VOL 1 | OCTOBER 2006 | www.nature.com/naturenanotechnology48
Nature Publishing Group ©2006
Black plate (49,1)
Au–DNA were approximately 67 nm, 62 nm, 45 nm, 28 nm,10 nm and 0 nm, respectively. The plasmon resonance shift of thenanoparticle corresponded to the change of the dielectric layeraround the nanoparticle and is related to the length of thedigested dsDNA. Using the Mie scattering calculation for coatedAu nanoparticles22, the equivalent dielectric constant, or refractiveindex of the biopolymer shell (dsDNA þ phosphine), was
obtained (Fig. 4b; see Supplementary Information, Table S1 andFig. S4). The relationship between the dsDNA length and theequivalent refractive index showed a good agreement with thequadratic Langevin model23 (red fitted curve in Fig. 4b; seeSupplementary Information). An average wavelength shift of�1.24 nm bp21 was observed. Note that the full length of thecomplete dsDNA (�20 nm) is much longer than the effective
560
570
580
590
600
610
620
630
640
Wav
elen
gth
(nm
)
0
200
400
600
800
1,000
1,200
1,400
1,600
1,800
Inte
nsity
(a.u
.)
Wavelength (nm)
1 min2 min3 min4 min5 min6 min7 min8 min9 min
10 min
0 5 10 15 20 25 30600
800
1,000
1,200
1,400
1,600
1,800
2,000
Inte
nsity
(a.u
.)
Time (min)0 5 10 15 20 25 30480 500 520 540 560 580 600 620 640 660 680 700
Time (min)
1:1 Xho I1:10 Xho lBuffer solutionXho I + EDTA
1:1 Xho I1:10 Xho lBuffer solutionXho I + EDTA
530540550560570580590600610620
Wav
elen
gth
(nm
)
a b c
a b c d
10 μm 10 μm 10 μm
A
B a b c
Xhol 16 hXhol 1 hNo XhoI
Figure 3 Endonuclease activity measurement with ruler. A, Plasmon resonance sensing with multiple nanoconjugates: a–c, dark-field scattering images of the
Au–DNA nanoconjugates cleaved by endonuclease XhoI (a, before cleavage; b, 1 hour reaction with more than 90% cleavage; c, 16 hours reaction with 100%
cleavage. See also Supplementary Information, Fig. S3 for validated cleavage); d, plasmon resonance wavelengths of the single Au nanoconjugates in A, a–c. The
error bars represent the standard deviation in the measurement of 20 nanoparticles. B, Real-time plasmon resonance sensing of endonuclease reactions: a, raw
scattering spectra data of a single Au–DNA nanoconjugate in an endonuclease reaction, time-resolved; b, plasmon resonance peak wavelength; c, scattering peak
intensity of the Au–DNA nanoconjugate in the 30-min reactions with 1:1 Xho I (3.5 nM, red circles), 1:10 Xho I (350 pM, orange triangles), control buffer only (blue
diamonds) and inhibitor/chelator EDTA (green squares). The plasmon resonance wavelength data exhibit a first-order exponential decay (red and orange curves).
a b
500 550 600 650 700 0 10 20 30 40 50 60
0.0
0.2
0.4
0.6
0.8
1.0
1.2
Wavelength (nm)
Norm
aliz
ed s
catte
ring
inte
nsity
Au–ph–DNA+ Kpn I + Sal I + Xho l + Hin dIII Au–ph
0 5 10 15 20
1.6
1.7
1.8
1.9
2.0
2.1
2.2Au–ph–DNA
+ Kpn I
+ Sal I
+ Xho l
+ Hin dIII
Au–ph
Equivalent refractive index
Effective shell thickness (nm)
Wav
elen
gth
chan
ge (n
m)
656055504540353025201510
50
Base pairs remaining on ruler
Figure 4 Calibration curve generated by nanoplasmon resonance sensing of multiple enzymes. a, Typical scattering spectra. b, Plasmon resonance peak
wavelengths of the Au–DNA nanoconjugates after cleavage reactions with four endonuclease enzymes, and as a function of the number of base pairs remaining
attached to the Au nanoparticle after the cleavage. The red curve is a fit from a semi-empirical model using a Langevin-type dependence of the refractive index
versus dsDNA length (see Supplementary Information, Fig. S4 and Table S1). The error bars represent the standard deviation in the measurement of 20 nanoparticles.
LETTERS
nature nanotechnology | VOL 1 | OCTOBER 2006 | www.nature.com/naturenanotechnology 49
Nature Publishing Group ©2006
Black plate (50,1)
Forster transfer distance (,10 nm), so the ruler has a longerdetection range than the Forster resonance energy transfer.
Based on the established correlation curve between the shiftsin the plasmon wavelength and the DNA size (Fig. 4b), DNAlength in a nuclease reaction can be determined, which allows usto measure the footprint of DNA-binding proteins. EcoRI(Q111)protein was used as a model protein in exonuclease-based DNAfootprinting. EcoRI(Q111) is a cleavage-defective variant of theEcoRI protein with amino acid residue 111 mutated to glutamine(Q). EcoRI(Q111) still maintains specific binding activity to thesequence GAATTC on dsDNA, but does not cleave DNA24,25.EcoRI(Q111) has previously been used to block a transcriptionelongation complex26. As depicted in Fig. 5a, EcoRI(Q111) bindsto the GAATTC sequence on the Au–DNA nanoconjugates.Subsequently an exonuclease enzyme, Bal31, is introduced todegrade the dsDNA from the untethered end without any
specificity. Bal31 exonuclease degrades both 30 and 50 termini ofdsDNA27. Fig. 5b,c shows the scattering spectra of the Au–DNAnanoconjugate digested by Bal31, without and with the boundEcoRI(Q111), respectively. For the unbound DNA, the plasmonresonance wavelength of the nanoconjugate was blue-shifted�52 nm by Bal31 in 20 min and stabilized afterwards (bluesquares, Fig. 5d); however, for the DNA bound by theEcoRI(Q111), the plasmon resonance wavelength of thenanoconjugate shifted a maximum of 25 nm before stabilization(red circles, Fig. 5d). The corresponding base pair length of thedegraded dsDNA was calculated according to the fitted quadraticLangevin model (see Supplementary Information). The Bal31exonuclease digested almost all (�90%) of the 54 bp of thedsDNA, but it digested only �25 bp with the EcoRI(Q111)blocking procession of Bal31 exonuclease. The stalling point ofthe exonuclease is around 25+3 bp from the distal end of the
b
c
d
a
-S-AAAGGATCCAAGCTTGAATTCCTCGAGAGATCTGTCGACGATATCGGTACCAAA
TTTCCTAGGTTCGAACTTAAGGAGCTCTCTAGACAGCTGCTATAGCCATGGTTT||||||||||||||||||||||||||||||||||||||||||||||||||||||
-S-
Bal 31
ExonucleaseBal 31
Au–DNAnanoconjugate
-S-AAAGGATCCAAGCTTGAATTCCTCGAGAGATCTGTCGACGATATCGGTACCAAA
TTTCCTAGGTTCGAACTTAAGGAGCTCTCTAGACAGCTGCTATAGCCATGGTTT||||||||||||||||||||||||||||||||||||||||||||||||||||||
EcoRI(Q111)
-S-AAAGGATCCAAGCTTGAATTCCTCGAGA
TTTCCTAGGTTCGAACTTAAGGAGCTCT|||||||||||||||||||||
EcoRI(Q111) Bal 31
ExonucleaseBal 31
+EcoRI(Q111)
Au–DNAnanoconjugate
Unbl
ocke
d di
gest
ion
Bloc
ked
dige
stio
n
0
200
400
600
800
1,000
1,200
1,400
1,600
Inte
nsity
(a.u
.)
Wavelength (nm)
1 min 2 min 3 min 4 min 5 min 6 min 7 min 8 min 9 min 10 min 20 min
0540520 560 580 600 620 640 660 680 700
540520
0 5 10 15 20
560 580 600 620 640 660 680 700
200
400
600
800
1,000
1,200
1,400
1,600
1,800 1 min 3 min 5 min 7 min 9 min 11 min 13 min 15 min 17 min 19 min 21 minIn
tens
ity (a
.u.)
Wavelength (nm)
Time (min)
5248
4
+ Bal 31 + EcoRI(Q111) + Bal 31
+ EcoRI(Q111)+ Bal 31
+ Bal 31
+ Exo-1 + EcoRI(Q111) + Exo-1 54
Dige
sted
bas
e pa
ir nu
mbe
r
3034384248
2724201714118
0
Wavelength change (nm
)
56
444036322824201612
840
AA
AA
AA
GGTT
TT
TT
GG
GG
C
C
CGG
Figure 5 DNA footprinting of Bal31 exonuclease stalled by the EcoRI(Q111) proteins. a, Schematic diagram of footprinting by Bal31 and the stalled Bal31
hydrolysis by DNA-bound EcoRI(Q111) protein. The EcoRI(Q111) blocks nucleotide removal by Bal31 on a single Au–DNA nanoconjugate. b,c, Time-lapse scattering
spectra of the single Au–DNA nanoconjugates without EcoRI(Q111) (b) and with EcoRI(Q111) (c) during exonuclease Bal31 hydrolysis. d, Plasmon resonance
wavelength of the Au–DNA nanoconjugate as a function of time in the exonuclease reactions, with wavelength shift shown on the right vertical axis and the base
pair of the dsDNA removed on the left vertical axis. The error bars represent the standard deviation in the measurement of 10 nanoparticles.
LETTERS
nature nanotechnology | VOL 1 | OCTOBER 2006 | www.nature.com/naturenanotechnology50
Nature Publishing Group ©2006
Black plate (51,1)
DNA, which is approximately 7 bp from the GAATTC site, and isin perfect agreement with previous measurements usingconventional radiolabels (7+ 3 bp)25. Previous mappingindicates that EcoRI(Q111) binds to 3 bp of dsDNA flanking the30 boundary of the GAATTC sequence, and the steric exclusionbetween EcoRI(Q111) and exonuclease contributes to the other4 bp. A control exonuclease, Exo-1, which does not cleavedsDNA, showed no effect on the ruler spectra (Fig. 5d).
The magnitudes of plasmon resonance shifts in ourexperiments are greater than previous reports on otherbiochemical reactions such as protein binding. We attribute therelatively larger wavelength shift to the stiffness of dsDNA axiallyand the unique dependence of its dielectric constant on itslength. Additionally, the proteins and DNA have distinct electrondensities, and it seems that the DNA scattering potential is oneorder of magnitude higher than that of the proteins. Therefore,the partial shortening or extension of the dsDNA will lead to aproportionally larger change around the Au surface comparedwith the change induced by a coiled protein binding ordisassociation event. Furthermore, the DNA length shortening isalso accompanied by a considerable decrease of DNA refractiveindex (see Supplementary Information, Table S1). Anindependent study by Doron-Mor and colleagues showedcoordination-based self-assembled multilayers can offer thicknesstuning of Au nanoparticle SPR spectra in the range 1–15 nm28,29,further validating our observation that nanoplasmonic spectrashift can be correlated with DNA length. The irregularity in thesize and shape of the Au nanoparticles is possibly a contributingfactor in the broadening of the spectra, and the resultingstandard deviation. The accuracy and spectral resolution of ourmeasurements can be further improved by using nanoparticleswith better shape and size controls.
The time resolution of the nanoplasmonic molecular rulercan be as high as one spectrum per second by taking advantageof the high quantum efficiency of Rayleigh scattering comparedwith fluorescence or Raman scattering; therefore biomolecularreactions in the timescale of seconds can also be measured.Although only a simple dsDNA substrate is used here, there is nolimitation to the sequences or structure of the oligonucleotidesubstrates. The ability to resolve a single nanoparticle without theneed for radioactive or fluorescent labelling also makes it possibleto perform high-throughput screening in a high-densitymicroarray or in microfluidic devices. The technology can also beused for the detection of other enzymes that inducelength changes.
METHODS
PREPARATION OF THE dsDNA-CONJUGATED Au NANOPARTICLEThe dsDNA (Fig. 1b; see Supplementary Information) was mixed with theconcentrated phosphine-coated Au nanoparticles (see SupplementaryInformation, Fig. S2) in a molar ratio of 200:1, 100:1, 50:1 and 20:1, at roomtemperature for about 12 h, then stored at 220 8C. Electrophoresis was usedto verify the DNA attachment (Fig. 2B, a). The decreased mobility of theDNA-conjugated gold particles was clearly observed, indicating the successfulDNA attachment to the gold nanoparticles. The presence of DNA can beconfirmed by TEM imaging, with or without uranyl acetate staining (providedby Mark Le Gros), and the extra stain further increased the effective diameterof the whole complex (Fig. 2A).
SCATTERING IMAGING AND SPECTROSCOPY OF SINGLE Au–DNA NANOCONJUGATESThe microscopy system consisted of a Carl Zeiss Axiovert 200 invertedmicroscope (Carl Zeiss) equipped with a dark-field condenser(1.2 , (numerical aperture) , 1.4), a true-colour digital camera (CoolSNAPcf,Roper Scientific) and a 300 mm focal length and 300 grooves per mmmonochromator (Acton Research) with a 1024 � 256 pixel cooled
spectrograph CCD camera (Roper Scientific). A 2-mm-wide aperture wasplaced in front of the entrance slit of the monochromator to keep only asingle nanoparticle in the region of interest. After photobleaching thefluorescence, the true-colour scattering images of Au–DNA nanoconjugateswere taken using a �60 objective lens (numerical aperture ¼ 0.8) and thetrue-colour camera with a white light illumination from a 100 W halogenlamp. The scattering spectra of Au–DNA nanoconjugates were routed to themonochromator and spectrograph CCD. Raw spectra were normalized withrespect to the spectrum of a nonresonant nanoparticle (polystyrene) afterbackground subtraction. In the real-time spectroscopy experiments, thenanoparticle-immobilized glass slide was mounted on a transparent indiumtin oxide (ITO) heater with an external thermostat and heated to 37 8C or25 8C. The immobilized nanoparticles were immersed in a drop of buffersolution, which also served as the contact fluid for the dark-field condenser.The endonuclease or exonuclease enzymes with buffer solution were loaded bypipette into the contact fluid and the continuous spectrum acquisition startedsimultaneously. The microscopy system was completely covered by a darkshield, which prevented ambient light interference and excessive evaporation.
CLEAVAGE REACTION OF dsDNA ON Au–DNA NANOPARTICLE CONJUGATEWe immobilized the Au–DNA nanoconjugates electrostatically on anultraclean thin glass slide. The cleavage reaction for DNA was performed withendonucleases HindIII, KpnI, XhoI and SalI (Fig. 2B, b) and 1 ml of theAu–DNA particle in 100 ml final volume (3.5 nM final concentration for theendonucleases), as described in the Supplementary Information (Fig. S1), withonly the modification of removing the reducing reagent from the reactionbuffer and the enzymes in order to avoid detachment of the thiolated DNAfrom the gold nanoparticle.
REAL-TIME MEASUREMENT OF ENDONUCLEASE ACTIVITY, KINETICS AND INHIBITIONFor kinetic measurements, XhoI was used as the model enzyme. The cleavagewas also confirmed by FITC fluorescence images (see SupplementaryInformation, Fig. S3). The purpose of the FITC label removal experiment wassolely for the validation of the enzymatic cleavage. The Au–DNAnanoconjugates were illuminated with a white light source for 20 min tocompletely photobleach the fluorescence prior to the spectroscopicmeasurement. The fluorescent label had no influence on the plasmonresonance measurement. The continuous acquisition of the scatteringspectrum of a selected nanoparticle starts in synchronization with theintroduction of the XhoI. For real-time kinetics measurement, one spectrumwith 10 s integration time was acquired every minute. Significant blue shifts ofthe plasmon resonance wavelength were observed for the first 10 min andcorrelated with intensity decrease (Fig. 3B).
The rate of the endonuclease reaction on the Au–DNA nanoconjugateshowed a concentration dependence, and was determined to followed aMichaelis–Menten enzyme kinetics30 (Fig. 3B). The rate constants were5.8 � 1023 s21 (3.5 nM) and 1.5 � 1023 s21 (350 pM). The inhibition of theendonuclease reactions on the Au–DNA nanoconjugates was achieved withthe simultaneous addition of 10 mM EDTA and the 3.5-nM XhoI enzymes;the Mg2þ in the reaction buffer, which is required for XhoI activity, can bechelated by EDTA.
Bal-31 FOOTPRINTING OF EcoRI(Q111) BOUND ON dsDNA–Au
The cleavage-defective EcoRI(Q111) was purified according to previousdescriptions24–26, and incubated at 100 nM final concentration with theimmobilized Au–DNA nanoconjugates (in this experiment, the FITC moietywas not used, so that exonuclease cleavage would not be affected) for 10 minin the 80 ml reaction buffer at 37 8C. Next, 20 ml Bal31 enzymes (Clontech)was added into the reaction buffer containing immobilized Au–DNAnanoconjugates in 100 ml final volume, with a Bal31 final concentration of100 nM. The binding buffer contained 50 mM NaCl, 10 mM MgCl2, 0.025%Triton X-100 and 100 mM Tris–HCl pH 7.5 at 25 8C.
Received 18 May 2006; accepted 29 August 2006; published 4 October 2006.
References1. Behrens, S., Fuchs, B. M. & Amann, R. The effect of nucleobase-specific fluorescence quenching
on in situ hybridization with rRNA-targeted oligonucleotide probes. Syst. Appl. Microbiol. 27,565–572 (2004).
2. Smith, J. & Anslyn, E. V. Radioactive end labeling to determine hydrolytic rates of nucleasemimics. Anal. Biochem. 220, 53–57 (1994).
3. Hillier, S. C. et al. An electrochemical study of enzymatic oligonucleotide digestion.Bioelectrochemistry 63, 307–310 (2004).
LETTERS
nature nanotechnology | VOL 1 | OCTOBER 2006 | www.nature.com/naturenanotechnology 51
Nature Publishing Group ©2006
Black plate (52,1)
4. Alivisatos, A. P. et al. Organization of ‘nanocrystal molecules’ using DNA. Nature 382,609–611 (1996).
5. Zanchet, D., Micheel, C. M., Parak, W. J., Gerion, D. & Alivisatos, A. P. Electrophoretic isolationof discrete Au nanocrystal/DNA conjugates. Nano Lett. 1, 32–35 (2001).
6. Taton, T. A., Mirkin, C. A. & Letsinger, R. L. Scanometric DNA array detection with nanoparticleprobes. Science 289, 1757–1760 (2000).
7. Storhoff, J. J., Elghanian, R., Mucic, R. C., Mirkin, C. A. & Letsinger, R. L. One-pot colorimetricdifferentiation of polynucleotides with single base imperfections using gold nanoparticle probes.J. Am. Chem. Soc. 120, 1959–1964 (1998).
8. Mirkin, C. A., Letsinger, R. L., Mucic, R. C. & Storhoff, J. J. A DNA-based method for rationallyassembling nanoparticles into macroscopic materials. Nature 382, 607–609 (1996).
9. Sonnichsen, C., Reinhard, B. M., Liphardt, J. & Alivisatos, A. P. A molecular ruler based onplasmon coupling of single gold and silver nanoparticles. Nature Biotechnol. 23, 741–745 (2005).
10. Homola, J., Yee, S. S. & Gauglitz, G. Surface plasmon resonance sensors: review. Sensor Actuat.B-Chem. 54, 3–15 (1999).
11. Karlsson, R. SPR for molecular interaction analysis: a review of emerging application areas.J. Mol. Recognit. 17, 151–161 (2004).
12. Mulvaney, P. Surface plasmon spectroscopy of nanosized metal particles. Langmuir 12,788–800 (1996).
13. Elghanian, R., Storhoff, J. J., Mucic, R. C., Letsinger, R. L. & Mirkin, C. A. Selective colorimetricdetection of polynucleotides based on the distance-dependent optical properties of goldnanoparticles. Science 277, 1078–1081 (1997).
14. Eck, D., Helm, C. A., Wagner, N. J. & Vaynberg, K. A. Plasmon resonance measurements of theadsorption and adsorption kinetics of a biopolymer onto gold nanocolloids. Langmuir 17,957–960 (2001).
15. Englebienne, P., Van Hoonacker, A. & Verhas, M. High-throughput screening using the surfaceplasmon resonance effect of colloidal gold nanoparticles. Analyst 126, 1645–1651 (2001).
16. Nath, N. & Chilkoti, A. A colorimetric gold nanoparticle sensor to interrogate biomolecularinteractions in real time on a surface. Anal. Chem. 74, 504–509 (2002).
17. Sun, Y. G. & Xia, Y. N. Increased sensitivity of surface plasmon resonance of gold nanoshellscompared to that of gold solid colloids in response to environmental changes. Anal. Chem. 74,5297–5305 (2002).
18. McFarland, A. D. & Van Duyne, R. P. Single silver nanoparticles as real-time optical sensors withzeptomole sensitivity. Nano Lett. 3, 1057–1062 (2003).
19. Raschke, G. et al. Biomolecular recognition based on single gold nanoparticle light scattering.Nano Lett. 3, 935–938 (2003).
20. Oldenburg, S. J., Genick, C. C., Clark, K. A. & Schultz, D. A. Base pair mismatch recognitionusing plasmon resonant particle labels. Anal. Biochem. 309, 109–116 (2002).
21. Parak, W. J. et al. Conformation of oligonucleotides attached to gold nanocrystals probed by gelelectrophoresis. Nano Lett. 3, 33–36 (2003).
22. Bohren, C. F. & Huffman, D. R. Absorption and Scattering of Light by Small Particles (Wiley,New York, 1983).
23. Mazur, J. & Jernigan, R. L. Distance-dependent dielectric-constants and their application todouble-helical DNA. Biopolymers 31, 1615–1629 (1991).
24. King, K., Benkovic, S. J. & Modrich, P. Glu-111 is required for activation of the DNA cleavagecenter of EcoRI endonuclease. J. Biol. Chem. 264, 11807–11815 (1989).
25. Pavco, P. A. & Steege, D. A. Elongation by Escherichia coli RNA polymerase is blocked in vitro bya site-specific DNA binding protein. J. Biol. Chem. 265, 9960–9969 (1990).
26. Jett, S. D. & Bear, D. G. Snapshot blotting — Transfer of nucleic-acids and nucleoproteincomplexes from electrophoresis gels to grids for electron-microscopy. Proc. Natl Acad. Sci. USA91, 6870–6874 (1994).
27. Legerski, R. J., Hodnett, J. L. & Gray, H. B.Jr. Extracellular nucleases of pseudomonas BAL 31.III. Use of the double-strand deoxyriboexonuclease activity as the basis of a convenient methodfor the mapping of fragments of DNA produced by cleavage with restriction enzymes. NucleicAcids Res. 5, 1445–1464 (1978).
28. Doron-Mor, I. et al. Sensitivity of transmission surface plasmon resonance (T-SPR) spectroscopy:Self-assembled multilayers on evaporated gold island films. Chem. Eur. J. 11, 5555–5562 (2005).
29. Wanunu, M. et al. Branched coordination multilayers on gold. J. Am. Chem. Soc. 127,17877–17887 (2005).
30. Mizu, M., Koumoto, K., Kimura, T., Sakurai, K. & Shinkai, S. Protection of polynucleotidesagainst nuclease-mediated hydrolysis by complexation with schizophyllan. Biomaterials 25,3109–3116 (2004).
AcknowledgementsThis work was supported by DARPA, DOD BC045345, NIH R21CA95393, UCSF Prostate CancerSPORE award (NIH P50 CA89520), and the UCSF Prostate Cancer Center Developmental ResearchProgram, Intel, the Korea Ministry of Science and Technology “21st Century Frontier R&D Program”grant 05K1501-02810. This work was performed under the auspices of the U.S. Dept. of Energy, at theUniversity of California/Lawrence Berkeley National Laboratory under contract no. DE-AC03-76SF00098 and at the University of California/Lawrence Livermore National Laboratory undercontract no. W-7405-Eng-48.Supplementary Information accompanies this paper on www.nature.com/naturenanotechnology.
Author contributionsF.F.C. conceived and designed the experiments, G.L.L., Y.Y., S.K. and B.M. performed the experiments,G.L.L. and D.G. analysed the data, and S.D.J. and D.G.B. synthesized the EcoRI(Q111).Correspondence and requests for material should be addressed to F.F.C. and L.P.L.
Competing financial interestsThe authors declare that they have no competing financial interests.
Reprints and permission information is available online at http://npg.nature.com/reprintsandpermissions/
LETTERS
nature nanotechnology | VOL 1 | OCTOBER 2006 | www.nature.com/naturenanotechnology52
Nature Publishing Group ©2006
© 2006 Nature Publishing Group
Manuscript Reference Number: NNANO-06050060A
S1
Supporting Information
Nanoplasmonic molecular ruler for nuclease activity and DNA footprinting
Fanqing Frank Chen1,§, *, Gang L. Liu2, *, Yadong Yin1,3,5, Siri Kunchakarra1, Bipasha Mukherjee1, Daniele Gerion1, Stephen D. Jett4, David G. Bear4, A. Paul Alivisatos1,3, Luke P. Lee2 1 Lawrence Berkeley National Laboratory, Berkeley, CA 94720 2 Biomolecular Nanotechnology Center, Department of Bioengineering, University of California at Berkeley, Berkeley, CA 94720 3 Department of Chemistry, University of California, Berkeley, CA 94720 4 Department of Cell Biology and Physiology and the Cancer Research and Treatment Center, University of New Mexico Health Sciences Center, Albuquerque, NM 87131 5Current address: Department of Chemistry, University of California at Riverside, Riverside, CA 92521 §Correspondence should be addressed to: Fanqing Frank Chen ([email protected]) Life Sciences Division Lawrence Berkeley National Laboratory MS977R0225A, 1 Cyclotron Rd. Berkeley, CA 94720 Materials and Methods
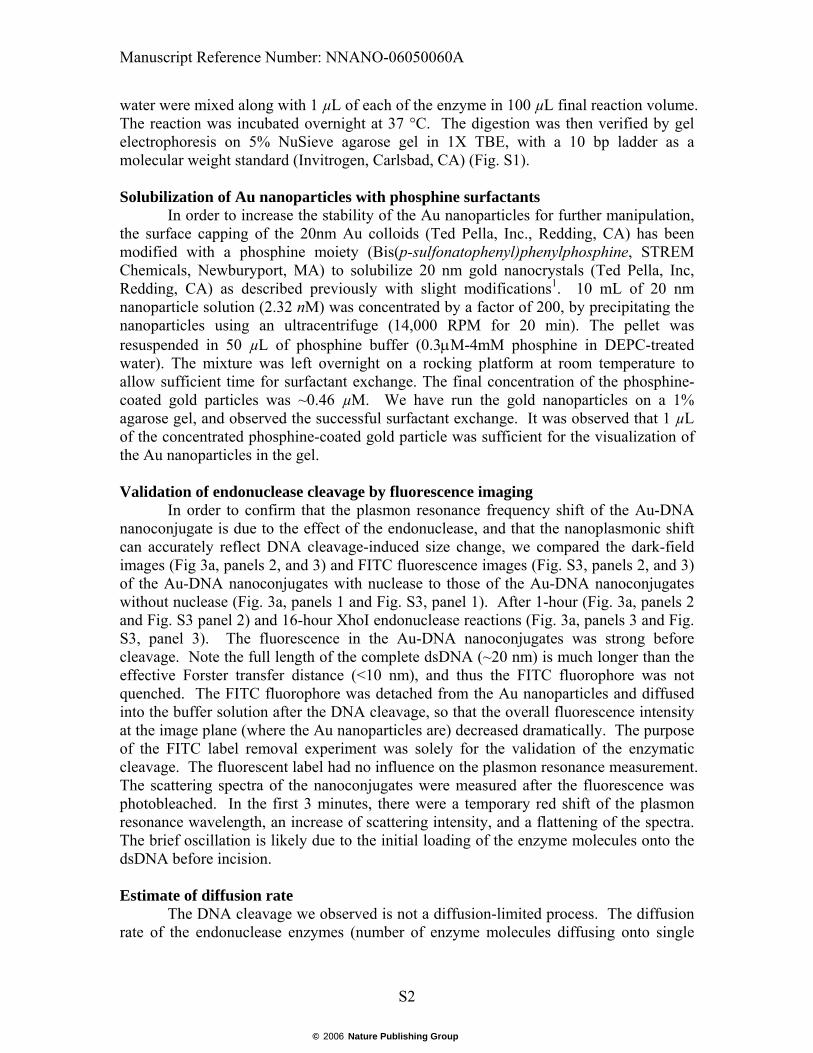
Synthesis of DNA oligonucleotides and preparation of thiolated, FITC labeled dsDNA.
Two complementing strands of DNA, each 54 nucleotides long, were synthesized (Operon, Alameda, CA). They are (1) the oligonucleotide SprAuFor with dual thiol modification at the 5' end of the oligonucleotide (di-thiol-5'-AAAGGATCCAAGCTTGAATTCCTCGAGAGATCTGTCGACGATCTCGGTACCAAA-3'), and (2) the reverse complementing strand named SprAuRev (FITC-5'-TTTCCTAGGTTCGAACTTAAGGA-GCTCTCTAGACAGCTGCTATAGCCATGGTTT-3'). For the preparation of double-stranded DNA, 5'-thiolated SprAuFor was mixed at 1:1 molar ratio with of 5'-FITC-labeled SprAuRev, in a final volume of 100 μL. The mixture was first denatured by heating to 95 °C for 10 minutes, then the DNA strands were reannealed by cooling down slowly to room temperature. The quality of the DNA was checked by gel electrophoresis. Test digestion of DNA with restriction endonucleases HinDIII, KpnI, XhoI, and SalI were performed according to the manufacturer’s instructions (New England Biolab, Beverly, MA) (Supplement Fig. S1). The cleavage sites for the various enzymes are shown (Figure 1b). Appropriate amounts of buffer and
© 2006 Nature Publishing Group
Manuscript Reference Number: NNANO-06050060A
S2
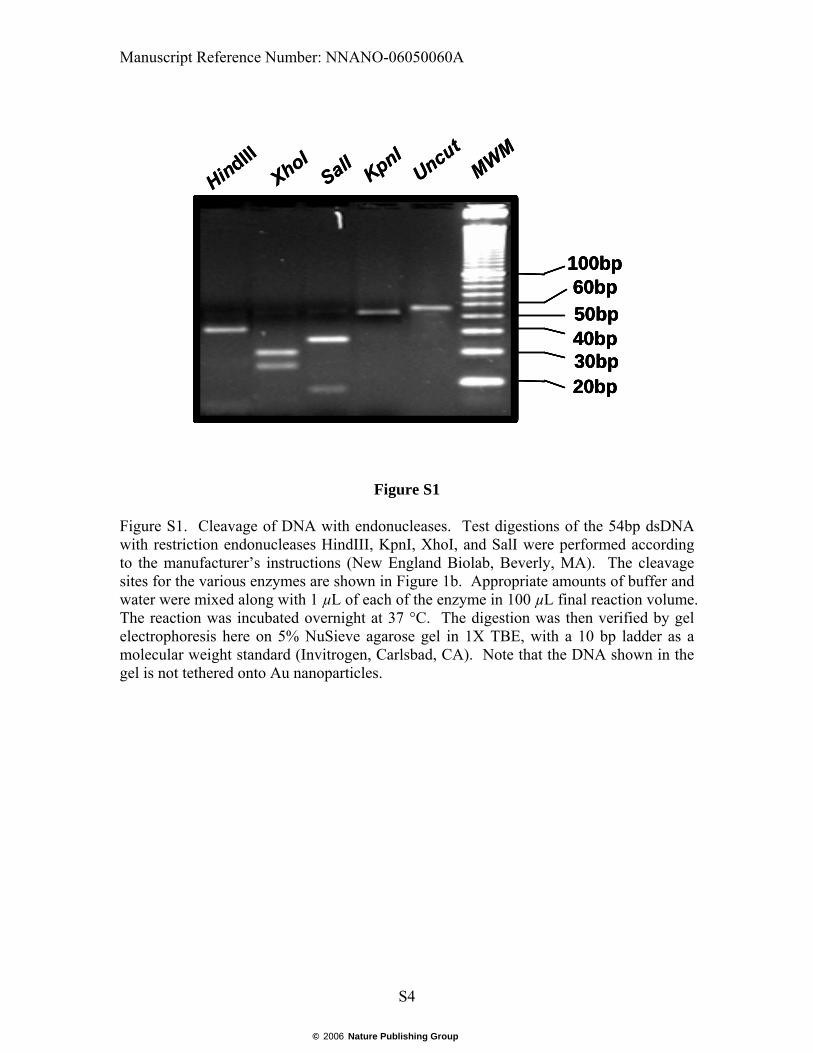
water were mixed along with 1 µL of each of the enzyme in 100 µL final reaction volume. The reaction was incubated overnight at 37 °C. The digestion was then verified by gel electrophoresis on 5% NuSieve agarose gel in 1X TBE, with a 10 bp ladder as a molecular weight standard (Invitrogen, Carlsbad, CA) (Fig. S1). Solubilization of Au nanoparticles with phosphine surfactants
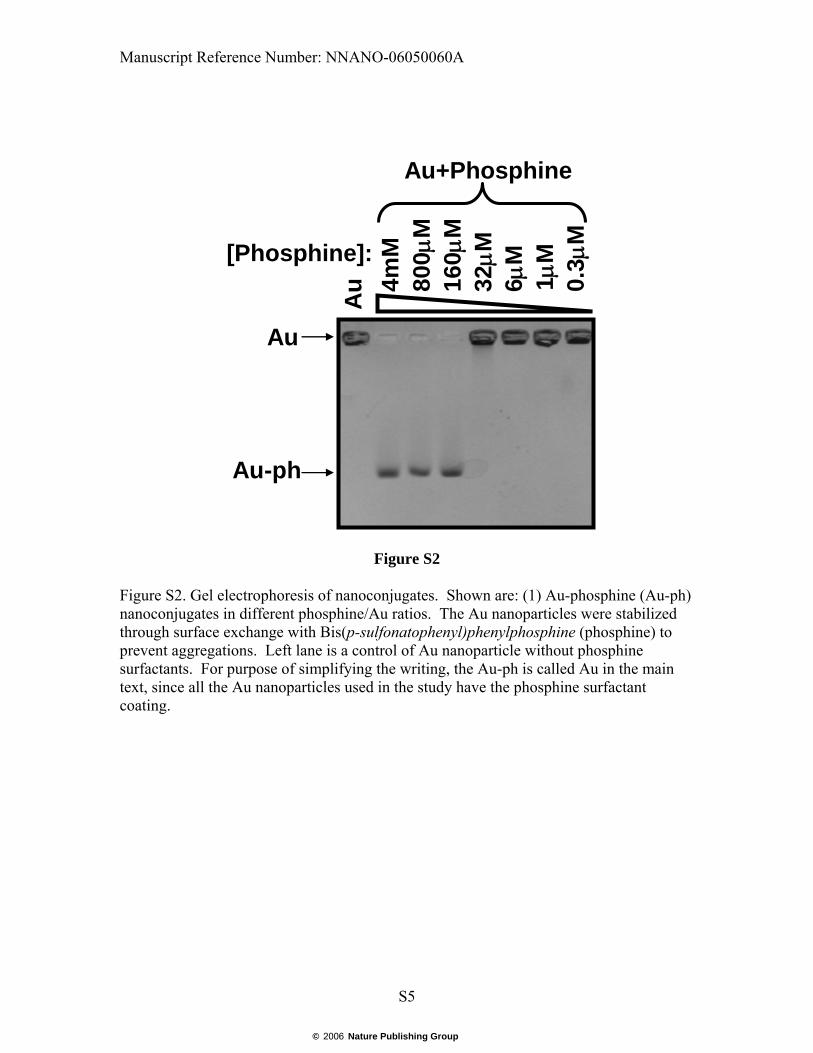
In order to increase the stability of the Au nanoparticles for further manipulation, the surface capping of the 20nm Au colloids (Ted Pella, Inc., Redding, CA) has been modified with a phosphine moiety (Bis(p-sulfonatophenyl)phenylphosphine, STREM Chemicals, Newburyport, MA) to solubilize 20 nm gold nanocrystals (Ted Pella, Inc, Redding, CA) as described previously with slight modifications1. 10 mL of 20 nm nanoparticle solution (2.32 nM) was concentrated by a factor of 200, by precipitating the nanoparticles using an ultracentrifuge (14,000 RPM for 20 min). The pellet was resuspended in 50 µL of phosphine buffer (0.3μM-4mM phosphine in DEPC-treated water). The mixture was left overnight on a rocking platform at room temperature to allow sufficient time for surfactant exchange. The final concentration of the phosphine-coated gold particles was ~0.46 µM. We have run the gold nanoparticles on a 1% agarose gel, and observed the successful surfactant exchange. It was observed that 1 µL of the concentrated phosphine-coated gold particle was sufficient for the visualization of the Au nanoparticles in the gel.
Validation of endonuclease cleavage by fluorescence imaging
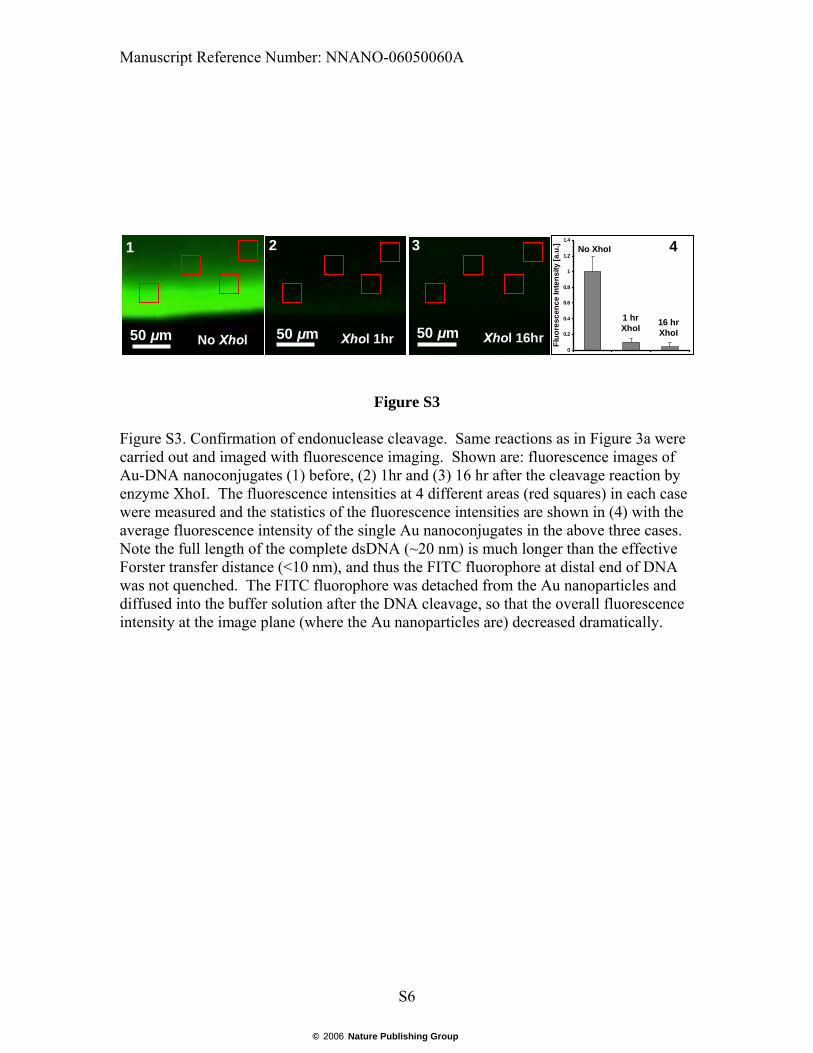
In order to confirm that the plasmon resonance frequency shift of the Au-DNA nanoconjugate is due to the effect of the endonuclease, and that the nanoplasmonic shift can accurately reflect DNA cleavage-induced size change, we compared the dark-field images (Fig 3a, panels 2, and 3) and FITC fluorescence images (Fig. S3, panels 2, and 3) of the Au-DNA nanoconjugates with nuclease to those of the Au-DNA nanoconjugates without nuclease (Fig. 3a, panels 1 and Fig. S3, panel 1). After 1-hour (Fig. 3a, panels 2 and Fig. S3 panel 2) and 16-hour XhoI endonuclease reactions (Fig. 3a, panels 3 and Fig. S3, panel 3). The fluorescence in the Au-DNA nanoconjugates was strong before cleavage. Note the full length of the complete dsDNA (~20 nm) is much longer than the effective Forster transfer distance (<10 nm), and thus the FITC fluorophore was not quenched. The FITC fluorophore was detached from the Au nanoparticles and diffused into the buffer solution after the DNA cleavage, so that the overall fluorescence intensity at the image plane (where the Au nanoparticles are) decreased dramatically. The purpose of the FITC label removal experiment was solely for the validation of the enzymatic cleavage. The fluorescent label had no influence on the plasmon resonance measurement. The scattering spectra of the nanoconjugates were measured after the fluorescence was photobleached. In the first 3 minutes, there were a temporary red shift of the plasmon resonance wavelength, an increase of scattering intensity, and a flattening of the spectra. The brief oscillation is likely due to the initial loading of the enzyme molecules onto the dsDNA before incision. Estimate of diffusion rate
The DNA cleavage we observed is not a diffusion-limited process. The diffusion rate of the endonuclease enzymes (number of enzyme molecules diffusing onto single
© 2006 Nature Publishing Group
Manuscript Reference Number: NNANO-06050060A
S3
nanoconjugates per unit time) can be estimated as DrCtN π4/ =ΔΔ , where D=5 × 10-
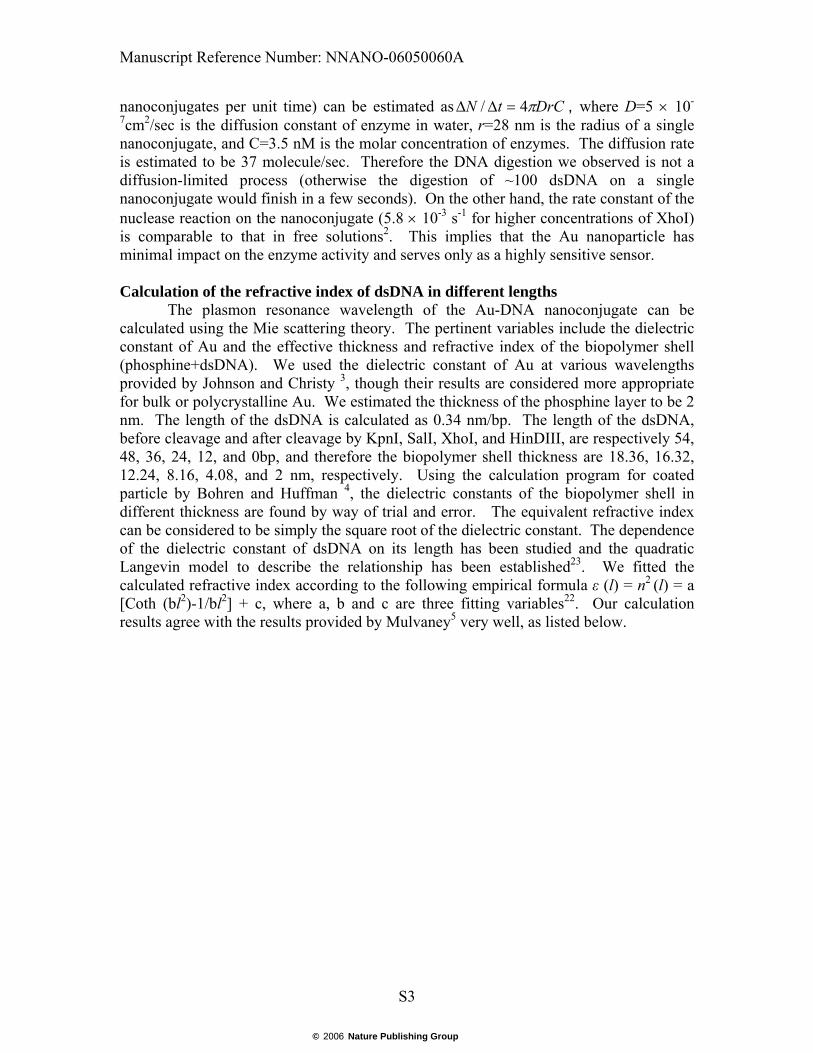
7cm2/sec is the diffusion constant of enzyme in water, r=28 nm is the radius of a single nanoconjugate, and C=3.5 nM is the molar concentration of enzymes. The diffusion rate is estimated to be 37 molecule/sec. Therefore the DNA digestion we observed is not a diffusion-limited process (otherwise the digestion of ~100 dsDNA on a single nanoconjugate would finish in a few seconds). On the other hand, the rate constant of the nuclease reaction on the nanoconjugate (5.8 × 10⁻³ s-1 for higher concentrations of XhoI) is comparable to that in free solutions2. This implies that the Au nanoparticle has minimal impact on the enzyme activity and serves only as a highly sensitive sensor. Calculation of the refractive index of dsDNA in different lengths
The plasmon resonance wavelength of the Au-DNA nanoconjugate can be calculated using the Mie scattering theory. The pertinent variables include the dielectric constant of Au and the effective thickness and refractive index of the biopolymer shell (phosphine+dsDNA). We used the dielectric constant of Au at various wavelengths provided by Johnson and Christy 3, though their results are considered more appropriate for bulk or polycrystalline Au. We estimated the thickness of the phosphine layer to be 2 nm. The length of the dsDNA is calculated as 0.34 nm/bp. The length of the dsDNA, before cleavage and after cleavage by KpnI, SalI, XhoI, and HinDIII, are respectively 54, 48, 36, 24, 12, and 0bp, and therefore the biopolymer shell thickness are 18.36, 16.32, 12.24, 8.16, 4.08, and 2 nm, respectively. Using the calculation program for coated particle by Bohren and Huffman 4, the dielectric constants of the biopolymer shell in different thickness are found by way of trial and error. The equivalent refractive index can be considered to be simply the square root of the dielectric constant. The dependence of the dielectric constant of dsDNA on its length has been studied and the quadratic Langevin model to describe the relationship has been established23. We fitted the calculated refractive index according to the following empirical formula ε (l) = n2 (l) = a [Coth (bl2)-1/bl2] + c, where a, b and c are three fitting variables22. Our calculation results agree with the results provided by Mulvaney5 very well, as listed below.
© 2006 Nature Publishing Group
Manuscript Reference Number: NNANO-06050060A
S4
Figure S1
Figure S1. Cleavage of DNA with endonucleases. Test digestions of the 54bp dsDNA with restriction endonucleases HindIII, KpnI, XhoI, and SalI were performed according to the manufacturer’s instructions (New England Biolab, Beverly, MA). The cleavage sites for the various enzymes are shown in Figure 1b. Appropriate amounts of buffer and water were mixed along with 1 µL of each of the enzyme in 100 µL final reaction volume. The reaction was incubated overnight at 37 °C. The digestion was then verified by gel electrophoresis here on 5% NuSieve agarose gel in 1X TBE, with a 10 bp ladder as a molecular weight standard (Invitrogen, Carlsbad, CA). Note that the DNA shown in the gel is not tethered onto Au nanoparticles.
XhoI
SalI Kp
nIUncutMWM
20bp30bp40bp50bp60bp
100bp
HindIII
20bp30bp40bp50bp60bp
100bp
XhoI
SalI Kp
nIUncutMWM
20bp30bp40bp50bp60bp
100bp
HindIII
20bp30bp40bp50bp60bp
100bp
© 2006 Nature Publishing Group
Manuscript Reference Number: NNANO-06050060A
S5
Au 4m
M80
0μM
160μ
M32
μM6μ
M
0.3μ
M
Au+Phosphine
[Phosphine]:
Au
Au-ph
1μM
Figure S2
Figure S2. Gel electrophoresis of nanoconjugates. Shown are: (1) Au-phosphine (Au-ph) nanoconjugates in different phosphine/Au ratios. The Au nanoparticles were stabilized through surface exchange with Bis(p-sulfonatophenyl)phenylphosphine (phosphine) to prevent aggregations. Left lane is a control of Au nanoparticle without phosphine surfactants. For purpose of simplifying the writing, the Au-ph is called Au in the main text, since all the Au nanoparticles used in the study have the phosphine surfactant coating.
© 2006 Nature Publishing Group
Manuscript Reference Number: NNANO-06050060A
S6
0
0.2
0.4
0.6
0.8
1
1.2
1.4
Fluo
resc
ence
Inte
nsity
[a.u
.] 45
6 750 μm
1
50 μm
2
50 μm
3
No Xhol Xhol 1hr Xhol 16hr 1 hrXhoI 16 hr
XhoI
No XhoI
Figure S3
Figure S3. Confirmation of endonuclease cleavage. Same reactions as in Figure 3a were carried out and imaged with fluorescence imaging. Shown are: fluorescence images of Au-DNA nanoconjugates (1) before, (2) 1hr and (3) 16 hr after the cleavage reaction by enzyme XhoI. The fluorescence intensities at 4 different areas (red squares) in each case were measured and the statistics of the fluorescence intensities are shown in (4) with the average fluorescence intensity of the single Au nanoconjugates in the above three cases. Note the full length of the complete dsDNA (~20 nm) is much longer than the effective Forster transfer distance (<10 nm), and thus the FITC fluorophore at distal end of DNA was not quenched. The FITC fluorophore was detached from the Au nanoparticles and diffused into the buffer solution after the DNA cleavage, so that the overall fluorescence intensity at the image plane (where the Au nanoparticles are) decreased dramatically.
© 2006 Nature Publishing Group
Manuscript Reference Number: NNANO-06050060A
S7
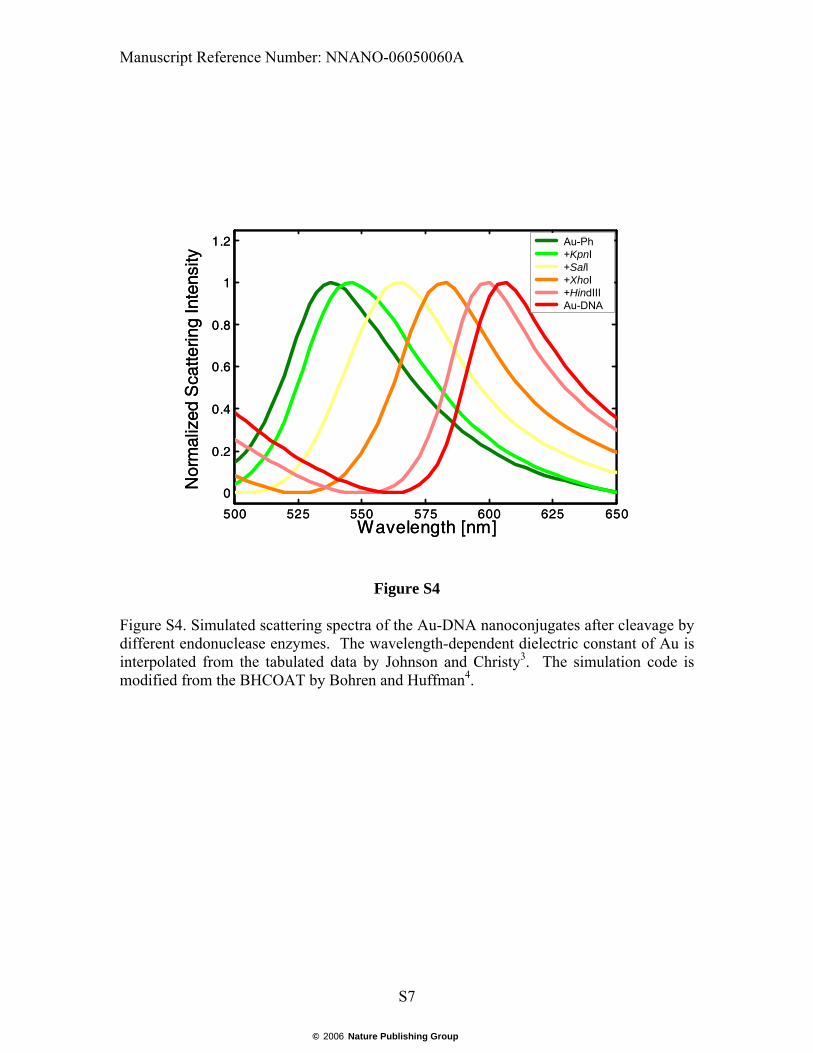
Figure S4
Figure S4. Simulated scattering spectra of the Au-DNA nanoconjugates after cleavage by different endonuclease enzymes. The wavelength-dependent dielectric constant of Au is interpolated from the tabulated data by Johnson and Christy3. The simulation code is modified from the BHCOAT by Bohren and Huffman4.
500 525 550 575 600 625 650
0
0.2
0.4
0.6
0.8
1
1.2 Au-Ph+KpnI+SalI+XhoI+HinDIIIAu-DNA
Nor
mal
ized
Sca
tterin
g In
tens
ity
Wavelength [nm]
Au-Ph+KpnI+SalI+XhoI+HindIIIAu-DNA
500 525 550 575 600 625 650
0
0.2
0.4
0.6
0.8
1
1.2 Au-Ph+KpnI+SalI+XhoI+HinDIIIAu-DNA
Nor
mal
ized
Sca
tterin
g In
tens
ity
Wavelength [nm]
Au-Ph+KpnI+SalI+XhoI+HindIIIAu-DNA
© 2006 Nature Publishing Group
Manuscript Reference Number: NNANO-06050060A
S8
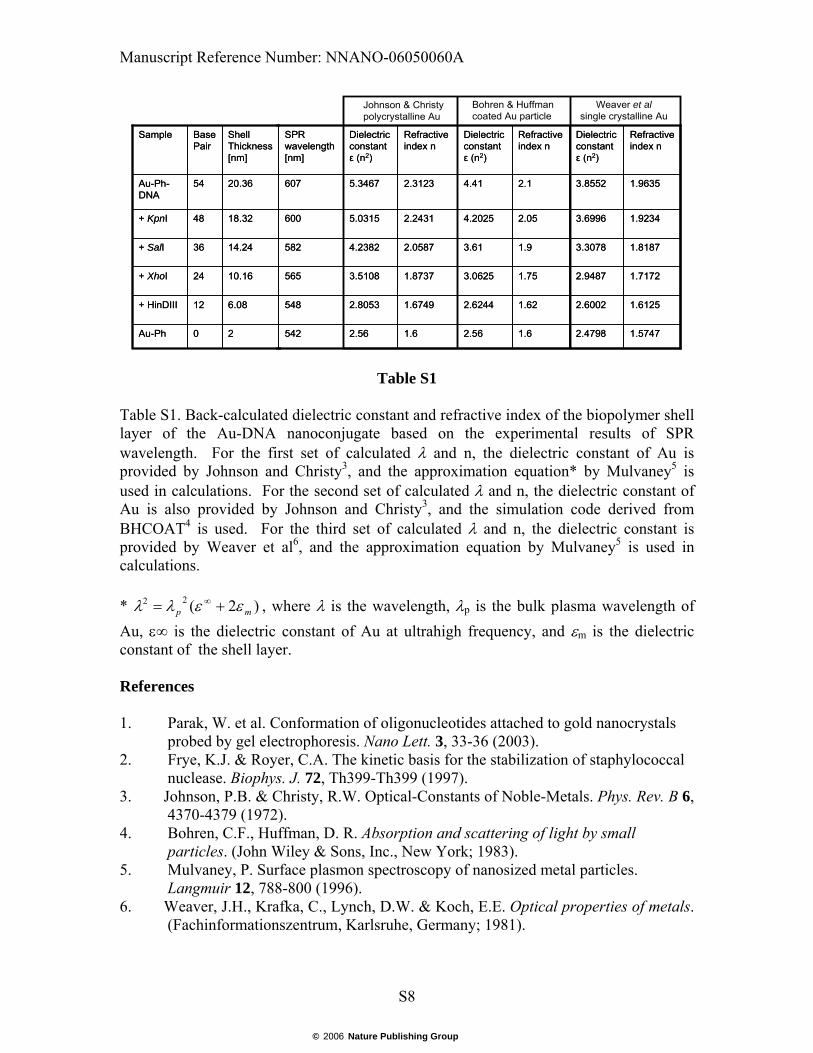
Table S1
Table S1. Back-calculated dielectric constant and refractive index of the biopolymer shell layer of the Au-DNA nanoconjugate based on the experimental results of SPR wavelength. For the first set of calculated λ and n, the dielectric constant of Au is provided by Johnson and Christy3, and the approximation equation* by Mulvaney5 is used in calculations. For the second set of calculated λ and n, the dielectric constant of Au is also provided by Johnson and Christy3, and the simulation code derived from BHCOAT4 is used. For the third set of calculated λ and n, the dielectric constant is provided by Weaver et al6, and the approximation equation by Mulvaney5 is used in calculations. * )2(22
mp εελλ += ∞ , where λ is the wavelength, λp is the bulk plasma wavelength of Au, ε∞ is the dielectric constant of Au at ultrahigh frequency, and εm is the dielectric constant of the shell layer. References 1. Parak, W. et al. Conformation of oligonucleotides attached to gold nanocrystals
probed by gel electrophoresis. Nano Lett. 3, 33-36 (2003). 2. Frye, K.J. & Royer, C.A. The kinetic basis for the stabilization of staphylococcal
nuclease. Biophys. J. 72, Th399-Th399 (1997). 3. Johnson, P.B. & Christy, R.W. Optical-Constants of Noble-Metals. Phys. Rev. B 6,
4370-4379 (1972). 4. Bohren, C.F., Huffman, D. R. Absorption and scattering of light by small
particles. (John Wiley & Sons, Inc., New York; 1983). 5. Mulvaney, P. Surface plasmon spectroscopy of nanosized metal particles.
Langmuir 12, 788-800 (1996). 6. Weaver, J.H., Krafka, C., Lynch, D.W. & Koch, E.E. Optical properties of metals.
(Fachinformationszentrum, Karlsruhe, Germany; 1981).
20Au-Ph
6.0812+ HinDIII
10.1624+ XhoI
14.2436+ SalI
18.3248+ KpnI
20.3654Au-Ph-DNA
Shell Thickness [nm]
Base Pair
Sample
20Au-Ph
6.0812+ HinDIII
10.1624+ XhoI
14.2436+ SalI
18.3248+ KpnI
20.3654Au-Ph-DNA
Shell Thickness [nm]
Base Pair
Sample
542
548
565
582
600
607
SPR wavelength [nm]
1.57472.47981.62.561.62.56
1.61252.60021.622.62441.67492.8053
1.71722.94871.753.06251.87373.5108
1.81873.30781.93.612.05874.2382
1.92343.69962.054.20252.24315.0315
1.96353.85522.14.412.31235.3467
Refractive index n
Dielectric constant ε (n2)
Refractive index n
Dielectric constant ε (n2)
Refractive index n
Dielectric constant ε (n2)
Johnson & Christy polycrystalline Au
Bohren & Huffman coated Au particle
Weaver et alsingle crystalline Au