a national adaptation strategy to address climate change …
TRANSCRIPT

A NATIONAL ADAPTATION STRATEGY TO
ADDRESS CLIMATE CHANGE IN THE
AGRICULTURE SECTOR IN BELIZE
Prepared for
The Caribbean Community Climate Change Centre
Belmopan, Belize
and
The National Climate Change Office
Ministry of Forestry, Fisheries and Sustainable Development
Belmopan, Belize
.

A National Adaptation Strategy to Address Climate Change in the Agriculture Sector in Belize
1
A National Adaptation Strategy (and Action Plan) to Address Climate
Change in the Agriculture Sector in Belize.
Caribbean Community Climate Change Centre
Lawrence Nicholas Building Ring Road Belmopan City, Belize T: 501-822-1094 F: 501-822-1365
© Copyright Caribbean Community Climate Change Centre 2014
Published by Caribbean Community Climate Change Centre,
Belmopan, Belize
Digital Edition (June 2015)
Printed Edition (June 2015)
This report was prepared for the Caribbean Community Climate
Change Centre (CCCCC) and the Government of Belize under the
European Union Global Climate Change Alliance (EU-GCCA)
Caribbean Support Project.
No use of this publication may be made for resale or for any other
commercial purpose whatsoever. It may be reproduced in whole or in
part and in any form for educational or non-profit purposes without
special permission from the copyright holder, provided
acknowledgement of the source is made. The Caribbean Community
Climate Change Centre (CCCCC) would appreciate a copy of any
publication that uses this report as a source. The views and
interpretations in this document are those of the authors and do not
necessarily reflect the views of the CCCCC, its Board of Executive
Directors, or the governments they represent.
Caribbean Community Climate Change Centre, Ring Road, P.O. Box
563, Belmopan, Belize
Visit our website at http://www.caribbeanclimate.bz ISBN-13 978-976-8253-58-3 (paperback) ISBN-13 978-976-8253-59-0 (pdf)

A National Adaptation Strategy to Address Climate Change in the Agriculture Sector in Belize
2
FOREWORD
The continued success of the Agricultural Sector is of critical importance to the social, economic and
environmental sustainability of the Belizean nation. Agriculture is the second most important sector in
the provision of employment and is the key contributor to Belize’s food and nutrition security. Since
2006, with the establishment of cogeneration facilities in the northern sugar cane region, this sector has
also become a key contributor to Belize’s energy security and its gradual transition towards a green
economy.
Like many Small Island Developing States, Belize is very vulnerable to the adverse effects of climate
change and climate variability. Belize’s main export commodities are all vulnerable to the impacts of
climate change and, therefore, the development of the “National Adaptation Strategy to Address
Climate Change in the Agriculture Sector” is an important addition to the nation’s set of appropriate
responses.
The Ministry of Natural Resources and Agriculture is the Government of Belize’s agency responsible
for the planning, regulation and implementation of the national policies and programs which will
enable the country to maintain effective its responses to climate change in this sector, over time. It is in
that context, that I commend the European Union Global Climate Change Alliance, the Caribbean
Community Climate Change Centre and all the stakeholders who contributed to the development of
this Strategy and Action Plan. Belize now has a clearly articulated framework to guide the
development of the agriculture sector forward.
Looking to the future, there is one certainty which is that there will be climate change and climate
variability impacts over the foreseeable future. However, the work contained in this document will
ensure that Belize has a set of viable responses to address these challenges.
Jose Alpuche
Chief Executive Officer for Agriculture
Ministry of Natural Resources and Agriculture

A National Adaptation Strategy to Address Climate Change in the Agriculture Sector in Belize
3
Acknowledgements and disclaimer
This document is an output from the EU-GCCA Caribbean Support Project, which is funded by the European
Union (EU) under a Grant Contract FED/2011/267-392 for the implementation of an action entitled: Support to
the Global Climate Change Alliance (GCCA) under the 10th EDF Intra-African Caribbean and Pacific financial
framework in the Caribbean (EU-GCCA Project).
The report was prepared by the Belize Enterprise for Sustainable Development (BEST), Lead Consultant – Mrs.
Francine Magloire and Key Expert – Mr. Ramon Frutos.
Technical supervision: Mr. Joseph McGann, Programme Manager, EU-GCCA Project.
The views expressed herein are those of the authors and do not necessarily reflect the views of the EU, ACP
Secretariat, the Caribbean Community Climate Change Centre or the Government of Belize.
For more information visit:
The Global Climate Change Alliance website: http://www.gcca.eu/
The African, Caribbean and Pacific Secretariat website: http://www.acp.int/
The Caribbean Community Climate Change Centre website: http://www.caribbeanclimate.bz
The National Climate Change Office website: http://www.climatechange.ict.gov.bz
A National Adaptation Strategy to Address Climate Change in the Agriculture Sector in Belize
4
Table of Contents PPaaggee NNooss..
A. Executive Summary…………………………………………………………………........................... 12
Climate Change Projections......................................................................................................... ............ 12
Climate Change Impact on Agriculture Sector ……………………………………………………………....... 14
Development of Strategy…………………………………………………………………………………………. 14
Draft Strategy and Action Plan……………………………………………………………………………......... 15
(a) Rainfall excesses and flooding……………………………………………………………………................ 15
(b) Precipitation deficit and drought………………………………………………........................................ 15
(c) Rainfall variability……………………………………………………………………………...................... 15
(d) Temperature increase…………………………………………………………………………...................... 16
(e) Changes in pests and diseases……………………………………………………………………………....... 16
(f) Changes in soil fertility……………………………………………………………………………………….. 16
(g) Aquaculture adaptation measures…………………………………………………………........................ 17
(h) Cross-cutting measures………………………………………………………………………...................... 17
Strategy Implementation……………………………………………………………………………………….... 18
B. Introduction – Context of Assignment…………………………………………………………........... 19
C. Structure of the National Agriculture Sector Adaptation Strategy………………………………....... 20
D. Methodology.............................................................................................................................. 21
1. Overview of the Agriculture Sector……………………………………………………………............... 23
1.1 Economic Framework………………………………………………………………………........... 23 1.1.1 Government………………………………………………………………………......... 23 1.1.2 Geography and Climate………………………………………………………….......... 23
1.1.3 Population………………………………………………………………………............ 23 1.1.4 The Belizean Economy…………………………………………………………........... 24 1.1.5 Critical Issues in Agriculture and the Belizean Economy……………………............ 28
Structure and Ownership……………………………………………………………….......... 28
Employment…………………………………………………………………………….......... 29
Food and Nutrition Security……………………………………………………………........ 29 Food Imports…………………………………………………………………………............. 30 Population Growth………………………………………………………………………....... 31
1.2 Environmental Context of Agriculture................................................................................... 32 1.2.1 Watersheds and Main Cropping Zones.................................................................. 32
1.2.2 Soils of Belize....................................................................................................... 34
1.3 Agriculture systems and crops………………………………………………………………........... 35 1.3.1 Sugarcane………………………………………………………………………….......... 37 1.3.2 Citrus………………………………………………………………………………......... 41
1.3.3 Banana………………………………………………………………………….............. 44 1.3.4 Rice…………………………………………………………………….......................... 46 1.3.5 Corn………………………………………………………………………..................... 48
1.3.6 Beans……………………………………………………………………….................... 51
1.3.7 Vegetables…………………………………………………………………………......... 51
1.3.8 Livestock (cattle)……………………………………………………………………....... 53 1.3.9 Aquaculture……………………………………………………………………….......... 54
1.4 Institutional and Regulatory Framework…………………………………………….................... 57 1.4.1 Institutional Framework....................................................................................... 57 1.4.2 Regulatory Framework………………………………………………………………..... 57
1.5 Research............................................................................................................................... 59
1.5.1 Caribbean Agriculture Research and Development Institute.................................... 59

A National Adaptation Strategy to Address Climate Change in the Agriculture Sector in Belize
5
PPaaggee NNooss..
1.5.2 Citrus Research and Education Institute................................................................. 59
1.5.3 Sugar Industry Research and Development Institute............................................... 60 1.5.4 Central Farm Research and Development Station.................................................. 60
1.5.5 National Coordinating Committee for Agricultural Research & Development......... 60 1.5.6 Agriculture Mission of the Republic of China on Taiwan....................................... 60
1.6 International Development Partners....................................................................................... 60 1.6.1 Inter-American Institute for Cooperation on Agriculture......................................... 60 1.6.2 International Regional Organization for Agricultural Health................................... 61
1.6.3 Caribbean Community Climate Change Centre...................................................... 61 1.6.4 Food and Agriculture Organization of the United Nations...................................... 61
1.6.5 European Union.................................................................................................... 62 1.6.6 United Nations Development Programme.............................................................. 62
1.7 Policy Framework…………………………………………………………………………….......... 62 1.7.1Horizon 2030 National Development Framework................................................... 62
1.7.2 Land Use Policy…………………………………………………………………........... 63
1.7.3 Water Policy……………………………………………………………………….......... 63 1.7.4 Agriculture Policy and Strategy………………………………………………….......... 63
1.7.5 Plan of Action for Disaster Risk Reduction in Agriculture (POA)…………….......... 64 1.7.6 Energy Policy……………………………………………………………………........... 64 1.7.7 Biosafety Policy……………………………………………………………………........ 64
1.7.8 Aquaculture Policy………………………………………………………………........... 65
2. Projected Climate Change impacts on the agriculture sector……………………...................... 65
2.1 Current Climate……………………………………………………………………………….......... 65
2.1.1 Current Climate of Belize………………………………………………………............ 66 2.1.2 Temperature……………………………………………………………………….......... 67
2.1.3 Extreme Rainfall events…………………………………………………………........... 67 2.1.4 Agro-climatic Zones in Belize……………………………………………………......... 68 2.1.5 Current Climate in Northern Zone: Corozal and Orange Walk Districts……........... 68
2.1.6 Current Climate for Central Coastal Zone: Belize & Central Stann Creek Dist......... 69 2.1.7 Current Climate in the Stann Creek District…………………………………….......... 70 2.1.8 Current Climate for West Central Zone: Cayo District…………………………......... 72
2.1.9 Current Weather for the Southern Zone: Southern Stann Creek, Toledo Dists.......... 73
2.2 PRECIS Regional Climate Model.......................................................................................... 74 2.2.1 Historic Climate Trends......................................................................................... 75
2.3 Climate change projections…………………………………………………………………............ 85 2.3.1 IPCC AR5 Global Climate Model Projections for Central America and the Caribbean.......................................................................................................... 85
2.3.2 Projected Sea Level Rise........................................................................................ 85 2.3.3 Regional Climate Projections…………………………………………………….......... 86
2.3.4 Oak Ridge National Laboratory and NASA Meso-scale Modelling System, version 3.6, (RCM) for Mexico and Central America.......................................... 87 2.3.5 PRECIS Climate Model Projections……………………………………………........... 88
2.3.6 PRECIS – Echam4 A2 and B2 projections of per cent change in rainfall for Belize….................................................................................................................... 90 2.3.7 Changes in Moisture Deficit/Surplus, Precipitation – Evapotranspiration
(P-E, mm/day) between PRECIS-Echam5 A2 Projections for 2060-2069 relative to 1970-2005 for agro-climatic zones in Belize..................................................................... 92
2.3.8 Towerhill, Orange Walk, Northern Zone: Sugar cane and mechanized irrigated Rice…….......................................................................................................... 92 2.3.9 Melinda, Stann Creek District: Citrus…………………………….............................. 93
2.3.10 Mayan King, Southern Stann Creek District: Banana, Aquaculture, Corn.............. 94 2.3.11 Central Farm, Cayo District: Corn, Beans, Citrus, Livestock.................................. 94
A National Adaptation Strategy to Address Climate Change in the Agriculture Sector in Belize
6
PPaaggee NNooss..
2.3.12 Changes in P – E between PRECIS –Echams5 A2 Projections for 2060-2069
relative to 1970 – 2005................................................................................................... 95
2.4 Crop Model Results and Impact of Climate Change in Agriculture……………………….......... 96
2.4.1 Summary of Climate-crop Modelling Done in Belize…………………………........... 96 2.4.2 Climate Change Impacts on Pests………………………………………………........... 100
2.4.3 Constraints to Climate Change Pest Models……………………………………......... 105 2.4.4 Impact Assessment of Major Commodities………………………………………....... 106
3. Adaptation Strategies to address the Adverse Effects of Climate Change on Agriculture….... 109
3.1 Summary of Findings from Consultations………………………………………………………… 111
3.2 Proposed Adaptation Measures……………………………………………………………............ 112
3.2.1 Rainfall Effects and Changes…………………………………………………………... 112 3.2.1.1 Drainage………………………………………………………………......... 113
3.2.1.2 Road Infrastructure……………………………………………………....... 113
3.2.1.3 Relocation………………………………………………………………...... 113 3.2.1.4 Irrigation………………………………………………………………......... 113
3.2.1.5 Watershed Management………………………………………………....... 114 3.2.1.6 Water Harvesting………………………………………………………....... 114
3.2.1.7 Weather Forecasting and Seasonal Production……………………… 114
3.2.2 Temperature - Effects and Changes………………………………………………. 115
3.2.2.1 Crop and Livestock Tolerance....................................................................... 115
3.2.2.2 Irrigation…………………………………………………………………………. 115
3.2.2.3 Silvopastoral Systems…………………………………………………………… 115
3.2.2.4 Heat alleviating Infrastructure………………………………………………….. 115
3.2.3 Pests and Diseases - Effects and Changes………………………………………... 116
3.2.3.1 Integrated Crop/Pest Management…………………………………………….. 116
3.2.3.2 Protective Cropping Structures (tropical greenhouses)………………………... 116
3.2.3.3 Pest Modelling…………………………………………………………………… 117
3.2.3.4 Biological Control……………………………………………………………….. 117
3.2.3.5 Biodiversity………………………………………………………………………. 118
3.2.3.6 Research………………………………………………………………………….. 118
3.2.4 Soil Fertility - Effects and Changes……………………………………………..... 118
3.2.4.1 Soil/Nutrition Management……………………………………………………. 118
3.2.4.2 Soil Amendment………………………………………………………………… 119
3.2.4.3 Vegetation Management………………………………………………………… 119
3.3 Aquaculture Adaptation Measures………………………………………………......... 119
3.3.1 Increased frequency and intensity of tropical cyclones...................................... 120
3.3.2 Increase in sea surface temperatures................................................................. 120
3.3.3 Increased periods of dry.................................................................................. 120
3.3.4 Increased intensity and volume of rainfall........................................................ 120
3.3.5 Increase in the number and types of pests diseases........................................... 121
3.3.6 Improvement in policy and regulatory services................................................ 121
3.3.7 Access to clean water sources.......................................................................... 121
3.3.8 Water storage................................................................................................. 121
3.3.9 Information and technology transfer............................................................... 121
3.3.10 Reduced energy cost..................................................................................... 122
3.3.11 Renewable sources of energy......................................................................... 122
3.3.12 Research....................................................................................................... 122
3.3.13 Improved brood stock................................................................................... 122
3.3.14 Crop insurance............................................................................................. 122

A National Adaptation Strategy to Address Climate Change in the Agriculture Sector in Belize
7
PPaaggee NNooss..
3.4 Cross-cutting Adaptation Measures…………………………………………………….. 122
3.4.1 Insurance……………………………………....................................................... 122
3.4.2 Farmer Group Resilience..……………………………………………………….... 122
3.4.3 Monitoring and Documentation…………………………………………………... 123
4. Implementation Capacity…………………………………………………………………….... 124
4.1 Institutional Capacity…………………………………………………………………………...124
4.2 Policy Environment…………………………………………………………………………..... 125
4.3 Technical Capacity……………………………………………………………………………... 126
4.4 Stakeholder Attitude, Interest and Awareness……………………………………………….. 128
5. Action Plan…………………………………………………………………………………….... 130
5.1 Infrastructure………………………………………………………………………………….... 130
5.1.1 Drainage Systems………………………………………………………………...... 130
5.1.2 Laboratory for Biological Control……………………………………………….... 130
5.1.3 Soil and Tissue Analysis Laboratory…………………………………………….... 130
5.1.4 Protective Cropping Structures…………………………………………………..... 130
5.1.5 Road Infrastructure……………………………………………………………........ 131
5.1.6 Electrification or use of Solar Pumps for Irrigation..……………………………...131
5.1.7 Germplasm Banks………………………………………………………………….. 131
5.1.8 Water Catchments………………………………………………………………….. 131
5.1.9 Agro-met Forecasting Equipment……………………………………………….... 131
5.1.10 Monitoring and Documentation Software…………………………………….... 131
5.1.11 Research Programme and Facility………………………………………………. 132
5.1.12 Compost Facilities………………………………………………………………... 132
5.2 Research and Training……………………………………………………………………….... 132
5.2.1 Formal Training.............................................................................................. 132
5.2.2 In-service Training........................................................................................... 133
5.3 Public Education and Early Warning………………………………………………………... 133
5.4 Insurance……………………………………………………………………………………….. 134
References…………………………………………………………………………………………... 138
List of Annexes
Annex I: Survey Questionnaires………………………………………………………………..... 142
Annex II: Database of responses……………………………………………………………….... 155
Annex III: Climate Change and Agriculture in Belize………………………………………….. 158
Annex III A: IPCC Fifth Assessment Report Indicators……………………………………….. 158
Annex III B: Optimum Temperature and Growing Periods for some of Belize’s
major crops………………………………………………………………………………………… 160
Annex III C: Climate Change Severity Index…………………………………………………… 161
Annex III D: Sea Level Rise……………………………………………………………………… 162
Annex III E: IPCC Fifth Assessment Report (AR5) Climate Projections for
Central America and the Caribbean.…………………………………………………………….. 163
Annex III F: Effects of changes in temperature and precipitation on agricultural and
crop production losses as a percent of Belize’s 2007 GDP……………………………………… 164
Annex IV: List of Stakeholders…………………………………………………………………… 165
Annex V: Workshop Participants………………………………………………………………... 175

A National Adaptation Strategy to Address Climate Change in the Agriculture Sector in Belize
8
List of Tables and Figures PPaaggee NNooss..
Table 1 (a): Belize Census 2010 Provisional Population and Household……………………........... 24 Table 1 (b): Belize GDP Market Prices 2002 – 2012…………………………………………............. 25
Table 1 (c): Employment by Major Industry by Gender………………………………………........... 29 Table 1 (d): Population projections 1980 – 2050………………………………………………............ 31
Table 1 (e): Soil Categories in Belize……………………………………………………………........... 34 Table 1 (f): Agricultural Value Lands in Belize………………………………………………….......... 35 Table 1 (g): Characteristics of Crop Production in Belize.............................................................. 37
Table 2 (a): Average Seasonal and Annual Rainfall at Key Meteorological Stations………............ 67 Table 2 (b): Climatology (1980 – 2010) and Model Projection of Evapo-transpiration.................... 84
Table 2 (b)-2: Summary of Global Climate Models (GCMs) Projections Caribbean and Belize................................................................................................................................... 87 Table 2 (c): Regional Model Projections of mean surface temperature and % change in
rainfall for some stations in Belize for 2020-2025 and 2080-2085 relative to the period 1970-2000................................................................................................................................... 89 Table 2 (d): Precis Echam4 Projection of Percent Change Seasonal Rainfall – Northern
Belize.......................................................................................................................................... 90 Table 2 (e): Precis Echam4 Projection of Percent Change Rainfall – Western Belize....................... 91
Table 2 (f): Precis Echam4 Projection of Percent change Rainfall – Stann Creek Dist..................... 91 Table 2 (g): Precis Echam4 Projection of Percent Change Rainfall – Toledo Dist........................... 91 Table 2 (h): DSSAT3 Resultant Crop Yields for 2˚C Increase in Temperature and ±20%
Change in Rainfall...................................................................................................................... 96 Table 2 (i): Change in Yields for Sugarcane and Citrus for 2028 and 2050..................................... 97
Table 2 (j): Crop Wat Simulation of Percent Yield Reduction for corn & dry beans (2050 – 2055).............................................................................................................................. 99 Table 2 (k): Matrix of Climate Variability and Climate Change Impacts on Agriculture and
Water in Belize........................................................................................................................... 106 Table 2 (l): Risks, Climate Change Impacts and Adaptation Strategy for Crops and Livestock.................................................................................................................................... 108
Table 3 (a): Cost, financing and implementation of actions pertaining to infrastructure and equipment............................................................................................................................ 135
Table 3 (b): Cost, financing and implementation of actions pertaining to research and
training....................................................................................................................................... 136 Table 3 (c): Cost, financing and implementation of actions pertaining to education and
early warning.............................................................................................................................. 137 Table 3 (d): Cost, financing and implementation of action for commodity insurance..................... 137 Figure 1 (a): GDP Growths 2002 – 2012………………………………………………………........... 25
Figure 1 (b): Key sector contributions to GDP at market value…………………………….............. 26 Figure 1 (c): Value of exports by major categories 2013……………………………………............... 27
Figure 1 (d): Major agriculture exports 2013…………………………………………………….......... 28 Figure 1 (e): Gross imports of food and live animals…………………………………………............ 30 Figure 1 (f): Watershed map of Belize.......................................................................................... 33
Figure 1 (g): Sugar production 2000 – 2013……………………………………………………............ 37 Figure 1 (h): Annual conversion rate sugarcane 2000 – 2013………………………………............... 38
Figure 1 (i): Orange production 2000 – 2013…………………………………………………............. 41 Figure 1 (j): Orange acreage 2000 – 2013……………………………………………………............... 42 Figure 1 (k):Grapefruit production 2000 – 2013………………………………………………............ 42
Figure 1 (l): Grapefruit acreage 2000 – 2014………………………………………………….............. 43
Figure 1 (m): Citrus exports……………………………………………………………………….......... 44 Figure 1 (n): Total rice production 2000 – 2012…………………………………………………......... 47
Figure 1 (o): Total mechanized and milpa corn production 2000 – 2012…………………................ 50 Figure 1 (p): Total vegetable production 2000 – 2012.................................................................... 52
Figure 1 (q): Total vegetable acreage 2000 - 2012………………………………………….................. 52 Figure 2.1: Isohyets of mean annual rainfall (mm) for Belize......................................................... 65 Figure 2.2 (a): Climate Chart - Libertad, Corozal District………………………………………......... 68
Figure 2.2 (b): Climate Chart – Towerhill, Orange Walk District……………………………............ 68

A National Adaptation Strategy to Address Climate Change in the Agriculture Sector in Belize
9
PPaaggee NNooss..
Figure 2.2 (c): Mean moisture deficit/surplus – Northern Belize……………………………........... 69
Figure 2.3 (a): Climate Chart for PSWGIA……………………………………………………......... 70 Figure 2.3 (b): Climate Chart – Melinda, Stann Creek District……………………………….......... 70
Figure 2.4 (a): Climate Chart – Middlesex, Stann Creek District................................................. 71 Figure 2.4 (b): Climate Chart – Mayan King, Stann Creek District.............................................. 71 Figure 2.4 (c): Mean moisture deficit/surplus – Stann Creek District........................................... 71
Figure 2.5 (a): Climate Chart – Central Farm, Cayo District....................................................... 72 Figure 2.5 (b): Climate Chart – Belmopan, Cayo District............................................................ 72 Figure 2.5 (c): Mean, monthly moisture deficit/surplus – Cayo District....................................... 72
Figure 2.5 (d): Historic five-day rainfall...................................................................................... 72 Figure 2.6 (a): Climate Chart – Punta Gorda, Toledo District..................................................... 73
Figure 2.6 (b): Climate Chart – Blue Creek, Toledo District........................................................ 73 Figure 2.6 (c): Mean, monthly moisture deficit/surplus – Toledo District..................................... 74 Figure 2.7: Historic Annual Rainfall – Belize City (1887 – 2013).................................................. 75
Figure 2.8: Annual Rainfall – Philip Goldson International Airport (1960 – 2013)........................ 76 Figure 2.9: Historic mean decadal rainfall rainfall for Central Belize (2001 – 2009)....................... 77
Figure 2.10 (a): Precis Echam A2 Annual Rainfall Model Projection/Tower Hill......................... 78
Figure 2.10 (b): Precis Echam A2 Annual Rainfall Projection – Central Farm............................... 78 Figure 2.10 (c): Precis Echam A2 Annual Rainfall Model Projection/Melinda............................. 79
Figure 2.10 (d): Precis Echam A2 Annual Rainfall Model Projection/PGAG Stat........................ 79 Figure 2.11 (a): Precis Echam A2 Annual Minimum Temp. Trend PSWGIA............................... 80 Figure 2.11 (b): Precis Echam A2 Annual Minimum Temp. PSWGIA......................................... 80
Figure 2.12: Monthly and Seasonal Minimum Temp. PSWGIA................................................... 81 Figure 2.13 (a): Actual and PRECIS-Echam4 A2 Mean Minimum Temperature
for Philip S.W. Goldson International Airport (1991 – 2012)....................................................... 82 Figure 2.13 (b): Scattered plot of Actual and PRECIS-Echam4 A2 Mean Minimum Temperature for Philip S.W. Goldson International Airport (1991 – 2013).................................... 82
Figure 2.14 (a): Maximum Temperature Trend and PRECIS-Echam4 A2 Projection for Philip S.W. Goldson International Airport (1967 – 2013)............................................................. 82 Figure 2.14 (b): Scatted plot of mean maximum temperature and PRECIS-Echam4 A2
Philip S.W. Goldson International Airport (1991 – 2013)............................................................. 82 Figures 2.15 (a-d): Mean Annual Evapotranspiration trend for Central Belize (1980 – 2010).......... 83
Figure 2.16: Global Sea Level (1880 – 2010)................................................................................ 84 Figure 2.17: PRECIS-Echam4 and PRECIS-HADCM3 Regional Model Results for Caribbean, Central America and Belize....................................................................................... 86
Figure 2.18 (a-b): Temperature & Rainfall Anomalies - Belmopan (2020s, 2050s & 2080s)............. 88 Figure 2.19: Actual and PRECIS-Echam4 A2 Plot of Annual Mean Minimum Temperature for Philip S.W. Goldson International Airport (1991 – 2099)................................... 89
Figure 2.20: Changes in Mean Monthly and Seasonal P-E (1970 – 2005) & PRECIS-Echam5 A2 Projections (2060 – 2069) for Towerhill.................................................................................. 92
Figure 2.21:Changes in Mean Monthly and Seasonal P-E (1970 – 2005) & PRECIS-Echam5 A2 Projections (2060 – 2069) for Melinda, Stann Creek District.................................................... 93 Figure 2.22:Changes in Mean Monthly and Seasonal P-E (1970 – 2005) & PRECIS-Echam5
A2 Projections (2060 – 2069) for Mayan King, South Stann Creek District.................................... 94 Figure 2.23:Changes in Mean Monthly and Seasonal P-E (1970 – 2005) & PRECIS-Echam5
A2 Projections (2060 – 2069) for Central Farm, Cayo District....................................................... 94 Figure 2.24: Changes in Mean Monthly and Seasonal P-E (1970 – 2005) & PRECIS-Echam5 A2 Projections for Punta Gorda Agricultural Station, Toledo District........................................... 95
Figure 2.25 (a): Black Sigatoka disease cycle................................................................................ 103 Figure 2.25 (b): Seasonal variation of ascospores and conidi in the Caribbean zone, C. Rica.......... 103 Figure 2.25 (c): Infection duration with different levels of temperature.......................................... 104
Figure 2.25 (d): Evapotranspiration Index.................................................................................... 105 Figure 2.25 (e): Risk Evaluation Model........................................................................................ 105
Figure 3.1: Summary Results of Consultations and Survey Process............................................... 111 Figure 3.2: Schematic of crop response curve with and without limiting factors............................. 112 Figure 4.1: Stakeholder attitude, interest and awareness towards Agriculture................................. 129
A National Adaptation Strategy to Address Climate Change in the Agriculture Sector in Belize
10
Abbreviations and Acronyms
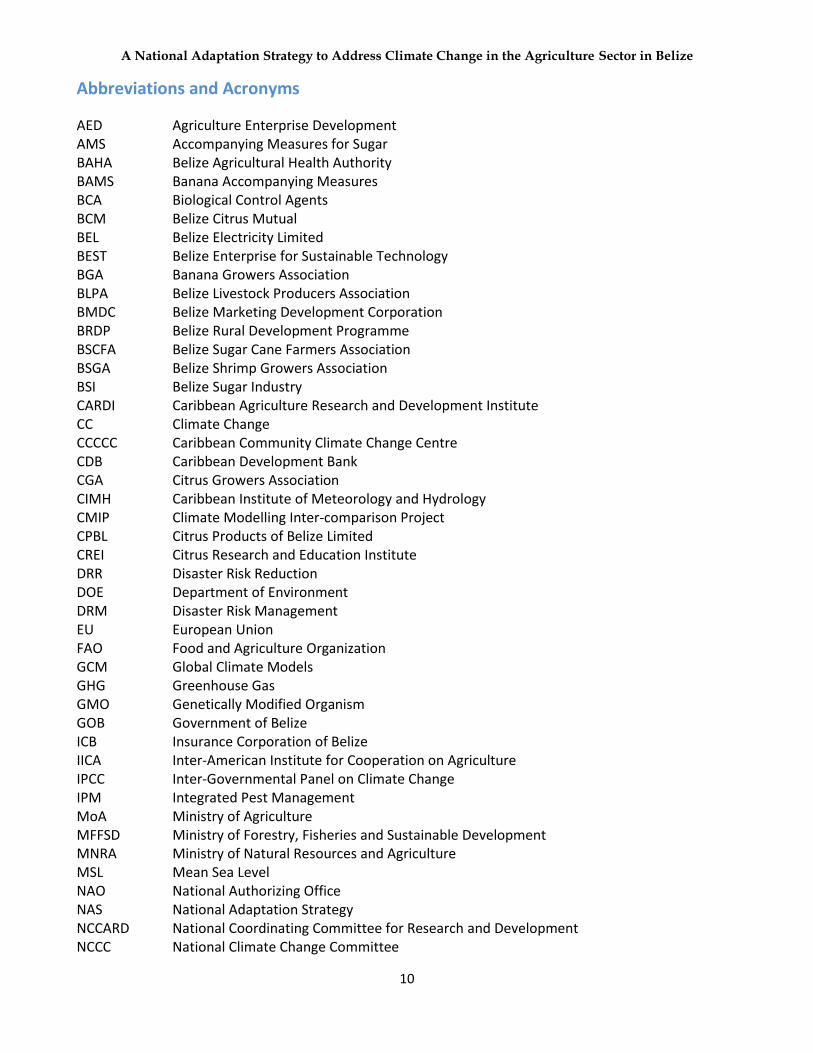
AED Agriculture Enterprise Development AMS Accompanying Measures for Sugar BAHA Belize Agricultural Health Authority BAMS Banana Accompanying Measures BCA Biological Control Agents BCM Belize Citrus Mutual BEL Belize Electricity Limited BEST Belize Enterprise for Sustainable Technology BGA Banana Growers Association BLPA Belize Livestock Producers Association BMDC Belize Marketing Development Corporation BRDP Belize Rural Development Programme BSCFA Belize Sugar Cane Farmers Association BSGA Belize Shrimp Growers Association BSI Belize Sugar Industry CARDI Caribbean Agriculture Research and Development Institute CC Climate Change CCCCC Caribbean Community Climate Change Centre CDB Caribbean Development Bank CGA Citrus Growers Association CIMH Caribbean Institute of Meteorology and Hydrology CMIP Climate Modelling Inter-comparison Project CPBL Citrus Products of Belize Limited CREI Citrus Research and Education Institute DRR Disaster Risk Reduction DOE Department of Environment DRM Disaster Risk Management EU European Union FAO Food and Agriculture Organization GCM Global Climate Models GHG Greenhouse Gas GMO Genetically Modified Organism GOB Government of Belize ICB Insurance Corporation of Belize IICA Inter-American Institute for Cooperation on Agriculture IPCC Inter-Governmental Panel on Climate Change IPM Integrated Pest Management MoA Ministry of Agriculture MFFSD Ministry of Forestry, Fisheries and Sustainable Development MNRA Ministry of Natural Resources and Agriculture MSL Mean Sea Level NAO National Authorizing Office NAS National Adaptation Strategy NCCARD National Coordinating Committee for Research and Development NCCC National Climate Change Committee
A National Adaptation Strategy to Address Climate Change in the Agriculture Sector in Belize
11
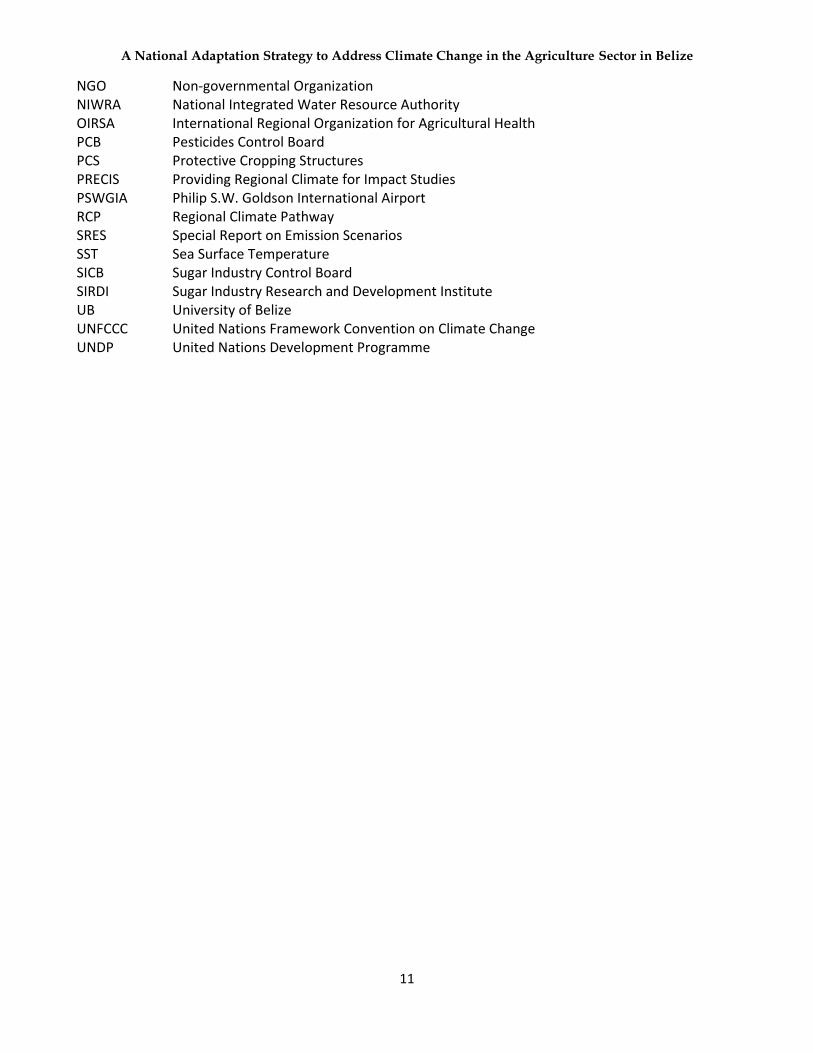
NGO Non-governmental Organization NIWRA National Integrated Water Resource Authority OIRSA International Regional Organization for Agricultural Health PCB Pesticides Control Board PCS Protective Cropping Structures PRECIS Providing Regional Climate for Impact Studies PSWGIA Philip S.W. Goldson International Airport RCP Regional Climate Pathway SRES Special Report on Emission Scenarios SST Sea Surface Temperature SICB Sugar Industry Control Board SIRDI Sugar Industry Research and Development Institute UB University of Belize UNFCCC United Nations Framework Convention on Climate Change UNDP United Nations Development Programme
A National Adaptation Strategy to Address Climate Change in the Agriculture Sector in Belize
12
A. Executive Summary
Agriculture is critical to Belize’s development for foreign exchange earnings and savings,
employment, and food and nutrition security. Belize is considered food secure in basic grains,
livestock and seasonally available vegetables and fruits from a production standpoint. Food production
and security should not be taken for granted since threats exist as evidenced during the recent bouts of
excessive rainfall and flooding in late 2013 and early 2014.
Like other developing countries, particularly Small Island Developing States, Belize is very vulnerable
to the adverse effects and the impacts of climate change and climate variability. The main export
commodities, bananas, citrus, sugar and aquaculture, plus commodities accessing emerging markets
and the local food crops are all vulnerable to the vagaries of the climate.
In this context support was provided to the Government of Belize (GOB) through the Caribbean
Community Climate Change Centre (CCCCC), with the Ministry of Forestry, Fisheries and
Sustainable Development (MFFSD) as the implementing agency, to prepare a National Adaptation
Strategy (NAS) and Action Plan to address the current and projected impacts of climate change on the
agriculture sector in Belize. Belize Enterprise for Sustainable Technology (BEST) consultants were
tasked to prepare this strategy with specific adaptation measures to reduce the impacts of climate
change and climate variability on agriculture in Belize. This required an assessment of the agriculture
sector including its vulnerability and adaptation to climate variability and climate change; a review of
the pertinent policies, legislation, institutions, organizations and resources directly or indirectly
involved with agriculture, taking into consideration the views, concerns and recommendations of the
key stakeholders; and the financial, institutional, human and other resource requirements to implement
the strategic options proposed.
The technical assessment was informed by a comprehensive literature review of the Belizean
agriculture sector including its institutional, policy and ecological environment, climate change model
projections for Belize from recently conducted climate modelling experiments using the Hadley Centre
Regional Climate Model (RCM), Providing Regional Climate for Impact Studies (PRECIS) (- Echam4,
- Echam5 and - HADCM3) under the A2 and B2 scenarios of the Inter-Governmental Panel on Climate
Change (IPCC) scenarios (SRES), and recent regional and national crop modelling studies.
Climate Change Projections
The results of the analysis on climatic trends and future climate model projections for the western
Caribbean region, including Belize, indicated that over the past 50 years temperatures have been rising
steadily and are projected to continue along this trend. Rainfall variability has increased, and will
likely become more pronounced in the future. Increases in seasonal evapotranspiration rates have been
noted over the recent past, while significant decrease in wet season moisture surpluses is foreseen.
Global sea levels have risen over the past 130 years and are forecast to continue rising during the 21st
century.

A National Adaptation Strategy to Address Climate Change in the Agriculture Sector in Belize
13
The review of meteorological data for the period 1961-2013, shows the annual average minimum
temperature at the Philip S.W. Goldson International Airport (PSWGIA) has been increasing at the rate
of 0.028 °C per annum or has risen by 1.4 °C over the past 52 years. The analysis indicates that, for the
same period, the annual average maximum temperature has been rising at the rate of 0.0133 °C per
annum or about 0.6 °C in the past 45 years. The annual average temperature at the PSWGIA has
increased by 0.5 °C since 1961. The studies show that the nights are warming up faster than the days,
but in general the temperatures in Belize are rising.
A trend analysis of the historic rainfall for Belize City since 1887 to the present showed a 4.6 mm per
annum decrease in rainfall or 46 mm decrease per decade, which translates to 480 mm decrease in
annual rainfall over the past 126 years. However, the review and analysis of rainfall records from
1960-2013 for PSWGIA, shows a slight increasing trend of 1.4 mm per annum or 14 mm per decade.
The historic rainfall record 1901-2013 for central Belize (Mitchell, 2013) revealed an increasing trend
of 7.6 mm per decade or 82 mm increase over the 108 years record. Meanwhile, for northern Belize
rainfall trend analysis for the period 1992 to 2013 at Towerhill indicates a rise of about 275 mm over
the twenty-three years. In short, the trend analysis indicates that wet years have been more frequent at
the end of the 20th
century and the first decade of the 21st century, with higher frequency of short, but
intense rainfall events as was experienced with the upsurge of tropical cyclone activity in the western
Caribbean during the 1990-2010 decades.
A trend analysis for seasonal evapotranspiration rates (E) for central Belize indicates that the greatest
increase occurred during June–July–August (JJA) at the rate of 3.4 mm per season over the 30 year
period 1980-2010. Meanwhile, global sea levels have been rising at the rate of 0.0162 cm per annum, a
rise of near 21 cm for the period 1880-2010 (CISRO, 2012).
Analysis of Climate Change projections suggested that, under the A2 scenario (worst case) Belize will
experience temperature increases of near 2 °C by the 2050s and almost 4 °C by the 2080s, relative to
the baseline period 1961-1990. RCM projections for the 2050s show percent change in rainfall in the
order of -20 % to – 30 % from the reference period 1961-1990 under the A2 scenario, and around -50
% to -60 % change from normal by the 2080s.
Projections of atmospheric moisture deficit/surplus (P-E) show that by the 2080s, dry months deficits
will decrease slightly, but the wet season months (JJA & SON) will see a decrease in moisture
surpluses. This means that the dry seasons will be slightly less intense around the 2080s, but the wet
seasons will become drier.
Sea surface temperatures are projected to rise at an average of 0.7 °C to 2.7 °C in the Caribbean.
(CaribSave, 2009)
The coastal lowlands in northern Belize will be vulnerable to sea-level rise according to the global
climate model projections. Between 2046 and 2065 the mean increase in sea levels for the different
scenarios will range from 0.17 m to 0.3 m with 0.38 m being at the extreme value. For the period 2081
to 2100 this average increases and ranges between 0.4 m and 0.63 m with 0.82 m as the extreme.

A National Adaptation Strategy to Address Climate Change in the Agriculture Sector in Belize
14
Climate Change Impacts on the Agriculture Sector
Climate Change and climate variability will impact agriculture systems and practices such as soil
fertility and land preparation; pest and disease control; and water requirements (excess and deficits).
Higher temperatures will cause increased stress on current livestock breeds, and crop types and
varieties. Climate Change and climate variability will very likely result in less rainfall overall, but the
most detrimental effect is likely to come from the variation in the seasonal distribution of rainfall,
leading to more periodic droughts and floods.
Development of the Strategy
With a focus on foreign exchange and food and nutrition security, nine commodities, sugarcane, citrus,
bananas, shrimp, rice, corn, beans, livestock and vegetables were identified as the most important for
review and analysis during the preparation of the NAS. Extensive consultations including the use of
structured questionnaires were held with three categories of stakeholders (1) policy makers; (2)
agriculture producers; and, (3) support entities to identify vulnerabilities, gaps, needs, policies and
strategies necessary to adapt to the challenges of climate change and climate variability; to design
appropriate interventions; to assess technical, institutional and educational needs for implementation;
and to indicate consensus views on the roles, responsibilities and capabilities of the various entities
which must partner in the implementation of the recommended strategies.
Two of the salient issues emerging from the extensive consultation process were: (1) that most
stakeholders have observed climate change and climate variability effects on agricultural systems, and
(2) that pests/diseases and soil nutrition management were considered the most critical adaptation
needs. Whereas some farmers use chemical pesticides as the primary method of pest control, most are
environmentally conscious and believe that integrated crop and pest management are better
alternatives. Vegetable farmers recommended protective cropping structures as an important
adaptation measure. Commodity tolerance for climate change and climate variability effects is
considered a priority adaptation measure, including adjustment of commodity types and varieties and
production systems to minimize need for extraneous interventions. Stakeholders in general considered
organic production an economic opportunity as well as an adaptation measure in response to climate
change and climate variability. It was noted that most farmers are business oriented, and expressed a
strong desire for a commodity insurance plan that will provide effective coverage. An area of concern
is that only half of the government policy makers are knowledgeable about Belize’s national biosafety
policy and most producers are unaware of the policy.
Based on current information regarding possible adaptation measures, the status of the agricultural
sector including its policy and institutional framework, the consultations with stakeholder groups and
analysis of responses, a draft strategy was prepared including recommendations for specific technical
and cross-cutting adaptation measures, policy, legal and institutional strengthening and stakeholder
education, early warning and awareness programmes.
During and following the staging of three regional consultative workshops the draft strategy was
supplemented, re-defined and refined with comments and suggestions received from key stakeholders
A National Adaptation Strategy to Address Climate Change in the Agriculture Sector in Belize
15
including producer groups and support agencies. A revised draft strategy and action plan was
subsequently presented to policy makers and other key stakeholders in a national workshop for further
inputs leading to the preparation of the final draft of the synthesis report.
Draft Strategy and Action Plan
Technical adaptation measures are recommended to combat the following four detrimental effects of
Climate Change and Climate variability:
i. Direct effects - rainfall changes: excess, shortage and variability
ii. Direct effects - temperature increase
iii. Indirect effects of rainfall and temperature changes – greater than changes in pests and
diseases status
iv. Indirect effects of rainfall and temperature changes – greater than changes in soil fertility
The recommended measures for each of the direct and indirect effects are as follows:
(a) Rainfall excesses and flooding
- Properly designed drainage infrastructure, systems and mechanisms to alleviate waterlogging
stress on crops and pastures.
- Well designed and drained road infrastructure to ensure access to farms and transport of farm
produce post rainfall event.
- Relocation of annual crops within a farmed area during an annual production cycle based on
seasonal rainfall forecast.
(b) Rainfall deficit and drought
- Irrigation, including drip irrigation to conserve scarce water resources, to supply the water
needs of priority crops. Use of renewable energy sources to reduce cost of pumping water for
irrigation.
- Watershed management to maintain the country’s water resources in the long term.
- Water harvesting during periods of rainfall for use under conditions of water shortage.
(c) Rainfall variability
- Seasonal production to adjust to the different crop water requirements at critical phases of the
production cycle.

A National Adaptation Strategy to Address Climate Change in the Agriculture Sector in Belize
16
- Timely and localized weather forecast specifically for agriculture purposes to enable farmers to
time their activities in relation to forecasted weather events/conditions.
(d) Temperature increase
- Selection for heat-tolerant crop and pasture varieties and livestock breeds that are better
adapted to the increased temperatures regimes brought about under Climate Change, with
emphasis on indigenous genetic diversity. Preservation of selected indigenous crop and
livestock in germplasm banks.
- Alleviation of heat stress on plants through irrigation to supply sufficient water to allow the
cooling effect of evapotranspiration,
- Silvopastoral systems which utilize shade trees of economic value to alleviate heat stress on
range livestock.
- Heat alleviating infrastructure or appropriately ventilated housing designs especially for
poultry, pigs, sheep and goats.
(e) Changes in pests and diseases
- Integrated Pest Management (IPM) practices to keep pests below economic threshold levels in
order to minimize risks to human health, beneficial and non-target organisms, and the
environment.
- Protective cropping structures (PCS) to physically exclude arthropod pests, and minimize
disease incidence by excluding rainfall disseminated fungal and bacterial pathogens. Protective
cropping structures can also be utilized for the production of vegetables on coastal areas
vulnerable to salt water intrusion when combined with the use of harvested water for irrigation
and decreased water use for pest management.
- Use of models developed for Climate Change scenarios to forecast potential pest outbreaks
based on meteorological data.
- The use of appropriate indigenous or, if necessary, imported Biological Control Agents (BCA)
for the most expedient, cost effective and environmentally sustainable option for management
of crop pests and disease vectors.
- Improved biodiversity for the agro-ecological balance needed for economic sustainability of
agriculture production systems.
- Research into new pest and disease interactions that will evolve as a result of Climate Change.
(f) Changes in soil fertility
- Soil and nutrition management to implement measures to preserve and improve the physical,
chemical and nutritional properties of soils affected by increased temperatures and variation in

A National Adaptation Strategy to Address Climate Change in the Agriculture Sector in Belize
17
water regime resulting from Climate Change. Selection of nutritious pasture grasses that can
tolerate soils affected by both drought and excessive water, along with grazing management
practices to maintain longevity and fertility of pastures.
- Selection of nutritious pasture grasses that can tolerate soils affected by both drought and
excessive water.
- Use of grazing management practices to maintain longevity and fertility of pastures.
- Improvement of soil fertility through the use of organic matter such as compost, vermiculture
and bokashi.
- Use of physical and chemical amendments, and beneficial micro organisms.
- Vegetation management (crop cover) to prevent exposure of bare soils and its subsequent
erosion, including maintenance of live vegetative cover during fallow periods.
(g) Aquaculture adaptation measures
- Improved brood stock (resistance to disease and tolerance to environmental change i.e.,
control of temperature and salinity).
- Access to clean water sources (to facilitate rapid water exchange regularly).
- Water Storage.
- Reduced energy cost including the use of renewable and / alternative sources of energy i.e.,
solar, wind, etc.
- Research (resistant varieties, improved management systems; improved shrimp growing
techniques)
- Information and technology transfer
- Improvement in regulatory services (Belize Agricultural Health Authority (BAHA) & the
Department of the Environment (DOE)
(h) Cross-cutting measures
(a) Commodity Insurance
Commodity insurance is considered critical to maintain levels of production under the predicted
Climate Change scenarios. The current need for insurance services to farmers and producers in the
sector will be substantially increased as some of the impacts that are expected with Climate Change
become increasingly evident.
A National Adaptation Strategy to Address Climate Change in the Agriculture Sector in Belize
18
(b) Group resilience
It is recognized that the people factor is always the most important element for successful
implementation. Suggestion is made to achieve the effective engagement of the primary stakeholders,
the farming community, and to promote group resiliency for responding to the challenges of Climate
Change.
(c) Monitoring and documentation
Effective adaptation to the effects of Climate Change will require continuous monitoring and
documentation of crop and livestock responses to the meteorological, agro-ecological and
environmental changes experienced over time. Actions will include the provision of
monitoring/documentation software and materials, along with training and education of stakeholders.
Strategy implementation
The agriculture sector is fairly well poised to implement the proposed adaptation measures in terms of
technical capacity, institutional and policy environment and stakeholder attitude, but with some
failings or shortfalls for which recommendations for rectification are indicated. Commitment of top
level decision makers will be the key determining factor for implementation.
Implementation of the strategy will require investments in infrastructure and equipment, research and
training, education and early warning systems and matching funds for a public/private sector
partnership commodity insurance scheme.
Infrastructure development and procurement of equipment needed to effect improvements in the
agriculture sector in drainage, irrigation, feeder roads network, pest/disease management, crop
nutrition, agro-meteorology forecasting, monitoring and documentation detailed in table 6(a) amount
to approximately BZ$ 26.15 million.
A further BZ$ 720,000 will be required for the necessary research and training needs as indicated in
table 6(b). Training includes both in-service training and formal education to equip the national
agriculture institution with the necessary subject matter expertise for effective and efficient
implementation of the technical adaptation measures.
An annual budget of BZ$ 50,000 is recommended for education programmes for all stakeholders and
early warning systems for the agriculture sector as shown in table 6(c).
Finally it is recommended that GOB allocate annual funding of BZ$ 5.0 million as matching funds for
an agriculture commodity insurance scheme (table 6(d)) in partnership with a designated private entity
which has indicated an interest in this area.

A National Adaptation Strategy to Address Climate Change in the Agriculture Sector in Belize
19
B. INTRODUCTION – CONTEXT OF ASSIGNMENT
The Caribbean Community Climate Change Centre (CCCCC) has secured resources to execute a
regional project designed to assist sixteen (16) CARIFORUM1 member states to develop the capacity
to design and implement Climate Change adaptation policies and measures. Through this “European
Union Global Climate Change Alliance Caribbean Support Project’, funded from the 10th European
Development Fund-Intra African Caribbean Pacific financial framework , the CCCCC has embarked
on a series of initiatives to incorporate and mainstream climate change adaptation into the national
development planning processes and mechanisms of participating countries. The end result is an
expectation that the economic and social development of these countries and the region will be
enhanced.
Over the recent past, the Government of Belize (GOB) has taken several initiatives to mainstream
Climate Change into its national development planning processes. One major activity in this vein has
been the establishment of a National Climate Change Office in the Ministry of Forestry, Fisheries and
Sustainable Development (MFFSD), which serves as the National Focal Point for Climate Change
issues and is the body responsible for overseeing the GOB’s international climate change obligations
particularly those under the United Nations Framework Convention on Climate Change (UNFCCC).
Vulnerability studies and assessments on the impacts of Climate Change on agriculture and food
security in the sub-regions of Central America and the Caribbean, indicate a reduction in yields for
several key crops (Ramirez, et al. 2013, Eitzinger, 2012), increasing stress and reduction in livestock
production, increased crop pests and animal diseases, continued degradation of recharged areas and
scarcity of water, and a threat to the livelihood security of thousands of persons and their families who
depend directly or indirectly on agriculture for their survival.
Specific adaptation responses now, rather than later, could reduce the vulnerability of farmers and
agriculture sector-dependent communities. Adaptation is aimed at developing strategies and actions to
diminish the vulnerability to climate change, so that the expected negative impacts may be smaller or
eliminated.
In Belize, the Ministry of Natural Resources and Agriculture (MNRA) and MFFSD have been selected
as the implementing bodies for a national Global Climate Change Alliance Project aimed at addressing
issues of coastal flooding and the modelling of impacts in these areas where agriculture is the main
economic activity. Also, there have been projects to prepare a national energy policy, a renewable
energy policy and other initiatives which help to provide a sound basis for building an adaptation
strategy for the agricultural sector in Belize.
It is in this context that support was provided to the GOB through the CCCCC, with the MFFSD as the
implementing agency, to prepare a National Adaptation Strategy and Action Plan (NASAP) for the
agriculture sector to address the current and projected impacts of Climate Change on the agriculture
1 The Caribbean Forum (CARIFORUM) is a subgroup of African, Caribbean and Pacific (ACP) Group of States and serves
as a base for economic dialogue with the European Union. It was established in 1992 and is comprised of the 15 Caribbean
Community member states and the Dominican Republic.

A National Adaptation Strategy to Address Climate Change in the Agriculture Sector in Belize
20
sector. The Belize Enterprise for Sustainable Technology (BEST) was contracted to undertake this
task.
The Climate Change and Agriculture assessment endeavours to highlight the technical, agronomic and
economic impacts of Climate Change (CC) on the agricultural sector. The intent is to identify practical
and cost-effective adaptation measures that will help inform an agricultural strategy which can be
mainstreamed into the planning cycle of present and future development plans, programmes and
projects in the various subsectors in agriculture. The strategic plan will put the agriculture sector in a
better state of preparedness to face the continued challenges posed by increasing climate variability
and Climate Change impacts. It should improve the capacity of the sector to become more resilient,
competitive and diversified to enable the sector to grasp any opportunities arising with warmer climate,
and reduce its vulnerability to increasing future extreme climatic events.
The specific objectives to be fulfilled are:
o An impact assessment of the vulnerability and adaptation of the agriculture sector to climate
variability and Climate Change and its predicted adverse effects in the medium and long term;
o An assessment of the agricultural sector and pertinent legislation, institutions, organizations
and resources that are directly or indirectly involved with agriculture related activities;
o An assessment of the financial, institutional, human and other resource requirements to
implement the strategic options proposed ;
o A national agriculture sector adaptation strategy with specific adaptation measures to reduce
the impacts of Climate Change on agriculture;
o An action plan with recommendations on the possible mechanisms and resources required for
implementation.
C. STRUCTURE OF THE NATIONAL ADAPTATION STRATEGY FOR THE
AGRICULTURE SECTOR
The National Adaptation Strategy (NAS) for the Agriculture Sector will be governed by the following
guiding principles listed below:
o Climate Change and Disaster Risk Management (DRM) in agriculture are inter-related and
have some mutual adaptation needs. A comprehensive DRM strategy has been prepared and
will be referred to but not repeated in the Climate Change strategy;
o Agriculture is primarily for food and nutrition security, revenue and foreign exchange
generation and employment. All agriculture industries are important and all producers must co-
exist;
o The Climate Change adaptation strategy must fit into the overall strategy for agriculture
advancement for it to be meaningful. Similarly the agriculture policy and strategy must ally
with the country's national development policy to elicit commitment from relevant policy
makers;
A National Adaptation Strategy to Address Climate Change in the Agriculture Sector in Belize
21
o All the nation’s populace are stakeholders in a CC strategy for agriculture. However
appropriate action and subsequent implementation will depend on the collective wisdom and
buy in of the key stakeholders which are the policy makers and the farming population at all
levels;
o Adaptation measures have to increase or maintain competitiveness in agriculture, which could
mean the need to change selection of crops in a globally competitive scenario;
o Agriculture systems need to improve technical efficiency of production to offset losses caused
by unfavorable climatic factors. Improved efficiency should be a consistent objective but it
becomes more critical when dealing with exogenous factors we cannot control; and
o The CC adaptation strategy should be revisited or updated periodically as new technologies and
agriculture opportunities become available and critical needs emerge due to human and
technological factors.
In the preparation of the NAS, the following issues will be assessed sequentially and pragmatically:
1. Belize’s current agricultural status, framework and environment;
2. Projected Climate Change impacts on agricultural activities and development;
3. Possible adaptation strategies to address the adverse effects of climate change on
agriculture;
4. How well the sector is poised to adopt the proposed measures; and
5. Action Plan – including the adaptation measures, costs, funding mechanisms, timeframes,
and implementing agencies.
D. METHODOLOGY
The development of the National Adaptation Strategy to address Climate Change the Agricultural
Sector in Belize could be a very exhaustive process since farmers produce a wide array of commodities
for export, the domestic market or subsistence. These commodities include sugarcane, citrus, bananas,
papaya, cacao, cowpea, hot pepper, rice, corn, beans, sorghum, soybean, pineapple, peanuts, cassava,
cocoyam, other root crops, coconuts, onions, potatoes, carrots, tomatoes, cabbage, sweet pepper, a
wide variety of fruits and other vegetables, aquaculture and livestock.
With a focus on foreign exchange and food and nutrition security, nine commodities were selected as
the most important for the preparation of the NAS.
The traditional export commodities sugarcane, citrus and bananas, along with the more recently
developed aquaculture industry (shrimp) are the most significant for foreign exchange earnings. Rice,
corn, beans and livestock (primarily poultry and cattle) are considered the staples of the Belizean diet
and critical to food security. Vegetables are produced mainly by small farmers scattered throughout
the country and stakeholders at large fully recognize the important health benefits afforded by the

A National Adaptation Strategy to Address Climate Change in the Agriculture Sector in Belize
22
consumption of more vegetables in the Belizean diet, and the necessity of providing a wholesome
product.
After selection of the commodities of emphasis for the development of the adaptation strategy three
major categories of stakeholders were identified for the consultative process: (1) policy makers, (2)
agriculture producers and (3) support entities. Policy makers included the various departments of the
ministries of Natural Resources and Agriculture, Forestry, Fisheries and Sustainable Development,
Economic Development, Science, Technology and Public Utilities, and statutory regulatory bodies
such as the Belize Agricultural Health Authority (BAHA), Pesticides Control Board (PCB) and the
Belize Livestock Producers Association (BLPA), Support agencies included research, education,
funding and partnering organizations, agriculture affiliated regional and international organizations,
non-governmental organizations (NGO’s) and agriculture services providers.
The technical assessment was informed by several methodologies that provided quantitative as well as
qualitative data and information to fulfil the objectives. These included:
i. A comprehensive literature review of (a) the agriculture sector including its institutional,
policy and ecological environment, (b) regional and national past studies on CC, its impacts
on agriculture and possible adaptation strategies and (c) climate projections under two
IPCC climate change SRES Scenarios downscaled regional Models, namely the PRECIS-
Echam4 A2 and B2 and PRECIS-HadCM3.
ii. An analysis of historical rainfall, temperature and evapotranspiration for Belize to evaluate
climate trends and warming.
iii. An evaluation of the IPCC AR-5 Global Climate Model (GCMs-RCM).
iv. Analyses of regional climate change model data in relation to plant growth and
development and livestock comfort and production.
The preliminary assessment of climate projections for Belize was used to inform the drafting of a
survey instrument to gauge stakeholder’s perception and interest on the effects of climate change on
agriculture, to meaningfully engage stakeholders in a participatory approach to identify vulnerabilities,
gaps, needs, policies and strategies necessary to adapt to the challenges of climate change, to design
appropriate interventions, assess technical, institutional and educational needs for implementation, and
indicate consensus views on the roles, responsibilities and capabilities of the various entities which
must partner in the implementation of any recommended strategies. Three questionnaires, one for each
stakeholder category, were used to assist the consultation process with stakeholders in all six districts.
Initial consultations with producers, policy makers and support agencies were carried out mainly by
individual, group and electronic interviews. Questionnaire responses from all the stakeholders were
documented, analysed and used to assist the preparation of a draft adaptation strategy and action plan.
This draft strategy was used as the basis to conduct three regional consultative workshops, with a
stakeholder mix of producers and support agencies, in the Orange Walk, Stann Creek and Cayo
Districts.

A National Adaptation Strategy to Address Climate Change in the Agriculture Sector in Belize
23
The draft strategy was augmented and refined with the comments and suggestions received from the
three regional workshops. The adjusted draft strategy and action plan was then presented to policy
makers at a national workshop for comments and further inputs for the preparation of the final draft
synthesis report.
1. OVERVIEW OF THE AGRICULTURE SECTOR
1.1 Economic Framework
1.1.1 Government
Belize, a full member of the Caribbean Common Market, is an independent Parliamentary democracy
which uses the Westminster model of government. There are two independent houses that form the
legislature, a 31 member elected House of Representatives and a 13 member appointed Senate. As a
member of the British Commonwealth, the country retains the Queen of England as its head of State
represented in Belize by an appointed Governor General. Members of the House of Representatives
hold office for five years, but elections can be called at any point by the Prime Minister, who is the
head of the Executive Branch of government. There are two major political parties, the Peoples United
Party and the United Democratic Party, which have held national office since political independence in
September 1981.
1.1.2 Geography and Climate
Located in northern Central America, Belize is nestled on the south-eastern corner of the Yucatan
Peninsula, bounded in the north by Mexico, in the south and west by Guatemala, and to the east by the
Caribbean Sea. It has a total land area of 8,867 square miles or 22,967 square kilometers. The
mainland makes up 95% per cent of the territory and five per cent is represented by more than 1,060
small islands or cayes. The country boasts the longest living barrier reef in the Western Hemisphere.
With its territorial waters included, Belize’s coordinates extend from 15° 53′ and 18° 30′ N latitude and
87° 15′ and 89° 15′ W longitude. Using an offshore territorial limit of 12 miles or 20 km, the national
territory including the cayes and territorial sea is 18,000 sq. miles or 46, 620 sq. km. There are about
595 sq. miles or 1,540 sq. km of lagoons on the mainland, reducing the actual landmass to some 8,263
sq. miles or 21,400 sq. km. From north to south Belize has a length of about 161 mi or 260 km, and
from east to west from about 111 to about 180 km. The coastline extends a little farther to about 173 m
or about 280 km. The country is comprised of 6 districts, nine municipalities, and more than two
hundred and forty villages.
1.1.3 Population
The population estimates for 2013 place Belize population at 349,728 persons residing in the six
districts. The demographic profile from Census 2010 was about 51 percent males and 49 percent
females. The urban population was 44 percent of the total and while the rural population stood at 56

A National Adaptation Strategy to Address Climate Change in the Agriculture Sector in Belize
24
percent. According to the 2010 census, the population density was 15 persons per square kilometer,
the lowest population density in Central America, with an annual population growth rate of 2.56%.
Table 1 (a): Belize Census 2010 Provisional Population and Household (Source: SIB, 2010)
1.1. 4 The Belizean Economy
The Belizean economy is a small open economic system in which international trade is a large
component of the country’s transactions. Trade in real goods in a significant part of the earnings of
foreign exchange and as a consequence, the economy is more subject to shocks from external
activities. The critical sectors of the economy are mostly natural resources based, including the
Tourism sector which is dependent on maintaining the pristine state of the rivers, coastal waters and
cayes and the health of the forests and watersheds which is what most visitors come to enjoy.
A National Adaptation Strategy to Address Climate Change in the Agriculture Sector in Belize
25
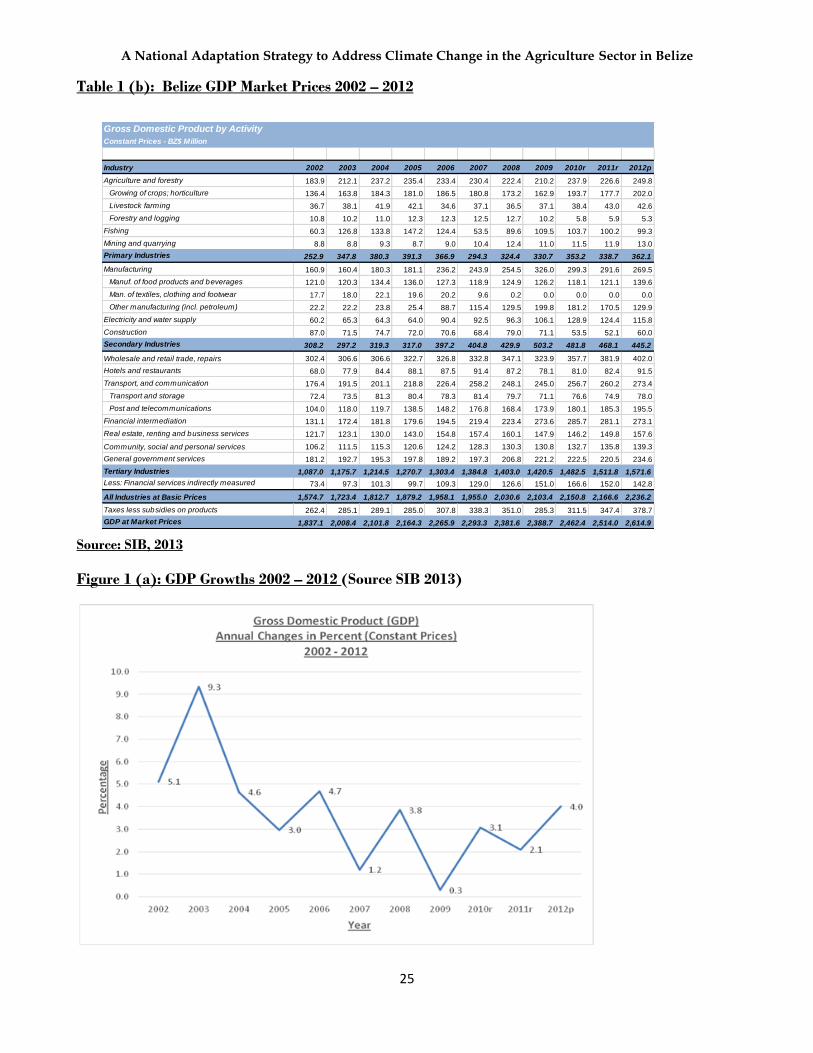
Table 1 (b): Belize GDP Market Prices 2002 – 2012
Source: SIB, 2013
Figure 1 (a): GDP Growths 2002 – 2012 (Source SIB 2013)
Gross Domestic Product by Activity
Constant Prices - BZ$ Million
Industry 2002 2003 2004 2005 2006 2007 2008 2009 2010r 2011r 2012p
Agriculture and forestry 183.9 212.1 237.2 235.4 233.4 230.4 222.4 210.2 237.9 226.6 249.8
Growing of crops; horticulture 136.4 163.8 184.3 181.0 186.5 180.8 173.2 162.9 193.7 177.7 202.0
Livestock farming 36.7 38.1 41.9 42.1 34.6 37.1 36.5 37.1 38.4 43.0 42.6
Forestry and logging 10.8 10.2 11.0 12.3 12.3 12.5 12.7 10.2 5.8 5.9 5.3
Fishing 60.3 126.8 133.8 147.2 124.4 53.5 89.6 109.5 103.7 100.2 99.3
Mining and quarrying 8.8 8.8 9.3 8.7 9.0 10.4 12.4 11.0 11.5 11.9 13.0
Primary Industries 252.9 347.8 380.3 391.3 366.9 294.3 324.4 330.7 353.2 338.7 362.1
Manufacturing 160.9 160.4 180.3 181.1 236.2 243.9 254.5 326.0 299.3 291.6 269.5
Manuf. of food products and beverages 121.0 120.3 134.4 136.0 127.3 118.9 124.9 126.2 118.1 121.1 139.6
Man. of textiles, clothing and footwear 17.7 18.0 22.1 19.6 20.2 9.6 0.2 0.0 0.0 0.0 0.0
Other manufacturing (incl. petroleum) 22.2 22.2 23.8 25.4 88.7 115.4 129.5 199.8 181.2 170.5 129.9
Electricity and water supply 60.2 65.3 64.3 64.0 90.4 92.5 96.3 106.1 128.9 124.4 115.8
Construction 87.0 71.5 74.7 72.0 70.6 68.4 79.0 71.1 53.5 52.1 60.0
Secondary Industries 308.2 297.2 319.3 317.0 397.2 404.8 429.9 503.2 481.8 468.1 445.2
Wholesale and retail trade, repairs 302.4 306.6 306.6 322.7 326.8 332.8 347.1 323.9 357.7 381.9 402.0
Hotels and restaurants 68.0 77.9 84.4 88.1 87.5 91.4 87.2 78.1 81.0 82.4 91.5
Transport, and communication 176.4 191.5 201.1 218.8 226.4 258.2 248.1 245.0 256.7 260.2 273.4
Transport and storage 72.4 73.5 81.3 80.4 78.3 81.4 79.7 71.1 76.6 74.9 78.0
Post and telecommunications 104.0 118.0 119.7 138.5 148.2 176.8 168.4 173.9 180.1 185.3 195.5
Financial intermediation 131.1 172.4 181.8 179.6 194.5 219.4 223.4 273.6 285.7 281.1 273.1
Real estate, renting and business services 121.7 123.1 130.0 143.0 154.8 157.4 160.1 147.9 146.2 149.8 157.6
Community, social and personal services 106.2 111.5 115.3 120.6 124.2 128.3 130.3 130.8 132.7 135.8 139.3
General government services 181.2 192.7 195.3 197.8 189.2 197.3 206.8 221.2 222.5 220.5 234.6
Tertiary Industries 1,087.0 1,175.7 1,214.5 1,270.7 1,303.4 1,384.8 1,403.0 1,420.5 1,482.5 1,511.8 1,571.6
Less: Financial services indirectly measured 73.4 97.3 101.3 99.7 109.3 129.0 126.6 151.0 166.6 152.0 142.8
All Industries at Basic Prices 1,574.7 1,723.4 1,812.7 1,879.2 1,958.1 1,955.0 2,030.6 2,103.4 2,150.8 2,166.6 2,236.2
Taxes less subsidies on products 262.4 285.1 289.1 285.0 307.8 338.3 351.0 285.3 311.5 347.4 378.7
GDP at Market Prices 1,837.1 2,008.4 2,101.8 2,164.3 2,265.9 2,293.3 2,381.6 2,388.7 2,462.4 2,514.0 2,614.9

A National Adaptation Strategy to Address Climate Change in the Agriculture Sector in Belize
26
During the period from 2002 - 2012, Belize’s economy experienced growth ranging from a high of
9.3% in 2003 and a low of 0.3 % in 2009. The average rate of growth over that period was 3.6%. In the
latter part of that decade, the most significant growth was contributed by the petroleum industry which
began in 2006.
In reality, the Agriculture sector is the most important component of Belize’s GDP both from an
economic and a social standpoint. In 2012, the production of sugar, citrus and bananas alone
contributed 8.3 % of GDP which was more than the 7.4 % contribution made by the Tourism sector.
The other significant contributor was the fishing and fish processing sector which added 2.5 % to GDP.
Figure 1 (b): Key Sector Contributions to GDP at Market Value (Source: SIB, 2013)
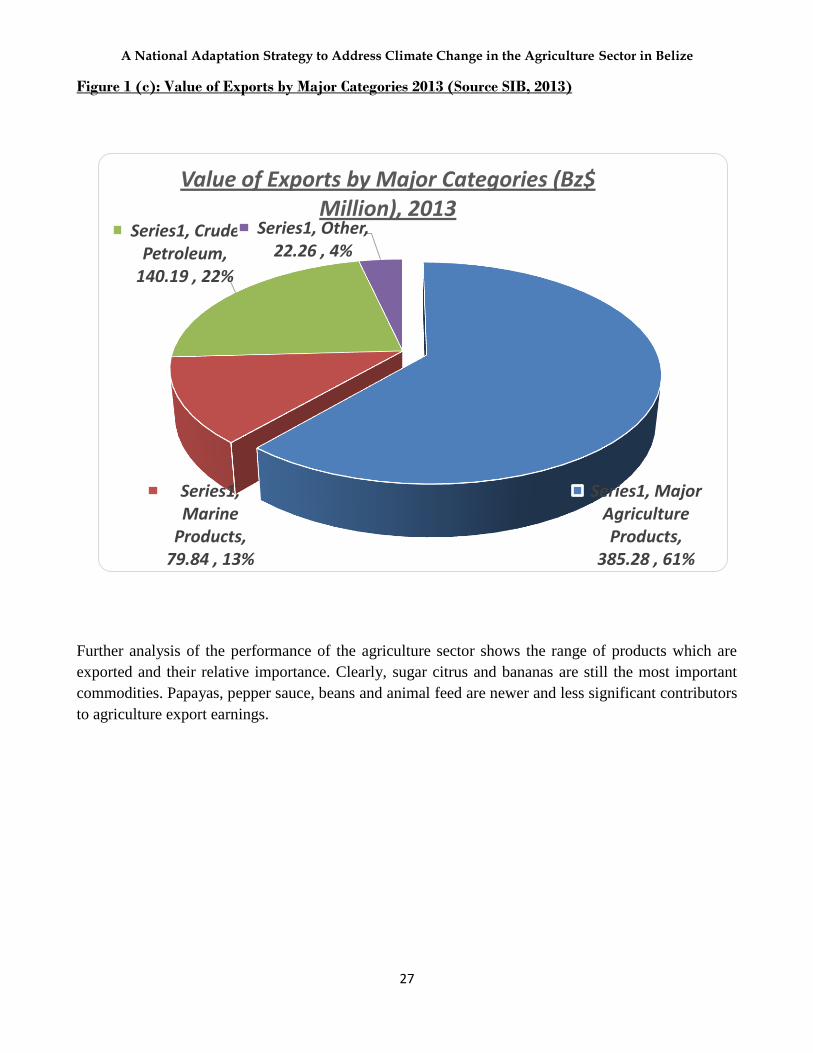
Closer examination provides a clearer appreciation of the importance of agriculture to the Belizean
economy. In 2013, the total value of exports was BZ$ 678.61 million. As Figure 1 (b) below shows,
agriculture accounted for 385.28 million or 61% of all exports. Exports of crude petroleum at BZ$
140.19 million or 22% and marine products at BZ$ 79.84 or 13% were a distant second and third
place, respectively.
2012, Sugar, 2.9 , 16%
2012, Citrus, 3.5 , 19%
2012, Bananas, 1.9 , 10%
2012, Forestry and Wood, 0.5 , 2%
2012, Fishing and Fish processing, 2.5 ,
13%
2012, Tourism, 7.4 , 40%
Key Sector Contribution to GDP at Market Value (%), 2012
*Note Sugar and Citrus already have the value of the processed product included
A National Adaptation Strategy to Address Climate Change in the Agriculture Sector in Belize
27
Figure 1 (c): Value of Exports by Major Categories 2013 (Source SIB, 2013)
Further analysis of the performance of the agriculture sector shows the range of products which are
exported and their relative importance. Clearly, sugar citrus and bananas are still the most important
commodities. Papayas, pepper sauce, beans and animal feed are newer and less significant contributors
to agriculture export earnings.
Series1, Major Agriculture Products,
385.28 , 61%
Series1, Marine
Products, 79.84 , 13%
Series1, Crude Petroleum,
140.19 , 22%
Series1, Other, 22.26 , 4%
Value of Exports by Major Categories (Bz$ Million), 2013

A National Adaptation Strategy to Address Climate Change in the Agriculture Sector in Belize
28
Figure 1 (d): Major Agriculture Exports (BZE$ Million), 2013 (Source: SIB, 2013)
1.1.5 Critical Issues in Agriculture and the Belizean Economy
Structure and Ownership
The structure and ownership patterns in the four major agricultural export subsectors are critical to the
growth, development and sustainability of these subsectors themselves and the broader macro
economy. A total of 5,444 individual farmers in the Corozal and Orange Walk Districts make up the
sugar sub-sector thus the income generated from the sugar industry has broad impact on household
incomes and livelihoods in these two districts.
In the citrus sub-sector, a total of 591 farm families in this industry benefit directly from the incomes
and dividends generated. The number of farmers indicates a lesser national impact than the sugar
industry; however, it has immense importance to the Stann Creek, and Toledo Districts where citrus
farms are located and where the combined levels of indigence and poverty are higher than the national
average.
The situation is quite the converse in the banana and aquaculture sub-sectors. These two industries
comprise eight and nine owners of banana farms and shrimp production units, respectively. The
ownership structure indicates that profits and dividends generated by these industries do not have the
same broad impact on household and individual incomes as the previous two industries.
Value (Bz$ Million), Sugar/ Molasses,
202.49, 53%
Value (Bz$ Million), Citrus Products*,
139.34, 36%
Value (Bz$ Million), Banana, 20.67, 5%
Value (Bz$ Million), Papayas, 11.50, 3%
Value (Bz$ Million), Pepper Sauce, 9.73,
3%
Value (Bz$ Million), Red Kidney Beans,
1.29, 0%
Value (Bz$ Million), Animal Feed, 0.21,
0% Value (Bz$ Million), Corn Meal, 0.04, 0%
Major Agriculture Exports (Bz$ Million), 2013
* Includes Orange and Grapefruit Concentrates, Squashes, Oils and Pulp Cells

A National Adaptation Strategy to Address Climate Change in the Agriculture Sector in Belize
29
Employment
In September 2013 Belize’s unemployment rate stood at 14%. One of the important considerations for
the national economy is always how well it absorbs its workforce. In examining the composition of the
workforce and where they are engaged, the results are interesting. Wholesale and Retail Trade and
Repairs at 21,943 employees is the category that absorbs the largest number of workers. This is the
followed closely, in second place, by Agriculture, Aquaculture and Related Activities with 21,669
employees and Community, Social and Personal Services in third place with 20,070 workers. An
important observation is that though frequently indicated in public statements and notices, Tourism at
fourth place employs only 18,850 workers. The fact is that the first three categories of employment
absorb one in six workers and the Tourism industry only one in seven. This information further
demonstrates the need to closely analyse the performance of these sectors during the decision making
process.
Table 1 (c): Employment by Major Industry by Gender
Food and Nutrition Security
Agriculture is critical to Belize’s development for foreign exchange earnings and savings,
employment, income generation, food and nutrition security. The importance of nutrition security
should not be understated as there is a recognized direct correlation with the health of a nation’s
Male Female Total
Ratio of
Persons
Employed by
Industry
Wholesale and Retail Trade; Repairs 13,163 8,780 21,943 6Agriculture and Related Activities / Aquaculture 19,657 2,012 21,669 6Community, Social & Personal Services; Extra
Territorial Organisations & Bodies
7,611 12,459 20,070 6
Tourism 10,660 8,190 18,850 7Government Services; Compulsory Social Security 8,389 6,495 14,884 9Construction 8,215 395 8,610 15Manufacturing 5,603 2,725 8,328 15Real Estate, Renting and Business Activities 3,026 1,600 4,626 28Financial Intermediation 1,113 1,776 2,889 44Transportation Storage and Communication 2,186 372 2,558 50Electricity and Gas and Water Supply 1,164 309 1,473 87Forestry, Logging and Sawmilling 590 9 599 214Mining and Quarrying 522 26 548 234DK/NS 800 429 1,229 104Total 82,699 45,577 128,276
Source: SIB (LFS September 2013)
Main Industry Employed by Sex
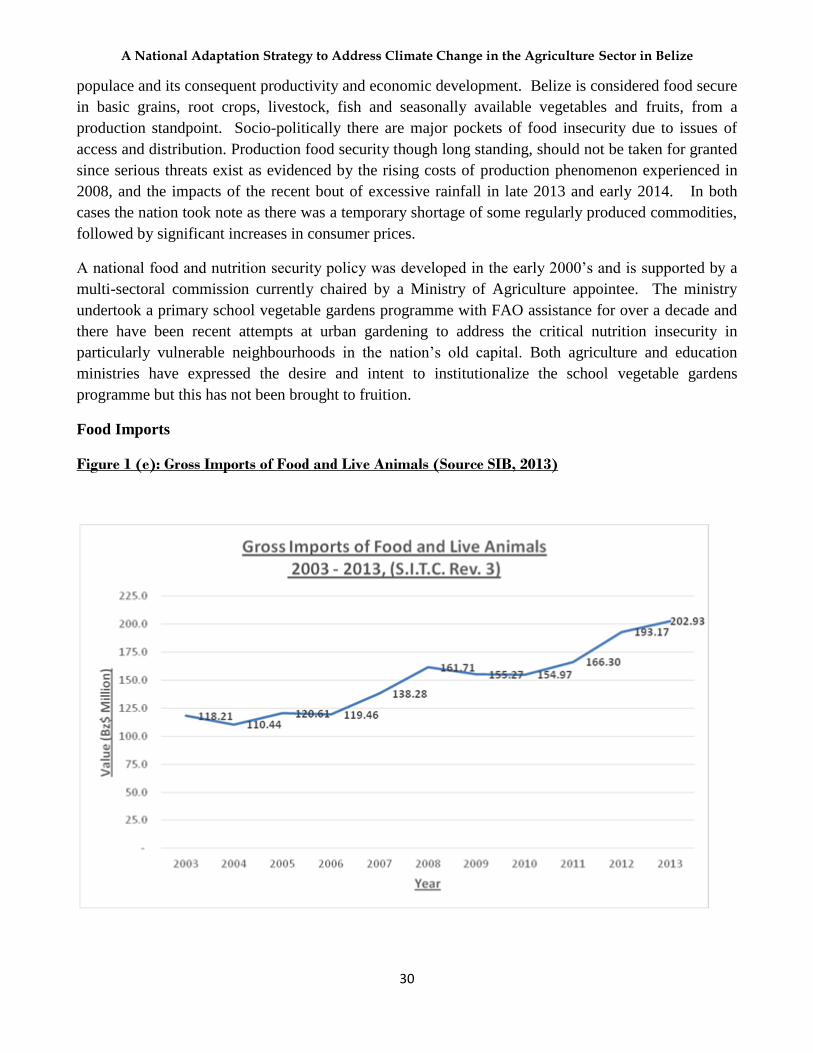
A National Adaptation Strategy to Address Climate Change in the Agriculture Sector in Belize
30
populace and its consequent productivity and economic development. Belize is considered food secure
in basic grains, root crops, livestock, fish and seasonally available vegetables and fruits, from a
production standpoint. Socio-politically there are major pockets of food insecurity due to issues of
access and distribution. Production food security though long standing, should not be taken for granted
since serious threats exist as evidenced by the rising costs of production phenomenon experienced in
2008, and the impacts of the recent bout of excessive rainfall in late 2013 and early 2014. In both
cases the nation took note as there was a temporary shortage of some regularly produced commodities,
followed by significant increases in consumer prices.
A national food and nutrition security policy was developed in the early 2000’s and is supported by a
multi-sectoral commission currently chaired by a Ministry of Agriculture appointee. The ministry
undertook a primary school vegetable gardens programme with FAO assistance for over a decade and
there have been recent attempts at urban gardening to address the critical nutrition insecurity in
particularly vulnerable neighbourhoods in the nation’s old capital. Both agriculture and education
ministries have expressed the desire and intent to institutionalize the school vegetable gardens
programme but this has not been brought to fruition.
Food Imports
Figure 1 (e): Gross Imports of Food and Live Animals (Source SIB, 2013)

A National Adaptation Strategy to Address Climate Change in the Agriculture Sector in Belize
31
The value of food imports has grown from 119.21 BZ$ Million to 202.93 BZ$ Million in the 10 year
period from 2003 – 2013. This reflects an average annual growth rate of 5.9% over that period. When
compared to the growth rate of the population, 2.56%, it clearly shows that the demand for imported
food items more than doubled the population growth rate.
Population Growth
Belize’s population is growing at an estimated rate of 2.56% per year. If this is maintained, it should
double the current population in about forty years. Based on the projections from the Statistical
Institute of Belize (SIB), this growth will also be accompanied with decreases in infant mortality and
increases in life expectancy. This will translate into a larger, older and more dependent population with
greater food and nutrition needs. If Belize’s food supply is to remain reasonably secure, then the
growth rate of the agriculture sector must match or exceed the rate of population growth.
Table 1 (d): Population Projections 1980- 2050 (Source SIB, 2013)
Conclusion
This review clearly demonstrates the continued importance of the agriculture sector to the Belizean
economy. Agriculture makes critical contributions to Belize’s national income, foreign exchange
earnings, employment and food and nutrition security for the fast growing population.

A National Adaptation Strategy to Address Climate Change in the Agriculture Sector in Belize
32
1.2 Environmental Context of Agriculture
1.2.1 Watersheds and Main Cropping Zones
Belize is uniquely endowed with substantial surface and groundwater resources. A dependable
tropical/subtropical rainfall regime in the northwest Caribbean region and Central America replenishes
the freshwater resource after extended dry periods, which are often induced by recurrent
atmospheric/oceanic phenomena such as El Niño Southern Oscillation (ENSO), the North Atlantic
Oscillation (NAO), and feedback mechanisms associated with Climate Change. However, increased
demands for freshwater resulting from population growth, expanding economic activity, energy
production and agricultural production are threatening the quality and availability of the country’s
freshwater resources. Coupled with these is the added stress on the resource induced by increasing
climatic variability and climate change effects witnessed over the past two decades.
Belize has a total of 18 major river catchments with another 16 sub-catchments, which drain the Maya
Mountains and the higher elevation of the interior, and discharge into the Caribbean Sea. The
Hydrology Unit of the Ministry of Natural Resources and Agriculture divides the country into four
water basin regions, namely: Region 7 in the north, Region 9 in the west and central corridor, Region
11 comprising the coastal plain and coastal slopes, and Region 13 in the extreme south.
Figure 1 (f) below is a watershed map of Belize, showing the 18 main watersheds and about 16 minor
watersheds draining the mainland of Belize.
Groundwater is a vital source of freshwater in rural Belize, where almost 95 % of the freshwater
supply comes from groundwater sources. (Rural Water Unit, Ministry of Rural Development).
Groundwater is extracted in rural areas through the use of hand pumps and rudimentary water systems,
although the former is gradually phasing out. The Rural Water Unit is primarily responsible for drilling
wells and installing pumps. It also works closely with communities in the development of rudimentary
water systems, which are financed jointly by the Government of Belize through the Social Investment
Fund (SIF) and United Nation’s agencies such as UNICEF, PAHO, and UNHCR.
The total volume per capita of renewable freshwater in Belize for 2008 was 53.156 thousand cubic
meters, one of the highest in Latin America (FAO Aguastat, 1988-2008). In additions, numerous
freshwater and brackish water lakes or lagoons are scattered in the central and northern coastal and
inland low-lying areas.
Potable water supply for urban communities and some rural settlements, and the provision of sewerage
services for Belize City and Belmopan are provided by the Belize Water Services Limited (BWS), a
semi- autonomous water company. BWS manages water supply systems for nine urban areas and some
fifty-six rudimentary systems.

A National Adaptation Strategy to Address Climate Change in the Agriculture Sector in Belize
33
Figure 1 (f): Watershed map of Belize (Source: LIC, MNRA 2014)

A National Adaptation Strategy to Address Climate Change in the Agriculture Sector in Belize
34
1.2.2 Soils of Belize
The soils of Belize are classified according to the land regions or important groups of land systems
they are attributed with as described in the land resource assessments conducted by King et al. (1986,
1989, and 1992). The soils can also be grouped into nine categories as listed in Table 1 (e) (Simpson,
2009). This categorization describes the main soils in their physiographic groups.
Table 1 (e): Soil Categories in Belize
(Source: Simpson, 2009)
The lands of Belize have also been categorized into five agricultural land classes or grades,
representing their potential for agricultural use and limitations such as drainage, shallowness, low
fertility, lack of moisture in the dry season and steepness. Table 1(f) is a summary of the Agricultural
Land Class or Grade.
Approximately 16% of the land in Belize is suitable for mechanized agriculture with income potential
and/or good financial success. Of this amount, 4% is Grade 1 land suitable for most crops. The greater
portion of this land is under citrus and banana cultivation. Grade 2 land comprises the remainder of the
mechanized agriculture lands and includes a large portion of the northern coastal plain under sugarcane
production.
Soil Category Soil Type/ Groups
1 Soils of the Maya Mountain
- Soils of the Mountain Pine Plateau
- Soils of the rugged land systems
2 Clays of the limestone uplands and foothills
3 Grey and brown soils of the Toledo Beds
4 Pine ridge soils of the coastal plain
5 Dark limestone clays of the Northern coastal plain
6 Reddish limestone clays of the Northern coastal plain
7 Swamp soils
8 Young soils on river alluvium
9 Young coastal soils
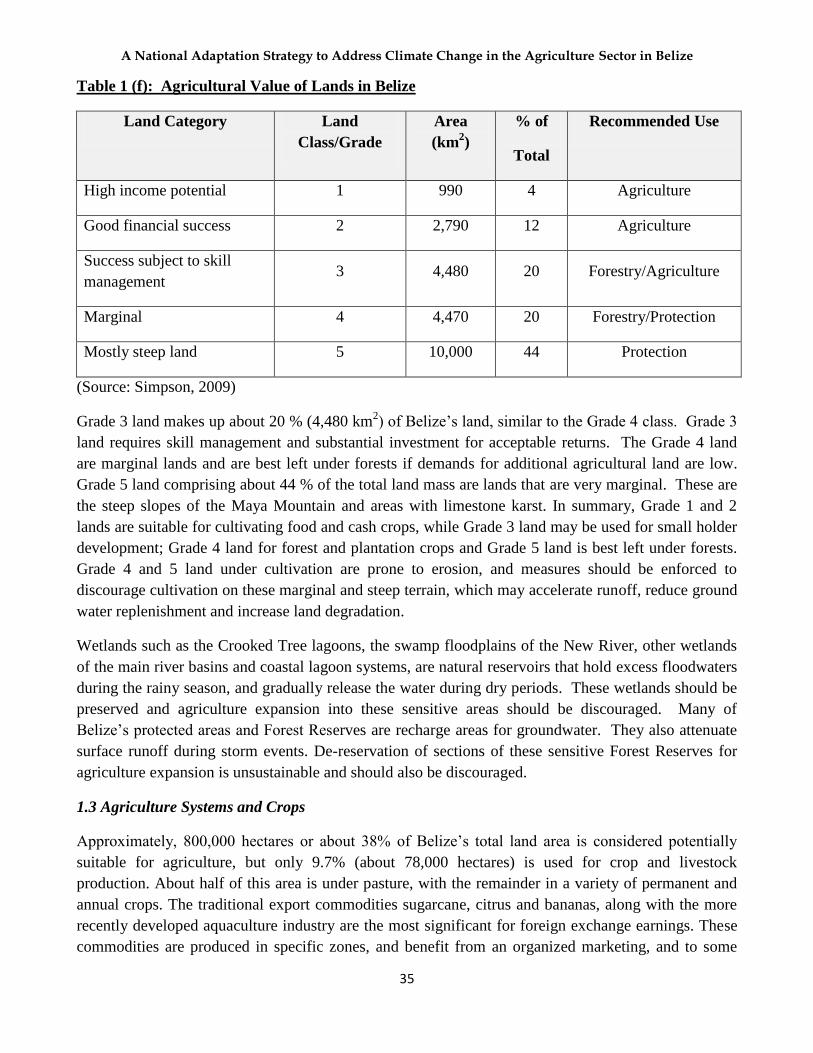
A National Adaptation Strategy to Address Climate Change in the Agriculture Sector in Belize
35
Table 1 (f): Agricultural Value of Lands in Belize
Land Category Land
Class/Grade
Area
(km2)
% of
Total
Recommended Use
High income potential 1 990 4 Agriculture
Good financial success 2 2,790 12 Agriculture
Success subject to skill
management 3 4,480 20 Forestry/Agriculture
Marginal 4 4,470 20 Forestry/Protection
Mostly steep land 5 10,000 44 Protection
(Source: Simpson, 2009)
Grade 3 land makes up about 20 % (4,480 km2) of Belize’s land, similar to the Grade 4 class. Grade 3
land requires skill management and substantial investment for acceptable returns. The Grade 4 land
are marginal lands and are best left under forests if demands for additional agricultural land are low.
Grade 5 land comprising about 44 % of the total land mass are lands that are very marginal. These are
the steep slopes of the Maya Mountain and areas with limestone karst. In summary, Grade 1 and 2
lands are suitable for cultivating food and cash crops, while Grade 3 land may be used for small holder
development; Grade 4 land for forest and plantation crops and Grade 5 land is best left under forests.
Grade 4 and 5 land under cultivation are prone to erosion, and measures should be enforced to
discourage cultivation on these marginal and steep terrain, which may accelerate runoff, reduce ground
water replenishment and increase land degradation.
Wetlands such as the Crooked Tree lagoons, the swamp floodplains of the New River, other wetlands
of the main river basins and coastal lagoon systems, are natural reservoirs that hold excess floodwaters
during the rainy season, and gradually release the water during dry periods. These wetlands should be
preserved and agriculture expansion into these sensitive areas should be discouraged. Many of
Belize’s protected areas and Forest Reserves are recharge areas for groundwater. They also attenuate
surface runoff during storm events. De-reservation of sections of these sensitive Forest Reserves for
agriculture expansion is unsustainable and should also be discouraged.
1.3 Agriculture Systems and Crops
Approximately, 800,000 hectares or about 38% of Belize’s total land area is considered potentially
suitable for agriculture, but only 9.7% (about 78,000 hectares) is used for crop and livestock
production. About half of this area is under pasture, with the remainder in a variety of permanent and
annual crops. The traditional export commodities sugarcane, citrus and bananas, along with the more
recently developed aquaculture industry are the most significant for foreign exchange earnings. These
commodities are produced in specific zones, and benefit from an organized marketing, and to some
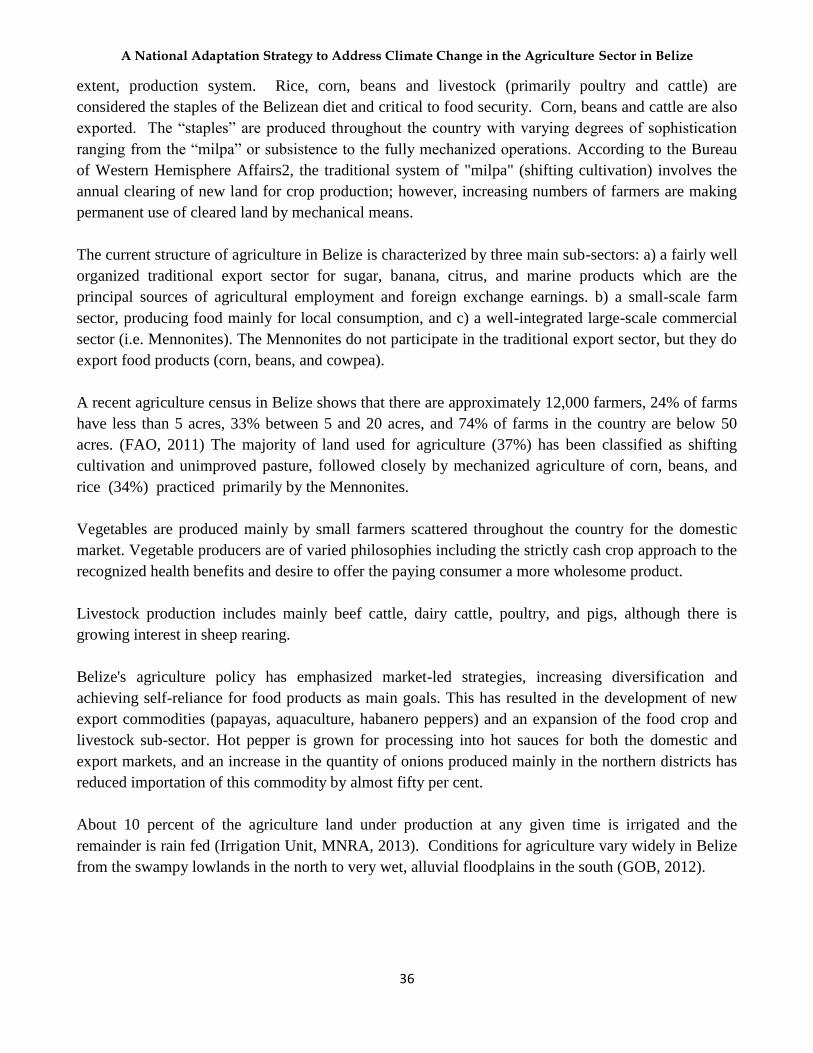
A National Adaptation Strategy to Address Climate Change in the Agriculture Sector in Belize
36
extent, production system. Rice, corn, beans and livestock (primarily poultry and cattle) are
considered the staples of the Belizean diet and critical to food security. Corn, beans and cattle are also
exported. The “staples” are produced throughout the country with varying degrees of sophistication
ranging from the “milpa” or subsistence to the fully mechanized operations. According to the Bureau
of Western Hemisphere Affairs2, the traditional system of "milpa" (shifting cultivation) involves the
annual clearing of new land for crop production; however, increasing numbers of farmers are making
permanent use of cleared land by mechanical means.
The current structure of agriculture in Belize is characterized by three main sub-sectors: a) a fairly well
organized traditional export sector for sugar, banana, citrus, and marine products which are the
principal sources of agricultural employment and foreign exchange earnings. b) a small-scale farm
sector, producing food mainly for local consumption, and c) a well-integrated large-scale commercial
sector (i.e. Mennonites). The Mennonites do not participate in the traditional export sector, but they do
export food products (corn, beans, and cowpea).
A recent agriculture census in Belize shows that there are approximately 12,000 farmers, 24% of farms
have less than 5 acres, 33% between 5 and 20 acres, and 74% of farms in the country are below 50
acres. (FAO, 2011) The majority of land used for agriculture (37%) has been classified as shifting
cultivation and unimproved pasture, followed closely by mechanized agriculture of corn, beans, and
rice (34%) practiced primarily by the Mennonites.
Vegetables are produced mainly by small farmers scattered throughout the country for the domestic
market. Vegetable producers are of varied philosophies including the strictly cash crop approach to the
recognized health benefits and desire to offer the paying consumer a more wholesome product.
Livestock production includes mainly beef cattle, dairy cattle, poultry, and pigs, although there is
growing interest in sheep rearing.
Belize's agriculture policy has emphasized market-led strategies, increasing diversification and
achieving self-reliance for food products as main goals. This has resulted in the development of new
export commodities (papayas, aquaculture, habanero peppers) and an expansion of the food crop and
livestock sub-sector. Hot pepper is grown for processing into hot sauces for both the domestic and
export markets, and an increase in the quantity of onions produced mainly in the northern districts has
reduced importation of this commodity by almost fifty per cent.
About 10 percent of the agriculture land under production at any given time is irrigated and the
remainder is rain fed (Irrigation Unit, MNRA, 2013). Conditions for agriculture vary widely in Belize
from the swampy lowlands in the north to very wet, alluvial floodplains in the south (GOB, 2012).

A National Adaptation Strategy to Address Climate Change in the Agriculture Sector in Belize
37
Table 1 (g): Characteristics of Crop Production in Belize
Crops Production System Districts Topography Type of Soil Main Pests
1 - Sugarcane Semi – mechanized Corozal Orange Walk
Flat Dark limestone
Froghoppers
2 - Citrus Semi-mechanized Stann Creek Cayo
Flat valley, rolling, slope
Red clay Citrus greening
3 - Banana Semi-mechanized Southern Stann Creek
Flat, rolling Red clay Black Sigatoka
4 - Corn Mechanized Milpa
Cayo, Orange Walk, Corozal, Toledo
Flat, rolling Light clay Armyworm
5 - Rice Upland mechanized Irrigated-mechanized Milpa
Orange Walk, Cayo, Toledo
Flat, rolling and Hilly
Light clay Rice blast Spinki mite
6 - R.K. Beans Semi-mechanized Cayo, Orange Walk, Corozal
Flat Light clay Web blight
7 - Vegetables Semi-mechanized non-irrigated Irrigated
Corozal, Orange Walk, Cayo, Belize
Flat Alluvial and light clay
Fungi & insects
(Source: Trujillo, M., MNRA Central Farm, 2014)
1.3.1 Sugarcane
Sugar cane is cultivated in the Orange Walk and Corozal Districts in northern Belize, mainly in the low
lands and flood plains of the New River and the Rio Hondo and its tributaries. The region is prone to
floods particularly in the middle and upper reaches of the Rio Hondo. Total acreage under cultivation
is about 60,000 acres. The annual production of sugarcane biomass is a little over 1 million tonnes with
a conversion rate to sugar of about 9:1.
Figure 1 (g): Sugar production (2000 to 2013)
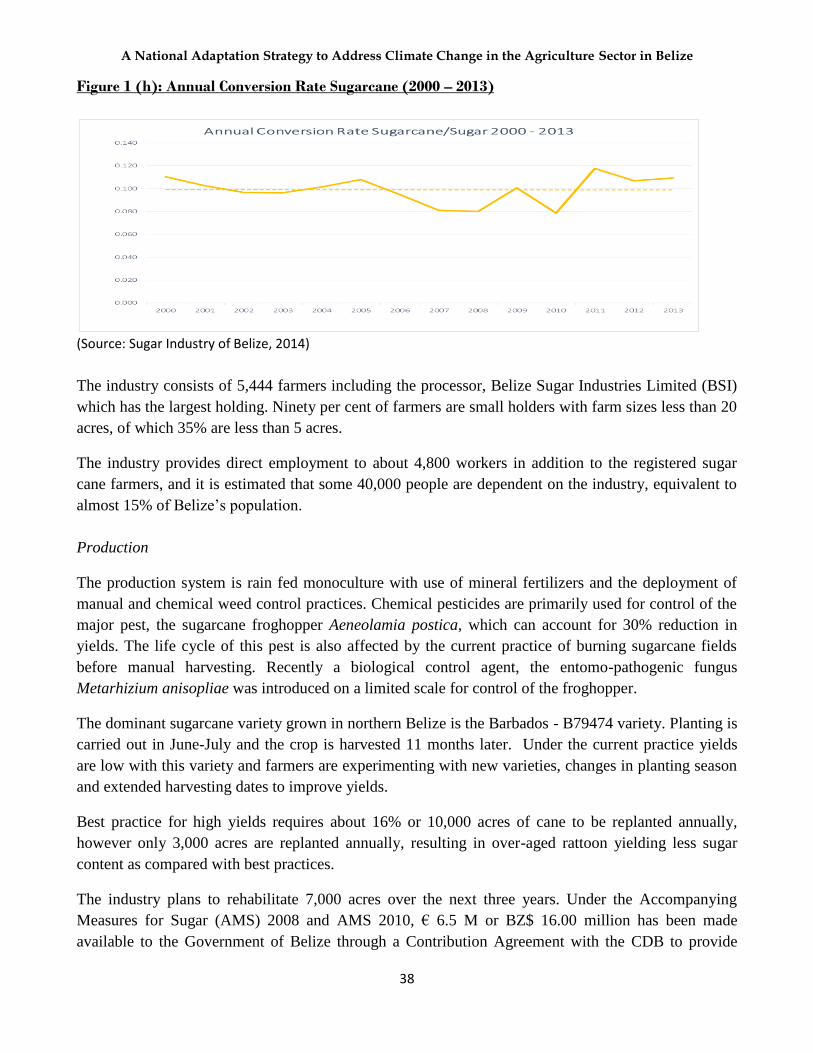
A National Adaptation Strategy to Address Climate Change in the Agriculture Sector in Belize
38
Figure 1 (h): Annual Conversion Rate Sugarcane (2000 – 2013)
(Source: Sugar Industry of Belize, 2014)
The industry consists of 5,444 farmers including the processor, Belize Sugar Industries Limited (BSI)
which has the largest holding. Ninety per cent of farmers are small holders with farm sizes less than 20
acres, of which 35% are less than 5 acres.
The industry provides direct employment to about 4,800 workers in addition to the registered sugar
cane farmers, and it is estimated that some 40,000 people are dependent on the industry, equivalent to
almost 15% of Belize’s population.
Production
The production system is rain fed monoculture with use of mineral fertilizers and the deployment of
manual and chemical weed control practices. Chemical pesticides are primarily used for control of the
major pest, the sugarcane froghopper Aeneolamia postica, which can account for 30% reduction in
yields. The life cycle of this pest is also affected by the current practice of burning sugarcane fields
before manual harvesting. Recently a biological control agent, the entomo-pathogenic fungus
Metarhizium anisopliae was introduced on a limited scale for control of the froghopper.
The dominant sugarcane variety grown in northern Belize is the Barbados - B79474 variety. Planting is
carried out in June-July and the crop is harvested 11 months later. Under the current practice yields
are low with this variety and farmers are experimenting with new varieties, changes in planting season
and extended harvesting dates to improve yields.
Best practice for high yields requires about 16% or 10,000 acres of cane to be replanted annually,
however only 3,000 acres are replanted annually, resulting in over-aged rattoon yielding less sugar
content as compared with best practices.
The industry plans to rehabilitate 7,000 acres over the next three years. Under the Accompanying
Measures for Sugar (AMS) 2008 and AMS 2010, € 6.5 M or BZ$ 16.00 million has been made
available to the Government of Belize through a Contribution Agreement with the CDB to provide

A National Adaptation Strategy to Address Climate Change in the Agriculture Sector in Belize
39
loans to sugar cane farmers. The program is managed by the Development Finance Corporation for
replanting and rehabilitation of approximately 2,600 acres annually. The Sugar Industry Research and
Development Institute (SIRDI) is a co-facilitator of the replanting programme by undertaking the
technical evaluation of each financing proposal and advising on best practices for efficient sugar cane
production.
Structure of the Sugar Industry
The sugar industry is privately owned but is regulated by the Government of Belize through the Sugar
Industry Control Board (SICB) under the provisions of the Sugar Industry Act, Chapter 325 of the
Laws of Belize, Revised Edition, 2003. The sector is complex with a heavy institutional, organisational
and operational structure. Farmers are organised within the Belize Sugar Cane Farmers Association
(BSCFA), which, amongst others responsibilities, negotiates the price of sugar cane delivered to the
manufacturer, makes loans to growers, deals with agricultural inputs, and provides agricultural
services.
The SICB executes its regulatory functions through the Sugar Cane Production Committee (SCPC),
Sugar Cane Quality Control Authority (SCQCA), and the Sugar Industry Research and Development
Institute. The SCPC is responsible for the coordination of the harvesting and delivery of sugarcane to
BSI’s Tower Hill Factory.
Marketing
All sugar cane produced is sold to the privately owned sugar processing plant of the Belize Sugar
Industries Limited (BSI), located in Orange Walk District. It is a subsidiary of American Sugar
Refining. The bulk of raw sugar produced is exported to the EU under the current EU-ACP Economic
Partnership Agreement (EPA). Under the EU quota a portion of the sugar exports is paid a Fair Trade
premium. Earnings from Fair Trade are designated for actions to improve farmers’ production systems
and community well-being. In 2011, 67,000 tonnes were exported to the EU, 16,500 tonnes to the US
market and approximately 15,000 tonnes of sugar were sold on the local market. In 2013, out of a total
production of 118,140 tonnes, 94,541 tonnes were exported to the EU as White Sugar Equivalent and
13,065 tonnes were sold on the local market.
Niche Marketing
In 2013 9,353 tons went to a niche market in Europe as Direct Consumption (DC) sugars at a premium
price of €565.00 or BZ$1,249.94 per metric ton. This price consists of a basic price of €335.20 per
metric ton plus an additional premium of €229.80 (Personal communication, BSI, 2014)
Prices on the EU market are expected to drop substantially in 2017 with the demise of the sugar quota,
and the industry will have to step up its productivity to be able to survive the increased competition
from beet sugar production.
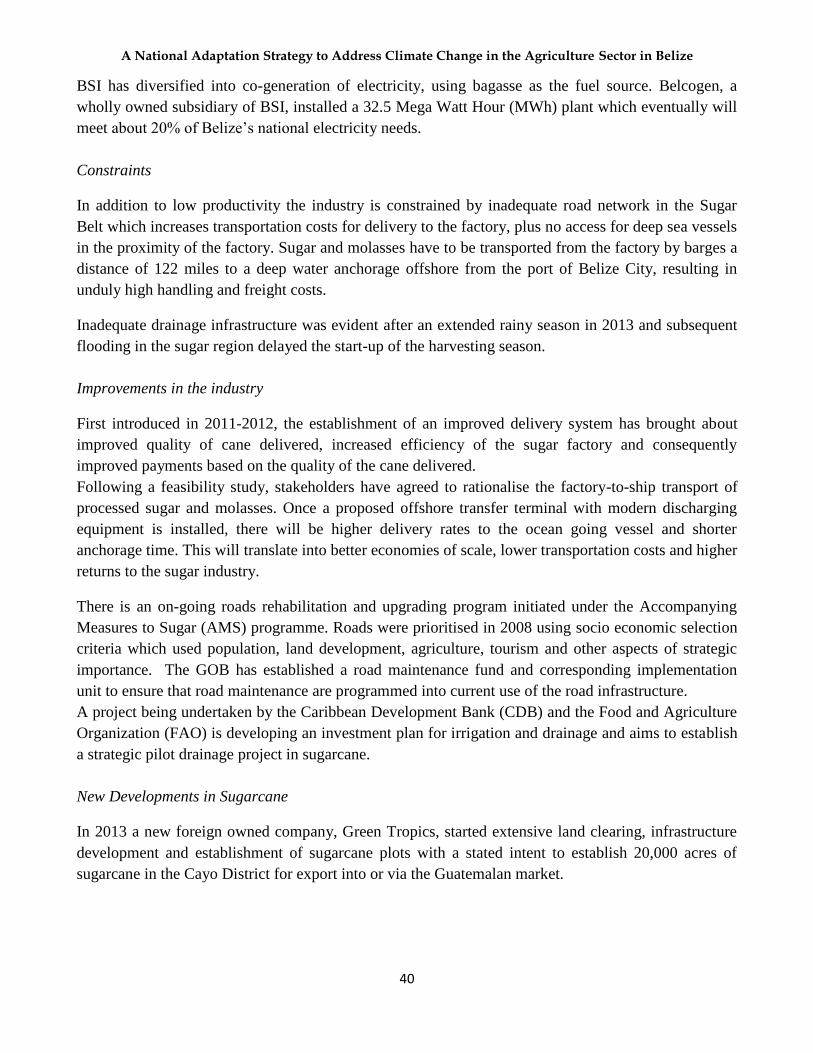
A National Adaptation Strategy to Address Climate Change in the Agriculture Sector in Belize
40
BSI has diversified into co-generation of electricity, using bagasse as the fuel source. Belcogen, a
wholly owned subsidiary of BSI, installed a 32.5 Mega Watt Hour (MWh) plant which eventually will
meet about 20% of Belize’s national electricity needs.
Constraints
In addition to low productivity the industry is constrained by inadequate road network in the Sugar
Belt which increases transportation costs for delivery to the factory, plus no access for deep sea vessels
in the proximity of the factory. Sugar and molasses have to be transported from the factory by barges a
distance of 122 miles to a deep water anchorage offshore from the port of Belize City, resulting in
unduly high handling and freight costs.
Inadequate drainage infrastructure was evident after an extended rainy season in 2013 and subsequent
flooding in the sugar region delayed the start-up of the harvesting season.
Improvements in the industry
First introduced in 2011-2012, the establishment of an improved delivery system has brought about
improved quality of cane delivered, increased efficiency of the sugar factory and consequently
improved payments based on the quality of the cane delivered.
Following a feasibility study, stakeholders have agreed to rationalise the factory-to-ship transport of
processed sugar and molasses. Once a proposed offshore transfer terminal with modern discharging
equipment is installed, there will be higher delivery rates to the ocean going vessel and shorter
anchorage time. This will translate into better economies of scale, lower transportation costs and higher
returns to the sugar industry.
There is an on-going roads rehabilitation and upgrading program initiated under the Accompanying
Measures to Sugar (AMS) programme. Roads were prioritised in 2008 using socio economic selection
criteria which used population, land development, agriculture, tourism and other aspects of strategic
importance. The GOB has established a road maintenance fund and corresponding implementation
unit to ensure that road maintenance are programmed into current use of the road infrastructure.
A project being undertaken by the Caribbean Development Bank (CDB) and the Food and Agriculture
Organization (FAO) is developing an investment plan for irrigation and drainage and aims to establish
a strategic pilot drainage project in sugarcane.
New Developments in Sugarcane
In 2013 a new foreign owned company, Green Tropics, started extensive land clearing, infrastructure
development and establishment of sugarcane plots with a stated intent to establish 20,000 acres of
sugarcane in the Cayo District for export into or via the Guatemalan market.
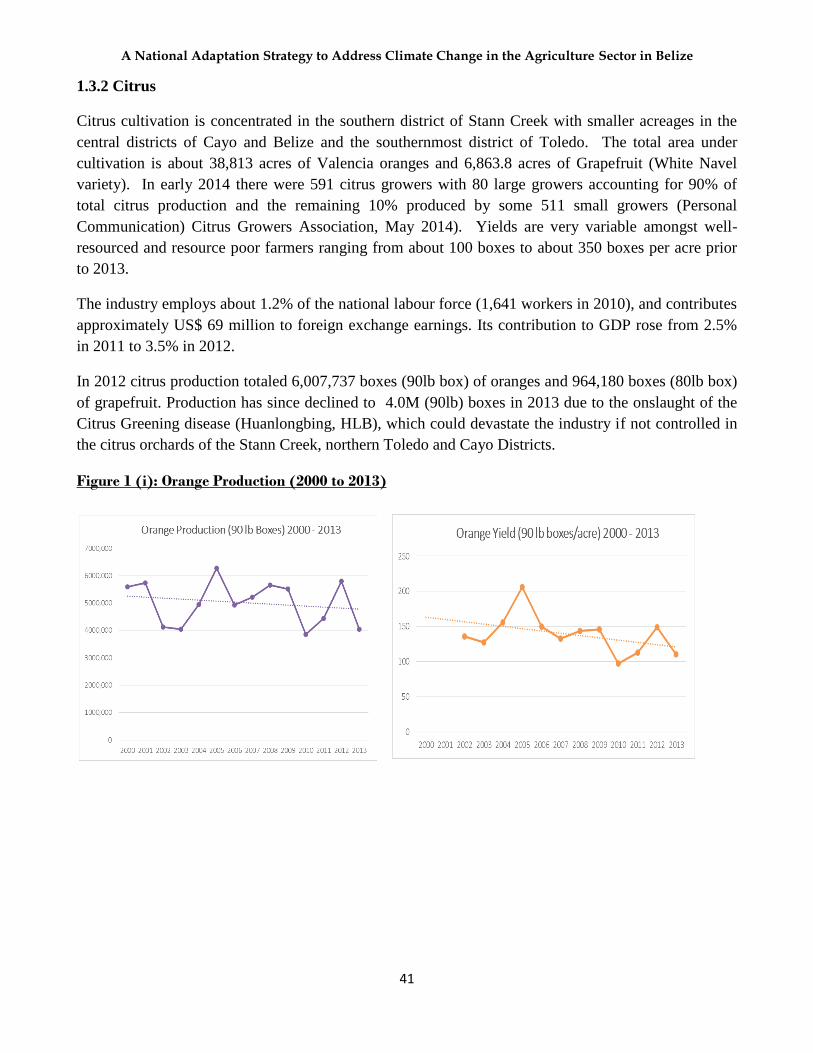
A National Adaptation Strategy to Address Climate Change in the Agriculture Sector in Belize
41
1.3.2 Citrus
Citrus cultivation is concentrated in the southern district of Stann Creek with smaller acreages in the
central districts of Cayo and Belize and the southernmost district of Toledo. The total area under
cultivation is about 38,813 acres of Valencia oranges and 6,863.8 acres of Grapefruit (White Navel
variety). In early 2014 there were 591 citrus growers with 80 large growers accounting for 90% of
total citrus production and the remaining 10% produced by some 511 small growers (Personal
Communication) Citrus Growers Association, May 2014). Yields are very variable amongst well-
resourced and resource poor farmers ranging from about 100 boxes to about 350 boxes per acre prior
to 2013.
The industry employs about 1.2% of the national labour force (1,641 workers in 2010), and contributes
approximately US$ 69 million to foreign exchange earnings. Its contribution to GDP rose from 2.5%
in 2011 to 3.5% in 2012.
In 2012 citrus production totaled 6,007,737 boxes (90lb box) of oranges and 964,180 boxes (80lb box)
of grapefruit. Production has since declined to 4.0M (90lb) boxes in 2013 due to the onslaught of the
Citrus Greening disease (Huanlongbing, HLB), which could devastate the industry if not controlled in
the citrus orchards of the Stann Creek, northern Toledo and Cayo Districts.
Figure 1 (i): Orange Production (2000 to 2013)
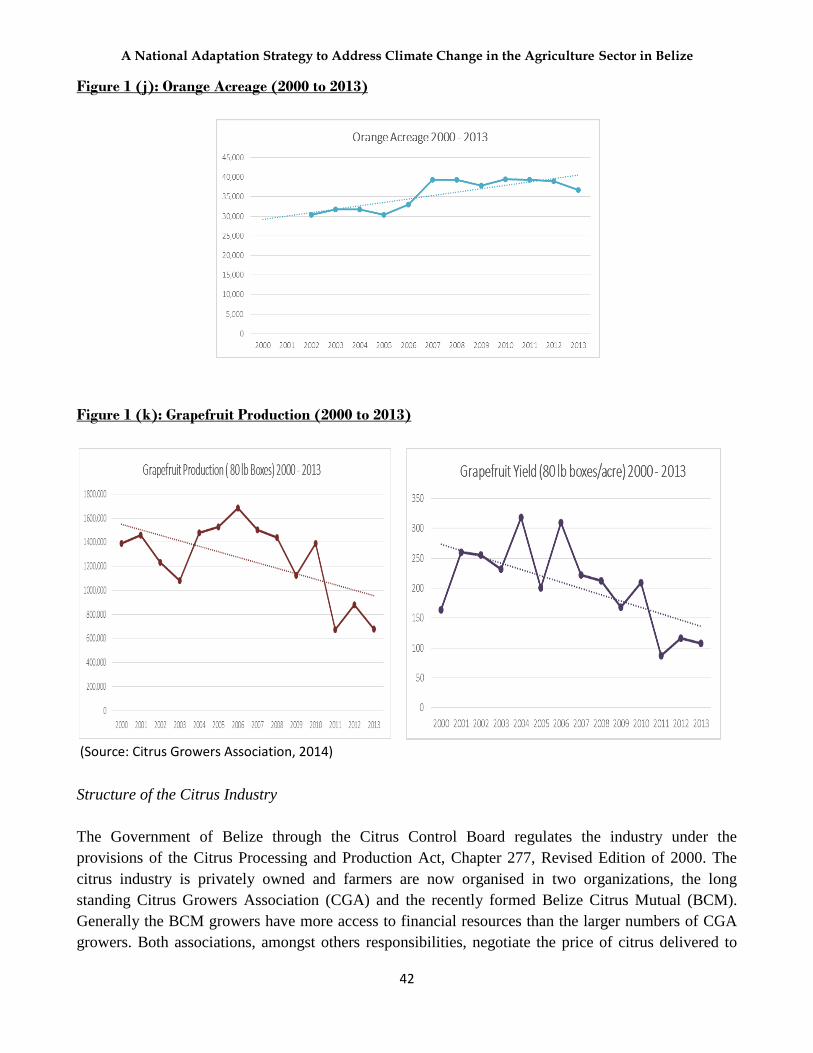
A National Adaptation Strategy to Address Climate Change in the Agriculture Sector in Belize
42
Figure 1 (j): Orange Acreage (2000 to 2013)
Figure 1 (k): Grapefruit Production (2000 to 2013)
(Source: Citrus Growers Association, 2014)
Structure of the Citrus Industry
The Government of Belize through the Citrus Control Board regulates the industry under the
provisions of the Citrus Processing and Production Act, Chapter 277, Revised Edition of 2000. The
citrus industry is privately owned and farmers are now organised in two organizations, the long
standing Citrus Growers Association (CGA) and the recently formed Belize Citrus Mutual (BCM).
Generally the BCM growers have more access to financial resources than the larger numbers of CGA
growers. Both associations, amongst others responsibilities, negotiate the price of citrus delivered to

A National Adaptation Strategy to Address Climate Change in the Agriculture Sector in Belize
43
the processor, facilitate loans to growers, deal with agricultural inputs, and provide agricultural
services. The CGA runs a research and extension program through its technical support arm Citrus
Research and Education Institute (CREI).
Figure 1 (l): Grapefruit Acreage (2000 to 2014)
(Source: Citrus Growers Association, 2014)
Production and farming practices: Citrus is produced under a rain fed monoculture system that
includes extensive use of mineral fertilizers, and the application of dolomitic lime to adjust the
extremely low pH soils characteristic of the southern districts. Weeds are controlled by a combination
of mechanical, manual and chemical methods and chemical pesticides form part of an integrated pest
management system to control other pests and diseases. Citrus production has been plagued by a
number of introduced pests and diseases in recent years including the Brown Citrus Aphid, vector of
citrus Tristeza virus, exocortis, and leprosis and now the Asian Citrus Psyllid, vector of HLB. Previous
to the introduction of HLB the industry has been able to handle the various phyto-sanitary crises due to
the vigilance of CREI in monitoring the pest and disease status of the industry and development of
remedial measures.
Marketing
Citrus growers provide Citrus Products of Belize Limited, the main processor, with citrus fruits,
mainly oranges and grapefruits.
Belize exports most of its citrus products (frozen concentrate) to the United States of America. Other
export markets are Japan, Latin America, the Caribbean and the European Union. Total frozen
concentrate exports 2008 to 2013 are indicated in the figure below.

A National Adaptation Strategy to Address Climate Change in the Agriculture Sector in Belize
44
Figure 1 (m): Citrus Exports
Source: Ministry of Agriculture and Natural Resources, 2014
Constraints
The major challenge to maintain or increase the level of citrus production is the effective management
of the HLB (Citrus Greening) disease through the production of high quality disease-free citrus plants
for the rehabilitation of citrus orchards and the planting of new orchards, along with a controlled spray
programme to control the insect vector. CGA has limited financial resources partly due to the division
in the industry with the formation of the new organization BCM.
1.3.3 Banana
The Banana Industry is fully private sector led and highly commercialized. Foreign exchange earnings
rose from US$17.5 million in 1990 to US$45.5 million in 2013 (personal communication General
Manager BGA, 2014). It is characterized by a small number of relatively large plantations, all located
in the southern districts of Stann Creek and Toledo. At present nine (9) growers/management
companies own 23 farms with a total acreage of approximately 7,250 acres and are organised into a
single growers association, the Banana Growers Association (BGA).
The industry has benefited substantially from technical assistance, infrastructural, equipment and
operational inputs provided under the EU-ACP Special Framework of Assistance for Banana Protocol
Countries from 1999 to 2008. The industry will receive further support under the new EU arrangement,
the Banana Accompanying Measures (BAMS) which commenced in late 2013.

A National Adaptation Strategy to Address Climate Change in the Agriculture Sector in Belize
45
Production and farming practices
Bananas are grown in a perennial monoculture system. Farms are generally equipped with sprinkle
irrigation systems and an extensive network of primary, secondary and tertiary drainage infrastructure
since the plants consume a large amount of water but are also very sensitive to water logging.
Production practices include extensive use of mineral fertilizers and chemical pesticides for controlling
the major pest and disease, the banana nematode R. similis and Black Sigatoka disease. The use of
disease-free meristem plants are recommended for replanting in new or fallowed land on a ten year
rotation basis as best practice for nematode control and attainment of maximum yields. Black Sigatoka
is managed on an industry wide basis by controlled aerial spray programmes carried out by the BGA’s
specialized Sigatoka control unit.
Key cultural practices such as weed control, population control, fruit protection, pest and disease
control, fertilizers and nematicide application, drainage maintenance and harvesting are labour
intensive. In 2010, 2,688 workers, about 2% of the national labour force, were directly employed by
the industry.
Banana production ranged from approximately 3.6M boxes (40 lb) in 2000 to 5.4M boxes in 2013.
During this period the highest production was 5.7M boxes in 2012. Banana is harvested on a weekly
basis, but the bulk of the banana production is done in the last quarter of the year (personal comm.,
Banana Growers Association, 2014). The varieties produced are mostly the Grande Naine with smaller
amounts of Williams, both of the Cavendish sub group. Yields range from a low of 380 boxes per acre
in 2002 to a high of 820 boxes per acre in 2012.
Structure of the Banana Industry
Under the Banana Industry Act, Chapter 205, Revised Edition of 2003, the BGA has responsibility for
(1) coordinating the production and the sale of bananas, (2) Ensuring marketing and accounts
management with buyer, (3) Implementing disease control (Sigatoka), (4) Recommending quality
production standards and giving agronomic advice to the farmers. It also distributes small inputs
related to post harvesting and packing. At present no one can export banana except the Banana
Growers Association. BGA buys the banana from the growers, sells it to the multinational marketing
company, and subsequently pays the growers, deducting a fee for its services.
Marketing
The United Kingdom is currently the only export market for Belize. Bananas are marketed under the
duty free quota free Economic Partnership Agreement (EPA) with the European Union. In the UK
market, Belize banana has a good quality reputation and competes well with banana from Latin
America. Fyffes has been the principal marketer of Belize banana throughout the various trade regimes
and the sustainability of the industry will depend to a large extent on its competitiveness vis-à-vis Latin
American countries and on its ability to negotiate arrangements with new buyers.

A National Adaptation Strategy to Address Climate Change in the Agriculture Sector in Belize
46
Niche market
About 60% of all the bananas go to non-standard packaging (special packaging prepared on the request
of certain supermarkets). As this is difficult to do in other banana-producing countries, it gives Belize a
competitive advantage. Usually limited quantities are required and preparation is time consuming
(training of personnel and sometimes different materials used). However while for big plantations
complying with this requirement is too costly, a small industry like Belize can more easily adapt.
Constraints
Financial management of co- existing enterprises and the need to prioritise investments have pushed
some farmers to try and "cut corners" by introducing only some of the components of the optimal
agronomic practices.
Inefficiencies in the production still affect significant improvement of yields. Key constraints to yield
improvements include insufficient application of good agronomic practices, unscientific and
inadequate pest management and need to upgrade old equipment. Deteriorated on-farm infrastructure
such as over aged cableways and irrigation systems as well as insufficient capacity of packing facilities
is not only increasing production costs but in some instances may already pose a danger for the
workers. 25% of production costs is for the acquisition of expensive mineral fertilizers and 16% is
incurred for pest and disease control. The recent considerable reduction in the duties paid by the non-
ACP banana producers has made competition fiercer and margin of profit smaller for Belize exporters,
which could delay indefinitely any serious capital investment by the farmers.
Current Actions and Future Plans
Increase the efficiency of banana production by developing best agricultural practices, while
decreasing the environmental impact of the industry, to include composting, recycling, improved
management of waste and water management.
Strengthening disease/pest management, which will result in a more resilient and environmentally
sensitive industry by adopting an improved scientific approach to disease monitoring (including
spore trapping) and control as well as to improve the efficiency of oversight and management of field
operations.
1.3.4 Rice
Rice is produced mainly in the Orange Walk, Cayo and Toledo Districts. There are three production
systems of rice in Belize, the mechanized irrigated, the mechanized rain-fed and the milpa system.
Different varieties of rice are planted under the different production systems.
The mechanized irrigated and mechanized rain-fed systems are practiced in the Orange Walk District
with acreages of 1,850 and 1,550 acres respectively.

A National Adaptation Strategy to Address Climate Change in the Agriculture Sector in Belize
47
Cayo and Toledo District farmers practice the mechanized rain-fed and the milpa systems of
production. In 2012 the Cayo District cultivated 2,600 acres of mechanized rain-fed and 47 acres of
milpa rice. The Toledo District cultivated 450 acres of mechanized rain-fed and 163 acres of milpa
rice. In the past (ex. in 2000) the Toledo District was the leading rice producer, mostly by milpa
system with 3,500 acres under production. In milpa rice production the crop is planted in late May and
harvested in early September and October. All the operations from planting to harvesting are done
manually and farmers do not normally use any chemicals.
Socio-economic importance
Rice is one of the main staples of the Belizean diet. It is estimated that some 16 million pounds of
milled rice are consumed annually and domestic production is critical for Belize’s food security.
Although some rice is retained for subsistence use it is produced mainly as a commercial or cash crop,
even by milpa farmers, since corn is more the dietary staple grain of the rural communities.
The most significant socioeconomic impact of rice production is in the southern district of Toledo
where there are a total of 1,000 rice farmers out of which 120 milpa farmers are dependent on rice
production for the major part of their meagre income. Earnings from the sub-sector are spread over a
larger number of households in an area that has the highest rate of poverty in the country. Conversely,
the bulk of Belize’s rice production is done by 10 farmers in the Orange Walk District on large
holdings with very sophisticated technology.
Figure 1 (n): Total Rice Production 2000- 2012
Source: Ministry of Agriculture and Natural Resources, 2014

A National Adaptation Strategy to Address Climate Change in the Agriculture Sector in Belize
48
Production
Total average annual rice production for the last 10 years has been 35 million pounds of paddy. Most
recent available numbers (2012) show that 390,000 pounds were from milpa with an average yield of
1,779 pounds per acre. Toledo had the highest milpa rice production at just over 327,000 pounds and
yields of 2,008 pounds per acre. The most efficient system for rice production is the mechanized
irrigated system which yields up to 5,900 lbs. /acre. Rice is affected by a major pest, the Spinki mite,
and blast (a fungal disease) that can cause yield losses of up to 20%.
Structure of the Rice Industry
The industry is comprised of a mixture of milpa, small and large mechanized farmers. The milpa and
small mechanized farmers in Toledo are organized into the Toledo Grain Growers Association. The
Association claims a membership of 1,000 members that farm exclusively in the Toledo District. The
10 large producers in the north are organized into the Belize Grain Growers Association, and produce
90% of the total rice output. The Government of Belize provides policy, regulatory and marketing
input through the Ministry of Agriculture, BAHA, Pesticides Control Board (PCB) and the Belize
Marketing and Development Corporation (BMDC).
Marketing
Rice production is primarily for the local market. Belizeans consume approximately 16.2 million
pounds of milled rice annually which translates to approximately 25 million pounds of rice paddy. The
BMDC is the major purchaser of rice paddy from the Toledo Grain Growers Association and the
market stabiliser. The larger growers have separate milling operations and market independently under
their own brand. This group is always seeking an export market and some of the surplus is being sold
to Guatemala and CARICOM.
A niche market for pre-packaged long grain and brown rice has developed in Belize in recent years.
This market is still very small but is growing in response to the health food trend that has developed in
Belize.
Through the BMDC the GOB has supported rice farmers in the Toledo District with subsidized prices,
mainly because of the traditional socio-economic importance of milpa rice production in that
impoverished district. The subsidies are, however, also paid to the small mechanized farmers in the
district and are considered unsustainable. The farmers practising the mechanized rain-fed system in the
Toledo District are the most inefficient rice producers in the country and the government needs to
make a policy decision with respect to the subsidies especially for the mechanized producers.
1.3.5 Corn
Corn is produced in all six districts of Belize under two production systems: mechanized rain -fed and
milpa. From 2000 to 2012 the acreage under milpa production decreased from about 10,000 acres to
about 4,000 acres, whereas mechanized production increased from 24,969 to 29,021 acres.

A National Adaptation Strategy to Address Climate Change in the Agriculture Sector in Belize
49
The Toledo District practices only the milpa system and size of farms range from half acre to 150
acres. The bigger farms are located near to the Belize Guatemala border.
There are approximately 3,000 small farmers located in the southern districts of Toledo and Stann
Creek, and 350 large farmers located in the Cayo, Orange Walk and Corozal Districts.
Socio-economic importance
Corn is an important part of Belize’s economy because it is used for direct human consumption, as
livestock and poultry feed, and as an export commodity. Corn is the most important staple of the
Belizean diet and a key commodity from a food security standpoint. It is estimated that the average
Belizean household consumes an average of 1 lb of corn daily, and that approximately 100 million
pounds are used domestically for both human and livestock consumption on an annual basis.
The primary socioeconomic importance of corn is as (i) a food staple for a majority of Belizean
households. (ii) as currency for a large portion of small farmers, and (iii) a culturally important
component of the diet for several ethnic groups particularly Mestizo and Maya. At the subsistence
level, milpa production of corn is important in contributing to the daily diet as well as providing a form
of quick currency for rural communities.
Production
Corn is mostly planted in June and harvested in October, with a second season from November to
February. The main insect pests are the fall armyworm (Spodoptora frugiperda) and the corn earworm
(Helicoverpa zea). High yielding hybrid varieties are planted under the mechanized system and insect
pests are controlled with chemical insecticides. Milpa producers plant mainly “local” varieties of corn
which have some natural resistance to the major pests, and consequently, pesticide use is minimal.
Annual corn production increased from 69 M lbs. in 2000 to 125 M lbs. in 2012. Of the 2012
production statistics, 14 M lbs. of white and yellow corn were produced by the milpa system with an
average yield of 1,388 pounds per acre.

A National Adaptation Strategy to Address Climate Change in the Agriculture Sector in Belize
50
Figure 1 (o): Total Mechanized and Milpa Corn Production (2000 to 2012)
Source: Ministry of Agriculture and Natural Resources, 2014
Structure of the Corn Industry
The sub-sector is a mixture of milpa (subsistence), small and large mechanized farmers. The milpa
farmers are concentrated in four districts (Belize, Cayo, Stann Creek and Toledo) and are generally not
organized except in Toledo. In Toledo, a minority of the corn farmers form part of the Toledo Grain
Growers Association, which is primarily organized for rice producers.
Large farmers in the Cayo and northern districts are organized into the Belize Grain Growers
Association. The association has a membership of 350 farmers that produce about 90% of the
combined total of yellow and white corn. These growers have adequate access to technical and
financial resources which are made available primarily through the associations. The association is
responsible for negotiating on behalf of producers with the Government on policy and regulatory
matters and with existing and potential purchasers, primarily foreign markets.
Marketing
Farmers in the Toledo District are poorly organized and they operate and market individually. These
farmers have limited negotiating capacity. They generally receive inputs provided through middle men
primarily in Guatemala and the product is eventually sold to these same middle men at inferior prices.
The Belize Grain Growers Association and other farmers in the region mainly sell their product to Bel-
Car Export and Import Company Limited, a private company which purchases corn, beans and
cowpeas from local suppliers and exports to the Caribbean and other parts of the world. In the western

A National Adaptation Strategy to Address Climate Change in the Agriculture Sector in Belize
51
and northern regions of the country whole corn and processed corn as mill feed is marketed, locally.
Crushed corn for cornmeal is marketed exclusively to CARICOM countries primarily Guyana and
Jamaica. Annual exports of cornmeal to Guyana and Jamaica are in the order of 780,000 lbs with 80%
going to Jamaica. Twelve million pounds of grain corn are exported to Guatemala annually.
1.3.6 Beans
Beans of the Phaseolus vulgaris species which include Red Kidney (RK) beans, small red beans and
black beans are generally produced as part of a corn-beans rotation system. The structure, composition,
marketing arrangements and production systems of the beans sub-sector is therefore similar to that of
corn, except that beans are harvested manually even in the large farm mechanized system. Beans is
planted from November and December and harvested in February and March.
Mechanized farms generally produce a variety of R.K beans (usually California Light Red), with yields
of about 800 lbs/acre. The sizes of mechanized farms range from 20 to 1,000 acres.
Milpa farmers produce various varieties of black beans or small red beans, which are more suitable to
Belize’s agro-climatic conditions than RK beans, and obtain yields up to 1,000 lbs/acre. Milpa farmers
plant retained seeds selected from the previous crop.
The major pests of beans are the Diabrotica beetles, the bean pod weevil (Apion godmani), and a
fungal pathogen (Thanateforus cucumeris) which causes the disease known as web blight, all of which
are controlled with chemical pesticides.
Socio-economic importance
Beans are one of the main staples of the Belizean diet and provide the major protein content of a
primarily corn-beans diet for many poor rural households. It is estimated that some 8 million pounds of
beans are consumed annually. At the subsistence level bean production is important in reducing
household spending.
Bean production fluctuates mainly due to weather conditions and export market opportunities. In 2013
production fell due to adverse weather conditions (higher than normal rainfall), and the price of beans
rose to a peak of BZ $3.50/lb on the local market. Total beans production ranged from about 13Mlbs
in 2000 to about 20Mlbs in 2012 from respective acreages of 15,800 and 20,713 acres.
It is estimated that about 3Mlbs of beans are exported annually to neighbouring Guatemala at a price of
around BZ $0.72/lb wholesale and varied quantities of RK beans are exported to the CARICOM
market, primarily Jamaica at BZ$0.92 – 0.98/lb.
1.3.7 Vegetables
Vegetable production is done in all six districts of Belize, but mostly in the Corozal, Orange Walk,
Cayo and Belize Districts. The main production systems practiced in the country are milpa or semi-
mechanized small open plots and covered structures. Size of open plots ranges from 1/8 acre to about
five acres. Covered structures are about 3,000 to 4,000 sq. ft. The main vegetable crops grown are

A National Adaptation Strategy to Address Climate Change in the Agriculture Sector in Belize
52
cabbage, cucumber, hot pepper, okra, squash, pumpkin, sweet pepper, tomatoes, Irish potato, onion,
carrots, string beans, lettuce, Chinese cabbage, cauliflower, broccoli, celery, cho-cho and sweet corn.
Some farmers are organized into cooperatives primarily along product lines and community level.
Each cooperative is primarily responsible for marketing the products of its individual members.
Socio-economic importance
Vegetable production is undertaken primarily by small farmers throughout the country.
At the subsistence level vegetable production is important in reducing household spending in the
southern districts whereas they are mainly grown as cash crops in the Cayo, Belize, Orange Walk and
Corozal Districts. Vegetables are not exported but production for the domestic market provides
significant foreign exchange savings whilst contributing to the potential for nutrition security if
widespread access and affordability can be secured for consumers across the nation.
Production
Total vegetable production ranged from about 15.6 Mlbs in 2000 to 14.6Mlbs in 2012 from respective
acreages of 1,170 and 1,061 acres. Some vegetables are irrigated with a sophisticated drip irrigation
system and some smaller plots may be irrigated manually with use of water hoses or buckets.
Figure 1 (p) Total Vegetable Production 2012 Figure 1 (q): Total Vegetable Acreage 2012
(Source: Ministry of Agriculture and Natural Resources, 2014)
Structure of the Vegetable Industry
The industry consists primarily of small operators who may be loosely organized into local
cooperatives and associations at regional and community levels, although many vegetable producers
operate individually. There are no buying centres and products are marketed through cooperatives.
Most cooperatives provide financial assistance to members through bulk purchasing and price
negotiation. All vegetables are marketed locally through farmers markets or retail outlets.
In the Cayo District there are about 105 farmers organized into two main cooperatives, the Valley of
Peace Farmer Group which produces mostly cabbage and other vegetables, and the Mennonite

A National Adaptation Strategy to Address Climate Change in the Agriculture Sector in Belize
53
Communities (Springfield, Upper and Lower Barton Creek and Bird Walk, Santa Marta) which
produces lettuce, carrots, potatoes, broccoli, cauliflower, eggplant and onions. The production system
used in the Cayo District is mostly open field production, although there are a few functioning covered
structures for the production of tomatoes and sweet peppers.
In the Belize District, there are about 48 farmers producing on a total of 62 acres organized into two
main cooperatives, the Maskall Group and the Nagu Bank Group. They produce mainly melons, sweet
peppers, onions, cilantro and tomatoes on plots with average size of 1.5 acres. Both groups produce in
the open field irrigated production system as well as with the use of protective covered structures.
Constraints
Production is constrained by high incidence of pests and diseases, high cost of production, competition
from low-cost subsidized products from across borders, limited up-to-date and cost effective
technology, limited access / usage of weather data and temperature and water requirements which
restrict the seasonality of production for some vegetables. Vegetables are particularly vulnerable to the
effects of climate change since they are generally very sensitive to both waterlogging and drought
conditions, plus several of Belize’s most consumed vegetables have optimum temperature
requirements which are already exceeded, (for example , onion, cabbage and carrots ) or likely to be
exceeded according to temperature forecasts.
1.3.8 Livestock (Cattle)
Cattle production is done in all six districts of Belize, but the highest concentrations are in the Orange
Walk, Cayo, Belize and Stann Creek Districts. The main production system practiced in the country is
free range pasture. Herd size ranges from two heads to a few thousand heads.
Production
Cattle rearing is capital intensive and small scale operations have a low internal rate of return.
However some small operators invest very little and keep cattle only as a quick source of cash for
financial emergencies. The current size of the national herd is estimated at 100,000 animals; of that
number, approximately 75,000 heads are owned by about 1,500 farmers. Some 500 farmers own 5
heads or less. Many farmers use improved pasture and large farmers in particular complement the
cattle feed with a prepared mixture of corn, concentrate and molasses.
The Orange Walk District is the largest producer followed closely by the Cayo District. The third
largest producer is the Belize District followed by Stann Creek, Toledo and lastly Corozal.
Structure of the Livestock Industry
Farmers in the cattle industry are organized into the Belize Livestock Association (BLPA). The board
of directors set up to manage the industry’s affairs is selected by the Ministry of Agriculture and the
Belize Agricultural Health Authority (BAHA) is the regulatory agency. While membership in the
BLPA is obligatory there is no penalty for non-participation. The purpose of BLPA is to lobby on
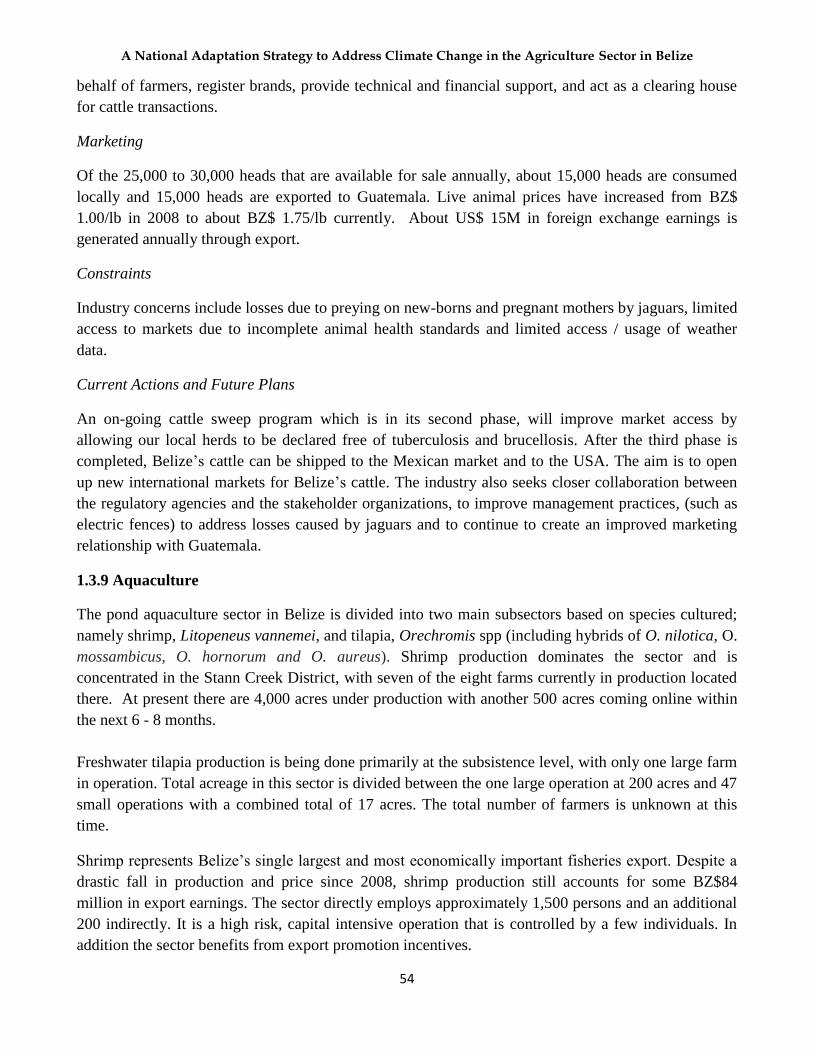
A National Adaptation Strategy to Address Climate Change in the Agriculture Sector in Belize
54
behalf of farmers, register brands, provide technical and financial support, and act as a clearing house
for cattle transactions.
Marketing
Of the 25,000 to 30,000 heads that are available for sale annually, about 15,000 heads are consumed
locally and 15,000 heads are exported to Guatemala. Live animal prices have increased from BZ$
1.00/lb in 2008 to about BZ$ 1.75/lb currently. About US$ 15M in foreign exchange earnings is
generated annually through export.
Constraints
Industry concerns include losses due to preying on new-borns and pregnant mothers by jaguars, limited
access to markets due to incomplete animal health standards and limited access / usage of weather
data.
Current Actions and Future Plans
An on-going cattle sweep program which is in its second phase, will improve market access by
allowing our local herds to be declared free of tuberculosis and brucellosis. After the third phase is
completed, Belize’s cattle can be shipped to the Mexican market and to the USA. The aim is to open
up new international markets for Belize’s cattle. The industry also seeks closer collaboration between
the regulatory agencies and the stakeholder organizations, to improve management practices, (such as
electric fences) to address losses caused by jaguars and to continue to create an improved marketing
relationship with Guatemala.
1.3.9 Aquaculture
The pond aquaculture sector in Belize is divided into two main subsectors based on species cultured;
namely shrimp, Litopeneus vannemei, and tilapia, Orechromis spp (including hybrids of O. nilotica, O.
mossambicus, O. hornorum and O. aureus). Shrimp production dominates the sector and is
concentrated in the Stann Creek District, with seven of the eight farms currently in production located
there. At present there are 4,000 acres under production with another 500 acres coming online within
the next 6 - 8 months.
Freshwater tilapia production is being done primarily at the subsistence level, with only one large farm
in operation. Total acreage in this sector is divided between the one large operation at 200 acres and 47
small operations with a combined total of 17 acres. The total number of farmers is unknown at this
time.
Shrimp represents Belize’s single largest and most economically important fisheries export. Despite a
drastic fall in production and price since 2008, shrimp production still accounts for some BZ$84
million in export earnings. The sector directly employs approximately 1,500 persons and an additional
200 indirectly. It is a high risk, capital intensive operation that is controlled by a few individuals. In
addition the sector benefits from export promotion incentives.
A National Adaptation Strategy to Address Climate Change in the Agriculture Sector in Belize
55
Socio-economic importance
The shrimp aquaculture sector is an important contributor to the economy of the southern districts of
Belize. Toledo and Stann Creek Districts have the first (46.2%) and third (43.7%) highest poverty rates
respectively, both of which are above the national average of 41.6%. These are also the districts with
the smallest populations, 24,226 and 25,543 respectively. As a result, any economic activity is certain
to be reflected in the socioeconomic wellbeing of the two district populations. The 1,500 persons
directly employed are primarily semi-skilled and unskilled workers from southern Stann Creek and
northern Toledo. Skilled positions, particularly administrative and technical, are filled primarily by
foreigners and persons from outside the district. Of significance is the fact that the three processing
facilities employ primarily unskilled single mothers, thus providing very valuable income
contributions.
Production
Three systems are currently utilized for shrimp production in Belize; semi-intensive, intensive and
super-intensive. Farms range in size from 100 – 1,500 acres. In the semi-intensive system ponds are
stocked at 60,000 -100,000 per acre and grown out for 5-6 months. Pond preparation involves culturing
and maintaining a healthy algal bloom that is maintained throughout the grow-out cycle. Feeding is a
combination of natural productivity and prepared feed. Aeration is done when needed to maintain
dissolved oxygen levels above 4 mg/l. Production is approximately 1,500 – 2,000 lbs per acre at a
survival rate of 70% - 80%. In intensive and super-intensive systems stocking is done at 600,000 to
800,000 per acre. Yields at 70% - 80% survival are between 8,000 – 12,000 lbs per acre. At these
stocking densities, feed and aeration are required inputs. With the exception of Biofloc technology that
is used in the super-intensive system, fertilizers and lime (CaO) are the only other agrochemical inputs
that are used in the industry.
At the height of production in 2006 – 2007 when there were 16 farms in operation, total production
reached over 28,000 metric tons. After the recession of 2008 and the fall in shrimp prices, some farms
went out of operation. At present there are eight farms in operation with a total production of just over
6,500 metric tons.
Structure of the Sector
The current legal and institutional framework for aquaculture is a bit convoluted. The sector has
traditionally been under the mandate of the Fisheries Department. However, while the Fisheries
Legislation makes provisions for licensing and certain administrative details, it has no legal control
over the sector. Animal health issues are under the jurisdiction of Belize Health and Agriculture
Authority (BAHA) and Environmental Impact and effluent concerns are addressed through the
Department of the Environment (DoE). The Aquaculture Industry Development Act that was passed in
2007 has still not been brought into force by the Governor General. This particular piece of legislation
is under the Ministry of Trade. There is further fragmentation in that both the Ministry of Agriculture
and the Ministry of Fisheries share responsibility for aquaculture depending on the method being used.

A National Adaptation Strategy to Address Climate Change in the Agriculture Sector in Belize
56
The industry has organized itself into an association primarily for advocacy and protection purposes.
Decisions are made by mutual consent and compliance is voluntary.
Stakeholders
The major stakeholders in the Shrimp Industry are the farmers and the Government of Belize. The
farms are under the direct control of individual or corporate owners. The Government of Belize
through BAHA is responsible for animal health and food safety. Through the DoE, GOB is also
responsible for environmental impacts and effluent control. The Belize Shrimp Growers Association
(BSGA) is a legally registered but not legally mandated body that seeks to organize the industry
around issues of common concern. All research and development is currently done on the individual
farms, sometimes with the explicit consent of the relevant government agency.
Marketing
Approximately ninety percent of the total shrimp production is exported. Over the last five years,
approximately 62% of exports went to Mexico whole and packed in ice, 14% to the Caribbean, 13% to
North America and 10% to Europe. The remaining 1% has been sold primarily to Southeast Asia. The
exports to North America are primarily tails packed in 5 lb. blocks while there is some value added for
the European market.
Niche Marketing
The Mexican market can be considered a niche market for the moment because the shrimp are
harvested, packed in ice and loaded directly unto the trucks at the loading dock on the farm. While the
price is the lowest per pound, there is no processing or value added so costs are kept to a minimum.
Nonetheless, the demand is high and the sales are brisk. Shrimp for the Mexican market normally have
an individual weight of 10-15 g. For the North American and European market individual weight are
between 15- 24 g. The other possible niche market is the Jamaican market that is purchasing 40g
shrimps from one particular farm.
Constraints
The present concerns in the industry stem primarily from what is considered to be insufficient
regulatory oversight. This translates to functions that should be performed by the regulatory agencies
but which are perhaps not being delivered at the level that they should. The primary concerns are pest
and disease control, animal health, water quality and shoreline protection.
Also of concern is the cost of getting regulatory services delivered. The matter of cost recovery for the
services provided by regulatory agencies is one that adds an additional layer to the production costs.
There is insufficient and sometimes ineffective communication of pertinent information and decisions.
This is critical for an industry that is high investment and high risk.
A National Adaptation Strategy to Address Climate Change in the Agriculture Sector in Belize
57
The small number of trained technical professionals in the country makes it difficult to fill skilled
positions at short notice. This usually requires bringing in foreign expertise.
Current Actions and Future Plans
The BSGA has developed a Strategic Plan and Policy document. This document outlines the
association’s objectives for the industry over the next five years. In the meantime the association is
expecting that the government will address the concerns identified as critical to the survival and
adaptability of the sector. The growers are of the opinion that outside of policy, regulatory and capacity
issues that need to be addressed by the Government, the sector will be able to adapt to climate change
through adoption of good practices and management techniques, some of which are already being
used.
1.4 Institutional and Regulatory Framework
1.4.1 Institutional Framework
The MFFSD has been designated as the government agency responsible for the coordination and
implementation of Climate Change policies in Belize. The MFFSD plays a leading role in the National
Climate Change Committee (NCCC) which has wide representation from various sectors and is
responsible for coordinating climate change actions at the local, regional and international level. The
NCCC is organized into sub-groups to address the various aspects of climate change.
The policy and institutional framework pertaining to the agriculture sector will guide the adaptation
strategy in determining decisions to be made and decision makers, the most suitable entities to
implement the various actions, the availability of the necessary human and material resources, what
appropriate measures have already been initiated, complementarity and partnering needs, supportive
proposed and/or adopted policies and systems, jurisdiction, improvement needs, and degree of
difficulty for necessary changes.
1.4.2 Regulatory Framework
1.4.2.1 Ministry of Natural Resources and Agriculture
Agriculture is currently incorporated into the Ministry of Natural Resources and Agriculture, but the
governmental structure has often changed with the incoming of new political administrations. For ease
of reference the agriculture department can be referred to as the Ministry of Agriculture (MoA). The
Mission of the MoA emphasizes food security, income, foreign exchange earnings, and employment
and conserving natural resources in order to grow the economy, reduce poverty and empower the local
population for sustainable development. Headed by a minister and Chief Executive Officer, it includes
the Agriculture Department headed by a Chief Agricultural Officer, and a Policy and Economics unit
headed by a Policy Analyst. It is responsible for setting and implementing agriculture policies and

A National Adaptation Strategy to Address Climate Change in the Agriculture Sector in Belize
58
strategies along with its partners in development and stakeholders. MNRA provides agriculture
extension services mainly to the non-traditional sector, and especially to small/medium commercial
farms, and provides some regulatory function to the sugar and citrus industries through its seat on the
SICB and the Citrus Control Board. Along with the National Authorizing Office (NAO) the ministry
oversees the EU assistance programmes for the banana and sugar sectors (Banana Accompanying
Measures (BAMS) and Accompanying Measures for Sugar (AMS) respectively) and any other EU
funded agricultural projects. It collects annual statistics on crop and livestock production and conducts
crop and livestock related research at Central Farm. Resources are mobilized through an annual GOB
budget, plus projects and programme funding from partners in development. The MNRA includes the
Cooperative Department which is responsible for organizing, training and monitoring the legal actions
of agriculture cooperatives.
1.4.2.2 Belize Agricultural Health Authority
The Belize Agricultural Health Authority (BAHA) is a statutory body established by the Belize
Agricultural Health Authority Act, Chapter 211 of the Laws of Belize, Revised Edition 2000. It is
governed by a Board of Directors and its main purpose is to safeguard agricultural health for the nation
and to facilitate trade and commerce. BAHA has departments responsible for plant health, animal
health, food safety, quarantine and inspection. BAHA upholds sanitary standards for the importation
and export of live plants and animals and any derived product that could pose a threat to the agriculture
industry. The Authority is responsible for risk analysis for introduction of any organism or
microorganism prescribed for support to agriculture health. Under the revised Act BAHA assumes
responsibility for regulating issues pertaining to biosafety (genetically modified organisms (GMO’s)
and to organic production. The quarantine department conducts an on-going surveillance programme
to maintain Belize’s Mediterranean Fruit Fly- free status necessary to allow for fresh fruit export to the
USA.
1.4.2.3 Belize Livestock Producers Association
The Belize Livestock Producers Association (BLPA) is established under the Meat and Livestock Act
Chapter 214 of the Laws of Belize. Its mission is to promote development of the livestock industry
and protect its members. The objectives of BLPA are to provide technical assistance, training and
educational facilities, solicit funding to enable affordable financing to producers, access improved
genetics and promote national and international marketing of livestock products (the Belize livestock
industry - a brief account by Harold Parham, CEO ,BLPA April 29, 2009). BLPA previously operated
a “fondo ganadero” programme which provided fattener stock to farmers on “loan” terms, with
payment due after sale of animals. The law stipulates mandatory membership in BLPA for all
livestock producers and includes mandatory cess payment for all cattle sale transactions. BLPA
currently regulates the national sanitary cattle sweep programme required for export of cattle to
Mexico, and intends to maintain a database and monitor/regulate local and regional movements of
cattle in compliance with the Mexican agreement.

A National Adaptation Strategy to Address Climate Change in the Agriculture Sector in Belize
59
1.4.2.4 Pesticides Control Board
The Pesticides Control Board (PCB), a statutory body governed by a board of directors, is responsible
to safeguard the health of the Belizean people and the environment through pesticide regulation and
capacity building. The PCB Act Chapter 216, Revised Edition of 2003, provides for control of the
manufacture, importation (including for experimentation), sale, storage, use and disposal of pesticides.
PCB conducts regular training for agriculture workers in the safe use of pesticides including aspects of
rational use, application methods and calibration, protective gear and equipment maintenance. PCB
also participates in efficacy trials for new pesticides along with the ministry of agriculture and
pesticides sales agencies.
1.4.2.5 Belize Marketing Development Corporation
Formerly the Belize Marketing Board, the Belize Marketing and Development Corporation (BMDC)
established under the Revised Act , Chapter 281 of 2003 , gives the mandate to support the marketing
of primary or value added agricultural products from small and medium enterprises through technical
support, distribution systems, market intelligence, market linkages and direct marketing for the
promotion of new product developments. Through this mandate BMDC assisted the launching of
Belize’s national production of onions, potatoes and carrots through direct marketing assistance.
BMDC currently continues to focus on marketing of rice -purchase, processing and distribution and
importation in times of national deficit.
1.5 Research
1.5.1 Caribbean Agriculture Research and Development Institute
The Caribbean Agriculture Research and Development Institute (CARDI) is a regional organization
responsible for meeting the research needs of individual countries whilst contributing to regional
research objectives. Its policies/programmes are set by a regional Board of Directors with national
oversight at country level. In Belize CARDI research focuses on agronomic practices, cultivar
selection, seed production and germplasm maintenance of cereal grains and legume crops, especially
corn, soybeans, peanut and cowpeas. CARDI also takes the lead role in the production of nucleus and
commercial seeds for the hot pepper production industry.
1.5.2 Citrus Research and Education Institute (CREI)
CREI is owned by the CGA and is overseen by an appointed committee. CREI conducts agronomic
research on citrus production and provides extension service (including a quarterly newsletter) for all
commercial citrus growers. The institute manages a clean planting stock nursery and is mandated to
ensure compliance of commercial nurseries to provide disease free planting stock to all citrus growers.
CREI develops pest and disease management plans for the citrus industry which includes liaison with
development partners and mobilization of resources in regards to major threats to the industry.

A National Adaptation Strategy to Address Climate Change in the Agriculture Sector in Belize
60
1.5.3 Sugar Industry Research and Development Institute (SIRDI)
SIRDI is mandated to conduct research on agronomic aspects of sugarcane production and to provide
advisory/extension services to sugarcane producers. SIRDI is undergoing a rapid process of
development with financial assistance under the AMS.
1.5.4 Central Farm Research and Development Station
Central Farm (CF) is the research and development division of the Ministry of Agriculture comprised
of livestock, agronomy and farm mechanization sections. It maintains improved breeding stocks of
cattle, sheep and pigs for sale to livestock farmers, provides a bull rental service for small livestock
farmers and maintains field legume banks for distribution of legume cuttings (planting material) to
livestock farmers for pasture improvement. CF conducts research on new pasture grass and legume
species, vegetables, protective cropping technology, organic methods and selected field crops. Field
nurseries are maintained for distribution of planting material of selected cultivars to farmers. CF
operates a coconut hybridization programme providing lethal yellowing resistant varieties of coconut
to growers countrywide.
1.5.5 National Coordinating Committee for Agricultural Research and Development
The National Coordinating Committee for Agricultural Research and Development (NCCARD) was
established in 2004 and reorganized in 2010. NCCARD arose from a regional mandate under CARDI
leadership. This committee is responsible to coordinate research at a national level driven by expressed
needs of the private sector, and includes representatives of the productive sector, research entities and
policy makers.
1.5.6 Agriculture Mission of the Republic of China on Taiwan
The Republic of China on Taiwan (ROC) had an agricultural mission stationed at Central Farm and
conducted research on agro-processing, rice production technologies, introduction of new vegetable
cultivars and production technologies and use of small machinery. The mission liaised with the Asian
Vegetable Research and Development Centre which is instrumental in developing cultivars of popular
vegetables and fruits that are adapted for production in tropical climates. The ROC recently handed
over this research to the MNRA and now focuses on implementing projects in aquaculture, Citrus
Greening, information technology and small ruminants in collaboration with MNRA.
1.6 International Development Partners
1.6.1 Inter-American Institute for Cooperation on Agriculture (IICA)
IICA is a specialized agency of the inter-American system to support efforts of Member States to
foster agriculture development and rural well-being in their territories.
IICA provides technical assistance, support for policy development and innovations in agriculture
technology especially focusing on improved production and post- harvest practices in grain production
in Toledo. IICA also supports the organic agriculture development initiative, and training via visiting
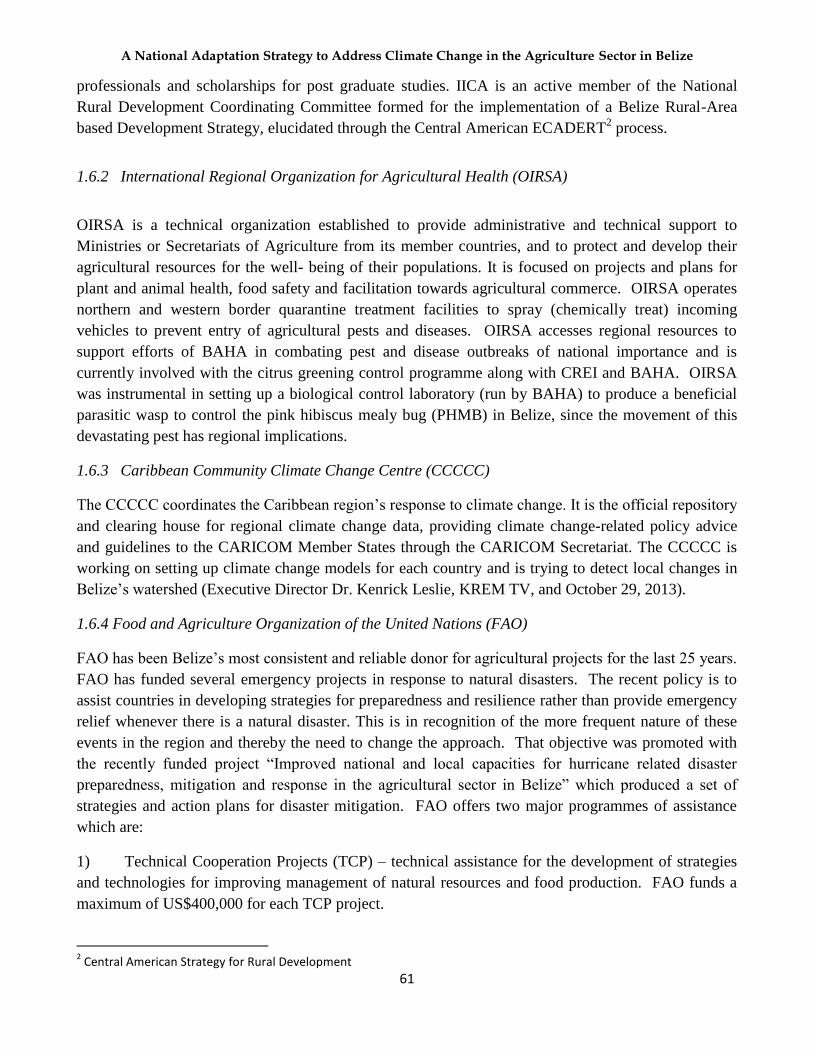
A National Adaptation Strategy to Address Climate Change in the Agriculture Sector in Belize
61
professionals and scholarships for post graduate studies. IICA is an active member of the National
Rural Development Coordinating Committee formed for the implementation of a Belize Rural-Area
based Development Strategy, elucidated through the Central American ECADERT2 process.
1.6.2 International Regional Organization for Agricultural Health (OIRSA)
OIRSA is a technical organization established to provide administrative and technical support to
Ministries or Secretariats of Agriculture from its member countries, and to protect and develop their
agricultural resources for the well- being of their populations. It is focused on projects and plans for
plant and animal health, food safety and facilitation towards agricultural commerce. OIRSA operates
northern and western border quarantine treatment facilities to spray (chemically treat) incoming
vehicles to prevent entry of agricultural pests and diseases. OIRSA accesses regional resources to
support efforts of BAHA in combating pest and disease outbreaks of national importance and is
currently involved with the citrus greening control programme along with CREI and BAHA. OIRSA
was instrumental in setting up a biological control laboratory (run by BAHA) to produce a beneficial
parasitic wasp to control the pink hibiscus mealy bug (PHMB) in Belize, since the movement of this
devastating pest has regional implications.
1.6.3 Caribbean Community Climate Change Centre (CCCCC)
The CCCCC coordinates the Caribbean region’s response to climate change. It is the official repository
and clearing house for regional climate change data, providing climate change-related policy advice
and guidelines to the CARICOM Member States through the CARICOM Secretariat. The CCCCC is
working on setting up climate change models for each country and is trying to detect local changes in
Belize’s watershed (Executive Director Dr. Kenrick Leslie, KREM TV, and October 29, 2013).
1.6.4 Food and Agriculture Organization of the United Nations (FAO)
FAO has been Belize’s most consistent and reliable donor for agricultural projects for the last 25 years.
FAO has funded several emergency projects in response to natural disasters. The recent policy is to
assist countries in developing strategies for preparedness and resilience rather than provide emergency
relief whenever there is a natural disaster. This is in recognition of the more frequent nature of these
events in the region and thereby the need to change the approach. That objective was promoted with
the recently funded project “Improved national and local capacities for hurricane related disaster
preparedness, mitigation and response in the agricultural sector in Belize” which produced a set of
strategies and action plans for disaster mitigation. FAO offers two major programmes of assistance
which are:
1) Technical Cooperation Projects (TCP) – technical assistance for the development of strategies
and technologies for improving management of natural resources and food production. FAO funds a
maximum of US$400,000 for each TCP project.
2 Central American Strategy for Rural Development

A National Adaptation Strategy to Address Climate Change in the Agriculture Sector in Belize
62
2) Telefood projects – FAO provides up to US$10,000 in material inputs for food production
aimed at assisting the rural poor in getting a head start to improve their economic conditions. The
Telefood projects are executed within a one year period and must be designed to ensure sustainability.
1.6.5 European Union (EU)
The European Union supports Belize through the EU-ACP partnership under the Cotonou Agreement
revised of June 2010. The banana sector has benefited from Budget Line funding for the Banana
Support Programme 1999-2008, and continues to be supported through the recently commenced
Banana Accompanying Measures. The sugar sector is being supported under the Accompanying
Measures for Sugar where 45 million euro has been earmarked for ensuring employment security and
improved competitiveness in the sugar industry. Agriculture has also been the major focus of the
European Development Fund (EDF) 9 and EDF 10 with Envelope A funding allocated to the Belize
Rural Development Programme (BRDP) and the BRDP 2 respectively. The EU is instrumental in
supporting climate change adaptation initiatives in the CARICOM region.
1.6.6 United Nation Development Programme (UNDP)
The UNDP programme in Belize is designed on four overarching goals: Poverty reduction and
achievement of the Millennium Development Goals.; Democratic governance; Crisis prevention and
recovery and Environmental and sustainable development. Their Global Environmental Facility (GEF)
Small Grants Programme has supported several small agriculture projects in the last decade and more
recently UNDP has partnered with the EU and the Ministry of Agriculture to undertake larger
agriculture projects with a national focus. UNDP is active in the National Climate Change Committee
and is currently implementing two projects in partnership with the GOB (1) the EU funded “Enhancing
Belize’s Resilience to Adapt to the Effects of Climate Change” and (2) Enabling Activities for the
Preparation of Belize’s Third National Communication to the UNFCC funded by the GEF. Both
projects have a component on climate change vulnerability and adaptation and aim to facilitate the
mainstreaming of climate change initiatives into GOB’s sectoral and national development plans.
1.7 Policy Framework
1.7.1 Horizon 2030 National Development Framework
Horizon 2030 asserts the tenet that Belize’s economic development is contingent on preserving its
environment and its wealth of natural resources, including planning for the effects of Climate Change.
Agriculture features prominently as a driving force for economic stability and the need to support its
resilience is elaborated through emphasis on appropriate infrastructure, technology, financial access,
incentives and security (insurance) for farmers, marketing, value adding and education in agriculture
and entrepreneurship. Very importantly the framework espouses the critical need for community
cooperation and planning for effective agriculture development. It emphasizes that party politics in
Belize is a divisive and stagnating force which limits the potential of Belizeans as a whole to unite and
build strong, resilient communities.

A National Adaptation Strategy to Address Climate Change in the Agriculture Sector in Belize
63
1.7.2 Land Use Policy
The land use policy proposes zoning for appropriate land use according to the most socio-economic
and sustainable potential in reference to agriculture, aquaculture and other land-based activities. The
policy considers what is termed the intrinsic value of land and how its use for one purpose can
negatively affect a greater purpose. It recommends a National Land Use Planning Office equipped
with a comprehensive and interactive mapping system. Agriculture and climate change policies
consider the importance of watersheds, wetlands, coastline mangrove systems and biological refuges
for long term sustainability of agriculture systems. This policy looks at the management of water and
energy sources for maximum efficiency and reliability (water storage and incentivising non-water
based renewable energy sources) and at agriculture and other settlement patterns with respect to flood
prone areas. It recognizes the potential effect of CC on food security and the role of the small producer
as regards access to good agricultural land. The policy suggests that higher quality land requiring less
investment should be allocated to the resource poor farmers.
1.7.3 Water Policy
The national water policy recognizes that water is essential to agriculture, but that it is finite and likely
to become less available with decreased precipitation expected due to climate change. It proposes the
establishment of a National Integrated Water Resources Authority (NIWRA) with responsibility to
regulate water usage, with domestic use being number one priority. Significantly it proposes
mechanisms to verify and safeguard water resources as pressures for its utility increases
simultaneously with decreased supply, and introduces the concept of “economic” value of all water
resources.
1.7.4 Agriculture Policy and Strategy
The overarching goal of the agriculture operational strategy is to increase the competitiveness
(particularly of small farmers) of the agriculture commodity sector in order to realize the ministry’s
mission objectives. Three main interlinked programmes elaborated under this strategy are: Incentive
Policies and Institutional Development (institutional coordination and collaboration strengthening, and
placing special attention to disadvantaged areas and social groups); Development of Agricultural
Markets (domestic and international) and Enterprises; and Agriculture Technology Development and
Diversification. It emphasizes private, public and community sector linkages and the importance of
agricultural trade policy and trade negotiations in shaping consumption, production and marketing. It
promotes improved information, technology and management systems as critical catalysts to change
and sustainability with improved integration at the international, regional, national and local levels to
improve coordination, decrease duplication and increase synergies in tackling shared objectives
especially those with the same target beneficiaries. The strategy sees the development of an organic
agriculture industry as a highly rated opportunity area and proposes to strengthen the Belize Organic
Producers Association (BOPA), link with the BMDC and the Belize Tourism Industry Association
(BTIA) to develop local markets for Belizeans and tourists, and strengthen initiatives to exploit
international market opportunities for Belizean organic products. A computerized management tool
(CMT) is proposed to facilitate the management and monitoring of the strategy. Agriculture is in the

A National Adaptation Strategy to Address Climate Change in the Agriculture Sector in Belize
64
process of re-writing or updating its current policy and the new policy is expected to include the issue
of Climate Change.
1.7.5 Plan of Action for Disaster Risk Reduction in Agriculture (POA)
Under the POA, strategies and action plans are elaborated to institutionalize Disaster Risk Reduction
(DRR) and Climate Change Adaptation (CCA) within the Ministry of Agriculture, improve knowledge
and access of local communities to climate information and early warning messages tailored to the
needs of agricultural producers, enhance application of good practices interventions at local level to
increase resilience against natural hazards and climate risks, reduce hazard impacts and losses in
agriculture (savings, insurance), adopt an efficient and effective Community Based Disaster Risk
Reduction (CBDRR) process at community level, enhance public awareness of DRR and CCA in
agriculture and strengthen complementary collaboration with key stakeholders.
1.7.6 Energy Policy
The energy policy speaks to reducing the cost of energy through cost efficient renewable energy
sources as well as use of energy efficient equipment to minimise energy usage. It speaks to designing
production systems to maximize energy efficiency and the need to manage the farm as an ecosystem,
rediscovering the more sustainable agricultural practices of ancestral farmers whilst incorporating
appropriate scientific advances into agricultural systems. With oil being a finite resource the use of
renewable energy to replace fossil fuels in agricultural systems is proposed for long term sustainability,
cost effectiveness of farming operations (e.g. irrigation), health aspects and mitigation of Climate
Change effects. There is a proposal for use of biomass as a renewable energy source and an alternative
economic product of farms, thereby helping to build resilience in the farm enterprise.
1.7.7 Biosafety Policy
Belize’s biosafety policy is predicated on the ‘Precautionary principle’, as provided for in the
Cartagena Protocol on Biosafety, “Lack of scientific certainty due to insufficient relevant scientific
information and knowledge regarding the extent of potential adverse effects of genetically modified
organism (GMO) on the conservation and sustainable use of biological diversity in the Party of import,
taking also into account risks to human health shall not prevent that Party taking a decision, as
appropriate, with regard to the import of the GMO in question, in order to avoid or minimize such
potential adverse effects.”
This policy sets the overall framework in which adequate safety measures will be developed and put
into force, so that Belize can minimize possible risks to human health and the environment while
extracting maximum benefit from any potential that modern biotechnology may offer. It recognizes
the need to safeguard the knowledge, practices and benefits of Belize’s traditional techniques, and
focuses on risk analysis; trade issues; consumer rights; and cultural and socio-economic considerations
for decision making as regards the use of GMOs.

A National Adaptation Strategy to Address Climate Change in the Agriculture Sector in Belize
65
1.7.8 Aquaculture Policy
The very exhaustive draft aquaculture policy presents a zoning scheme which delineates the most
suitable land and coastal areas for aquaculture development. It defines policies and strategies to
manage the natural resource environment to achieve efficiency of operation and long term
sustainability of the aquaculture industry. It underscores the need for diversification of species and
habitats to minimize risk as well as capitalize on economic opportunities presented by expanding
aquaculture development. The policy emphasizes the need for planned development of the aquaculture
industry which will involve research (especially alternative feed, species selection, reproduction by
local hatchery and production systems), and regulation and management of the industry to safeguard
its health status. It further promotes the need for meaningful broader community involvement in the
planning and implementation process to allow for equitable access to resources and benefits to be
derived from an expanded aquaculture industry. A new Strategic Plan and Policy document developed
by the Belize Shrimp Growers Association addresses concerns identified as critical to the survival and
adaptability of the sector including issues related to Climate Change.
2. PROJECTED CLIMATE CHANGE IMPACTS ON THE AGRICULTURE SECTOR
2.1 Current climate
Climatological data from the
National Meteorological Service
of Belize (NMS) database were
used in identifying the trends in
average rainfall and temperatures.
Since all observation stations were
not established at the same time,
the best or most consistent period
for each station was used. The data
were subjected to strict quality
control measures. In situations
where large quantities of data
were missing the month was
simply deleted and no attempts
were made at generating or
interpolating information for
missing data. Agriculture
production, yields and agronomic
information were sourced from the
Agriculture offices in Belmopan
and Central Farm (Ministry of
Natural Resources and
Agriculture), and from private
Figure 2.1: Isohyets of mean annual rainfall (mm) for Belize

A National Adaptation Strategy to Address Climate Change in the Agriculture Sector in Belize
66
producers.
2.1.1 Current Climate of Belize
Under the Köppen climate classification, the climate in Belize can be described as tropical rainforest
(Am)3 in the higher terrain of the central mainland and southern districts, and tropical wet and dry
(Aw)4 in the remainder of the country, tempered by the Caribbean Sea (WMO, 1997, FAO-SDRN,
1997). The climate also exhibits seasonal subtropical characteristic during the cool period that runs
from December through February.
There are two distinct rainfall seasons: a rainy season which normally commences around mid-May in
the south and early June in the north, and last until November; and a dry season which stretches from
mid-February until May.
A cool, wet transition period extends from December until February (DJF) during which Belize
experiences incursions of arctic air masses from the continental USA and Canada, which often results
in night time minimum temperatures dropping to about 10˚C or less in the higher terrain of the
Mountain Pine Ridge in extreme cold events. This cool transition period rainfall (DJF) accounts for
about 11-20% of the annual total rainfall for most districts of Belize (Table 2.1).
The rainfall pattern during the wet season is bi-modal over central and northern Belize and
characterized by a short dry spell of 10-14 days, locally known as the ‘maga” season or the "mid-
summer drought”, which normally occurs in late July or August, after the initial onset of the rainy
season. In the south, this mid-summer dry spell is less pronounced and the rainfall pattern is modal.
Annual average rainfall varies from 1,524 mm (60 inches) in the north to 4,064 mm (160 inches) in the
south (See Figure 2.1). Seasonal differences in rainfall are greatest in the northern and central regions
of the country, where monthly rainfall less than 100 mm is not unusual in March and April. The dry
season is shorter in the south, normally lasting from March to mid-May. Table 2 (a) is a summary of
the seasonal and annual mean rainfall for key stations around Belize.
3 Tropical monsoon
4 Tropical wet and dry

A National Adaptation Strategy to Address Climate Change in the Agriculture Sector in Belize
67
Table 2 (a): Average seasonal and annual rainfall at key meteorological stations in Belize
(Source of data: period 1970 - 2000, National Meteorological Service, Belize)
2.1.2 Temperature
The temperature regime in Belize is moderated by the Caribbean Sea, such that the coastal zone
exhibits a maritime climate, while conditions in the interior are more extreme, particularly during the
height of the dry season and during significant change in air mass during the cool transition months.
Average maximum temperatures are near 85 °F / 29 °C and lows may drop to the low 70s or 21 °C.
The summer months are about 8 degrees warmer than those months in the cool period. Minimum
temperatures in the interior are about 5 degrees cooler than at coastal locations, but in the higher
elevations of the Mountain Pine Ridge, minimum temperatures are often 10 degrees cooler than coastal
locations.
2.1.3 Extreme Rainfall Events
Generally three types of events result in intense rainfall throughout Belize. In June and July tropical
waves and cyclones produce thunderstorms, which generate intense but localized rainfall. Soil
moisture is often below field capacity after the long dry season and runoff does not achieve its full
potential, except in urbanized areas. In late August, September and October Belize normally
experiences significant and prolonged rainfall during the height of the hurricane season. Substantial
runoff occurs, resulting in localized flash floods in the hilly terrain, ponding and inundation along
flood plains and low-lying coastal areas. In November through January, significant but less intense
rainfall can occur, caused by incursions of frontal systems across the area. During extended and
intense dry seasons ground water tables may drop and base flow is the only source of water for the
major rivers and tributaries. In the coastal zone of the Belize and Corozal Districts, these recurrent
drought conditions result in the advance of the salt water lens deep into the coastal aquifers, and some
distance up the main rivers and tributaries.

A National Adaptation Strategy to Address Climate Change in the Agriculture Sector in Belize
68
2.1.4 Agro-climatic Zones in Belize
Four agro-climatic zones have been identified for Belize. These are listed below along with a few agro
climatic stations representative of the zones:
Northern Zone: Consejo, Libertad, La Milpa (Rio Bravo) and Towerhill;
Central Coastal Zone: Philip S. W. Goldson International Airport (PSWGIA) and Melinda;
West Central Zone: Belmopan, Central Farm and Spanish Lookout;
Southern Zone: Middlesex, Mayan King, Big Falls (South), Punta Gorda Agricultural Station
(at five miles), and the Toledo Research and Development Project site (TRDP), Blue Creek
Village).
2.1.5 Current Climate in Northern Zone: Corozal and Orange Walk Districts
Figure 2.2 (a-b) are climate charts of average maximum and minimum temperatures, monthly average
rainfall and evapotranspiration for Libertad and Towerhill agro meteorological stations. The climate
charts show that the growing season (where monthly rainfall P, exceed evapotranspiration rates E,
moisture surplus) is about five months in the Corozal District, running from June until October, and
about six months in the Orange Walk District extending from June to November.
Figure 2.2 a: Climate Chart, Libertad,
Corozal District
Figure 2.2 b: Climate Chart, Tower Hill,
Orange Walk District
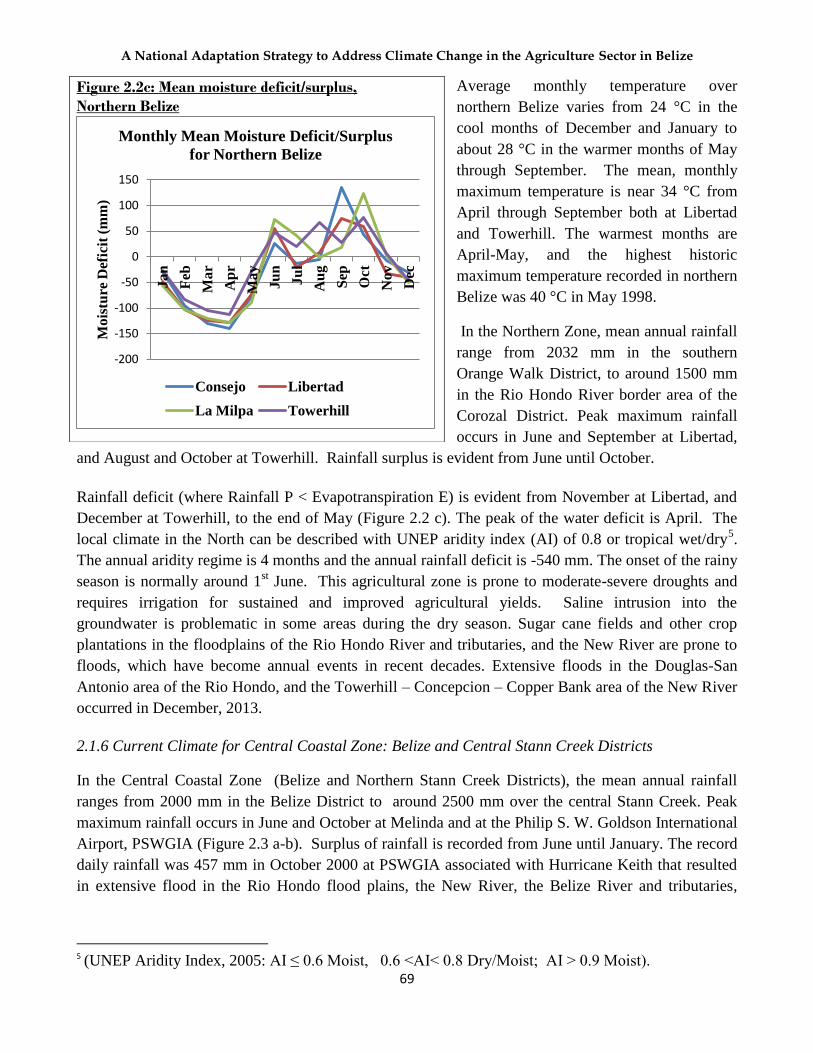
A National Adaptation Strategy to Address Climate Change in the Agriculture Sector in Belize
69
Average monthly temperature over
northern Belize varies from 24 °C in the
cool months of December and January to
about 28 °C in the warmer months of May
through September. The mean, monthly
maximum temperature is near 34 °C from
April through September both at Libertad
and Towerhill. The warmest months are
April-May, and the highest historic
maximum temperature recorded in northern
Belize was 40 °C in May 1998.
In the Northern Zone, mean annual rainfall
range from 2032 mm in the southern
Orange Walk District, to around 1500 mm
in the Rio Hondo River border area of the
Corozal District. Peak maximum rainfall
occurs in June and September at Libertad,
and August and October at Towerhill. Rainfall surplus is evident from June until October.
Rainfall deficit (where Rainfall P < Evapotranspiration E) is evident from November at Libertad, and
December at Towerhill, to the end of May (Figure 2.2 c). The peak of the water deficit is April. The
local climate in the North can be described with UNEP aridity index (AI) of 0.8 or tropical wet/dry5.
The annual aridity regime is 4 months and the annual rainfall deficit is -540 mm. The onset of the rainy
season is normally around 1st June. This agricultural zone is prone to moderate-severe droughts and
requires irrigation for sustained and improved agricultural yields. Saline intrusion into the
groundwater is problematic in some areas during the dry season. Sugar cane fields and other crop
plantations in the floodplains of the Rio Hondo River and tributaries, and the New River are prone to
floods, which have become annual events in recent decades. Extensive floods in the Douglas-San
Antonio area of the Rio Hondo, and the Towerhill – Concepcion – Copper Bank area of the New River
occurred in December, 2013.
2.1.6 Current Climate for Central Coastal Zone: Belize and Central Stann Creek Districts
In the Central Coastal Zone (Belize and Northern Stann Creek Districts), the mean annual rainfall
ranges from 2000 mm in the Belize District to around 2500 mm over the central Stann Creek. Peak
maximum rainfall occurs in June and October at Melinda and at the Philip S. W. Goldson International
Airport, PSWGIA (Figure 2.3 a-b). Surplus of rainfall is recorded from June until January. The record
daily rainfall was 457 mm in October 2000 at PSWGIA associated with Hurricane Keith that resulted
in extensive flood in the Rio Hondo flood plains, the New River, the Belize River and tributaries,
5 (UNEP Aridity Index, 2005: AI ≤ 0.6 Moist, 0.6 <AI< 0.8 Dry/Moist; AI > 0.9 Moist).
Figure 2.2c: Mean moisture deficit/surplus,
Northern Belize
-200
-150
-100
-50
0
50
100
150 J
an
Feb
Ma
r
Ap
r
Ma
y
Ju
n
Ju
l
Au
g
Sep
Oct
No
v
Dec
Mo
istu
re D
efic
it (
mm
)
Monthly Mean Moisture Deficit/Surplus
for Northern Belize
Consejo Libertad
La Milpa Towerhill

A National Adaptation Strategy to Address Climate Change in the Agriculture Sector in Belize
70
Sibun, North Stann Creek and Sittee Rivers, which severely impacted agriculture production and
commerce.
The highest historic maximum temperature recorded in the Central Coastal zone was 37 °C in May at
the PSWGIA in 1988 and 1991. The climate regime along central coastal Belize is prone to mild –
moderate droughts and moderated by the sea breeze. Vegetable farmers along the Old Northern Road
(Boston-Maskall-Bomba-Corozalito) are affected by annual floods, while rangeland livestock farmers
in the Belize River Valley are usually impacted by 10-year top gallon floods, but which have become
more frequent in recent years. Livestock farmers in the Belize River Valley are also vulnerable to
droughts that are becoming more frequent and severe (Cayetano-NEMO/IDB, 2013).
2.1.7 Current Climate in the Stann Creek District
In the main citrus growing area of the Stann Creek District the mean monthly temperature varies from
around 25 °C in the cooler months of December and January to near 28 °C in May-June-July at
Middlesex (Figure 2.4a). The monthly minimum temperature ranges from 20 °C in the cool transition
period (January-February), to near 25 °C in June. The warmest month is May, with an average
Figure 2.3 a: Climate Chart for PSWGIA
Figure 2.3 b: Climate Chart for Melinda,
Stann Creek
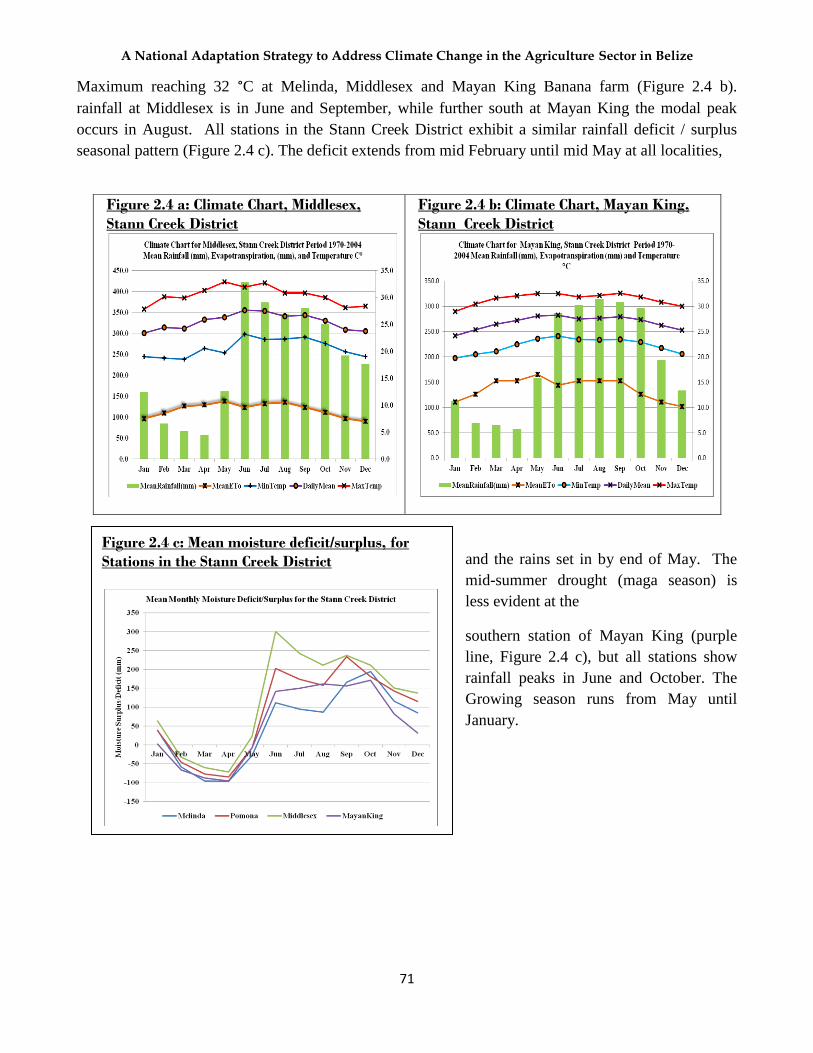
A National Adaptation Strategy to Address Climate Change in the Agriculture Sector in Belize
71
Figure 2.4 c: Mean moisture deficit/surplus, for
Stations in the Stann Creek District
Figure 2.4 c: Mean moisture deficit/surplus, Stann
Creek District
Maximum reaching 32 °C at Melinda, Middlesex and Mayan King Banana farm (Figure 2.4 b).
rainfall at Middlesex is in June and September, while further south at Mayan King the modal peak
occurs in August. All stations in the Stann Creek District exhibit a similar rainfall deficit / surplus
seasonal pattern (Figure 2.4 c). The deficit extends from mid February until mid May at all localities,
and the rains set in by end of May. The
mid-summer drought (maga season) is
less evident at the
southern station of Mayan King (purple
line, Figure 2.4 c), but all stations show
rainfall peaks in June and October. The
Growing season runs from May until
January.
Figure 2.4 a: Climate Chart, Middlesex,
Stann Creek District
Figure 2.4 b: Climate Chart, Mayan King,
Stann Creek District

A National Adaptation Strategy to Address Climate Change in the Agriculture Sector in Belize
72
2.1.8 Current Climate for West Central Zone: Cayo District
In the West Central Zone mean annual rainfall ranges from 2540 mm in southern Cayo District to
around 1524 mm in the north and north-western border areas. Peak maximum rainfall occurs in July
and October at Central Farm and June and September at Belmopan. Rainfall surplus is evident from
June until January. The mean maximum temperature varies from 29°C to near 35°C at Belmopan and
280C – 35
0C at Central Farm (Figure 2.5 a and b). The warmest month is May, the coolest month is
January, and the highest historic maximum temperature recorded in Western Belize was 43°C in May
1976 at Belmopan and 41°C in May 1974 at Central Farm.
Figure 2.5 a : Climate Chart, Central Farm,
Cayo District
Figure 2.5 b: Climate Chart, Belmopan, Cayo
District

A National Adaptation Strategy to Address Climate Change in the Agriculture Sector in Belize
73
Figure 2.5 c: Mean, monthly moisture deficit
/surplus for the Cayo District
Figure 2.5 d: Historic Five-day rainfall (green
line) and potential evapo-transpiration ETo
(red line) & 0.5ETo (blue line) for Central F.
The record daily rainfall was 267 mm in April 1983 at Central Farm and 334 mm in June 2002
Belmopan. Rainfall deficit (P < E) extends from February to May (Figure 2.5 c). The peak of the
water deficit is April.
Figure 2.5 d is a plot of the historic, average five-day rainfall, potential or reference evapotranspiration
(ETo)6 and half-ETo for Central Farm for the period 1970-1990. This type of rainfall and reference-
evapotranspiration analysis is an essential tool farmers can use for irrigation scheduling, as it clearly
defines the expected average rainfall at each locality for every five days and delineates the growing
season, and cropping season and the normal onset and end of the wet season.
2.1.9 Current Weather for the Southern Zone: Southern Stann Creek and the Toledo Districts
In the Southern Agro climatic Zone mean annual rainfall range from 3024 mm in central and south
Stann Creek District to around 4064 mm in the Blue Creek (TRDP site) and Punta Gorda Agricultural
Station (PGAgstat) in the Toledo District. Peak maximum rainfall is in July (Figure 2.6 a-b). Months
with rainfall surpluses are from mid-May until February. The mean maximum temperature varies from
29 °C to near 35 °C at Blue Creek, and 28 °C to 32 °C at the Punta Gorda Agricultural Station (Figure
2.6 a-b).
6 The evapotranspiration rate from a reference surface, not short of water, is called the potential or reference crop
evapotranspiration or reference evapotranspiration and is denoted as ETo (FAO 2014, www.fao.org).

A National Adaptation Strategy to Address Climate Change in the Agriculture Sector in Belize
74
-200
-100
0
100
200
300
400
500
600
700
Mo
istu
re D
efic
it/S
urp
lus
(mm
)
Mean Monthly Moisture Deficit/Surplus for
Southern Belize
PGAgstat TRDP
Figure 2.6 a: Climate Chart for Punta Gorda
Agriculture Station, Toledo District
Figure 2.6 b: Climate Chart for Blue Creek
(TRDP) Toledo District
The warmest months are April-May, and the highest historic maximum temperature recorded in
southern Belize was 38 °C in May 1994 at Punta Gorda Agriculture Station, 40 °C in May 1995 at
Blue Creek and 38 °C at Big Falls in 1998-99. The record daily rainfall was 210 mm in July 1995 at
Punta Gorda Agricultural. Rainfall deficit is evident from February to April (Figure 2.6 c). The peak
Figure 2.6 c: Mean monthly moisture deficit/surplus for the
Toledo District
A National Adaptation Strategy to Address Climate Change in the Agriculture Sector in Belize
75
of the water deficit is March – April. The local climate in the South has UNEP aridity index (AI) of
2.4 Very Moist. The Annual Aridity regime is 2 months and the annual Rainfall Deficit is -198 mm.
The onset of the rainy season is normally in the second to third dekad of May. This agricultural zone
is very moist, with a short dry season and a growing season that extends almost year round.
2.2 PRECIS Regional Climate Model
For the discussion on regional climate model verification and future model projection of temperature,
rainfall, evapotranspiration and other agro-climatic variables, it is important at this juncture to
introduce the Hadley Center, United Kingdom, PRECIS Regional Climate Model. PRECIS stands for
Providing Regional Climates for Impact Studies.
PRECIS is a Regional Climate Modelling (RCM) system derived from the Hadley Centre Global
Climate Model (GCM). It is a PC-based regional climate model. PRECIS can be set up and run over
any area of the globe. The model is available for free and has two resolutions: 25 and 50 km. PRECIS
is a modelling tool for dynamical downscaling, meaning it is forced at its boundaries by other global
models such the Hadley Model HADAM3P GCM, HADCM3, and the European Centre Hamburg
Model (ECHAM).
The GCMs, PRECIS-Echam4, PRECIS-Echam5, and PRECIS HADCM3 model projections of
changes in temperature, rainfall, evapotranspiration for the Caribbean Region and Belize under the A2
(business-as-usual emission scenario), B2 (low emission scenario) and B1 (medium level emission
scenario) for 50 and 25 km resolution were used in the analysis. See Annex 4-A for a brief discussion
on the IPCC’s Special Report on Emission Scenarios (SRES).
2.2.1 Historic Climate Trends
Rainfall (P)
Data collected from local meteorological stations from 1960 to 2013 indicate evidence of climate
change during this period. The meteorological data for the central observation station at the PSWGIA
was used to validate the PRECIS Model projections under the A2 and B2 emission scenarios (SRES)
for recent historic trends. The data set for this central meteorological station is continuous and
homogeneous over any 30 year period since 1961 to the present, and trends are representative of the
climatic tendencies elsewhere around Belize. Time series for other meteorological stations in Belize
and climate database for Belize from other sources such Tyndall Center for Climate Research
(Mitchell, TD et al, 2013 www.cru.uea.ac/uk/~timm), University of Oxford (McSweeney et al. 2009,
2010) were used for some of the analysis.
Figure 2.7: Historic annual rainfall for Belize City (1887-2013)

A National Adaptation Strategy to Address Climate Change in the Agriculture Sector in Belize
76
The historic annual rainfall trend (red line) for Belize City Figure 2.7 shows decreasing tendency in
annual rainfall from 1887 to 2013, at the rate of near - 4.6 mm per annum (negative slope of equation
of the trend line) or 46 mm per decade, which translates to a decrease of around 480 mm over the 126
years rainfall record for Belize City. The long term mean rainfall for Belize City (blue line) is 1822
mm. The decadal or ten-year running mean (yellow line) highlights the decadal cycle of higher annual
rainfall during 1905 -1922, 1933 - 1943, which damps away after the 1950s through 2010, with a rising
tendency after 2010.
The annual rainfall trend (millimeters) for the PSWGIA for the period 1960-2013 is presented in
Figure 2.8. The red line is the annual rainfall trend and the yellow line is the 10-year running average.
Over the fifty-three years spanning 1960 – 2013, the analysis shows a slight increase in rainfall of
about 1.4 mm per annum (slope of trend-line equation), which amounts to about 74 mm increase in
observed rainfall at PSWGIA for the entire period under review. The annual average rainfall at this
locality is 2003 mm for the period 1970 – 2000.
Figure 2.8: Annual rainfall for Philip Goldson International Airport (1960-2013)

A National Adaptation Strategy to Address Climate Change in the Agriculture Sector in Belize
77
Figure 2.9 is a trend analysis of decadal or ten-year rainfall for central Belize for the period 1901–2009
(Mitchell, UEA, 2013). The analysis shows an increasing trend over the past century of 7.6
mm/decade or about 82 mm increase over the 108 year period. This result is consistent with the
increasing trend for PSWGIA for the period 1960-2013, but is in the opposite direction of the
decreasing trend for the Belize City historic rainfall records, which explains the high variability in long
term tropical rainfall.
Figure 2.9: Historic Mean Decadal Rainfall for Central Belize (2001-2009)
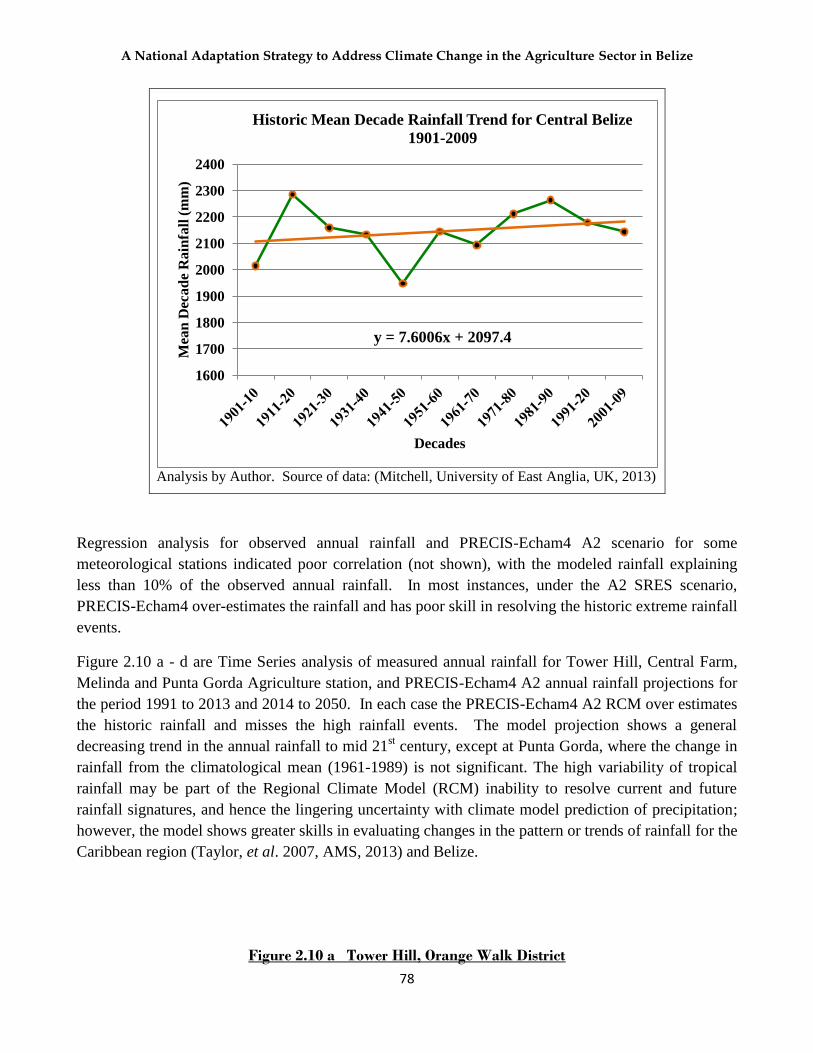
A National Adaptation Strategy to Address Climate Change in the Agriculture Sector in Belize
78
Regression analysis for observed annual rainfall and PRECIS-Echam4 A2 scenario for some
meteorological stations indicated poor correlation (not shown), with the modeled rainfall explaining
less than 10% of the observed annual rainfall. In most instances, under the A2 SRES scenario,
PRECIS-Echam4 over-estimates the rainfall and has poor skill in resolving the historic extreme rainfall
events.
Figure 2.10 a - d are Time Series analysis of measured annual rainfall for Tower Hill, Central Farm,
Melinda and Punta Gorda Agriculture station, and PRECIS-Echam4 A2 annual rainfall projections for
the period 1991 to 2013 and 2014 to 2050. In each case the PRECIS-Echam4 A2 RCM over estimates
the historic rainfall and misses the high rainfall events. The model projection shows a general
decreasing trend in the annual rainfall to mid 21st century, except at Punta Gorda, where the change in
rainfall from the climatological mean (1961-1989) is not significant. The high variability of tropical
rainfall may be part of the Regional Climate Model (RCM) inability to resolve current and future
rainfall signatures, and hence the lingering uncertainty with climate model prediction of precipitation;
however, the model shows greater skills in evaluating changes in the pattern or trends of rainfall for the
Caribbean region (Taylor, et al. 2007, AMS, 2013) and Belize.
Figure 2.10 a Tower Hill, Orange Walk District
Analysis by Author. Source of data: (Mitchell, University of East Anglia, UK, 2013)
y = 7.6006x + 2097.4
1600
1700
1800
1900
2000
2100
2200
2300
2400
Mea
n D
eca
de
Ra
infa
ll (
mm
)
Decades
Historic Mean Decade Rainfall Trend for Central Belize
1901-2009

A National Adaptation Strategy to Address Climate Change in the Agriculture Sector in Belize
79
Figure 2.10 b Central Farm, Cayo District

A National Adaptation Strategy to Address Climate Change in the Agriculture Sector in Belize
80
Figure 2.10 c: Melinda, Stann Creek District
Figure 2.10 d: Punta Gorda Agricultural Station, Toledo District
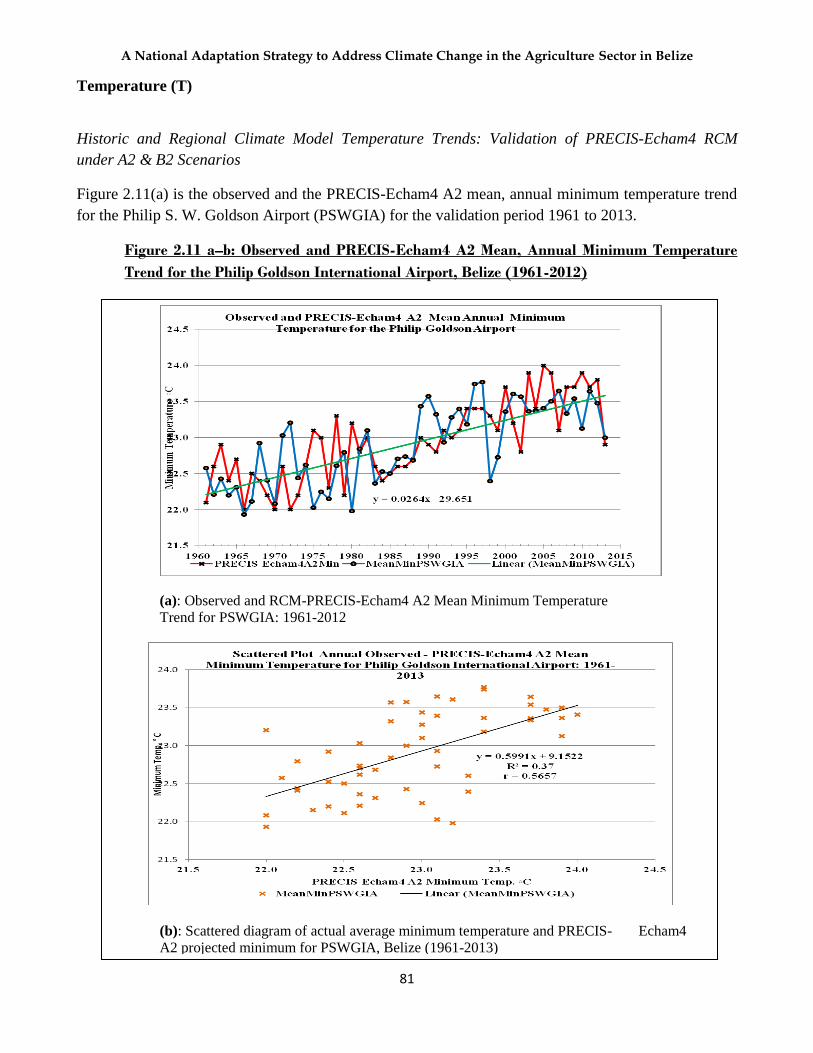
A National Adaptation Strategy to Address Climate Change in the Agriculture Sector in Belize
81
Temperature (T)
Historic and Regional Climate Model Temperature Trends: Validation of PRECIS-Echam4 RCM
under A2 & B2 Scenarios
Figure 2.11(a) is the observed and the PRECIS-Echam4 A2 mean, annual minimum temperature trend
for the Philip S. W. Goldson Airport (PSWGIA) for the validation period 1961 to 2013.
Figure 2.11 a–b: Observed and PRECIS-Echam4 A2 Mean, Annual Minimum Temperature
Trend for the Philip Goldson International Airport, Belize (1961-2012)
(a): Observed and RCM-PRECIS-Echam4 A2 Mean Minimum Temperature
Trend for PSWGIA: 1961-2012
(b): Scattered diagram of actual average minimum temperature and PRECIS- Echam4
A2 projected minimum for PSWGIA, Belize (1961-2013)

A National Adaptation Strategy to Address Climate Change in the Agriculture Sector in Belize
82
The model projected minimum temperature trace (redline) closely follows the observed, mean
minimum temperature (blue line). The curves show an increasing trend in minimum, night-time
temperature at the Airport. The observed trend in the mean, minimum temperature show an annual
increase of near 0.026 °C per annum or an increase of about 1.4 °C over the 52 years under review.
Figure 2.11 b is a regression analysis of observed and PRECIS-Echam4 A2 mean annual minimum
temperature for PSWGIA for the period 1961- 2012. The correlation coefficient ‘r’ is 0.57, which is
fairly good, meaning that PRECIS–Echam4 is explaining at-the-most 57 % of the PSWGIA mean
annual minimum temperature.
Figure 2.12 is a plot of observed monthly mean and seasonal mean minimum temperature and
PRECIS-Echam4 A2 model projection for the Airport for the period 1961-2012. As can be observed,
the modeled minimum temperature projection follows closely the observed mean minimum
temperature for this locality.
A plot of the mean minimum temperature at the Philip Goldson Airport for the more recent period
1991 – 2012, and the PRECIS-Echam4 A2 projection for the same period showed that the model was
resolving the observed minimum temperature fairly well as depicted in Figure 2.13. An increasing
trend in the mean minimum temperature of 0.01 °C per year or 0.22 °C increase in the 22 year period
was evaluated. A regression analysis of observed and modeled mean minimum for the Philip Goldson
Airport for 1991-2012 is presented in Figure 2.13 b which shows a fairly good correlation ( r = 0.83)
between the actual mean minimum temperature and the model output for the Philip Goldson Airport.
Figure 2.12: Monthly and seasonal, mean minimum temperature (1961-2012) and the PRECIS-
Echam4 model projections for the Philip Goldson Airport

A National Adaptation Strategy to Address Climate Change in the Agriculture Sector in Belize
83
Maximum temperature trend
Figure 2.14 (a) is trend analysis of the annual mean maximum temperature for Philip Goldson
International Airport for 1961-2013. The results show an increasing trend in the maximum at an annual
rate of 0.013 °C. This is equivalent of a rise of 0.66 °C over the 52 year period since 1961.
Figure 2.13 a: Actual and PRECIS-Echam4 A2
mean minimum temperature for PSWGIA, 1991-
2012
Figure 2.13 b: Scattered plot of Actual and
PRECIS-Echam4 A2 projected mean minimum
temperature for PSWGIA, 1991-2013
Figure 2.14 a: Maximum Temperature Trend
and PRECIS-Echam 4 A2 Projection for
PSWGIA: 1967-2013
Figure 2.14 b: Scattered plot of mean maximum
temperature and PRECIS-Echam4 A2 maximum
temperature for PSWGIA 1991-2013
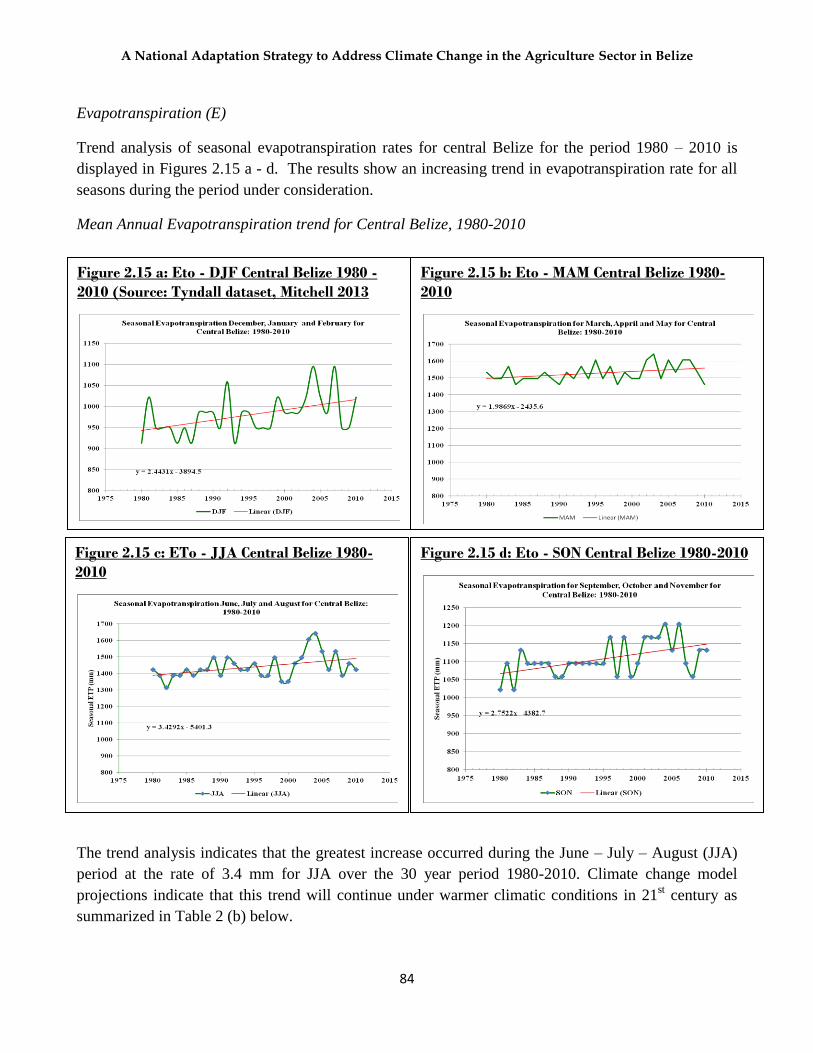
A National Adaptation Strategy to Address Climate Change in the Agriculture Sector in Belize
84
Evapotranspiration (E)
Trend analysis of seasonal evapotranspiration rates for central Belize for the period 1980 – 2010 is
displayed in Figures 2.15 a - d. The results show an increasing trend in evapotranspiration rate for all
seasons during the period under consideration.
Mean Annual Evapotranspiration trend for Central Belize, 1980-2010
The trend analysis indicates that the greatest increase occurred during the June – July – August (JJA)
period at the rate of 3.4 mm for JJA over the 30 year period 1980-2010. Climate change model
projections indicate that this trend will continue under warmer climatic conditions in 21st century as
summarized in Table 2 (b) below.
Figure 2.15 a: Eto - DJF Central Belize 1980 -
2010 (Source: Tyndall dataset, Mitchell 2013
Figure 2.15 a: Eto - DJF Central Belize 1980-2010
(Source: Tyndall dataset, Mitchell, 2013)
Figure 2.15 b: Eto - MAM Central Belize 1980-
2010
Figure 2.15 b: Eto - MAM Central Belize 1980-2010
Figure 2.15 c: ETo - JJA Central Belize 1980-
2010
Figure 2.15 d: Eto - SON Central Belize 1980-2010

A National Adaptation Strategy to Address Climate Change in the Agriculture Sector in Belize
85
The projections show that daily E rate change will be greater in the JJA and SON seasons under both
the A2 and B2 scenarios by mid 21st century and in 2075-2080 as summarized in Table 2 (b) below.
Table 2 (b): Climatology (1980-2010) and Model Projection of Evapo-transpiration rates for Central Belize
This means that the atmospheric water demand will increase during Belize’s cropping season
Sea Level Rise: Historic Trend
Local sea level rise can now only be inferred from global averages since no data is available locally.
Global trends indicate that sea levels have risen at the rate of about 0.0162 cm per annum or some 21
cm since 1880 (Figure 2.16) Although the rise in sea levels will not be the same globally (IPCC, 2007)
low lying coastal zones at or near mean sea level will be the first impacted by rising seas.
Figure 2.16: Global Sea level 1880-2010 (Source: CISRO, 2011)
Evapo-transpiration E Climatology Central Belize Projections PRECIS-ECHAM4
Seasons E Climatology Central Belize
E rate change 1980-2010
Total E Change 1980-2010
E Change 2020-2025*
E Change 2050-2055*
E Change 2075-2080*
Quarters mm/d* (mm/yr) mm A2 B2 A2 B2 A2 B2
DJF 4.4 2.4 72.0 2.0 7.9 9.9 12.0 16.7 19.6
MAM 5.7 2.0 60.0 5.7 9.9 13.4 16.5 25.3 24.0
JJA 5.4 3.4 102.0 10.2 5.7 17.8 19.6 37.8 26.5
SON 4.4 2.8 84.0 8.9 10.4 19.0 26.5 31.9 23.2
(A2 – Business-as-usual emission scenario ; B2 - Low emission scenario)
Table 2 (b): Climatology (1980-2010) and model projection of evapo-transpiration rates for central Belize (Source of
data: Mitchell, 2013). * millimeters per day
Summary of evapotranspiration (ETP) and future change for central Belize

A National Adaptation Strategy to Address Climate Change in the Agriculture Sector in Belize
86
2.3 Climate Change Projections
2.3.1 IPCC AR5 Global Climate Model Projections for Central America and the Caribbean
The Climate Modelling Inter-comparison Project 5 (CMIP-5) GCM projections under the
Representative Concentration Pathways Scenario 4.5 (RCP4.5), projects annual temperature increase
of 1.2 °C at the low end to 3.0 °C for the high end for Central America by 2100. Precipitation change
is projected to range from -17% to +9 % by the end of the century. The model projections for the
Caribbean are less but significant. An increase of 0.7 °C is projected at the low end to 2.4 °C at the
high end by 2100; and percent precipitation change is projected between -10% to +14 % (SPM WGI,
IPCC 2013). See Annex 4 for more detail on the RCP4.5 climate projection for the two sub regions of
Central America and the Caribbean.
2.3.2 Projected Sea Level Rise
The coastal lowlands in northern Belize will be vulnerable to sea-level rise according to the global
climate model projections.
By the 2090s, sea-level in this region will rise relative to 1980-1999 sea-level between:
0.18 to 0.43m under SRES B1 scenario
0.21 to 0.53m under SRES A1B
0.23 to 0.56m under SRES A2
Consequently, the region will be at high risk of coastal inundations, and increased saline intrusion into
the ground and surface water, which will reduce freshwater availability for domestic and agricultural
use. Other risks attributed to climate change are increased droughts and heat waves, intense rainfall
events and stronger hurricanes threatening this region of Belize (IPCC, 2007; UNDP, 2009; GOB, 2nd
National Communication to the UNFCCC, 2010).
In its Summary for Policy Makers for the Fifth Assessment Report, Working Group I of the IPCC
(SPM WGI AR5, IPCC 2013) reported that global mean sea level rise for 2081–2100 relative to 1986–
2005 will likely be in the ranges of 0.26 to 0.55 m for RCP2.6; 0.32 to 0.63 m for RCP4.5; 0.33 to 0.63
m for RCP6.0; and 0.45 to 0.82 m for RCP8.5 (medium confidence). For RCP8.5, the rise by the year
2100 is 0.52 to 0.98 m, with a rate during 2081 to 2100 of 8 to 16 mm yr-1
(medium confidence).
These ranges are derived from CMIP5 climate projections in combination with process-based models
and literature assessment of glacier and ice sheet contributions.

A National Adaptation Strategy to Address Climate Change in the Agriculture Sector in Belize
87
2.3.3 Regional Climate Projections
PRECIS-Echam4 and PRECIS-HADCM3 Regional model results for Caribbean, Central America and
Belize, under Climate Scenarios A2 and B2.
Figure 2.17 shows contour maps of the PRECIS-Echam4 and PRECIS-HADCM3 under the A2 and B2
scenario for mean annual rainfall change in per cent (%) across the Caribbean for the period 2071-
2100. The greater change in mean annual rainfall is in the north western Caribbean and Belize in the
order of -30 to -50 % change from climatology (1970-2000) under the A2 (business as usual) scenario
for both the PRECIS-Echam4 and PRECIS - HADCM3 regional climate models. The per cent
change in the north-western Caribbean under the B2 (lower emission) scenario is in the range of -19 to
-30 per cent for both models. These changes in rainfall coupled with the projected 3 – 4 °C increase in
mean surface temperature under the A2 scenario will very likely have far reaching effects on the
Caribbean region agriculture and food security, if prompt actions are not implemented to curb the
global emissions of greenhouse gases.
Figure 2.17: PRECIS-Echam4 & HADCM3 A2 & B2 projections of annual rainfall change
(%) in 2071-2099 relative to climatology. (Source: CCCCCs, Belize 2012)
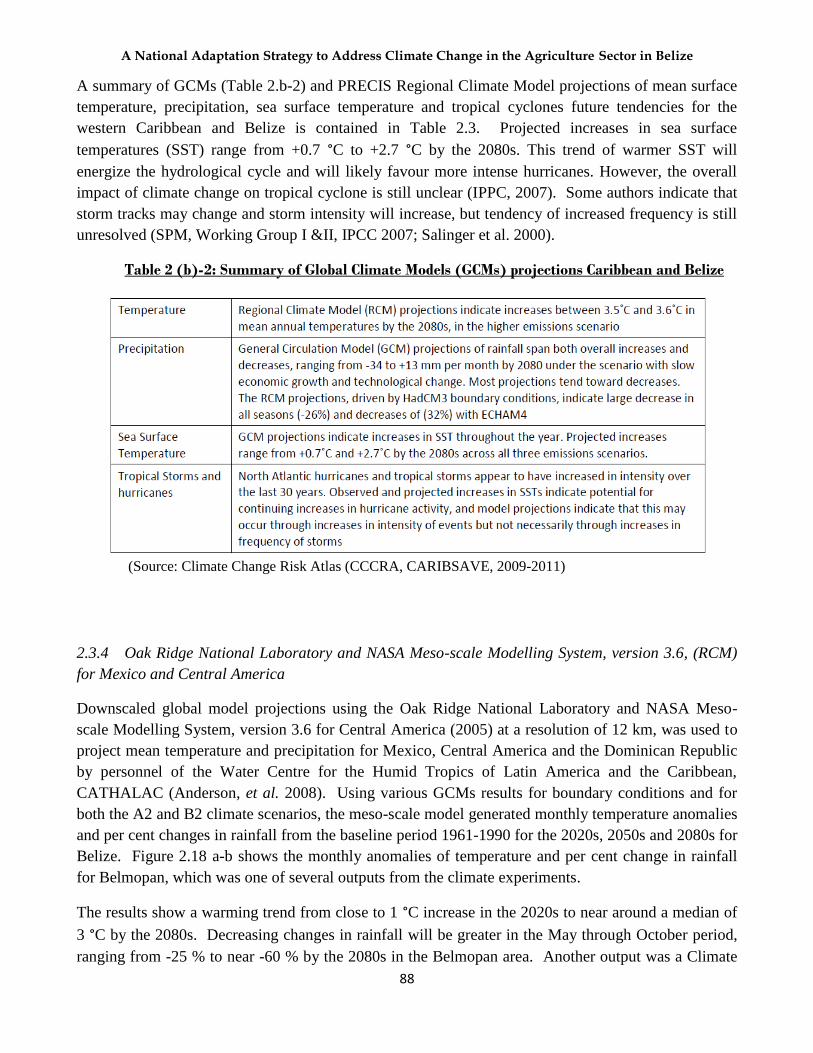
A National Adaptation Strategy to Address Climate Change in the Agriculture Sector in Belize
88
A summary of GCMs (Table 2.b-2) and PRECIS Regional Climate Model projections of mean surface
temperature, precipitation, sea surface temperature and tropical cyclones future tendencies for the
western Caribbean and Belize is contained in Table 2.3. Projected increases in sea surface
temperatures (SST) range from +0.7 °C to +2.7 °C by the 2080s. This trend of warmer SST will
energize the hydrological cycle and will likely favour more intense hurricanes. However, the overall
impact of climate change on tropical cyclone is still unclear (IPPC, 2007). Some authors indicate that
storm tracks may change and storm intensity will increase, but tendency of increased frequency is still
unresolved (SPM, Working Group I &II, IPCC 2007; Salinger et al. 2000).
Table 2 (b)-2: Summary of Global Climate Models (GCMs) projections Caribbean and Belize
(Source: Climate Change Risk Atlas (CCCRA, CARIBSAVE, 2009-2011)
2.3.4 Oak Ridge National Laboratory and NASA Meso-scale Modelling System, version 3.6, (RCM)
for Mexico and Central America
Downscaled global model projections using the Oak Ridge National Laboratory and NASA Meso-
scale Modelling System, version 3.6 for Central America (2005) at a resolution of 12 km, was used to
project mean temperature and precipitation for Mexico, Central America and the Dominican Republic
by personnel of the Water Centre for the Humid Tropics of Latin America and the Caribbean,
CATHALAC (Anderson, et al. 2008). Using various GCMs results for boundary conditions and for
both the A2 and B2 climate scenarios, the meso-scale model generated monthly temperature anomalies
and per cent changes in rainfall from the baseline period 1961-1990 for the 2020s, 2050s and 2080s for
Belize. Figure 2.18 a-b shows the monthly anomalies of temperature and per cent change in rainfall
for Belmopan, which was one of several outputs from the climate experiments.
The results show a warming trend from close to 1 °C increase in the 2020s to near around a median of
3 °C by the 2080s. Decreasing changes in rainfall will be greater in the May through October period,
ranging from -25 % to near -60 % by the 2080s in the Belmopan area. Another output was a Climate

A National Adaptation Strategy to Address Climate Change in the Agriculture Sector in Belize
89
Change Severity Index evaluated for the region, including Belize. The Climate Change Severity Index
is a combination of the Temperature Severity Index and the Rainfall Severity Index. It shows that by
the 2020s the Toledo and Corozal Districts, and the highlands of the Cayo District will be approaching
significant change in temperature and rainfall, while the rest of central and western Belize, including
most of the Orange Walk District will experience significant changes that will vary annually. Annex 4
shows a map of the Climate Change Severity Index after Anderson et. al. (2008).
Figure 2.18 a-b Temperature and Rainfall anomalies for Belmopan for: 2020s, 2050s and 2080s
a
b (Source: Anderson, et. al., 2005)
2.3.5 PRECIS Climate Model Projections
Table 2 (c) below shows a summary of the PRECIS-Echam4 A2 & B2 model projections of mean
surface temperature (°C) and per cent (%) change in rainfall in June-July-August (JJA) for various
localities in Belize for 2020-2025 and 2080-2085 relative to the baseline period 1970-2000. The

A National Adaptation Strategy to Address Climate Change in the Agriculture Sector in Belize
90
model results under both the A2 and B2 SRES scenarios at the regional level for the western Caribbean
(Figure 2.14) and at the local level over Belize project greater negative changes in the June-July-
August rainfall around and beyond mid-21st century. Mean surface temperatures at all localities in
Belize are projected to rise to near 1.0 °C by 2020-2025 relative to the 1970-2000 climatology, and to
near 4 °C by 2080-2085 (Table 2 c).
Table 2 (c): Regional Model projections of mean surface temperature and % change in rainfall for some
stations in Belize for 2020-2025 and 2080-2085 relative to the period 1970-2000
Station
Temp Trend
1961-2013
PRECIS-Echam4 Projected
Temperature Change
deg. C
Rainfall
Trend
1961-2013
PRECIS-Echam4 Projected %
Change in JJA Rainfall
deg. C/decade 2020-2025 2080-2085 mm/decade 2020-2025 2080-2085
± Min/Max/Mea A2 B2 A2 B2 ± A2 B2 A2 B2
Libertad
0.8 1.3 4.2 2.9
-30.9 -25.1 -64.8 -54.5
Towerhill
- 0.20 °C (Mea
T) 0.8 1.3 3.5 2.9 + 120 mm -32.6 -26.4 -68.9 -60.4
PSWGIA
+ 0.10 °C (Min
T) + 0.15 °C
(Max T) 1.1 1.3 4.0 2.9 + 14 mm -28.3 -24.5 -79.2 -74.0
Central Farm
1.1 1.4 4.2 3.0
-10.3 -2.0 -65.2 -51.0
Melinda
0.6 1.0 3.0 2.2
-49.6 5.1 -79.3 -38.7
Mayan King
1.1 1.3 4.0 2.2
-13.5 -26.9 -50.5 -83.3
PGAgstat
1.1 1.4 4.1 3.0
0.1 -8.8 -15.6 -57.3
TRDP
1.1 1.3 4.2 3.1
-5.0 12.1 -4.6 -22.5
(Source: PRECIS RCM climate projections, CCCCC, Belize 2014)
Figure 2.19: Actual and PRECIS-Echam4 A2 plot of annual mean minimum temperature for
PSWGIA 1991-2013, and PRECIS model projection to 2099
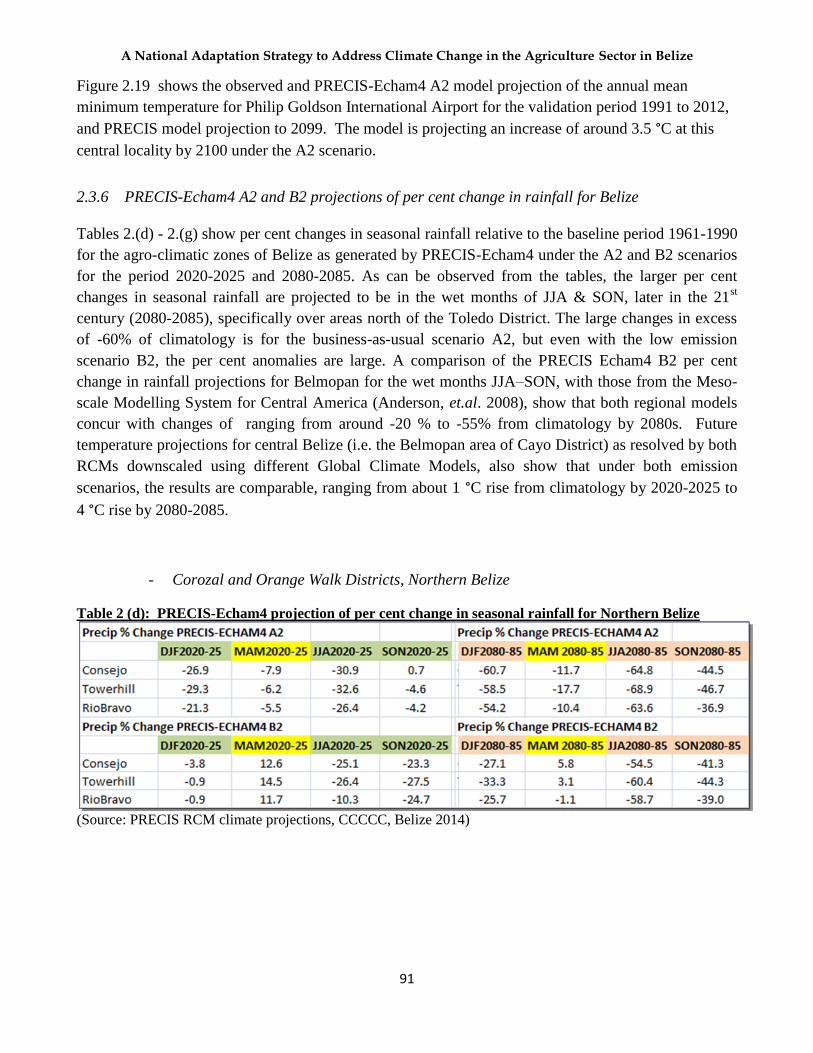
A National Adaptation Strategy to Address Climate Change in the Agriculture Sector in Belize
91
Figure 2.19 shows the observed and PRECIS-Echam4 A2 model projection of the annual mean
minimum temperature for Philip Goldson International Airport for the validation period 1991 to 2012,
and PRECIS model projection to 2099. The model is projecting an increase of around 3.5 °C at this
central locality by 2100 under the A2 scenario.
2.3.6 PRECIS-Echam4 A2 and B2 projections of per cent change in rainfall for Belize
Tables 2.(d) - 2.(g) show per cent changes in seasonal rainfall relative to the baseline period 1961-1990
for the agro-climatic zones of Belize as generated by PRECIS-Echam4 under the A2 and B2 scenarios
for the period 2020-2025 and 2080-2085. As can be observed from the tables, the larger per cent
changes in seasonal rainfall are projected to be in the wet months of JJA & SON, later in the 21st
century (2080-2085), specifically over areas north of the Toledo District. The large changes in excess
of -60% of climatology is for the business-as-usual scenario A2, but even with the low emission
scenario B2, the per cent anomalies are large. A comparison of the PRECIS Echam4 B2 per cent
change in rainfall projections for Belmopan for the wet months JJA–SON, with those from the Meso-
scale Modelling System for Central America (Anderson, et.al. 2008), show that both regional models
concur with changes of ranging from around -20 % to -55% from climatology by 2080s. Future
temperature projections for central Belize (i.e. the Belmopan area of Cayo District) as resolved by both
RCMs downscaled using different Global Climate Models, also show that under both emission
scenarios, the results are comparable, ranging from about 1 °C rise from climatology by 2020-2025 to
4 °C rise by 2080-2085.
- Corozal and Orange Walk Districts, Northern Belize
Table 2 (d): PRECIS-Echam4 projection of per cent change in seasonal rainfall for Northern Belize
(Source: PRECIS RCM climate projections, CCCCC, Belize 2014)

A National Adaptation Strategy to Address Climate Change in the Agriculture Sector in Belize
92
- Cayo District, Western Belize
Table 2 (e): PRECIS-Echam4 projection of future per cent change in rainfall for Western Belize
(Source: PRECIS RCM climate projections, CCCCC, Belize 2014)
- Stann Creek District, Southern Belize
Table 2 (f): PRECIS-Echam4 projection of future per cent change in rainfall for the Stann Creek District
(Source: PRECIS RCM climate projections, CCCCC, Belize 2014)
- Toledo District, Southern Belize
Table 2 (g): PRECIS-Echam4 projection of future per cent change in rainfall for the Toledo District
(Source: PRECIS RCM climate projections, CCCCC, Belize 2014)

A National Adaptation Strategy to Address Climate Change in the Agriculture Sector in Belize
93
Figure 2.20: Changes in Mean Monthly and Seasonal P-E
(mm/day) for 1970-2005 and PRECIS-Echam5 A2 projections
(2060-2069 for Tower Hill
2.3.7 Changes in Moisture Deficit/Surplus, Precipitation - Evapotranspiration (P – E, mm/day)
between PRECIS-Echam5 A2 Projections for 2060 – 2069 relative to 1970 – 2005 for Agro-
climatic Zones in Belize
Summaries of monthly and seasonal changes in current and future moisture deficit/surplus (i.e.
Rainfall – Evapotranspiration, P-E) for the agro-climatic zones in Belize are presented in Figures 2.19
– 2.23. In all cases the atmospheric demands for water increases, as current moisture surpluses during
the wet season decreases by 2060-2065. The analysis shows that for some localities the dry months
deficit during 2060-2069 will decrease slightly, indicating less intense dry conditions in March-April-
May (MAM). Warmer climatic conditions in the future with increased rainfall variability will favour
drier spells in the wet season. This scenario may result in a change in the main planting season which
could have negative consequences on agriculture in Belize.
2.3.8 Towerhill, Orange Walk, Northern Zone: Sugar cane and mechanized irrigated rice
The climatology (1970-2005) and the PRECIS-Echam5 A2 scenario projection of Mean Monthly and
Seasonal water deficit / surplus, (Rainfall – Evapo-transpiration, P-E) for 2060-2069 is shown in
Figure 2.20 for Towerhill. Water deficit (P<E) is observed during the drier months (January-May) in
the historic record and in the future period under review, albeit at reduced rates in the latter, while
water surplus (P>E) is evident in the wet months (June – November).
The change in water
deficit/surplus for the future
period 2060-2069, relative to
the reference period shows
decreasing water deficit
(P<E) in the drier months (a
positive change or a bit more
moisture), and increasing
water surplus (P>E) in June,
July, September and
November, except during
August when a decreasing
trend in water surplus or a
negative change is noted.
Seasonally, the change in P-E
will be such that December –
May will see decreasing
deficit or slightly more
moisture. June-August (JJA) and September – November (SON) will see increasing surplus or a
positive change, more so in SON.
The results indicate a decreasing tendency in the dry season water deficit at Towerhill for the period
2060-2069 and a higher surplus of 2 to 4 mm/day of moisture in the wet season, with the higher

A National Adaptation Strategy to Address Climate Change in the Agriculture Sector in Belize
94
positive change in SON period. However, these projections are contingent with how well the model
resolves the variability of the rainfall and evapo-transpiration locally. Analysis shows that the RCM
has poor skills in resolving the extreme rainfall events, but does much better in resolving the rainfall
tendency or trend.
2.3.9 Melinda, Stann Creek District: Citrus
The changes in P-E in the case of Melinda shows decreasing deficit (P < E) or positive change for
February – May, and decreasing surplus (negative change) for June through December as can be
observed in Figure 2.21.
Seasonally, the analysis shows fewer deficit or positive change for January-February (JF) and March-
April-May (MAM), and significantly less surplus or negative change in wet months, namely June-July-
August (JJA) and September-October-November (SON).
The agronomic implications of this means that around Melinda by mid-21st century the dry season will
be slightly less extreme, but there will be decreasing surplus of water for crops in the wet months,
which concur with earlier PRECIS-Echam4 and PRECIS-HADCM3 A2 and B2 scenario climate
predictions experiments for the western Caribbean which show drier JJA season by the 2071-2099
period (CCCCC, 2012)
Figure 2.21 Changes in Mean Monthly and Seasonal P-E (mm/day) for
1970-2005 and PRECIS-Echam5 A2 projections for 2060-2069 for
Melinda, Stann Creek District

A National Adaptation Strategy to Address Climate Change in the Agriculture Sector in Belize
95
The effects for citrus is more water stress in the wet season during fruit development phase for
established groves and the planting period for newly established groves.
2.3.10 Mayan King, Southern Stann Creek District: Banana, Aquaculture, Corn
In the Mayan King Area of South
Stann Creek the analysis of
changes in P-E for the period 2060-
2069 with respect to the
climatology (1970-2005) is shown
in Figure 2.22. Small decreases in
the dry season water deficit is
evident (i.e. positive monthly
changes), but again decreasing
surplus (P > E) are observed in
August through November
(negative changes).
Seasonally, the analysis show less
water deficit for the DJF and MAM
periods (positive changes), but
decreases in water surplus in the
wet periods of JJA and SON (i.e.
negative changes). This means that
the mid-century dry season will be
similar or a bit less dry than the
present, but the rainy seasons will
be drier than the current. The
banana crop water requirements
during the future rainy season will have to be supplemented with expanded and improved irrigation
system, especially for the August dry spell periods that could be much more extended and extreme.
2.3.11 Central Farm, Cayo District: Corn, Beans, Citrus, Livestock
At Central Farm the analysis of changes in P-E for the PRECIS-Echam5 A2 projections for 2060-2069
with respect to the climatology (1970-2005) is presented in Figure 2.23. It shows decreasing deficit
(P<E) or positive changes in the dry months and decreasing surplus or negative changes in the first half
of the wet season (JJA), but increasing surplus in the second half of the wet months (September and
Figure 2.22: Changes in Mean Monthly and Seasonal P - E
(mm/day) for 1970-2005 and PRECIS-Echam5 A2 projections for
2060-2069 for Mayan King, South Stann Creek District
Figure 2.23: Changes in Mean Monthly and Seasonal P-E
(mm/day) 1970-2005 and PRECIS-Echam5 A2 projections for
2060-2069 for Central Farm, Cayo District

A National Adaptation Strategy to Address Climate Change in the Agriculture Sector in Belize
96
October). A drop in the November – December water surplus is also resolved by the model for mid-
21st century.
Seasonally, positive changes or gains in water deficit is observed for MAM, negative changes or less
surplus in the first half of the wet season, and positive changes or increased surplus in the latter part of
the wet season.
Again, model projection of less water availability during JJA for the western Belize concurs with
earlier PRECIS-Echam4 and PRECIS-HADCM3 A2 and B2 climate prediction experiment for the
western Caribbean which shows less rainfall in the north western Caribbean and Belize during JJA in
2071-2099 period (CCCCC, 2012)
2.3.12 Changes in P – E (mm/day) Between PRECIS-Echam5 A2 Projections for 2060 – 2069 Relative
to 1970 – 2005
- Punta Gorda Agricultural Station, Southern Zone: Upland Rice, Milpa Rice, Corn and
Beans
In the South at the Punta
Gorda Agricultural Station
(PGAStat) model
projections of the changes
in rainfall deficit/surplus
(P-E) for 2060-2069 period
compared with the
climatology (1970-2005),
shows small decrease in
the deficit (P<E) or
positive changes from
January through May, and
marked decreased
(negative change, P-E = -
40 mm/day in JJA) in the
wet months water surplus for June through December (Figure 2.24). Seasonally, the small gains in
available moisture during the January-February and March-April-May periods are overshadowed by
the larger losses in water surplus during the wet months in southern Belize.
This mid-21st century moisture availability scenario for southern Belize does not hold well for main
cropping season in May-June, and sensitive phases of plant growth and crop development later during
the cropping season. These conditions will warrant major shifts in crop management in South in the
medium and long term period to avert the impacts of climate variability and change on food
production.
Figure 2.24: Changes in Mean and Seasonal P - E )mm/day) for 1970-2005
and PRECIS-Echam5 A2 projections for Punta Gorda Agricultural Station,
Toledo District

A National Adaptation Strategy to Address Climate Change in the Agriculture Sector in Belize
97
In summary, water availability for crops by mid-21st century according to the model projections will be
adequate for sugar, pastures, rice and other crops in the Northern zone during the cropping season, but
water stress could increase later. Other areas of the country are projected to experience drop in water
surplus during the wet months, which will be stressful for crops during critical periods of plant growth
and development in the main planting period, which will very likely result in reduced yields.
2.4 Crop Model Results and Impact of Climate Change in Agriculture
2.4.1 Summary of climate-crop modelling done in Belize
A review of recent crop/climate model studies for Belize indicate that the country will likely
experience drop in yields of the traditional commercial crops such as Sugar cane, orange and banana in
a 2 °C increase in temperature and variations of ±10 to ±20 % change in rainfall. Losses are also
projected for staple crops such as corn, beans, and rice due to warmer temperature by 2060 and 2080-
2100. One of the recent study on the impact of climate change in Agriculture production in Belize
(Ramirez et al., 1013), indicated accumulated losses by 2100 on the agricultural sector as a whole
approximating 35% of GDP for the baseline year of 2007, using a discount rate of 2%. The study
revealed that the greatest economic losses will be as a result of variations in rainfall.
Table 2 (h): DSSAT3 resultant crop yields for 2°C increase in temperature and ±20% change in rainfall.
Yields for maize and beans are means for 30 seasons; for rice are means for 10 seasons (Frutos and Tzul,
1995)
Crop Scenario Season Length (days)
Temperature Change °C
% Change in Rainfall
Yield (kg/ha) % Change in Yield
Dry beans C3
Baseline 1995, Carib A
87 85 85
0 +2 +2
0 +20 -20
1353.61 1163.68 1092.64
-14% -19%
Rice C3 Baseline 1995, Carib A
124 113 113
0 +2 +2
0 +20 -20
3355.50 3014.40 2887.50
-10% -14%
Maize C4 Baseline 1995, Carib A
104 97 97
0 +2 +2
0 +20 -20
4510.64 3736.57 3759.43
-22% -17%
The crop model “Decision Support System for Agro-technology Transfer (DSSAT3) was used to
simulate yields for upland rice, dry beans and corn under climate change scenarios of 1 and 2 °C
increase in temperature and ± 20% change in precipitation (Tzul and Frutos, 1995). The baseline level
of CO2 was kept near the current atmospheric concentration of 330 ppm during the simulation, and
adaptation measures by farmers to prevent losses were not considered. The objective of the simulation
was to determine the future impact of climate change on these grains.
The results as summarised in Table 2 (h) show that projected climate change caused simulated crop
yields to decrease. Percentage decrease in yields for dry beans were of the order of -19% (from the
1995 baseline) for -20% changes in rainfall, to -14% for a change +20% in precipitation. For rice,

A National Adaptation Strategy to Address Climate Change in the Agriculture Sector in Belize
98
yields varied from -14% for a -20% change in rainfall to -10% for a +20% change in rainfall.
Meanwhile, for corn the drop in yields varied from -17% for a -20% change in rainfall to -22% change
in yields for a +20% change in rainfall.
The U.S. Country Study Programme through which vulnerability studies for various sectors were
carried out in Belize (GOB/ UNFCCC, 2002) also funded a vulnerability study for coastal areas that
predicted a 50 cm increase in sea level by 2075. Sea level rise of this magnitude would exacerbate
saline intrusion into the coastal aquifers and surface water systems and would impact agriculture
especially sugar cane and banana. Coastal flooding would require farmers to look farther inland for
arable land, and search for new sources of potable water in the country’s interior. This scenario would
put more pressure on scarce arable lands and force farmers to use marginal lands and hillsides, thus
increasing the needs for intensive farming.
Santos and Garcia (2008) simulated crop yields under different climate scenarios using DSSAT4 crop
model. Environmental conditions for corn will worsen with decreasing rainfall in the first half of the
rainy season (JJA) as projected by the GCMs and RCMs under different climate change scenarios.
Similarly, a potential increase in temperature can cause a decrease in yields arising from a reduction in
the duration of the crop cycle. The study showed that climate change could favour corn production
only of the amount of rain rose during the summer and nitrogen deficiency can be managed effectively.
The same study simulated sugar cane yields based on two climate scenarios that predict increases
between 1 °C and 2.5 °C along with ± 12% in rainfall by 2028, and ±20% by 2050. A 12% reduction
was observed in sugar cane
yield by 2028, and a 17%
reduction by 2050 (Table
2.10). An increase in
temperature shortens the
growth periods of the crops,
inhibits grain filling and
decreases yields. Changes in
rainfall did not affect the
growth season, but they did affect the yields, especially when there is high rainfall variability. With
efficient and low-cost irrigation systems, sugar cane is projected to survive in a warmer climate since it
tolerates a wide range of temperatures.
Simulation of citrus yields predicted a reduction of 3% by 2028 and 5% by 2050. The increase in
temperature shortens the vegetative period of crops which decreased their yields.
Ramirez et al. (2013) analysed the potential impacts of climate change on the agriculture sector,
looking at the impacts on all agriculture production as well as the sub-sector of crops and livestock.
The crops considered in the study included the important economic crops such as sugar cane, maize,
bean and oranges.
Table 2 (i): Change in yields for sugarcane and citrus for 2028 and
2050 (Garcia & Santos, 2008)

A National Adaptation Strategy to Address Climate Change in the Agriculture Sector in Belize
99
The results of the analysis of the sectorial production function using a Ricardian model that considers
the integrated effects of temperature and rainfall revealed that climate change will have negative
impacts on the agricultural sector due to increased temperature and rainfall variability. The
accumulated losses by 2100 on the agricultural sector as a whole approximate 35% of GDP for the
baseline year of 2007, using a discount rate of 2%. It was found that the greatest economic losses will
be as a result of variations in rainfall (see Annex III F) for the year 2100 under the A2 scenario.
A look at scenario A2 and B2 and a 4% discount rate accumulated until 2050, losses would be about
12% and 5% of the 2007 GDP, respectively. Counting the negative impacts until 2100 with the same
discount rate, the accumulated economic losses will make up 16% and 7% of 2007 GDP, respectively.
In view of a 2% discount rate, losses will increase to 35% under the A2 scenario and to 16% in the B2
scenario by 2100. In the case of Crop production at 2% discount rate under scenario A2 and B2, losses
by 2100 will be about 30% of GDP and about 15% of GDP, respectively.
The economic impacts of climate change on corn, beans, sugar cane and orange for both B2 and A2
scenarios for discount rates of 0.5, 2.0, 4.0 and 8.0 % of GDP for 2007 was also conducted. Under the
B2 and A2 scenarios and a 2% discount rate, Ramirez, et al. (2013) evaluated losses in corn crop
production by the year 2100 of the order of 5 % under both scenarios; 1.4 % to 2.4 % of 2007 GDP
losses in beans by 2100; and losses of 4% and 6% of 2007 GDP for orange under the B2 and A2
scenarios respectively. In the case of sugar cane, the results of the modelling show that production of
this crop will tend to fall in the medium to long term future. Under the A2 scenario the model reveals
major decline, even dropping to zero by the end of the period. The depressed yields do not factor in
possible adaptation measured farmers my implement in the future. It can be seen that the positive
effects that climate change could bring to sugar cane production in the short term would reverse over
the long term; in accumulated terms by 2100, the economic effects would be negative, reaching losses
of between 2% and 5% of 2007 GDP. This would occur at a discount rate of 2%, but lower rates would
produce greater adverse effects.
Singh et al. (2013) use the crop model DSSAT-CANEGROW to simulate aerial dry biomass at harvest
(t/ha) and sucrose dry mass at harvest (t/ha) for sugarcane production in the Orange Walk District with
observed Tower Hill station and modelled ECHAM5 and HadCM3Q11 climate data for 2000-2009
decade.
The results showed that for 2060-2069 production of aerial dry biomass for sugarcane at harvest will
be reduced by -12.7% with the PRECIS-ECHAM5 model, and -20.9% with the PRECIS-HadCM3Q11
model. In the case of sucrose dry mass at harvest, the simulation results show a reduction of -21.7%
with the PRECIS-ECHAM5 and -28.2% with the PRECIS-HadCM3Q11 model respectively.
Increased temperature results in increased rate of photorespiration which causes the sugar cane to
convert sucrose to glucose and fructose, reducing sugar concentration which leads to a reduction in
yields (Singh et al., 2013).

A National Adaptation Strategy to Address Climate Change in the Agriculture Sector in Belize
100
CROPWAT 8.0 Simulation of Future Yields for Dry Beans and Corn in Belize
A simulation a was conducted for dry beans and corn to determine per cent yield reduction in the year
2050 through 2055 using FAO CROPWAT 8.0 crop modelling software. The agronomic and climate
reference year was 1998, and the future climate projection for the period was derived from the output
of the PRECIS-Echam5 A2 (25 km resolution) experiment conducted for the western Caribbean.
The crops chosen for the simulation were Dry Beans and Corn, primarily because of their importance
as staple grains in Belize. Red Kidney beans was the variety of choice but the crop coefficient for R.
K. beans was not available, therefore the reference crop coefficient value for dry beans was utilized
which is similar to that of R. K. beans.
Three sites were selected for the simulation, namely: Central Farm (Cayo District), Towerhill (Orange
Walk District) and the Toledo Research and Development Project site (TRDP) near Blue Creek
Village, Toledo District. The main agronomic parameters considered in the simulation were soils:
primarily light sandy, medium loam and heavy clay. The cropping system was assumed to be rain-fed
mechanized, and in the case of Corn, the simulation was run for early planting (one month before the
normal planting period in June), normal and late (one month after the normal planting period in June).
The normal planting period in December was use in the simulation for Dry Beans. The simulation was
run for each year from 2050 to 2055.
Table 2 (j): CropWat simulation of per cent yield reduction for corn and dry beans for 2050-2055 based
on PRECIS-Echam5 A2 climate projections for Belize
(Source: Frutos and Gladden, 2014)
Table 2 (j) shows the per cent yield reduction for Corn and Dry Beans for the reference year 1998, and
for 2050, 2053 and 2055. The results for future Corn yields, shows a per cent reduction in yields from
the reference year 1998, ranging from zero change in some instance, primarily for the medium and

A National Adaptation Strategy to Address Climate Change in the Agriculture Sector in Belize
101
heavy soils, to reduction in the order of 60 to 73 per cent of baseline yield, for the normal and early
planting period in 2050 and 2053 respectively. Note also that these large percentage reductions in
yields are specifically for the light sandy soils. In general, the least per cent reduction in yields are
noted with the medium loam and heavy clay soils over the three years under review, and a later
planting date.
In the case of Dry Beans, the greater per cent reduction in yields were noted for the light soil at Central
Farm and Towerhill for the three years under review, and smaller per cent reduction in yields for the
medium loam soil at TRDP and at Tower Hill for all three years under review. The simulation did not
considered agronomic practices or new technology that can help mitigate the unfavourable conditions
that might cause the reduction in yields.
Based on the results of this simulation that considers the projected increased in water stress during the
main growing period in Belize, farmers may have to adjust planting time, install efficient irrigation
systems, improve soil fertility and plant short-period and heat resistant varieties of Corn and Beans.
2.4.2 Climate Change Impacts on Pests
A pest is any organism (plant, animal, micro-organism) that, left uncontrolled, will cause economic
damage to a commodity (host) that is being produced for a specific purpose. Pests, which include
insects, mites, other arthropods, pathogens, nematodes, weeds, and vertebrates, are major constraints to
agricultural productivity by directly damaging crops, causing illness in livestock, and inducing plant
stress that decrease yields. Crop diseases are caused by viruses (which require a vector), fungi, bacteria
or higher plants. Globally, pre-harvest and post-harvest losses attributed to insects, weeds, and plant
pathogens are estimated at 45% (Pimentel, 1991); additional losses are caused by vertebrate pests.
Climate change is likely to change the physiology of host-pest interactions by altering the rates of
development of different stages of pests whilst also modifying resistance of the host to such pests, for
example, increased temperature causing change in growth pattern of host and length of growing season
can cause asynchrony with insect biological cycle which may reduce or increase risk for pest damage.
Each pest has its optimum meteorological requirements and it is expected that Climate Change will
result in a geographical re-distribution of pests at the global level, whereas the incidence and severity
of pest outbreaks will be affected by local weather conditions.
Arthropod pests (insects, mites) are likely to be most affected by temperature changes since they are
exothermic and cannot self-regulate their internal temperature. Generally, an increase in temperature
will increase the rate of development of an arthropod up to its optimum temperature level. Arthropods
generally proliferate under decreased precipitation but certain levels of moisture are required for their
development. Contrarily, disease pathogens are mostly affected by relative humidity (especially the
crop canopy micro-climate) and temperature. Usually increased relative humidity leads to an increased
rate of spread of fungal and bacterial pathogens although some species thrive under decreased
humidity. Heavy rains causing flooded soils will directly increase spread of disease agents, as well as
A National Adaptation Strategy to Address Climate Change in the Agriculture Sector in Belize
102
cause cultivation problems thereby increased risk of root infection. Similarly drought and other stresses
reduce plant immunity and capacity to cope with infections.
Weed competition with crop plants will be influenced by all the Climate Change factors of
temperature, rainfall amount and distribution, flora and fauna species complement, carbon dioxide
levels and soil conditions (salinity, nutrient/mineral availability, microorganisms). Many weeds are
C37 plants which will be favoured by an increase in CO2 expected with climate change.
Pest Modelling
Pest models are usually developed using data from classical experiments in population ecology and
previous pest models describing the effects of temperature and humidity on pest development, then
meteorological data is extrapolated to the Climate Change scenarios proposed by the
Intergovernmental panel on Climate Change (IPCC).
Pest models have to be developed individually for specific crop-pest interactions. Due to the various
meteorological, biological and agro-ecological variables involved in pest-crop interactions at field
level (for example: alternative food source, plant stress or resistance, biomass and pest-predator
interactions), models developed for a particular region would not necessarily work in another region.
There is also a level of uncertainty in the prediction of pest- host interactions and eventual results
because the many factors (biotic and abiotic) that will influence the interaction cannot be predicted
based on current knowledge. Viruses need a vector (usually an insect or nematodes) in order to spread.
Viral infection is therefore related to the presence of the vector (e.g. the Brown Citrus Aphid in the
spread of Tristeza virus (CTV) in citrus and the Asian Citrus Psyllid (Diaphorina citri) which is the
vector for the devastating citrus disease known as Huanlongbing (HLB). Hence, a knowledge of the
biology of the vector in relation with weather parameters or microclimatic conditions (e.g. humidity
and temperature) are required to model the vector life cycle and apply effective control when it is most
vulnerable.
Species that are affected primarily by climatic conditions (Temperature and Relative Humidity) will
respond more predictably to Climate Change than those species that are more limited by other abiotic
or biotic factors, for example: competition, host plants, natural enemies or soil conditions. Models for
arthropod pests may be less complex and data may be easier to obtain (pest numbers) than that of
disease pathogens e.g. infection sites without symptoms, inoculum build up over time and seasons, and
overlap of infections on same host that make it difficult to determine the occurrence of new infections.
The data required for pest and disease forecast includes rainfall, temperature, relative humidity, solar
radiation, dew point, wind speed, height and direction, leaf area index, crop variety, crop phenology,
growth stages of pest and pathogen, pest population and intensity.
In connection with the Caribbean Agro-meteorological Initiative started in 2010, technical personnel of
CARDI and the Caribbean Institute of Meteorology and Hydrology (CIMH) were trained in the use of
pest and disease simulation models by two crop model experts from the University of Florence, Italy.
7 C3 Plants refer to crops such as rice, wheat, soybeans, fine grains, legumes, and most trees, which have a lower
rate of photosynthetic efficiency

A National Adaptation Strategy to Address Climate Change in the Agriculture Sector in Belize
103
Part of the training included the development of simulation models for some pests and diseases of
economic importance in the Caribbean. Selected for modeling were: 1) Black Sigatoka
(Mycospharella fijiensis) which affects bananas and plantains (Musa spp.), Soyabean Rust
(Phakopspora pachyrhizi), and an arthropod pest, the Asian Citrus Psyllid (Diaphorina citri) which is
the vector of the devastating citrus disease known as Huanlongbing (HLB) or citrus greening as it is
locally called. These pests were selected after consultations with the national Crop Protection
Specialist of the Caribbean Region (Rasheeda, et al., 2012). The calibration phase of the models is
underway.
Black Sigatoka disease model
Common name pathogen: Black Sigatoka
Kingdom: Fungi
Division: Ascomycota
Class: Dothideomycetes
Order: Mycosphaerellales
Scientific names: Mycosphaerella fijiensis
Host Banana (Musa sapientum)
The model describes the infection caused by ascospores produced by the pathogen.
The fungus is haploid through most of its life cycle and reproduces both asexually and sexually, via
conidia and ascospores, respectively. Because M. fijiensis produces relatively few conidia, ascospores
are considered to be more important in the spread of black Sigatoka (Fig. 1) (Gauhl, 1994; Stover,
1980; 1983). According Jacome et al. (1991), conidia become more important during dry periods when
disease development is delayed because of the presence of less conducive climatic conditions.
Ascospores are the primary means of dispersal over longer distances within plantations and into new
areas, and are the usual means of spread during extended periods of wet weather (Fullerton, 1994;
Gauhl, 1994; Gauhl et al., 2000; Jeger et al., 1995; Meredith et al., 1973).

A National Adaptation Strategy to Address Climate Change in the Agriculture Sector in Belize
104
Figure 2.25 a: Black Sigatoka disease cycle. Source: Gauhl, 1994
Figure 2.25 b: Seasonal variation of ascospores and conidi in the Caribbean zone of Costa Rica.
Source: Gauhl, 1994
Ascospores are produced in pseudothecia in mature lesions, which are common on both sides of the
leaf surface. The ascospore release requires the presence of a film of water from rain or dew that
imbibes the pseudothecia and results in the forcible ejection of the ascospores through the leaf
boundary layer, where they are disseminated by air currents. During infection the Germ tubes take
approximately 48 to 72 h to penetrate the stomata. Successful infection is promoted by extended

A National Adaptation Strategy to Address Climate Change in the Agriculture Sector in Belize
105
periods of high humidity and the presence of free water on the leaves; Maximum germination occurs
when free water is available on the host plant tissues.
Model phases
The model has as inputs hourly mean temperature, hourly relativity humidity and daily or hourly
precipitation data.
The model considers different phases.
i) Ascospores Formation
ii) Ascospore Discharge
iii) Infection
The Infection takes place during periods of leaf wetness. Under optimum temperature
(27°<T<30°C) infection is completed in 12 hours of moist conditions. If temperature is not
optimal, this phase needs more time following the equation shown in Figure 4 (Jacome and
Aschuh, 1992; 1993; Jacome et al., 1991; Chuang and Jeger, 1987; Stover, 1983)
Figure 2.25 c: Infection duration with different levels of temperature
By multiplying the daily infection development
determined using the described function and the
% of ascospore release, daily level of infection
risk was estimated.
iv) The Risk Index
The risk index was obtained by combining the infection level obtained with the described method
and the risk level due to meteorological conditions. Two methods can be used, the first based on
evapotranspiration and the second considering rainfall.
The first method considers Potential Evapotranspiration. Taking into account available data,
Hargreaves-Samani formula (1982) was used, but other methods can be considered in different
conditions.
In particular the risk ETP index is based on accumulated ETP during the last 7 days:
y = 0.3278x2 - 18.983x + 286.84 R² = 0.9997
0
5
10
15
20
25
30
0 10 20 30 40
Infe
ctio
n d
ura
tio
n (
h)
Temperature (°C)

A National Adaptation Strategy to Address Climate Change in the Agriculture Sector in Belize
106
- infection with 0 mm rain: severity = 1
- infection with < 2.5 and 10 mm of rain: severity = 2, 3, 4.
- infection with > 10 mm of rain: severity = 5.
The risk is determined considering the accumulation of this
severity values for the last 4 days.
- 0 there is no risk = 1
- lesser than 4 there is a risk = 2
- between 4 and 12 there is a moderate risk = 3
- higher than 12 there is a high risk = 4.
The final risk index is calculated with the following equation:
infection level * risk RAIN index.
Figure 2.25 d: Evapotranspiration Index
ETP ETP Index
40 mm No Risk = 0
> 30 mm Low Risk = 1
> 22 mm Average Risk = 2
< 22 mm High Risk = 3
The final risk index is calculated with the following equation:
Infection Level * risk ETP index
The second risk evaluation model uses the amount of precipitation during the infection events:
Figure 2.25 e: Risk Evaluation Model
2.4.3 Constraints to Climate Change Pest Models
Apart from the fact that the predictive ability of pest models are questionable with respect to field
reality and unknown factors of the future e.g. landscape changes, there are several constraints to CC
pest models which must be considered:
o Information must be disseminated therefore users (farmers) must have access to devices or
means of dissemination used and some models require purchase and maintenance of expensive
equipment/devices.
o The more comprehensive (complex) the model is, the more accurate, but also more difficult to
input data. There is need to develop user friendly models with reasonable predictability levels
depending on the end user because an unused model is useless.

A National Adaptation Strategy to Address Climate Change in the Agriculture Sector in Belize
107
o Confidence building and trust (ex. in the meteorological service) has to be developed for
farmers to use the technology
2.4.4 Impact assessment of Major Commodities
1. General impacts of climate change on agriculture include direct yield decreases of crops as a
function of shorter maturation cycles due to the faster accumulation of degree days which
control the physiological growth of all living organisms.
2. Increased temperature could adversely affect agriculture through its effect on increased insect
activity (including vectors), increased disease rate of development, decrease in crop yield, heat
stress on livestock, decreased performance of selected or “improved” pasture grasses and
changes in soil micro-organisms.
3. Periods of excessive rainfall lead to flooding which causes direct crop and livestock losses, soil
erosion and decreased productivity, faster spread of certain crop diseases (fungal and bacterial),
difficulty in cultivation practices, difficulty with harvesting and transportation, and affects
application of crop and livestock treatments.
4. Periods of drought cause stress on crops (losses or decreased yields) and livestock (food and
water stress), and favours spread of certain fungal diseases (e.g. rust).
5. Rainfall unpredictability adversely affects timing of crop production operations.
6. Increased carbon dioxide could have positive effects on yields of certain C3 crops from carbon
dioxide fertilization but may also generally increase growth of C3 weeds leading to increased
competition.
7. Sea level rise may affect crop and livestock production by flooding in coastal areas, and cause
salt water intrusion hampering irrigation operations on coastal crops.
Table 2 (k): Matrix of Climate Variability and Climate Change Impacts on Agriculture
and Water in Belize
Sectors Risks Climate Change Impacts
Agriculture Sugarcane crop and sugar production exposed to
recurrent floods in the Orange Walk and Corozal
Districts. Also, extended droughts and high
temperatures affect yields. High humidity and
warmer temperature favor pests such as
froghopper.
Citrus and banana crops are especially vulnerable
to wind and flood damage in the Stann Creek,
Toledo and Cayo Districts. Citrus Greening
(Huanlongbing, HLB) could become devastating
if not contained.
Drought and high temperatures stress banana
plants. High humidity favours increased incidence
Expected 1–2 °C increase in ambient
temperature by mid-21st century and
changes in seasonal rainfall of by ± 10%
are predicted to lower yields of beans, corn,
and rice by some 10%. Crop model results
for Belize concur with this finding.
Yields of sugar and citrus are predicted to
remain stable at first, then diminish with
increased rainfall variability and
temperature increase after 2050.
Banana, citrus and emerging vegetable
crops will experience increased stress in a
warmer temperature environment and
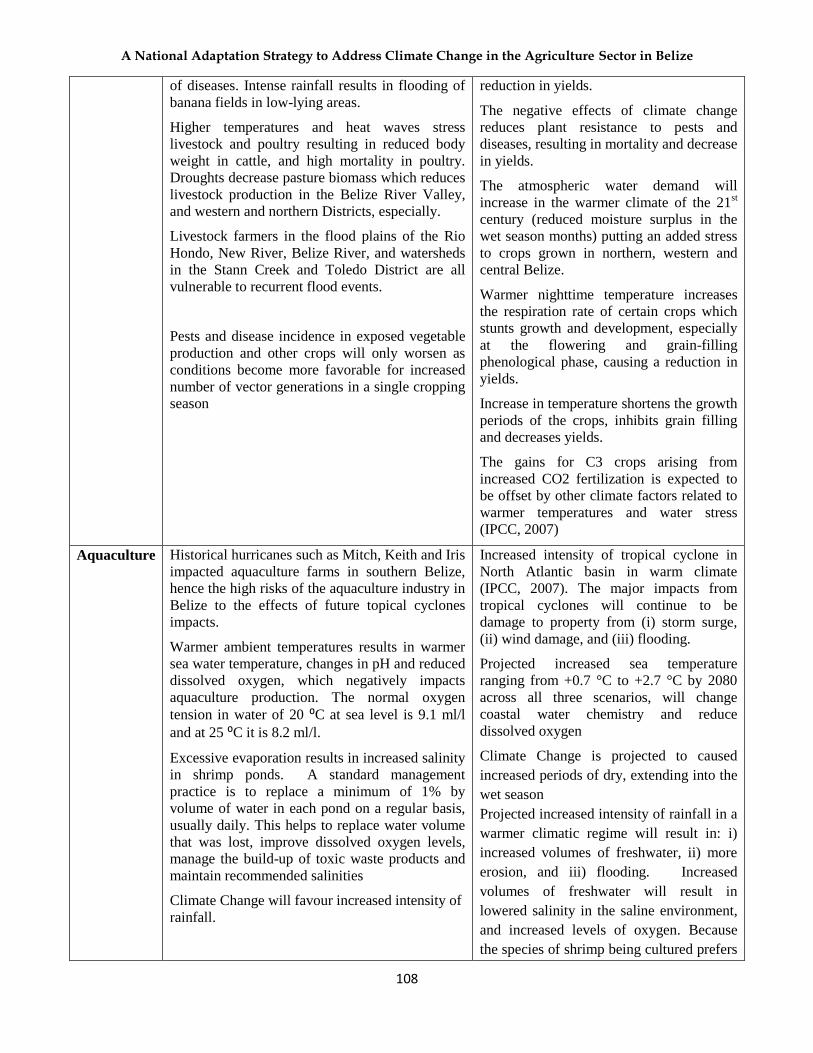
A National Adaptation Strategy to Address Climate Change in the Agriculture Sector in Belize
108
of diseases. Intense rainfall results in flooding of
banana fields in low-lying areas.
Higher temperatures and heat waves stress
livestock and poultry resulting in reduced body
weight in cattle, and high mortality in poultry.
Droughts decrease pasture biomass which reduces
livestock production in the Belize River Valley,
and western and northern Districts, especially.
Livestock farmers in the flood plains of the Rio
Hondo, New River, Belize River, and watersheds
in the Stann Creek and Toledo District are all
vulnerable to recurrent flood events.
Pests and disease incidence in exposed vegetable
production and other crops will only worsen as
conditions become more favorable for increased
number of vector generations in a single cropping
season
reduction in yields.
The negative effects of climate change
reduces plant resistance to pests and
diseases, resulting in mortality and decrease
in yields.
The atmospheric water demand will
increase in the warmer climate of the 21st
century (reduced moisture surplus in the
wet season months) putting an added stress
to crops grown in northern, western and
central Belize.
Warmer nighttime temperature increases
the respiration rate of certain crops which
stunts growth and development, especially
at the flowering and grain-filling
phenological phase, causing a reduction in
yields.
Increase in temperature shortens the growth
periods of the crops, inhibits grain filling
and decreases yields.
The gains for C3 crops arising from
increased CO2 fertilization is expected to
be offset by other climate factors related to
warmer temperatures and water stress
(IPCC, 2007)
Aquaculture Historical hurricanes such as Mitch, Keith and Iris
impacted aquaculture farms in southern Belize,
hence the high risks of the aquaculture industry in
Belize to the effects of future topical cyclones
impacts.
Warmer ambient temperatures results in warmer
sea water temperature, changes in pH and reduced
dissolved oxygen, which negatively impacts
aquaculture production. The normal oxygen
tension in water of 20 ⁰C at sea level is 9.1 ml/l
and at 25 ⁰C it is 8.2 ml/l.
Excessive evaporation results in increased salinity
in shrimp ponds. A standard management
practice is to replace a minimum of 1% by
volume of water in each pond on a regular basis,
usually daily. This helps to replace water volume
that was lost, improve dissolved oxygen levels,
manage the build-up of toxic waste products and
maintain recommended salinities
Climate Change will favour increased intensity of
rainfall.
Increased intensity of tropical cyclone in
North Atlantic basin in warm climate
(IPCC, 2007). The major impacts from
tropical cyclones will continue to be
damage to property from (i) storm surge,
(ii) wind damage, and (iii) flooding.
Projected increased sea temperature
ranging from +0.7 °C to +2.7 °C by 2080
across all three scenarios, will change
coastal water chemistry and reduce
dissolved oxygen
Climate Change is projected to caused
increased periods of dry, extending into the
wet season
Projected increased intensity of rainfall in a
warmer climatic regime will result in: i)
increased volumes of freshwater, ii) more
erosion, and iii) flooding. Increased
volumes of freshwater will result in
lowered salinity in the saline environment,
and increased levels of oxygen. Because
the species of shrimp being cultured prefers

A National Adaptation Strategy to Address Climate Change in the Agriculture Sector in Belize
109
Erosion is a constant concern in pond aquaculture;
erosion mitigation and control is a standard part
of the design and management of pond
infrastructure. If pond banks are properly
maintained, erosion as a result of increased
rainfall is not expected to be a major concern. If
properly drained, flooding is not expected to be a
major concern on aquaculture farms.
salinity between 10 % - 25% (parts per
thousand) increased rainfall will not be a
concern until the salinity falls below 10 %.
The benefit will be increased volumes of
fresh oxygenated water.
Water
Resources
Inadequate drainage of many farm lands lead to
extensive and devastating water logging and
dieback of crops and disease outbreak in livestock
in the wet season and during big flood events.
Water catchments to harvest water during rainy
season are limited, increasing the risk of water
shortage in the dry season for livestock and
croplands located away from rivers.
Water for irrigation is projected to become scarce
during extended dry spells in the sugarcane, rice
and banana growing areas, which will directly
impact yields.
Saline intrusion is already problematic in some
areas of the coasts, impacting freshwater supply
for domestic and industrial use, and water quality
for crops.
Sea level rise will favour salt water
intrusion particularly in the cayes and over
the coastal low lands of Belize, impacting
cultivation near coastal northern Belize
District and Corozal District.
Changes in evaporation rates and rainfall
variability is already affecting water
resources.
Significant reduction in rainfall around and
beyond mid-21st century will lead to soil
desiccation in some agricultural zones.
Table 2 (l): Risks, Climate Change Impacts and Adaptation Strategy for Crops and Livestock
Crops, Livestock and Aquaculture
Risks Climate Change Impacts Adaptation Strategy
1) Sugarcane
a) Saline intrusion due to sea level rise Flood, pests, high winds
Increased extreme weather (i.e. stronger Tropical Cyclone events and extended dry spells in the wet season), increased pests incidence will result in decreasing yields
- Improved drainage and install efficient irrigation systems; - plant heat, pest, and flood resilient varieties, and also early-maturing varieties.
2) Citrus Floods , drought, pests and diseases
Spread of new pests and diseases, increased extreme events, decreased in yields
- Improved drainage, - plant pest and heat resistant varieties. - Improve sterilization/sanitation of nurseries
3) Banana Flood, high winds, drought, pests and diseases
Increased extreme events, spread of new pests and diseases, decrease in water resources, decreased in yields
- Upgrade and maintain drainage and irrigation systems. - Conserve water for processing, - - Plant flood, heat and pest / disease resistant varieties Introduce IPM
4) Corn Excessive rainfall, droughts and high temperature, pests
Increased heat waves, droughts and periodic excessive rainfall, increased pests incidence, decrease in yields
- Plant heat and pest resistant and early maturing varieties, - introduce improved IPM, - adjust planting date to match rainfall pattern, - improve soil fertility

A National Adaptation Strategy to Address Climate Change in the Agriculture Sector in Belize
110
5) Rice Droughts, pests and diseases
Increased extreme events, spread of new pests, decreased water resources, decreased in yields
- Plant heat and pest resistant varieties, - practice IPM, and conserve water by installing improved irrigation systems, - conserve soils.
6) Beans High temperature, excessive rainfall, pests and diseases
Increase in extreme events, increased pests incidence, decrease in yields
- Adjust planting date to match rainfall pattern, - improve soil fertility, - practice IPM, - plant heat and pest resistant varieties, - plant higher yielding varieties,
7) Vegetables High temperature, drought, excessive rainfall, pests
Warmer ambient temperature, periodic excessive rainfall, increased pests incidence
- Erect improved crop cover structure, - fertigation, - practice IPM, - use organic crop technology, - plant heat and pest resistant varieties, and high- yielding varieties
8) Cattle, sheep High temperature, droughts, diseases,
Heat waves and droughts leading to increased stress, spread of new diseases
- Plant heat and pest resistant and high yielding grass varieties, - upgrade herd with breed that have high resilience to warmer conditions, - improve hay and silage production, - have flood contingency plan to reduce flood risks.
9) Poultry High temperature, diseases
Heat waves and droughts leading to increased stress and mortality, spread of new diseases
- Have improved aeration for poultry house, - raise heat resistant breed, practice integrated disease management.
10) Aquaculture (Shrimp )
Increase sea surface temperature,
Salinity, Sea Surface Temperature (SST), decreased Dissolved Oxygen (DO), change in pH.
- Efficient aeration systems, - improved pond management
3. ADAPTATION STRATEGIES TO ADDRESS THE ADVERSE EFFECTS OF
CLIMATE CHANGE ON AGRICULTURE
There are multitude adaptation strategies to address the adverse effects of Climate Change in
agriculture. Many of these were discussed with the key stakeholders to get their input, insights and
make use of the collective wisdom of those intimately involved with coping with agricultural
challenges on a daily basis. Some of the adaptation measures being recommended for specific impacts
of climate change on the agriculture sector include:
Flooding: Site selection, flood management mechanism at community level, cambering, vegetation
management to prevent erosion, road infrastructure, drainage schemes with suitable engineering
designs, clearing of drainage outlets, wetlands management, weather forecasting promote native
adapted pasture species.

A National Adaptation Strategy to Address Climate Change in the Agriculture Sector in Belize
111
Saltwater intrusion: Manage water extraction, water harvesting for irrigation source, site selection,
water use efficiency (drip irrigation and fertigation), seasonal location where possible, high technology
(infrastructure) systems to combat intrusion, land use allocation, species, breeds and cultivar selection,
agroforestry.
Pests and diseases: Pest modelling, ecological refuges for arthropod, bird and mammal pests, forest
management, biological control, protective cropping including structures, floating pest covers and fruit
protection, communal pest management, seasonal production where possible, soil amendment,
intercropping, crop spacing (micro-climate management), germplasm diversity, selective pesticides
(preserve beneficials, species, breeds and cultivar selection, vegetation barrier for chemical and genetic
overflows, Integrated Pest Management (IPM).
Weeds: Biodegradable mulch, land preparation, timing of cultivation, intercropping, drip irrigation.
Drought: Water harvesting, watershed management, soil amendments, composts, economic cost of
water, drip irrigation, water recycling through aquaponics, drought feeding plan for livestock, species,
breeds and cultivar selection.
Increased temperature stress Irrigation, improved nutrition management to combat yield losses,
species, breeds and cultivar selection, livestock infrastructure design, silvopastoral system for cattle.
Other general remedial measures can include use of appropriate energy sources, research, monitoring
changes in weather patterns and commodity responses including pest dynamics, soil microorganism
monitoring and management, commodity insurance, storage, germplasm banks for selected tolerant
cultivars, marketing efficiency, planning of production, community resilience, training, identification
of new product niches, agro-processing and production of technological alternatives e.g. recycling of
waste material scheme for overall production efficiencies.
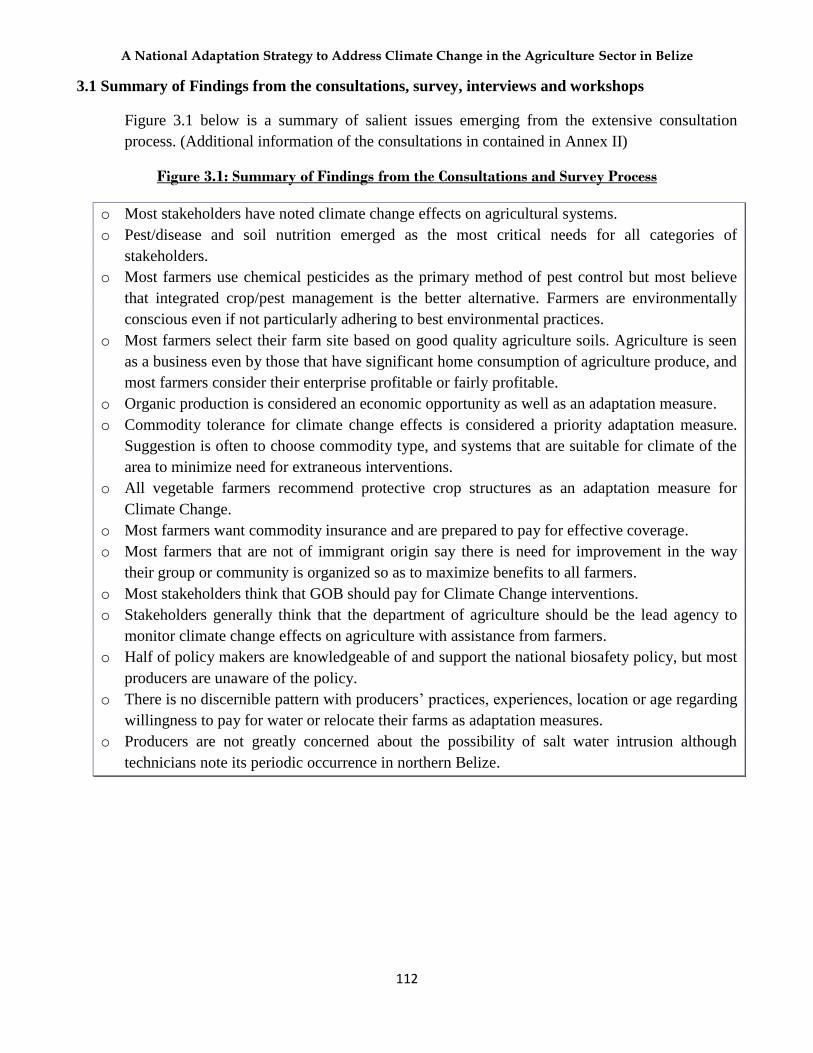
A National Adaptation Strategy to Address Climate Change in the Agriculture Sector in Belize
112
3.1 Summary of Findings from the consultations, survey, interviews and workshops
Figure 3.1 below is a summary of salient issues emerging from the extensive consultation
process. (Additional information of the consultations in contained in Annex II)
Figure 3.1: Summary of Findings from the Consultations and Survey Process
o Most stakeholders have noted climate change effects on agricultural systems.
o Pest/disease and soil nutrition emerged as the most critical needs for all categories of
stakeholders.
o Most farmers use chemical pesticides as the primary method of pest control but most believe
that integrated crop/pest management is the better alternative. Farmers are environmentally
conscious even if not particularly adhering to best environmental practices.
o Most farmers select their farm site based on good quality agriculture soils. Agriculture is seen
as a business even by those that have significant home consumption of agriculture produce, and
most farmers consider their enterprise profitable or fairly profitable.
o Organic production is considered an economic opportunity as well as an adaptation measure.
o Commodity tolerance for climate change effects is considered a priority adaptation measure.
Suggestion is often to choose commodity type, and systems that are suitable for climate of the
area to minimize need for extraneous interventions.
o All vegetable farmers recommend protective crop structures as an adaptation measure for
Climate Change.
o Most farmers want commodity insurance and are prepared to pay for effective coverage.
o Most farmers that are not of immigrant origin say there is need for improvement in the way
their group or community is organized so as to maximize benefits to all farmers.
o Most stakeholders think that GOB should pay for Climate Change interventions.
o Stakeholders generally think that the department of agriculture should be the lead agency to
monitor climate change effects on agriculture with assistance from farmers.
o Half of policy makers are knowledgeable of and support the national biosafety policy, but most
producers are unaware of the policy.
o There is no discernible pattern with producers’ practices, experiences, location or age regarding
willingness to pay for water or relocate their farms as adaptation measures.
o Producers are not greatly concerned about the possibility of salt water intrusion although
technicians note its periodic occurrence in northern Belize.

A National Adaptation Strategy to Address Climate Change in the Agriculture Sector in Belize
113
3.2 Proposed Adaptation Measures
Figure 3.2 shows a schematic of the response
curve for crop production. As illustrated, the
limiting factors for yields include seed variety,
water requirement and availability, pests, crop
climate (climate variability), soil and nutrients
availability. Under the projected warmer
conditions with increasing rainfall variability
in Belize and in the region, crop yields will be
determined by how effectively adaptation
measures are implemented and managed in
order to avert detrimental effects of the
limiting factors that climate change could, to a
larger extent, exacerbate.
Based on current information regarding possible adaptation measures, the status of the agricultural
sector including its policy and institutional framework, consultations with stakeholder groups and
analyses of responses, and the understanding that the strategy and action plan cannot realistically
undertake all possible adaptation measures, the following measures are selected for their practicality,
usefulness, interest of stakeholders and relevance to Climate Change issues that will impact Belize’s
agriculture. Recommendations are made for specific technical and cross-cutting adaptation measures,
policy and institutional strengthening and stakeholder education, early warning and awareness
programmes.
Technical adaptation measures are categorized according to four direct and indirect effects of Climate
Change specifically:
i. Direct effects -rainfall changes: excess, shortage and variability
ii. Direct effects - temperature increase
iii. Indirect effects of rainfall and temperature changes – greater than changes in pests and
diseases status
iv. Indirect effects of rainfall and temperature changes - greater than changes in soil
fertility
3.2.1 Rainfall - Effects and Changes
Climate Change may result in less rain overall, but the most detrimental effect is likely to be the
change in the distribution pattern of rainfall leading to conditions of periodic drought and flooding,
as well as the more frequent occurrence of severe storms. The latter is dealt with under the natural
Disaster Risk Reduction (DRR) Strategy for agriculture whereas the Climate Change adaptation
strategy considers the impact alleviation remedies for vagaries in rainfall distribution.
Figure 3.2: Schematic of crop response curve with and
without limiting factors

A National Adaptation Strategy to Address Climate Change in the Agriculture Sector in Belize
114
3.2.1.1 Drainage
All crops and by extension all farms require good drainage, either natural or constructed, to allow for
proper aeration of the root environment and to alleviate waterlogging stress on crops and pastures.
Drainage systems should preferably be designed on community or region-wide basis to ensure that
water drained from one farm does not adversely affect other farms or sensitive sites. Extreme flood
events will occur despite any drainage efforts at farm or community level but the drainage will afford
some measure of protection from excessive losses by allowing rapid runoff after the flood subsides.
Maintenance of wetlands and vegetation, management of watersheds and clearing of major waterway
outlets at the national level are important actions to alleviate large scale flooding. Farms may need to
consider relocation if infrastructure needs to minimize losses from flooding.
3.2.1.2 Road infrastructure
Improved designs for road infrastructure (including all-weather resistant road surfaces and high
capacity drainage) are important to alleviate adverse effects of excess rainfall over a short time period
which invariably damages roads of inferior construction. After a flood, good roads will ensure access
to farms for remedial measures as well as the transport of produce thereby minimizing losses after
extreme rainfall events. Banana, citrus and sugarcane are more or less fixed in their locations and
require good road infrastructure.
3.2.1.3 Relocation
Production of annual crops can be relocated within a farmed area during an annual production cycle
based on seasonal rainfall forecast.
In the instance of extreme vulnerability due to farm location the implementation of the appropriate
land use policy measures should encourage permanent relocation for the production of important
agricultural commodities.
3.2.1.4 Irrigation
In preparation for drought conditions expected with Climate Change, irrigation can be used to
supplement the water needs of most of crops. Currently sprinkle irrigation is used extensively in on
banana farms, and drip irrigation is largely employed for the production of high value vegetable crops
and papayas for export. Some farms utilize flood irrigation for rice production. Irrigation is likely to
become necessary to maintain the production of sugarcane as well as other commodities for food
security or export. Attention must be paid to water quality for irrigation, especially in drought prone
areas susceptible to salt water intrusion, and the possible re-use or recycling of water to offset
shortages.
Renewable energy source for powering irrigation systems must be considered. As irrigation needs
become more critical for more commodities the cost of pumping water may be prohibitive and
renewable energy sources should be explored to reduce cost. Drip irrigation is encouraged to conserve

A National Adaptation Strategy to Address Climate Change in the Agriculture Sector in Belize
115
scarce water resources along with the application of appropriate fertilizers (fertigation) to improve
efficiency of crop production systems.
3.2.1.5 Watershed management
Watershed management is critical to maintain the country’s water resources in the long term.
Appropriate land use practices must be adhered to in order to minimize the contamination of soil and
water resources, and the maintenance of well and river water resources to allow for proper timing of
appropriate agronomic practices. All stakeholders must be aware and engaged in the practice of
watershed management to serve the nation’s long term needs.
3.2.1.6 Water harvesting
The extreme variations in precipitation expected with CC can be alleviated by harvesting water when it
is available for later use under conditions of water shortage. The harvested water can be used for
irrigation as well as for livestock. Designs are recommended to gravity feed from water catchments
into cattle troughs to replace the current system of pond catchments visited directly by cattle.
3.2.1.7 Weather forecasting and seasonal production
The most effective way to combat the negative effects of the variation in rainfall patterns is to institute
climate/weather forecasting systems specifically for agriculture purposes (land preparation, planting,
other cultivation practices, harvesting, storage) on a timely basis and as localized as possible. This will
allow improved risk management in temporal and spatial cultivation for the production of seasonal and
annual crops, as well as timely farm operations for perennial commodities (crop and livestock) where
possible.
Crops have different water requirements at certain critical phases of the production cycle. Over years
of experience farmers have developed planting schedules to coincide with the water requirement needs
of the various annual rain fed crops such as corn, beans, rice, cowpea, sorghum, cucurbits (cucumber,
watermelon, squash, pumpkin, zucchini, cantaloupe) , root crops and various vegetables. With the
expected variations in seasonal precipitation projected with Climate Change farmers will need to rely
on timely agro-meteorology forecast so as to adjust planting dates to coincide with availability of water
for productive growth, as well as drier conditions for certain agronomic practices and harvesting.
Timely and localized weather forecasts will also assist farmers to adjust pest management practices,
especially as regards prophylactic applications for fungal pathogens in susceptible cropping systems.
Such forecasts from regional meteorology stations are currently utilized by the banana industry for the
management of the Black Sigatoka disease.

A National Adaptation Strategy to Address Climate Change in the Agriculture Sector in Belize
116
3.2.2 Temperature - Effects and Changes
3.2.2.1 Crop and Livestock Tolerance
There will be need for research/selection and the preparation of technological packages for the
production of crop and pasture varieties, and livestock breeds that are better adapted to the changed
agro-ecological conditions such as increased temperatures brought about under Climate Change. In
this regards it is prudent to maintain the indigenous genetic diversity of Belize’s major staple and food
security commodities (crops and livestock) as an instrument to combat detrimental effects of climate
change on the production landscape. Research/selection of improved cultivars and breeds can be done
locally where appropriate but effective use should continue to be made of regional research and
development institutions as a practical and efficient system of information exchange for accessing
adapted cultivars and breeds. It should be noted that adaptation to increased temperatures may involve
not merely change in crop varieties but the adoption of substitutes; for example, sweet potato instead
of Irish potato, more reliance on indigenous or better adapted vegetables; for example, spinach, chaya,
or scallions. This would require effective liaising with education, health and tourism sectors to
promote more utilization of crops that are better suited to Belize’s agro-ecological conditions under
climate change
The selected crop types should be preserved in germplasm banks to retain availability in the event of
field losses due to natural disasters as well as to maintain purity of seed where erosion of purity occurs
under natural agro-ecological interactions inherent in farming systems. Germplasm banks will include
refrigerated storage of true seed as well as field storage of vegetative propagules.
3.2.2.2 Irrigation
Heat stress on plants can be alleviated by irrigation to supply sufficient water to allow the cooling
effect of evapotranspiration, a physiological process which would otherwise lead to dehydration in
situations of water deficit. The use of water for irrigation purposes to combat heat stress involves the
concept of water use efficiency over the length of the crop growing period and necessitates proper soil
management for precise and economic application of a possible scarce resource.
3.2.2.3 Silvopastoral systems
Silvopastoral systems which utilize shade trees of economic value will help to alleviate heat stress on
range livestock as well as provide added income to the enterprise by the sustainable extraction and sale
of wood from the silvopastoral farming system.
3.2.2.4 Heat alleviating infrastructure
Heat alleviating infrastructure involves appropriately ventilated housing designs especially for poultry,
pigs, sheep and goats. Examples of engineering design to allow maximum air flow, hot air extraction,
heat reflective materials or other appropriate measures should be recommended by agriculture
engineering experts.

A National Adaptation Strategy to Address Climate Change in the Agriculture Sector in Belize
117
3.2.3 Pests and Diseases - Effects and Changes
3.2.3.1 Integrated Crop/Pest Management
Integrated pest management (IPM) is an ecosystem-based strategy that focuses on long-term
prevention of pests or their damage utilizing a combination of techniques such as biological control,
use of resistant varieties, habitat manipulation, and modification of cultural practices (Strand, 2000).
IPM can be defined as the judicious application of various compatible techniques to keep pest
populations below economically damaging threshold levels. Monitoring of the crop system, including
the use of modern Information Technology (IT) tools, is therefore critical in IPM and pesticides may
be used when the need for curative measures to keep pests below the defined economic threshold level
is indicated. Pest control materials are selected and deployed in a manner that minimizes risks to
human health, beneficial and non-target organisms, and the environment. Integrated crop management
adds to IPM other components of the crop environment, such as soil, fertility and water management.
3.2.3.2 Protective Cropping Structures (tropical greenhouses)
Protective cropping structures (PCS) constructed of specific pore size screen mesh materials (lumite)
and UV protective plastic are used to physically exclude arthropod pests, and minimize disease
incidence by excluding rainfall disseminated fungal and bacterial pathogens. By regulating the amount
and placement of water through drip irrigation and fertigation powered by solar technology, the
protective structure maximizes efficiency of production of high value vegetables, and allows
production throughout the year regardless of vagaries of weather conditions. Appropriate designs
include reflective aluminium infused materials and air flow vents that help to ameliorate the effects of
ambient temperatures inside the structure.
Soil management is of particular importance and care must be taken to not introduce soil borne
nematodes, pathogens or insect pests into the tropical greenhouse. To maximize the benefit of re-used
soil in this cropping system organic methods can be explored such as the use of beneficial
microorganisms and compost for soil health and fertility as well as the use of organic foliar fertilizers
and pesticides (if necessary).
Research must be conducted for selection of suitable varieties and production practices for the regular
PCS crops like sweet pepper, tomato, cucurbits, cabbage, as well as other suitable vegetables and high
value condiments. It must be determined what crops can be grown economically with the protective
cropping structures and the least costly mesh pore size which will accommodate the pest management
needs of the different crops ex. larger pore size for cabbage and lettuce varieties.
There will be need to develop production and marketing strategies by assessing production capacity of
the tropical greenhouses, demand for different products and the training, education and organizing of
farmers to some degree so as to produce according to market demands and avoid losses from untenable
production surpluses.
A National Adaptation Strategy to Address Climate Change in the Agriculture Sector in Belize
118
Technicians should collect and assess data on agronomic aspects of tropical greenhouse production and
internal temperatures to advise on design modifications for future greenhouses, tailoring the design
(including movable structures), size and construction materials to suit particular farm situations.
Tropical greenhouses are also useful for production of vegetables on coastal areas vulnerable to
saltwater intrusion due to the most efficient use of harvested water for irrigation and decreased water
use for pest management.
3.2.3.3 Pest Modelling
IPM is enhanced with the use of system models or other prediction schemes that uses appropriate
biological, environmental, economic, or other inputs to analyze the most effective management
actions, based on acceptable control, sustainability, and assessment of economic or other risks. Crop
system models or simply pest models are developed and used to produce information on the status of
the crop, its pests, and its environment under different scenarios, including different management
options. The results can be used to assess a range of pest management techniques, and the risks and
impacts on yields and profits.
Pest models for major crops of regional importance should be developed with CARICOM or Central
American regional cooperation and adapted at country level where applicable. At the local level
experts at BAHA, CARDI and the meteorology department should work along with agriculture
industries to develop models for one or two major pests of major crops. There will be need to train
staff of government and support agencies in Climate Change crop and pest modelling so that this
expertise is not limited to just a few personnel. Research, studies and monitoring of pest-host
interactions in regional agro-ecological environments will have to be on-going as experts and
producers stay on the lookout for new pests or different species of similar pests adapted to change in
climatic conditions.
The economics of pest modelling strategies must be considered bearing in mind that CC induced
effects of pests on crop and livestock production cannot be precisely predicted.
3.2.3.4 Biological Control
The use of appropriate indigenous or, if necessary, imported biological control agents (BCA) can be
the most expedient, cost effective and environmentally sustainable option for management of pests and
insect vectors. Ideally the biological control agent (predator, parasitoid or microorganism) would
eventually establish within the agro-ecological environment, reproduce and sustain stable population
levels that keep the target pest population below its economic threshold. However, effective pest
control is often achieved through continuous releases of laboratory produced BCA’s within target
zones.

A National Adaptation Strategy to Address Climate Change in the Agriculture Sector in Belize
119
3.2.3.5 Biodiversity
Effective pest management necessitates the implementation of measures to preserve or improve the
natural resource environment that creates the essential agro-ecological balance for economic
sustainability of agriculture production systems.
A healthy forest maintains an ecological balance of pests and beneficial organisms thereby reducing
the deleterious effects of pests on proximate agriculture activities. The biodiversity of flora and fauna
in forested areas is also important in that wildlife (avian, mammalian, arthropod species) that feed on
forests can become pests of cultivated crops when forests are physically or chemically disturbed.
Aerial spraying of pesticides in large scale crop cultivations should be strictly regulated to avoid
adverse effects on forest health.
3.2.3.6 Research
Research into new pest and disease interactions that will evolve as a result of Climate Change should
be undertaken. Research should also include augmentation of crop defence mechanisms against pest
e.g. use of effective microorganisms, selection for natural resistance or tolerance and Climate Change
effects on the populations of important pollinators.
Range cattle should be encouraged for the production of a more nutritious meat, and being a more
Climate Change conscious management system. Along with the use of protected water troughs, there
should be research into proper grazing management of selected pasture grass and legume species to
promote cattle health and the reduction of parasites that decrease weight gain.
3.2.4 Soil Fertility - Effects and Changes
3.2.4.1 Soil/nutrition management
Although 38% of soils in Belize are considered suitable for agriculture none are universally recognized
class 1 agricultural soils. This makes soil/nutrition management in agricultural systems even more
critical. There is need to research/implement measures to preserve and improve the physical and
chemical properties of soils with particular emphasis on avoiding soil compaction, and maintaining the
ecological balance and critical role of beneficial soil organisms and micro-organisms that would be
affected by increased temperatures and variation in water regime resulting from Climate Change.
Consultant soil experts have often indicated that, due to insufficient understanding of soil nutrition,
farmers in the banana industry often use chemical fertilizers inappropriately resulting in wastage, lack
of benefit and waste of money.
Pasture maintenance under Climate Change effects will involve research and selection for grasses that
can tolerate soils affected by both drought and excessive water but with better nutritional value than
the popularly used B. humidicola. Examples could include African star grass, guinea grass and other
indigenous species. Germplasm of selected grass and legume species should be maintained in field
banks where necessary to avail cuttings where no viable seed is available. Grazing management

A National Adaptation Strategy to Address Climate Change in the Agriculture Sector in Belize
120
studies to maintain longevity and fertility of pastures is indicated, including supplemental use of
indigenous microorganisms as best practice for pasture fertility.
3.2.4.2 Soil Amendment
Soil fertility, which could be adversely impacted by Climate Change, could be improved through the
use of soil treatments including various forms of organic matter (e.g. compost, vermiculture, and
bokashi), physical and chemical amendments as appropriate, and the study and application of the
commercially available Effective Microorganisms, or similar product. Beneficial micro-organisms
also include the use of inoculants, (Rhizobium nitrogen fixing bacteria) for enhanced legume
production of beans and other legumes, as appropriate. The benefits of using organic matter as soil
amendment includes improving the soil structure, aeration, drainage, water infiltration, water and
nutrient holding capacity as well as providing plant nutrients and energy source for beneficial soil
micro-organisms and earthworms. Currently some farmers purchase organic matter from commercial
suppliers, some produce compost in their fields for their own use and one small farmer group was
assisted with a central group facility.
3.2.4.3 Vegetation Management
It is important to prevent loss of fertility of Belize’s generally fragile soils through erosion resulting
from excessive rainfall events. Good management practices to prevent exposure of bare soils and its
subsequent erosion include maintenance of live vegetative cover during fallow, organic mulches
during cultivation periods, observance of the mandatory sixty six feet riparian natural vegetation, and
staggered planting on contours when utilizing sloping land for agricultural production.
3.3 Aquaculture Adaptation Measures
The Ministry of Agriculture was recently given the mandate for the management and development of
the aquaculture sector, hence the inclusion of aquaculture in the adaptation strategy for agriculture. In
order to develop an appropriate response it is necessary to determine the changes that are expected to
occur and the possible impacts on the sector. Based on the most recently available information, the
following climate change scenarios have been predicted for Belize in no particular order of priority:
a) increased frequency and intensity of tropical cyclones;
b) increase in sea surface temperatures;
c) increased periods of dry;
d) increased intensity and volume of rainfall;
e) increased in the number and types of pests and diseases.
During the consultations with the industry stakeholders it was learned that the operators have
introduced a series of best practices for management that, while geared primarily toward efficiency and
cost reduction, will go a long way in helping the sector adapt to climate change. Each scenario is
looked at below along with the best practice management measure that is currently being practiced:

A National Adaptation Strategy to Address Climate Change in the Agriculture Sector in Belize
121
3.3.1 Increased frequency and intensity of tropical cyclones
The major impact from tropical cyclones has been and will continue to be damage to property
from (i) storm surge, (ii) wind damage, and (iii) flooding. Currently the operators have, of
necessity, been leaving a buffer of mangrove and riparian vegetation between the ponds and the
coastal water bodies as part of the compliance with DoE and Forestry regulations. This buffer
has been sufficient in mitigating or completely eliminating the effects of storm surge on coastal
aquaculture facilities in the past. Currently wind has little impact on the ponds themselves. The
major impacts of wind damage have been on free standing structures such as buildings.
Because farm buildings are constructed in open areas where wind is a factor even without the
benefit of tropical cyclones, the response has been to (i) reduce the number of free standing
structures, (ii) construct wind resistant structures, or (iii) construct buildings that are
'disposable' made of inexpensive and readily available materials. Of singular importance on
all farms is the availability of a Hurricane Plan that all members of staff are familiar with. This
reduces the time taken and errors made in preparing for a hurricane.
3.3.2 Increase in sea surface temperatures
Warm water carries less oxygen than cold water and the warmer the water the lower the oxygen
tension. This is of major importance to a person who is raising animals that obtain oxygen
directly from the water. The normal oxygen tension in water of 20⁰ C at sea level is 9.1 ml/l
and at 25⁰ C water of higher oxygen content or use mechanical means (paddle wheels and air
pumps) to dissolve more oxygen. This is a management practice that is currently being used.
3.3.3 Increased periods of dry
The effect of increased periods of dry are increased evaporation and a resulting increase in
salinity. A standard management practice is to replace a minimum of 1% by volume of water in
each pond on a regular basis, usually daily. This helps to replace water volume that was lost,
improve dissolved oxygen levels, manage the build-up of toxic waste products and maintain
salinities within a preferred range.
3.3.4 Increased intensity and volume of rainfall
The impacts of increased rainfall, particularly in a short period of time, are (i) increased
volumes of freshwater, (ii) erosion, and (iii) flooding. Increased volumes of freshwater will
result in lowered salinity, in saline environments, and increased levels of oxygen. Because the
species of shrimp being cultured prefers salinity between 10‰ (parts per thousand) and 25‰,
increased rainfall will not be a concern until the salinity falls below 10‰. There is the benefit
of increased volumes of fresh oxygenated water.
Because erosion is a constant concern in pond aquaculture, erosion mitigation and control is a
standard part of the design and management of pond infrastructure. If pond banks are properly
maintained, erosion as a result of increased rainfall is not expected to be a major concern. Of
necessity, aquaculture facilities are properly drained. Flooding is not expected to be a concern.

A National Adaptation Strategy to Address Climate Change in the Agriculture Sector in Belize
122
3.3.5 Increase in the number and types of pests and diseases
Belize has developed and continues to develop disease resistant strains of the species being
cultured. As an industry there has been a push to ensure that only animals produced in Belize
are cultured here since they have already been exposed and are resistant to the local pathogens.
This will need to continue to ensure that there is no contamination or introduction of new pests,
new pathogens or new strains of existing pathogens.
The following adaptation measures are proposed to enhance the measures that were already in place:
3.3.6 Improvement in policy and regulatory services that were under the auspices of the
Government of Belize
This refers primarily to the strength of the partnership that is needed between the policymakers,
regulators and providers of support services such as the Ministry of Natural Resources and the
Ministry of Forestry Fisheries and Sustainable Development. Two of the key elements of the best
practices efforts are (i) maintenance of a buffer that is free of certain types of development
between the farms and the adjacent water bodies, and (ii) regulation of the activities that could
threaten the most important resources used in the industry, namely clean water and healthy brood
stock. To ensure that the farms, and the industry, remain viable it is important that the policy and
regulatory framework provide the necessary safeguards that will allow the industry to continue to
operate safely. It is also important that the agencies involved work closely with the private
sector. In this regard it will be necessary to also build capacity in certain agencies to ensure that
they are able to meet their regulatory obligations.
3.3.7 Access to clean water sources
One of the resources relied on the most in the industry is clean water. It is the quickest and easiest
response to a number of management concerns, including temperature, dissolved oxygen and
physiological stress problems. In the area where most farms are located there is a growing
concern about the quality of the water bodies that are being used for abstraction because of the
increase in unregulated human activity in adjacent areas.
3.3.8 Water Storage
To adapt to changes in water quality in the existing water sources farms will need to be able to
store and reuse water when necessary. This requires additional land and is dependent on the need
to have policy decisions that are favourable to the industry. This has a direct relationship to the
need for the public and private sector to work closely together in the interest of the sector.
3.3.9 Information and technology transfer
During the consultation process this was considered to be a vital part of the adaptation measures
as it was felt that it is important that the public and private sector be on the same page in terms of
technologies that are available, response to unexpected weather situations and long term
adaptation policies and strategies that impact the sector.

A National Adaptation Strategy to Address Climate Change in the Agriculture Sector in Belize
123
3.3.10 Reduced energy cost
As the industry moves towards best practices the focus on improved management and the efficient
use of resources, the need to conserve water will become increasingly obvious. One of the highest
production costs for operators in Belize is the cost of energy. Energy is a key factor in any effort to
conserve and/or reuse water as it is required for water quality management.
3.3.11 Renewable sources of energy
During the consultations renewable sources of energy was not considered to be a major
adaptation strategy as most of the energy requirements were in the pumping of water, and
most solar powered pumps currently available are below the capacity required by the farms.
3.3.12 Research
Research into resistant varieties, improved management systems; improved shrimp growing
techniques, etc.
3.3.13 Improved brood stock
This was already being done by the industry as part of the good practice management
measures. The three existing hatcheries have been working on improving genetics and
disease resistance. The Government needs to play a larger role in policy framework and
technical support.
3.3.14 Crop Insurance
If it is available and affordable it will be used. However, private sector stakeholders feel
that if the other measures are in place there should be no need for insurance since they have
been operating without it since the start of aquaculture in Belize.
3.4 Cross-cutting Adaptation Measures
3.4.1 Insurance
Apart from the technical measures to address specific effects of Climate Change on agriculture, there is
the overarching measure of commodity insurance that the vast majority of agricultural producers have
identified as critical to maintain levels of production under the predicted Climate Change scenarios.
The review of relevant documentation, research on applicable models and consultations on the
usefulness of insurance to stakeholders in the agriculture sector pointed to the current need for
insurance services to farmers and producers in the sector. This will be substantially increased as some
of the impacts that are expected with Climate Change become increasingly evident.
3.4.2 Farmer Group Resilience
It must be recognized that whereas technical and infrastructural remedies are important, the people
factor is always the most important element for successful implementation. Solutions must be sought
to achieve the effective engagement of the primary stakeholders, the farming community, and to
promote group resiliency for responding to the challenges of Climate Change. In this regard it has
been recommended that Disaster Risk Management (DRM) and Climate Change be addressed

A National Adaptation Strategy to Address Climate Change in the Agriculture Sector in Belize
124
concurrently since community planning, coordination and resilience are key strategies for both CC and
DRM. The DRM plan for agriculture has strongly charted institutional requirements and education
needs for community empowerment.
It will be necessary to promote group learning systems including observations, data collection,
analysis, and assessment for agricultural communities to actively participate in understanding changes
and changing needs due to effects of Climate Change. It is recommended that the Cooperative
Department re-focus its attention to the promotion of group engagement and organizational needs
instead of focusing on the legal structure of cooperatives. Working with informal group structures this
department could use its resources to promote resiliency for agriculture producers through group
funding models (apart from insurance) and other group food /economic security measures.
3.4.3 Monitoring and Documentation
Effective adaptation to the effects of Climate Change will require continuous monitoring and
documentation of crop and livestock responses to the meteorological, agro-ecological and
environmental changes experienced over time. Pro-active adaptation strategies are expected to
alleviate eventual impact of Climate Change but the effects of any subsequent remedial measures must
also be documented so as to inform a continued process of research, education and implementation of
appropriate actions to maintain viable and responsive agricultural systems. The major stakeholders in
the monitoring and documentation of Climate Change impacts on agriculture and the effectiveness of
response measures will be the farmers, farmer associations and the responsible public entity, the
Ministry or Department of Agriculture. Agriculture as the lead agency designated to collect and
analyse data should be responsible to design data collection instruments for farmers that are easy and
simple to understand and operate. Samples of the farming population representing the different
categories and commodities should be selected to participate in the data collection process. Data to be
collected include commodity types, varieties or breeds, production practices, onset and duration of
crop growth stages, type and incidence of pests and yield output. The lead agency will correlate the
agriculture data from sample farmers with climatic data from the meteorology department and other
agro-ecological factors to analyse needs and effectiveness of adaptation measures.

A National Adaptation Strategy to Address Climate Change in the Agriculture Sector in Belize
125
4. IMPLEMENTATION CAPACITY
4.1 Institutional capacity
The MFFSD is designated as the government agency responsible for the coordination and
implementation of Climate Change policies in Belize. The Climate Change office, under the MFFSD,
is being strengthened to take on a more expansive role in various technical, educational and liaising
aspects of Climate Change.
The NCCC has wide representation from various sectors and is responsible for coordinating climate
change actions at the local, regional and international level, and is organized to address the various
aspects of Climate Change.
Climate Change focal points have been appointed in key ministries. The MNRA Climate Change focal
point is also responsible for coordinating Disaster Risk Management.
BAHA is responsible for averting introductions or establishment of new pests and is being
strengthened under the IDB financed Agricultural Services project.
Regional and Producer Research organizations in the country have technical capacity in crop
management, integrated pest management and improved irrigation/drainage systems.
Support agencies such as OIRSA, IICA, CARDI and ROTC are capable, cognizant and supportive of
the Climate Change adaptation needs for agriculture.
Generally, there are relevant regulatory and policy making mechanisms in place.
Institutional Gaps
Research and Development (R&D) in Agriculture is the vehicle for the advancement of a sustainable
and profitable agricultural sector in Belize. The MNRA liaise with local, regional and international
agricultural institutions, stakeholders and agriculture enterprise to promote improved agricultural
practices; however, much more can be done by stakeholder institutions and the Ministry in the area of
Research and Development. The National Coordinating Committee for Research and Development
(NCCARD) has been in existence for several years with a mandate to promote and coordinate effective
research in agriculture. However, NCCARD has not functioned, effectively, perhaps because members
have been too occupied promoting their own individual activities and enterprises, and are not able to
sufficiently focus on national efforts. NCCARD could benefit the sector, effectively, if it were
deployed to strengthen research institutions through public/private sector liaison, facilitation and
advocacy. In the area of Climate Change and Agriculture, NCCARD could further enhance the benefits
of national research through undertaking the role of documentation and targeted dissemination of
research results relevant to adaptation needs.
Adaptation strategies could be better served if agriculture could firmly institute liaison with the health
and education sectors to promote the nutrition and health of agricultural products. The liaison could

A National Adaptation Strategy to Address Climate Change in the Agriculture Sector in Belize
126
promote the use, marketing and funding of interventions that support wholesomeness of agriculture
products for example decreased pesticide use for coping with pest challenges, improved soil
management instead of overuse of chemical fertilizers which kill soils and contaminate water sources,
infrastructural assistance and training for vegetable growers and education for consumers.
The Belize Marketing and Development Corporation (BMDC) could be a positive force for
strengthening viability of agriculture enterprises if it were to fulfil its mandate. However, it has
consistently failed to perform its mandated function of identifying and developing markets for
potential products and advancing private sector marketing mechanisms for effective product
distribution, growth and export. The BMDC should either be made to perform its supportive role for
agriculture producers or be re-organized so as to fulfil its intended purpose or be disbanded.
Agriculture needs to forge a liaison with the coastal zone sector specifically for the management of
mangroves which could impact water quality for the aquaculture sector, as well as the influx of salt
water into coastal low lying agriculture production plots.
4.2 Policy Environment
The National Land Use policy supports interventions for climate change in agriculture. The World
Bank recently started a five-year project on land use management with the intention to implement the
land use policy. There is clear dedication among some government policy makers involved in this
process and it is expected that the policy will be implemented in the medium term.
A comprehensive Disaster Risk Reduction Action Plan for agriculture has been prepared and accepted
by the Department of Agriculture. Organizational and institutional elements of this plan will serve the
implementation of CC adaptation measures.
Natural resource management is a recurrent theme in almost all relevant policy documents which
underscores the importance and widespread appreciation of the value of natural resources for the
sustainability of Belize’s productive sector.
Belize’s energy policy which promotes the use of renewable energy, including farm residual biomass
as a renewable energy source and an alternative economic product of farms, is supportive to the
proposed adaptation measures for energy efficiency. However, the policy does not specifically outline
fiscal incentives to adopt alternative energy sources and there is need to strengthen this aspect of the
policy.
Belize’s Biosafety policy supports economic and environmentally sustainable adaptation measures
through risk analysis of the use of living modified organisms (LMO’s).
The existing environmental laws which prevent clearing of 66 feet vegetation along waterways and
clearing/planting on specified degree slopes to prevent erosion, and regulate management of
watersheds, form a part of the legal framework for Climate Change adaptation measures. However,
these laws all need to be enforced. Policy enforcement and partnerships with NGO’s should be

A National Adaptation Strategy to Address Climate Change in the Agriculture Sector in Belize
127
effective and decision-making processes should always consider the collective wisdom of stakeholders.
Climate Change strategy and policy for the productive sector should be streamlined into the country’s
short, medium and long term national development strategy to ensure food safety and sustainable
development.
Policy Gaps
The Ministry of Agriculture needs to elaborate a rice policy, an effort which has been attempted
several times in the past. Currently, the most efficient system of rice production is flood irrigated rice
(FAO, 2005), which uses a vast amount of water. The country’s major production of irrigated rice is in
the northern region, the area which is expected to be most affected by water deficits resulting from
Climate Change. A well-defined, comprehensive rice policy will determine how and to what extent
supportive adaptation measures should be instituted.
It is expected that all sectors, including the productive and industrial sectors, will prepare Climate
Change adaptation strategies which can inform the proposed Growth and Sustainable Development
strategy for Belize. The Climate Change office is expected to undertake a leading role in this task.
4.3 Technical Capacity
Selection for Tolerance
Some capacity exists and actions are already ongoing in the following areas that can be utilized for the
benefit of climate change adaptation in the agriculture sector:
A recently implemented basic grain seed selection, purification and storage project for food
security (FAO) in southern Belize has introduce farmers to the participatory process of
germplasm selection; and
The University of Belize operates a meristem facility which can mass produce propagules of
selected tolerant varieties for quick adoption in the agriculture sector. Sugarcane plantlets are
currently being produced by this facility and there are plans for producing selected varieties of
banana and plantain in the near future.
Biological control
SIRDI is currently experimenting with the release of a biological control agent (Metarhizium
anisopliae) for the sugarcane froghopper (Aeneolamia postica) and has plans to eventually produce the
fungus in Belize for widespread use in the industry. SIRDI’s research capacity is being strengthened
under the Accompanying Measures for Sugar (AMS) project.
A partnership between OIRSA and BAHA, in a biological control program for the Pink Hibiscus
Mealy bug, is very successful and the relevant technical capacity is fully developed.

A National Adaptation Strategy to Address Climate Change in the Agriculture Sector in Belize
128
CREI experimented with an imported biological control agent for the Brown Citrus Aphid, vector of
the Tristeza virus and, subsequently, discovered a naturally occurring parasitoid in Belize which
effectively controls the aphid. They are currently looking at a biological control option for Asian
Citrus Psyllid, the vector of the greening disease Huanglongbing.
Protective Cropping Structures
Protective cropping structures were introduced under the 9th
European Development Fund (EDF)
financed Agriculture Enterprise Development (AED) Project and was well received by vegetable
farmers. Some structures have been properly managed and some farmers have experimented with
lower cost design of the original structures.
Irrigation
An ongoing CDB project is developing an investment plan for irrigation and drainage which will pave
the way for the development of strategic irrigation and drainage infrastructure. This should help to
build technical capacity in the mapping of watershed zones for proper drainage infrastructural
development.
There was an Irrigation Unit established in the Ministry of Agriculture which did extensive work in the
promotion and development of drip irrigation systems throughout the country. The technical
personnel, under this unit, underwent substantial training.
Water Harvesting
The concept of water harvesting catchments was explored under the AED project, whereby two
possible catchment designs were prepared for farms in the Cayo District.
Climate Change Modelling
CARDI Belize and CIMH staffs have received training in pest simulation modelling.
There are two agro-meteorologists in Belize and two independent consultants have received training in
Climate Change crop modelling under the global project.
Composting
Under a Ministry of Agriculture supported organic production programme, several farmers have been
trained in the production of compost, bokashi and the use of vermiculture for improving soil fertility
with added organic matter. The use of organic matter in soils is well appreciated by all categories of
farmers and request for compost as an adaptation measure was overwhelming.
A National Adaptation Strategy to Address Climate Change in the Agriculture Sector in Belize
129
Gaps
There is a dire need to improve the technical capacity of agricultural personnel in most sub sectors.
Also, the ratio of trained and equipped agriculture personnel to farmers is critically small. Hence,
there is a need to increase the number of trained personnel in most of the specialized fields of
agriculture, livestock and aquaculture.
Specifically, there exists a need for more trained personnel in agriculture engineering, soils and
nutrition management, integrated crop/pest management, food processing, climate crop and pest
modelling, hydrology, monitoring and documentation, research methods, Information Technology (IT)
and Geographic Information Systems (GIS). This expertise must be established in the Ministry of
Agriculture, so that these critical services can be available at the national level and for the benefit of all
farmers.
Road Construction
There is much public and private sector experience and technical capacity in road construction and
several EU funded projects have assisted in improving main and feeder roads for agriculture support.
However, perhaps due to financial constraints many roads have not been properly surfaced, cambered
or drained to withstand extended rainfall events. It is hoped that longevity becomes a priority factor in
the subsequent construction of agricultural road infrastructure so it becomes an effective adaptation
measure for Climate Change.
4.4 Stakeholder Attitude, Interest and Awareness
The survey conducted among agriculture stakeholders gaged their perspective and attitude towards
agriculture. A summary of the responses is contained in Figure 4.1 below. In general, farmers view
agriculture as a business and the majority of the farmers were aware of Climate Change and the effects
it can have on crops and livestock.
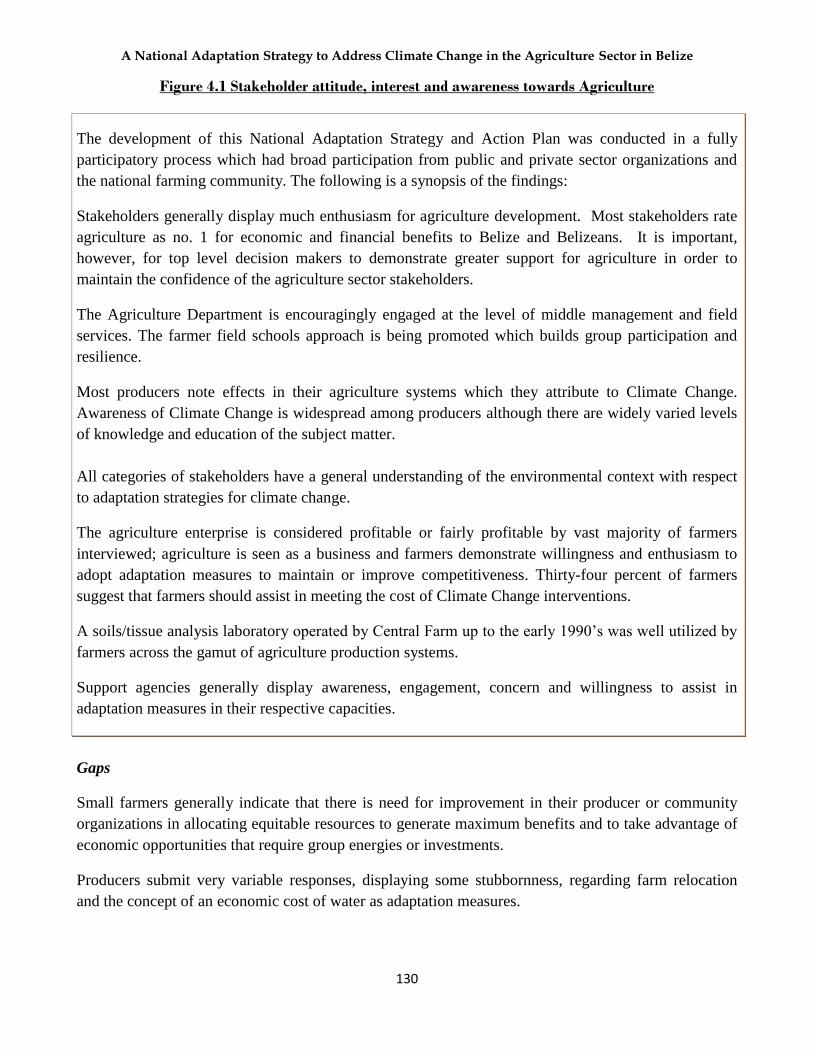
A National Adaptation Strategy to Address Climate Change in the Agriculture Sector in Belize
130
Figure 4.1 Stakeholder attitude, interest and awareness towards Agriculture
The development of this National Adaptation Strategy and Action Plan was conducted in a fully
participatory process which had broad participation from public and private sector organizations and
the national farming community. The following is a synopsis of the findings:
Stakeholders generally display much enthusiasm for agriculture development. Most stakeholders rate
agriculture as no. 1 for economic and financial benefits to Belize and Belizeans. It is important,
however, for top level decision makers to demonstrate greater support for agriculture in order to
maintain the confidence of the agriculture sector stakeholders.
The Agriculture Department is encouragingly engaged at the level of middle management and field
services. The farmer field schools approach is being promoted which builds group participation and
resilience.
Most producers note effects in their agriculture systems which they attribute to Climate Change.
Awareness of Climate Change is widespread among producers although there are widely varied levels
of knowledge and education of the subject matter.
All categories of stakeholders have a general understanding of the environmental context with respect
to adaptation strategies for climate change.
The agriculture enterprise is considered profitable or fairly profitable by vast majority of farmers
interviewed; agriculture is seen as a business and farmers demonstrate willingness and enthusiasm to
adopt adaptation measures to maintain or improve competitiveness. Thirty-four percent of farmers
suggest that farmers should assist in meeting the cost of Climate Change interventions.
A soils/tissue analysis laboratory operated by Central Farm up to the early 1990’s was well utilized by
farmers across the gamut of agriculture production systems.
Support agencies generally display awareness, engagement, concern and willingness to assist in
adaptation measures in their respective capacities.
Gaps
Small farmers generally indicate that there is need for improvement in their producer or community
organizations in allocating equitable resources to generate maximum benefits and to take advantage of
economic opportunities that require group energies or investments.
Producers submit very variable responses, displaying some stubbornness, regarding farm relocation
and the concept of an economic cost of water as adaptation measures.

A National Adaptation Strategy to Address Climate Change in the Agriculture Sector in Belize
131
5. ACTION PLAN
Five (5) major actions have been identified for effectively implementing the proposed adaptation
measures and these are categorized as follows:
i. Infrastructure and Equipment
ii. Research and Training
iii. Education and Early Warning
iv. Commodity Insurance
v. Monitoring and Documentation
5.1 Infrastructure
5.1.1 Drainage systems - There is need for the MNRA to hire a competent agriculture engineer to
advise the Belize Government and private agriculture stakeholders on appropriate drainage needs and
system design for sugarcane, citrus, pastures, grain and vegetable production areas in the districts. The
banana farms have already identified their drainage needs. A Flood Mitigation project in the Belize
River Valley is undertaking appropriate measures for that area. Similarly, previous work undertaken by
the Ministry of Works has identified drainage needs for the Sarawee production area of the Stann
Creek District complete with cost estimates. The drainage construction started under the AED project
proved very effective but the system in Sarawee needs to be completed.
5.1.2 Laboratory for biological control - Sugarcane is the major export crop with the largest number
of farmers. The research arm of the industry, SIRDI, is currently experimenting with a biological
control agent (BCA), the fungus Metarhizium for the control of the major sugarcane pest, the
froghopper Aeneolamia postica. SIRDI currently imports the BCA from Costa Rica but it is only
available to some farmers at this time. They plan to set up facilities to produce the BCA, in country, so
that it can be available in sufficient quantities for effective use and control of the pest. It is
recommended that the biological control laboratory be constructed at and managed by SIRDI, with
appropriate government subventions for financing production of BCA’s for the “public good”, given
the high cost of this program.
5.1.3 Soil and tissue analysis laboratory - After the demise of the Central Farm soils laboratory, CREI
operated a mini lab for soil analysis for some time. Currently, all the major agricultural industries rely
on foreign laboratories for their soil and tissue analysis needs. It is recommended that the soil and
tissue analysis laboratory be set up under the management of CREI and that government subventions
to CREI be re-instated to assist in operationalizing this very critical service to farmers, at large.
Another option would be to set up mini soil labs for each major commodity, operated on the same
basis as CREI. These mini soil labs could then provide a service to other users in their particular zone
for a fee.
5.1.4 Protective cropping structures - Investments in protective cropping structures for vegetable
producers throughout the country should be considered a national priority by both the government and
the private sector. Current costs range from roughly $3,000 to $20,000 per unit depending on size,
A National Adaptation Strategy to Address Climate Change in the Agriculture Sector in Belize
132
design, materials used and irrigation equipment installed. As a follow up to the AED project, the MoA
should embark on a thorough and comprehensive exercise in encouraging and supporting the extensive
and effective use of covered structures in vegetable production. This will involve reactivating a
dedicated unit in the MoA to train vegetable farmers in the design, construction, management and
maintenance of the PCS, to identify research needs, to source suitable materials for construction, to
collect production and marketing data and to facilitate early warning systems for preserving expensive
PCS materials in the event of impending strong winds.
5.1.5 Road infrastructure - The MoA and the MoW, in collaboration with the major agriculture
industries, must assess the road infrastructure needs. This exercise was carried out for the banana
industry. District Agriculture Coordinators must advise on priority road infrastructure needs for the
informal agriculture sector in all six districts. The latter exercise was undertaken, a few years ago,
under the first EU funded Belize Rural Development Programme (BRDP).
5.1.6 Electrification or use of solar pumps for irrigation - Since drought and heat stress are likely to
become big challenges, there is need to decrease the cost of pumping water for irrigation. Based on
crop tolerance and projected precipitation, banana, sugarcane, rice and most vegetables are likely to
require irrigation. For water use, efficiency drip irrigation is recommended for small and medium sized
farms, as well as large farms where practical. Pumping cost can be significantly reduced over the
medium to long term using renewable energy for the power sources. Large farms should consider
electrification whereas solar pumps may be more practical for smaller acreages. Electrification needs
for banana farms have been assessed.
5.1.7 Germplasm banks - It is recommended that a national germplasm bank be established at the
Ministry of Agriculture Research and Development Station at Central Farm for the maintenance of
seed and vegetative propagules of cultivars selected for tolerance to the impacts of Climate Change.
This involves a cold storage facility for true seed and irrigated field plots for vegetative planting
material.
5.1.8 Water catchments - The Orange Walk, Corozal and Cayo Districts will be most in need of water
harvesting structures, the former two due to projected water deficits in the north of Belize and the latter
due to hydrological constraints of groundwater access. Three water catchments, one in each district,
should be constructed on selected farms, to serve as demonstrations to other farmers in terms of design,
water storage and retention capacity.
5.1.9 Agro-meteorological forecasting equipment - Additional Automatic Weather Stations (AWS) is
to be procured for the Meteorology Department that can be deployed in sparely monitored, agriculture
zones to improve on the meteorological network’s coverage. This will enable the receipt of timely
weather data to enable the preparation of seasonal, monthly and weekly agro-meteorological forecasts,
specific to the different agricultural zones.
5.1.10 Monitoring and documentation software - Agriculture technicians and climate specialists will
need to be equipped with appropriate equipment such as computers, GPS, printers and software,
including Geographic Information Systems (GIS) capability, for the collection, documentation and

A National Adaptation Strategy to Address Climate Change in the Agriculture Sector in Belize
133
analysis of data pertinent to Climate Change impacts on the various aspects of agricultural production
and the effects of response measures.
5.1.11 Research programme and facility - Key, leading institutions such as MoA, CARDI, CREI,
SIRDI, BAHA, ROTC, OIRSA, IICA and the BGA should be invited to develop a well-planned,
coordinated and prioritized national agriculture research programme based at Central Farm. Trained
personnel, equipment and materials should be provided to enable a properly functioning national
research facility at the Central Farm. Whereas other research bodies will serve specific industry or
regional needs, a full-fledged national research system must be established to support overall
adaptation actions for agriculture. Materials and equipment will be needed for research into soil
fertility management, crop and livestock protection, identification of climate resilient crop varieties
and livestock breeds and assessment of performance, agro-processing, supportive infrastructure for
irrigation and livestock, components of protective cropping structures and development of new
products for emerging niches.
5.1.12 Compost facilities - Basic compost facilities and equipment should be established by the MoA
and managed by farming groups at suitable locations in each district. These facilities should be of easy
access to members of all organized agriculture production groups to enable use of the various forms of
organic matter for sustained soil fertility. The use of compost was overwhelmingly endorsed by all
categories of farmers and group-managed facilities were mostly recommended. Banana farmers have
investigated their compost needs and quantified the costs of establishing suitable facilities for their
industry.
5.2 Research and Training
Research and training actions will be necessary to support, complement and in some instances
actualize the infrastructural and equipment measures elaborated. As adaptation to Climate Change in
agriculture is necessarily a dynamic process, research into new agricultural opportunities, development
of new niches and tackling of emerging Climate Change issues should be on-going. It is recommended
that some existing baccalaureate staff be upgraded to the Masters of Science (MSc.) Degree level in
the various disciplines needed to strengthen the research and development capacity of the national
institution.
5.2.1 Formal Training
o MSc. Soil agronomist - To conduct research, development and training in the physical,
chemical and biological constitutes of soil, appropriate soil cultivation practices and the proper
use of organic matter to avoid harmful effects and maximize benefits.
o MSc. Agriculture. engineering - To conduct research, development and training in the
construction and use of drainage systems, water catchments, protective cropping structures,
heat alleviating infrastructure for livestock, establishment of irrigation systems and advise on
remedial measures for salt water intrusion.

A National Adaptation Strategy to Address Climate Change in the Agriculture Sector in Belize
134
o MSc. Entomology - To conduct research, development and training in Integrated Pest
Management, biological control and pest modelling.
o MSc. Plant Pathology - To conduct research, development and training in Integrated Pest
Management, biological control and pest modelling.
o MSc. Hydrology - To assess quantity, availability and quality of water resources and advise on
appropriate use for agriculture production.
o MSc. Food Technology - To conduct research, development and training in food processing to
help maintain agriculture competitiveness by adding value or preservation of some crops which
might face restricted production or be confined to seasonal production due to unfavourable
meteorological conditions.
5.2.2 In-service Training
Apart from degree level training, on-going or periodic training needs for successful implementation of
adaptation measures include training of research staff in agricultural statistics and research methods,
training of producer groups in preparation and use of organic matter, training of farmers and
technicians in monitoring, documentation and analysis of Climate Change impacts, and training of
agriculture experts in utilization of models to predict Climate Change impacts on major agriculture
commodities. Training in GIS and IT will be needed to support many of these processes. Training can
be provided by local and regional institutions.
5.3 Public Education and Early Warning
Three main public education, awareness and early warning activities are required to support the
implementation of the adaptation measures:
i. Timely and localized weather forecast must reach the target group directly - either by e-mail to
group focal points or by text messaging to farmers at large - on a seasonal, monthly and weekly
basis for the information to be used efficiently for timely planning of livestock and crop
production activities.
ii. There should be regular television and radio programmes and effective advertising dealing with
these various topics on agriculture and climate change. Stakeholders and farmers in particular,
need to be continuously alerted and educated on the management of watersheds, vegetation,
wetlands and biological refuges to inform their decision-making in such a way that it becomes
a normal part of their everyday farming activities. Education on these aspects must start in the
short term before irrevocable damage is done to the agricultural environment.
The regular programming should also be used to educate stakeholders on the content of the
GOB’s biosafety policy so that they understand the context, possible benefits and potential
repercussions of introducing biologically active genetically modified organisms (LMO’s) onto
Belize’s agricultural landscape. The risk analysis for GMO corn in particular should be

A National Adaptation Strategy to Address Climate Change in the Agriculture Sector in Belize
135
ventilated since some stakeholders might consider GMO corn as an option for variety tolerance
as an adaptation measure for climate change. It needs to be explained how the use of Bacillus
thuringiensis (Bt) or glyphosate tolerant GMO corn seed conflicts with recommended measures
for CC adaptation and the likely negative socio-economic impacts on Belize’s agro-ecology
that would result from its introduction.
iii. When applicable pest models are developed, an early warning system should be put in place to
inform the target stakeholder groups of predicted pest outbreaks. This can be done via
television, radio alert messages, e-mail and text messaging to the designated agricultural group
or association focal points.
5.4 Insurance
The literature suggests that what would be required is a form of “Multi-Peril Crop Insurance” program
to cover the widest range of risks that could impact farmers and producers of livestock and aquaculture
commodities.
This insurance would cover the increased losses expected by farmers and producers associated with the
increasing frequency and severity of weather related events. These impacts would be associated with
storm related wind, flood and drought related damage. The insurance coverage would necessarily
require some established minimum standards which insured farms or production units would have to
meet. This would ensure that the insured would actively take measures to prevent losses with
investments in certain protective infrastructure such as drainage or wind breaks against flooding or
wind damage. Also, this could mean that some locations would not be able to secure coverage, if they
are located in zones where damage would have a high likelihood to occur such as farms established in
flood plains or cattle ranches located in areas subject to flooding or fires.
The ownership structure proposed is one which would have joint participation of the Government of
Belize and the private sector. Government’s contribution would be a critical incentive for wider
participation since its financial input would act to lower premiums and the costs of coverage to the
insured. Meanwhile, the private sector’s participation would act to guarantee more market driven
management approaches and greater focus on efficiency, cost effectiveness and overall accountability.
In the consultation a majority of farmers are prepared to make premium payments according to
assessed risk and affordability.

National Agriculture Sector Adaptation Strategy to Address Climate Change in Belize
136
The Summary Tables: 3 (a) to 3 (d) below outline the costs, financing mechanisms, implementing entities and time frames for the various
actions.
Table 3 (a): Cost, financing and implementation of actions pertaining to infrastructure and equipment 8
8 Short term (ST) is defined as a period of 1 - 3 years; Medium term (MT) is 4 - 6 years and long term (LT) is any period more than 6 years.
Action
Time-frame
Cost (BZ$)
Financing Sources
Implementing
institutions and agencies
1. Design and construct drains in sugar belt ST 4,000,000 AMS, farmers Private contractor
- In banana belt ST 1,600,000 BAMs, farmers, Private contractor
- In citrus belt MT 2,000,000 GOB , Partners Private contractor
- In Sarawee ST 100,000 GOB Min. of Works
2. Construct and equip laboratory for biological control ST 150,000 GOB, association SIRDI, BAHA
3. Construct and equip laboratory for soils and tissue analysis MT) 250,000 GOB, association CREI
4. Construction of Protective cropping structures ST 400,000 GOB, farmers Agriculture Department.
5. Road infrastructure: feeder roads MT - LT 10,000,000 EU and Partners Ministry of Works
6. Electrification in banana region for irrigation improvements MT 1,500,000 BAMS BEL, Farmers
7. Electrification in sugar region for irrigation improvements MT 2,500,000 AMS BEL , Farmers
8. Solar powered irrigation pumps MT 2,000,000 AMS, Farmers/GOB Farmers
9. Composting plant for banana industry MT 250,000 BAMS BGA
10. Compost plant for sugarcane industry LT 250,000 AMS Association
11. Compost facilities for 10 small farmer groups ST 300,000 FAO and Partners Farmer groups
12. Germplasm bank: Expansion and Upgrade LT 150,000 GOB, FAO MoA/CARDI
13. Water harvesting catchments demonstrations LT 60,000 Partners Agriculture Department
14. Research equipment for national facility MT 200,000 MoA, EU and UNDP Agriculture Department
15. Agro-met forecasting equipment ST 400,000 GOB Meteorology Department
16. Monitoring and documentation system - software and training MT-LT 40,000 Partners Agriculture Department
TOTAL
26,150,000

National Agriculture Sector Adaptation Strategy to Address Climate Change in Belize
137
Table 3 (b): Costs, financing and implementation of actions pertaining to research and training (R & T)
Action
Time-frame
Cost
(BZE$)
Financing
Implementing
institutions and agencies
1. T MSc. soil agronomist ST 60,000 Partners CREI and MoA
2. T MSc. agric. engineering ST 60,000 Partners MoA
3. T MSc. Entomology ST 60,000 Partners MoA
4. T MSc. Pathology ST 60,000 Partners MoA
5. T MSc. Hydrology ST 60,000 Partners Hydrology Dept.
6. T MSc. food processing ST 60,000 Partners MoA
7. T in Geographic Information Systems ST 30,000 Partners LIC, GOB
8. T in Information Technology Applications ST 30,000 Partners MoA, Producer Groups Associations
9. T Research and statistics (local or agency professionals ) MT 20,000 Partners CARDI, MoA
10. R & T Climate modelling MT 30,000 Partners Meteorology
11. R & T Pest modelling LT 30,000 Partners MoA, BAHA
12. T Monitoring and Documentation MT 40,000 GOB MoA/ producer groups
13. T composting ST 20,000 GOB Producer groups
14. Research in biological control MT On-going
40,000 GOB and Farmer Associations
GOB , SIRDI, CREI,UB
15. Research and Training in Protective Cropping Structures ST 120.000 GOB and Farmer Associations
GOB , Farmers
TOTAL
720,000

National Agriculture Sector Adaptation Strategy to Address Climate Change in Belize
138
Table 3 (c): Cost, financing and implementation of actions pertaining to education and early warning
Action
Time-frame
Cost
Annually (BZE$)
Financing
Implementing
institutions and agencies
1. Weather forecasting Transmission: Texts, e-mail to focal points ST 10,000 GOB Meteorology Department
2. Awareness Programmes: TV, Radio programmes -vegetation, watershed, wetlands management
ST 10,000 GOB Dept. of Environment
3. TV, radio programmes - importance of diversity (refuges) ST 10,000 GOB BAHA
4. Radio, texts, e-mail Pest forecasting LT 5,000 GOB MoA, BAHA
5. TV, Radio programmes - Climate Change awareness ST 10,000 GOB Climate Change 0ffice
6. TV, Radio programmes - GMO, LMO ST 5,000 GOB MoA, BAHA
TOTAL
50,000
Table 3 (d): Cost, financing and implementation of action for commodity insurance
Action
Time-frame
Cost (BZE$)
Financing
Implementing
institutions and agencies
1. Establishment of a Matching Insurance Fund MT 5,000,000 GOB - Government of Belize - Insurance Companies

National Agriculture Sector Adaptation Strategy to Address Climate Change in Belize
139
References
AMS, 2013. The PRECIS Caribbean Story: Lessons and Legacy. Bulletin of the American
Meteorological Society, via Acquire Media News Edge.
Anderson, E.R., et al., 2008. Potential Impacts of Climate Change on Biodiversity in Central America,
Mexico, and the Dominican Republic. CATHALAC and USAID. Panama City, Panama, 105
pg.
BCES, 2006. Belize Country Environmental Profile. Second edition, revised, K. Mustafa Toure
Consulting Editor. Ministry of Natural Resources and the Environment. CCAD/Earth Council,
Belize Audubon Society.
BEST, 2008. National Integrated Water Resources Management Policy (Including Climate Change)
for Belize. MNREI, Belmopan, Belize.
Borenstein, S., 2013. There's More Carbon Dioxide in the Air Now Than Any Time in 3
Million Years. Associated Press, May 10. http://twitter.com/borenbears
CANARI, 2013. Using traditional knowledge for decision-making on climate change in Caribbean.
Policy Brief No. 15.
CaribSave, 2009. Climate Change Risk Atlas. CCCRA, CARIBSAVE, 2009-2011.
CCCCC, 2012. Delivering Transformational Change 2011- 21. Full Report: Implementing the
CARICOM ‘Regional Framework for Achieving Development Resilient to Climate Change’.
Technical Report 5C/CCCCC-12-03-02. Belmopan, Belize.
Central Statistical Office, 1999. Environmental Statistics for Belize, 1999. Belmopan, Belize.
Central Statistical Office, 1997. Abstract of Statistics, 1997. Belmopan, Belize.
Croakley, S.M., H. Scherm, S. Chakraborty 1999. Annual review of phytopathology. Climate change
and plant disease management.
Castañeda, A. 2007. Technical Needs Assessment of Agriculture Sector in Belize. Second National
Communication to the UNFCCC. Belize Climate Change. MNREI, Belmopan, Belize.
Cayetano, M. 2013. Flood Risk Reduction Plan for the Agriculture Sector: Belize Rural North.
NEMO/IDB. Belmopan, Belize.
Cure, J. D. and B. Acock, 1986. Crop responses to carbon dioxide doubling: A literature survey.
Agriculture and Forest Meteorology, 38, 127-145
Chung, L., 2011. Irrigation and Drainage Policy and Strategic Development Plan for Belize. Baseline
Report. Chung’s Engineering Co. Ltd.

National Agriculture Sector Adaptation Strategy to Address Climate Change in Belize
140
Development Policy and Management Consultants. 2009. National Adaptation Strategy to Address
Climate Change in the Agriculture Sector of Guyana. Strategy and Action Plan. Queenstown,
Guyana.
FAO, 2013. Climate-Smart Agriculture Sourcebook. E-ISBN 978-92-5-107721-4 (PDF). Rome.
Wright, et al. 1959. Land of British Honduras. Her Majesty’s Stationary Office. York House
Kingsway, London, WC2.
FAO, 2005. Agricultural Development Management and Operational Strategy. TCP/BELIZE/2003 A.
Ministry of Agriculture, Belize.
Frutos, R. and Tzul, F. 1995. Impact of Climate Change on Maize, Dry Beans and Rice Production in
Belize. Central American Climate Change Project: Agricultural Sector. National
Meteorological Service and the Department of Agriculture and Fisheries, Belize.
Frutos, R. and Tzul, F. 1999. Mitigation – Adaptation: Agriculture Sector. Climate Change Project –
Belize.
Frutos, Ramón, Central American Cold Surges: Some Effects on Citrus and Banana Production Belize,
M.Sc. Dissertation, 1996, University of Reading, U.K.
GOB, 2011. Second National Communications to United Nations Framework Convention on Climate
Change. Belmopan, Belize.
GOB, 2009. National Biosafety Policy. 2009. Belmopan, Belize.
Guysuco. 2009. Vulnerability and Capacity Assessment Impact of Climate Change on Guyana’s
Agriculture Sector.
Hartshorn, G., Nicolait, L., Hartshorn, L., Bevier, G., Brightman, R., Cal, J., Cawich, A., Davidson,
W., DuBois, R., Dyer, C., Gibson J., Hawley W., Leonard J., Nicolait, R., Weyer, D., White,
H., White, H., & Wright, C. (1984). BELIZE Country Environmental Profile, A Field Study.
USAID Contract, San Jose. Trejos. Hnos.Sucs. S.A. pp. XVI152.
International Potato Center, 2011. Insect phenology modelling and Climate Change. Lima, Peru.
IPCC, 2013. Summary for Policymakers. IPCC AR5 WG1, Stockholm, Sweden.
Land Information Center, 1998. Remote Sensing Analysis of Land Cover and Land Use Central
Belize. MNRE/ UNDP/CSR/BEG, University of Austin, Texas, 1998 Report.
Magaña, V. O. R., 2009. Guide to Generate Regional Probabilistic Climate Change Scenarios for
Decision Making. Center for Atmospheric Science, UNAM, Monterey, Mexico, July 2009.
National Meteorological Service of Belize, CLICOM and HOMS Database.
Magloire, Francine, William Usher and Hugh O’Brien, 2012. Rapid Assessment of the Individual
Needs of Banana Farms in the Stann Creek and Northern Toledo Districts. Belmopan, Belize.

National Agriculture Sector Adaptation Strategy to Address Climate Change in Belize
141
Meerman, J., J. McGill, M. Cayetano 2011. Belize National Land Use Policy for Land Resource
Development. Belmopan, Belize.
McSweeney C., M. New and G. Lizcano 2009. UNDP Climate Change Country Profiles
Documentation. Draft Report: 18 p.
Mitchell, T. D. et al, 2003. Climate Change Country Profiles. Documentation: Draft Report: 18 p
Tyndall Centre for Climate Change Research, University of East Anglia.
www.cru.uea.ac/uk/~timm
Ministry of Agriculture and Fisheries, 2009. Annual Report. Belmopan, Belize.
Ministry of Agriculture and Fisheries, 2003. The National Food and Agricultural Policy (2002-2020)
No Farmer = No Food. Belmopan, Belize.
Ministry of Agriculture and Fisheries, 2011. Plan of Action for Disaster Risk Reduction. MA&F/FAO.
Belmopan, Belize.
Ministry of Natural Resources and Agriculture, 2012. Production Statistics 2012. Belmopan, Belize.
NHDAC/UNDP/GOB, 1997. Taking Stock: National Human Development Report 1997. Belmopan,
Belize.
Orlandini, S., F. Natali, 2011. Short description of pest and disease models. Cami Project. Florence,
Italy.
Orlandini, S., 2013. Climate Modelling in the context of meeting anticipated pest threats. Dep. Agri-
food production and Environmental Science. University of Florence, Italy.
PAHO/WHO, GOB, 1995. Sectoral Analysis in Water Supply and Sanitation in Belize: Sectoral
Analysis Series, No. 5. Belize City, Belize.
Ramirez, D. et al., 2013. Belize: Effects of Climate Change on Agriculture. ECLAC/CCAD/DFID.
Mexico, D.F. Printed United Nations NY, January 2013.
Rasheeda A, Hall-Hanson and Anil Sinha, 2011. Climate Sustainable Agriculture: Training in Pest and
Disease Modelling to Increase Crop Protection and Productivity in the Caribbean
Richardson, Robert B., 2009. Belize and Climate Change: The Costs of Inaction. UNDP. Belize
Salinger, M.J., Stigter, C.J., Das, H.P., 2000. Agriculture and Forest Meteorology: Agrometeorological
adaptation strategies to increasing climate variability and climate change. Paw, K. T., 2000
Editor Chief. Elsevier Vol 103, Nos. 1-2 June 2000.
Rogers, H.H.; R.C. Dahlmann, 1993. Crop responses to CO2 enrichment. Vegetation, 104/105, 117-
131. Technical Cooperation Programme, FAO/ Government of Belize, Water Resources
Management Policy, Planning and Organization, November 1994. Final Report.

National Agriculture Sector Adaptation Strategy to Address Climate Change in Belize
142
Santos, C. G. and S. Garcia. 2008. Belize Climate Change Vulnerability and Assessment for
Sugarcane and Citrus. 2nd
National Comm., UNFCCC. Belize. UNDP/CCCCC. Belmopan,
Belize.
Selvaraju, R., et. al, 2013. Climate Change and Agriculture in Jamaica. Agriculture Sector Support
Analysis, Environment and Natural Resources management Series 21 (Monitoring &
Assessment ISSN 2071-0992. IDB – FAO).
Simpson, L. A., 2009. A Manual of Soil Conservation and Slope Cultivation. Ministry of Natural
Resources and Environment, Forest Department. UNDP-GEF. Belmopan, Belize.
Singh, Bhawan. 2013. Enhancing Belize’s Resilience to Adapt to the Effects of Climate Change. In-
Depth Draft Report.
Sinha, A., 2011. Part I: Weather-related forecasting models and pest management in agriculture:
Benefits and required inputs. CARDI.
Sinha, A., 2011: Part 2: Application, Model development and implementation. CARDI.
Statistical Institute of Belize. Unpublished Report 2013. Belmopan, Belize.
Statistical Institute of Belize. Labour Force Survey September 2013. Belmopan, Belize.
Stewart, R., 2011. Belize Banana Competitiveness Strategy. Belmopan, Belize.
Taylor, M., Centella, A., Charlery, J. et al. 2007. Glimpses of the future: A briefing from the PRECIS
Caribbean climate change project. Belmopan, Belize: Caribbean Community Climate Change Centre.
Tillett, A., J. Locke, and J. Mencias, 2011. National Energy Policy Framework. Belmopan,
Belize.
Trijillo, M. 2014. Personal Communication, Central Farm Research Station. Cayo District, Belize.
Tunich-Nah Consultants and Engineering and Thom Grimshaw. 2003. Draft National Aquaculture
Zoning Plan for Belize. Belmopan, Belize.
Venette, R. C., 2013. Incorporating Climate Change into pest risk models for forest pathogens: A role
for cold stress in an era of global warming? NeoBiota 18: 131-150.
UNICEF / Central Statistical Office Belize, 1995. The Right to a Future: A Situational Analysis of
Children in Belize. Belize City, Belize.
WMO, 2014. WMO Statement on the Climate. Geneva, Switzerland. www.wmo.org
WRISCS, 1998. Watershed-Reef Interconnectivity Scientific Study: Stann Creek Area and Southern
Belize, 1997- 2000, Newsletter, Vol. 1, May 1998. www.icran.org

National Agriculture Sector Adaptation Strategy to Address Climate Change in Belize
143
ANNEXES Annex I – Survey Questionnaires
STAKEHOLDER SURVEY
Climate Change is a long term change in global weather patterns caused by rising temperatures (referred to as global warming*). Negative effects of Climate Change will include a rise in sea level and an increase in extreme rainfall events (excessive rains, droughts and major storms) in the near and foreseeable future. Over the last 20 years Belize has already been affected by devastating floods which has caused much losses in the agriculture sector. Agriculture will be further disrupted as average temperatures in Belize are expected to rise by 2 to 4 0C towards the end of this century, and seasonal and annual rainfall totals will continue to change significantly. The GOB, along with stakeholders in the agriculture sector, must develop an action plan to enable the agriculture sector to adapt to the negative impacts of Climate Change.
The purpose of this survey is to consult with stakeholders of the agriculture sector to get their inputs which will guide the development of a national agriculture sector adaptation strategy to address climate change in Belize. (*Global warming results from an increase in carbon dioxide levels in the atmosphere mainly due to the burning of fossil fuels)
Section One: Questions for Agricultural Producers
Name: _____________________________________________________________________
Location: _____________________________________________________________________
Organization: _____________________________________________________________________
Commodity(ies): _____________________________________________________________________
1. Which of the following best describes your farming system? □ Milpa □ Semi-mechanized □ Mechanized □High-input □ Low-input
2. What is your age range? □ 18 – 29 □ 30 – 41 □ 42 – 53 □ 54 – 65 □ >65
3. Which of the following best describes your farm landscape/topography?
□ Flat terrain □ Rolling or hilly terrain □ Moderately steep hill side □ Steep hill side 4. How many years have you been farming?
□ 1 – 10 years □ 11 – 20 years □ 21 – 30 years □ 31 – 40 years
5. Which of the following best describes your farm location? □ Flood plain □ Coastal low lying □ Buffer area next to Forest Reserve

National Agriculture Sector Adaptation Strategy to Address Climate Change in Belize
144
6. What is the acreage of your farm?
□ 1 – 10 □ 11 - 20 □ 21 – 40 □ 41 – 60 □ 71 – 100 □ 101 – 200 □ 201 – 300 □ > 300
7. Which of the following best describes the soil type on your farm? □ Sandy □ Sandy/loam □ Loam □ Clay loam □ Heavy clay
8. Which of the following categories best describes your production practice? (Describe your
production practices)
Crop: □ Monoculture □ Intercrop □ Mixed Farming □ Rotation
□ Organic □ Protective cover
Livestock: □ Range □Feedlot □ Cut and carry
9. What percentage of your production is used for family consumption?
□ 0 - 24 □ 25 - 50 □ 51 - 74 □ 75 - 100
10. How do you market your produce?
□ Wholesale □ Retail □ Processed
11. Where do you get your seeds and or your planting material? □ Self-supply □ Agricultural suppliers □ Other farmers □ Ministry of Agriculture /CARDI □ Other __________________________________
12. How do you control pests/weeds/disease on your farm?
□ Primarily chemical pesticides □ Organic pesticides □ Integrated pest management
□Cultivation practices □ Other ______________________________________
13. How effective is your current system for the control of pests/weeds/disease?
□ Very effective □ Fairly effective □ Poor
14. Do you have an irrigation system on your farm? □ Yes □ No
15. If yes, which best describes the acreage under irrigation? □ Less than I acre □ 1 – 5 acres □ 6 – 10 acres □ 11 – 20 acres □ >20 acres
16. What type of irrigation system do you use? □ Drip □ Sprinkle □ Flood
17. What is the source of water that you use?
□ Surface □ Rain harvest □Well □Recycled water 18. Which of the following best describes the quality of the surface or groundwater on or near your
farm? □ Fresh □ Brackish □ Seasonally salty □ Hard □ Polluted
19. Have you ever experienced shortage of water for irrigation purposes? □ Yes □ No
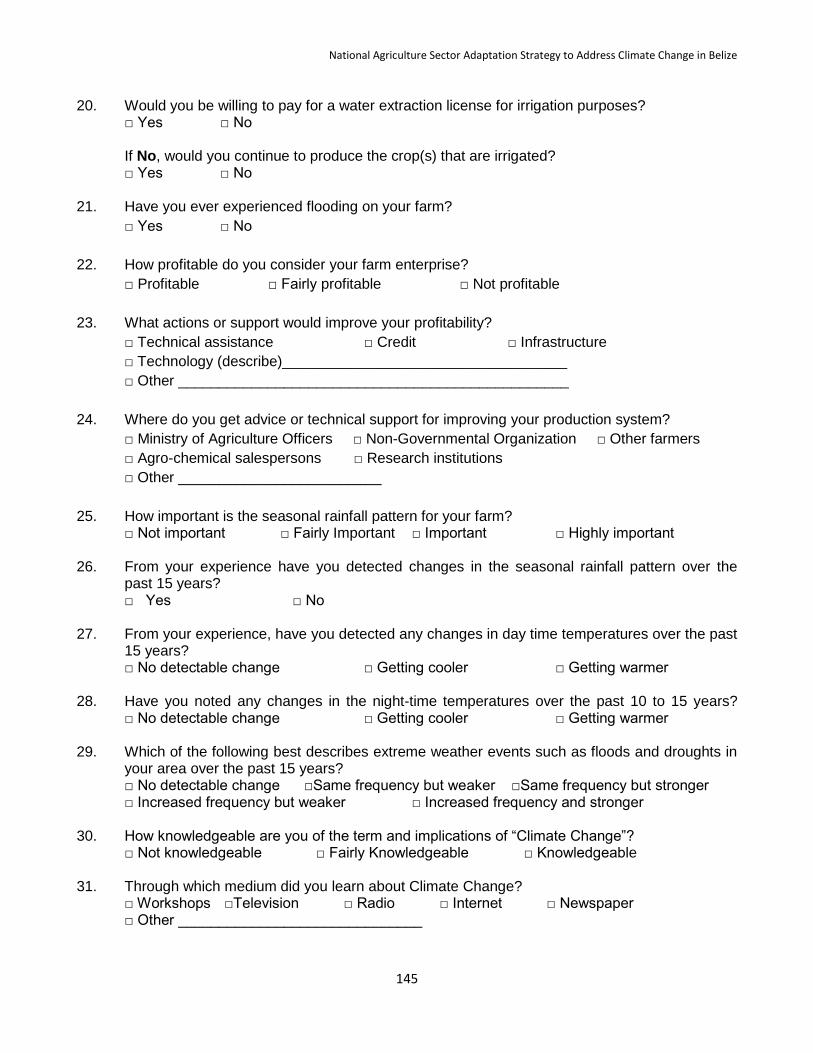
National Agriculture Sector Adaptation Strategy to Address Climate Change in Belize
145
20. Would you be willing to pay for a water extraction license for irrigation purposes?
□ Yes □ No If No, would you continue to produce the crop(s) that are irrigated? □ Yes □ No
21. Have you ever experienced flooding on your farm?
□ Yes □ No
22. How profitable do you consider your farm enterprise?
□ Profitable □ Fairly profitable □ Not profitable
23. What actions or support would improve your profitability?
□ Technical assistance □ Credit □ Infrastructure
□ Technology (describe)___________________________________
□ Other ________________________________________________
24. Where do you get advice or technical support for improving your production system?
□ Ministry of Agriculture Officers □ Non-Governmental Organization □ Other farmers
□ Agro-chemical salespersons □ Research institutions
□ Other _________________________
25. How important is the seasonal rainfall pattern for your farm? □ Not important □ Fairly Important □ Important □ Highly important
26. From your experience have you detected changes in the seasonal rainfall pattern over the past 15 years? □ Yes □ No
27. From your experience, have you detected any changes in day time temperatures over the past 15 years? □ No detectable change □ Getting cooler □ Getting warmer
28. Have you noted any changes in the night-time temperatures over the past 10 to 15 years? □ No detectable change □ Getting cooler □ Getting warmer 29. Which of the following best describes extreme weather events such as floods and droughts in
your area over the past 15 years? □ No detectable change □Same frequency but weaker □Same frequency but stronger □ Increased frequency but weaker □ Increased frequency and stronger
30. How knowledgeable are you of the term and implications of “Climate Change”? □ Not knowledgeable □ Fairly Knowledgeable □ Knowledgeable
31. Through which medium did you learn about Climate Change? □ Workshops □Television □ Radio □ Internet □ Newspaper □ Other ______________________________

National Agriculture Sector Adaptation Strategy to Address Climate Change in Belize
146
32. Have you noticed any changes in recent years with your production which you believe is
caused by climate change?
□ Yes □ No
33. If yes, what are these changes and what are you doing about it?
___________________________________________________________________________
34. What aspect of climate change do you think will seriously affect your enterprise?
□ Drought □ Flood □ Storms □ Saline intrusion □ Pests and diseases
□ Heat stress □ Changes in soil fertility
35. How reliable is the weather information you receive?
□ Unreliable □ Reliable □ Very reliable
How would timely and reliable agricultural weather forecast specific for your area help in your
farm operations?
□ Not at all □ Some extent □ Very much
36. Would you use crop/livestock insurance to reduce your risk?
□ Yes □ No
If yes, what sort of insurance model would be appropriate?
□ Farmers Cooperative Insurance □ Formal insurance sector
□ Other _________________________
If yes, are you prepared to pay an insurance premium?
□ Yes □ No
37. What factors would affect your decision to participate in an insurance program?
□ Cost □ Type of coverage □ Other _________________________________
38. How do you make major decisions regarding your production?
Quantity of production: □ Individual □ Group □ Community
Production system: □ Individual □ Group □ Community
Pest management: □ Individual □ Group □ Community
Marketing of produce: □ Individual □ Group □ Community
39. Do you see a need for improvement in how your farming community or association is
organized?
□ Yes □ No
If yes, please explain.
___________________________________________________________________________

National Agriculture Sector Adaptation Strategy to Address Climate Change in Belize
147
40. Has your neighbour’s farm practices ever negatively affected your production?
□ Yes □ No
If yes, please explain.
___________________________________________________________________________
41. Would you relocate your farm if that is recommended due to Climate Change threats to your
present location?
□ Yes □ No
42. What factors would affect your decision?
□ Availability of suitable land □ Availability of credit □ Economic infrastructure
□ Access /Logistics □Other ________________________________
43. Who should monitor the effects of Climate Change on agriculture?
□ Farmers/cooperative/association □ Meteorology Department □ Hydrology Department
□ Research institutions □ BAHA □ Agriculture Department
□ Other______________________________
44. Who do you think should finance interventions to address Climate Change needs for farmers?
□ Farmers themselves □Government of Belize □Others ______________________
45. What interventions do you recommend to reduce the negative effects of Climate Change on
agriculture?
Flooding: □ farm location □drainage (farm, community, national scheme) □cambering
□ road infrastructure □ wetlands management □ vegetation management to
prevent erosion □ other __________________________________
Drought: □ water harvesting □ watershed management □ water recycling (eg. Aquaponics)
□ water policy-priority water use □ economic cost □ cultivar tolerance □ drip irrigation
instead of sprinkler or flood □ other ____________________
Weather unpredictability: □ seasonal production where possible □ protective crop structures
□ agro-meteorology forecast □ other ________________________
Increase/changes in pests: □ pest modeling □ biological control □ crop tolerance
□ integrated crop/pest management □ protective cropping
□ manage biodiversity (plant and animal) □ seasonal production where possible
□ other____________________________
Salt water intrusion: □ manage water extraction □ farm location □crop tolerance
□ technology (infrastructure) to combat intrusion □ agroforest systems
□ other________________________________
Changes in soil fertility: □soil amendment □compost □Effective Micro Organisms
□other ____________________________

National Agriculture Sector Adaptation Strategy to Address Climate Change in Belize
148
Heat stress on:
a. (i) Crops: □ irrigation □ cultivar tolerance □ improved production and marketing practices to combat yield losses □ other ________________________
b. (ii) Livestock (cattle, pigs, poultry): □ breed selection □infrastructure □ silvopastoral systems –shade trees
c. other ____________________________
46. What are the Climate Change issues that will need to be addressed through research?
□ Cultivar/breed selection for tolerance □ Pest/disease management □ Soils/nutrition
management □ Irrigation efficiency □ Alternative energy
□ Other ______________________
47. Are you familiar with Government of Belize’s Biosafety (GMO) policy?
□ Yes □ No
48. Do you support the Biosafety policy?
□ Yes □ No
49. How important is organic agriculture as an economic opportunity for agriculture?
□ Important □ Fairly important □ Slightly important
50. Is organic agriculture a good system for adaptation to Climate Change?
□ Yes □ No
51. How would you rank these sectors for their contribution to Belize’s economic development in
order of importance? (1 being the most important and 8 the least important)
□ Wholesale and retail □ Petroleum/ Oil □ Agriculture/agro processing
□ Tourism □ Aquaculture □ Offshore banking □ Forestry and fisheries
□ Manufacturing
52. How would you rank these sectors for their contribution in terms of financial benefits to
Belizeans in order of importance? (1 being the most important and 8 the least important)
□ Wholesale and retail □ Petroleum/ Oil □ Agriculture/agro processing
□ Tourism □ Aquaculture □ Offshore banking □ Forestry and fisheries
□ Manufacturing
53. How would you think the Government of Belize ranks these sectors in order of importance?
(1 being the most important and 8 the least important)
□ Wholesale and retail □ Petroleum/ Oil □ Agriculture/agro processing
□ Tourism □ Aquaculture □ Offshore banking □ Forestry and fisheries
□ Manufacturing

149
Section Two: Questions for Policy Makers
Name: _____________________________________________________________________
Institution: _____________________________________________________________________
Position: _____________________________________________________________________
Area of Training: _________________________________________________________________
1. How would you rank these sectors for their contribution to Belize’s economic development in
order of importance? (1 being the most important and 8 the least important)
□ Wholesale and retail □ Petroleum/ Oil □ Agriculture/agro processing
□ Tourism □ Aquaculture □ Offshore banking □ Forestry and fisheries
□ Manufacturing
2. How would you rank these sectors for their contribution in terms of financial benefits to
Belizeans in order of importance? (1 being the most important and 8 the least important)
□ Wholesale and retail □ Petroleum/ Oil □ Agriculture/agro processing
□ Tourism □ Aquaculture □ Offshore banking □ Forestry and fisheries
□ Manufacturing
3. What are the priorities of the Ministry of Natural Resources and the Environment?
______________________________________________________________________
How does the Ministry of Agriculture determine how it allocates its resources?
______________________________________________________________________
4. Where does the Ministry of Agriculture channel most of its human and financial resources?
□ Small farmers □ Medium farmer s □ Large farmers □ Export farmers
□ Domestic market farmers
5. What effects are currently being experienced in the Agricultural sector from Climate Change?
□ Flooding □ Drought □ Weather unpredictability □ Salt water intrusion
□ Increase/changes in pests □ Heat stress on crops/livestock □ Changes in soil fertility
□ Other ___________________________
What effects do your expect in the Agricultural sector from Climate Change? □ Flooding □ Drought □ Weather unpredictability □ Salt water intrusion □ Increase/changes in pests □ Heat stress on crops/livestock □ Changes in soil fertility □ Other ___________________________
6. Who identifies the Ministry of Agriculture’s research, development and extension needs?
□ Policy makers □ Extension agents □ Consensus from farmer groups
□ Research institutions □ Development partners □Other ____________________

National Agriculture Sector Adaptation Strategy to Address Climate Change in Belize
150
7. What are the problems of land use-related to Climate Change?
______________________________________________________________________
8. Is Government of Belize committed to implementing the Land Use Policy as it relates to
reserving land for agriculture?
□ Yes □ No
If yes, when? □ Short term (3 – 12 months) □ Medium term (1 – 5 years) □ Long term
(> 5 years) (High level officials only; Head of Department, Minister, Chief Executive Officer)
9. What major sectors must agriculture liaise with to successfully address Climate Change issues
in agriculture?
□ Education □ Forestry □ Lands □ Energy □ Meteorology
□ Tourism Environment □ Coastal Zone □ Health □ Non Government
Organizations □Other (could be more than one answer) _____________________
10. What sort of coordinating/liaising mechanism would you support or recommend?
______________________________________________________________________
11. Who should monitor the effects of Climate Change on agriculture?
□ Farmers/cooperative/association □ Meteorology Department □ Hydrology Department
□ Research institutions □ BAHA □ Agriculture Department
□ Other ___________________________
12. Are you familiar with Government of Belize’s Biosafety (GMO) policy?
□ Yes □ No
13. Do you support the Biosafety (GMO) Policy?
□ Yes □ No
14. How important is organic agriculture as an economic opportunity for agriculture?
□ Important □ Fairly important □ Slightly important □ Unimportant
15. How important is organic agriculture as an adaptation strategy for Climate Change?
□ Very important □ Fairly important □ Slightly important □ Unimportant
16. What actions need to be strengthened to effectively address Climate Change in agriculture?
□ Land use management □ Research □ Alternative energy
□ Integrated crop/pest management □ Preservation of watersheds and wetlands
□ Marketing □ Infrastructure □ Crop/livestock Insurance □Other ___________________

National Agriculture Sector Adaptation Strategy to Address Climate Change in Belize
151
If yes to insurance, what sort of insurance model would be appropriate?
□ Farmers Cooperative Insurance □ Formal Insurance sector
□Other __________________________
17. Who do you think should finance interventions to address Climate Change needs in
agriculture?
□ Farmers themselves □ Government of Belize □ Regional/International partners
□ Other __________________________
18. What interventions do you recommend to ameliorate negative effects of Climate Change on
agriculture?
Flooding: □ farm location □drainage (farm, community, national scheme) □cambering
□ road infrastructure □ wetlands management □ vegetation management to
prevent erosion □ other _____________________
Drought: □ water harvesting □ watershed management □ water recycling (eg. Aquaponics)
□ water policy-priority water use □ economic cost □ cultivar tolerance □ drip irrigation
instead of sprinkler or flood □ other ____________________
Weather unpredictability: □seasonal production where possible □protective crop
structures □ agro-meteorology forecast □ other ________________________
Increase/changes in pests: □ pest modeling □biological control □crop tolerance
□ integrated crop/pest management □ protective cropping □manage biodiversity
(plant and animal) □ seasonal production where possible □ research
□other ______________________
Salt water intrusion: □ manage water extraction □ farm location □crop tolerance
□ technology (infrastructure) to combat intrusion □ other ___________________
Changes in soil fertility: □soil amendment □compost □Effective Micro Organisms
□other __________________________
Heat stress on:
a. (i) Crops: □ irrigation □ cultivar tolerance □ improved production and marketing practices to combat yield losses □ other ________________________
a. (ii) Livestock (cattle, pigs, poultry): □ breed selection □infrastructure □ silvopastoral systems □ other___________________
19. What are the Climate Change issues that will need to be addressed through research?
□ Cultivar/breed selection for tolerance □ Pest/disease management
□ Soils/nutrition management □ Irrigation efficiency □ Alternative energy
□ Other _________________________
20. Who should be responsible for Climate Change research for adaptation in agriculture?
□ CARDI □ Central Farm □ NCCARD □ Individual Farmers’ organizations □ Other
__________________________
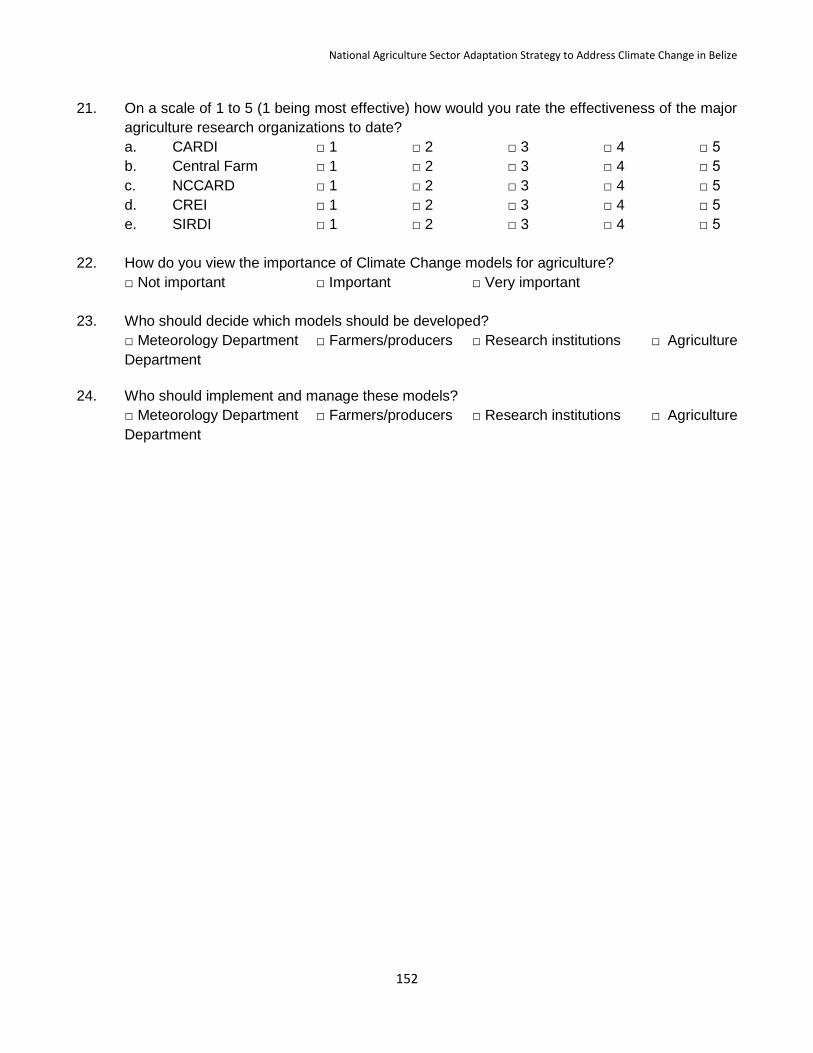
National Agriculture Sector Adaptation Strategy to Address Climate Change in Belize
152
21. On a scale of 1 to 5 (1 being most effective) how would you rate the effectiveness of the major
agriculture research organizations to date?
a. CARDI □ 1 □ 2 □ 3 □ 4 □ 5
b. Central Farm □ 1 □ 2 □ 3 □ 4 □ 5
c. NCCARD □ 1 □ 2 □ 3 □ 4 □ 5
d. CREI □ 1 □ 2 □ 3 □ 4 □ 5
e. SIRDI □ 1 □ 2 □ 3 □ 4 □ 5
22. How do you view the importance of Climate Change models for agriculture?
□ Not important □ Important □ Very important
23. Who should decide which models should be developed?
□ Meteorology Department □ Farmers/producers □ Research institutions □ Agriculture
Department
24. Who should implement and manage these models?
□ Meteorology Department □ Farmers/producers □ Research institutions □ Agriculture
Department

National Agriculture Sector Adaptation Strategy to Address Climate Change in Belize
153
Section Three: Questions for support agencies
Name: ___________________________________________________________________
Institution: ___________________________________________________________________
Position: ___________________________________________________________________
Area of Training: _____________________________________________________________
1. How would you rank these sectors for their contribution to Belize’s economic development in
order of importance? (1 being the most important and 8 the least important)
□ Wholesale and retail □ Petroleum/ Oil □ Agriculture/agro processing
□ Tourism □ Aquaculture □ Offshore banking □ Forestry and fisheries
□ Manufacturing
2. How would you rank these sectors for their contribution in terms of financial benefits to
Belizeans in order of importance? (1 being the most important and 8 the least important)
□ Wholesale and retail □ Petroleum/ Oil □ Agriculture/agro processing □
Tourism □ Aquaculture □ Offshore banking □ Forestry and fisheries
□ Manufacturing
3. How are you involved with the agriculture sector?
□ Advisory □ Partnering in implementation □ Project development □ Funding
□ Research
4. How do you view your role in regards to Climate Change actions for agriculture?
□ Advisory □ Partnering in implementation □ Project development □ Funding
□ Research
5. What actions need to be strengthened to effectively address Climate Change in agriculture?
□ Land use management □ Research □ Alternative energy □ Integrated crop/pest
management □ Preservation of watersheds and wetlands □ Marketing
□ Infrastructure □ Commodity Insurance □Other _________________________
6. What major sectors must agriculture liaise with to successfully address Climate Change issues in
agriculture?
□ Education □ Forestry □ Lands □ Energy □ Meteorology
□ Tourism □ Environment □ Coastal Zone □ Health
□ Non-Governmental Organizations □ Other ___________________________
7. How well do you think these sectors liaise at present?
□ Very well □ Fairly well □ Somewhat □ Not at all

National Agriculture Sector Adaptation Strategy to Address Climate Change in Belize
154
8. What sort of coordinating/liaising mechanism would you support or recommend?
______________________________________________________________________
9. Who should monitor the effects of Climate Change on agriculture?
□ Farmers/cooperative/association □ Meteorology Department □ Hydrology
Department □ Research institutions □ BAHA □ Agriculture Department
□ Other __________________________
10. Are you familiar with Government of Belize’s Biosafety (GMO) policy?
□ Yes □ No
11. Do you support the Biosafety Policy?
□ Yes □ No
12. How important is organic agriculture as an economic opportunity for agriculture?
□ Very important □ Fairly important □ Slightly important □ Unimportant
13. How important is organic agriculture as an adaptation strategy for Climate Change?
□ Very important □ Fairly important □ Slightly important □ Unimportant
14. What interventions do you recommend to ameliorate negative effects of Climate Change on
agriculture?
Flooding: □ farm location □drainage (farm, community, national scheme) □cambering
□ road infrastructure □ wetlands management □ vegetation management to
prevent erosion □ other _____________________
Drought: □ water harvesting □ watershed management □ water recycling (eg. Aquaponics)
□ water policy-priority water use □ economic cost □ cultivar tolerance □ drip irrigation
instead of sprinkler or flood □ other ____________________
Weather unpredictability: □seasonal production where possible □protective crop
structures □ agro-meteorology forecast □ other ________________________
Increase/changes in pests: □ pest modeling □biological control □crop tolerance
□ integrated crop/pest management □ protective cropping □manage biodiversity
(plant and animal) □ seasonal production where possible □ research
□other ______________________
Salt water intrusion: □ manage water extraction □ farm location □crop tolerance
□ technology (infrastructure) to combat intrusion □ other ___________________
Changes in soil fertility: □soil amendment □compost □Effective Micro Organisms
□other __________________________

National Agriculture Sector Adaptation Strategy to Address Climate Change in Belize
155
Heat stress on:
a. (i) Crops: □ irrigation □ cultivar tolerance □ improved production and marketing practices to combat yield losses □ other ________________________
b. (ii) Livestock (cattle, pigs, poultry): □ breed selection □ infrastructure □ silvopastoral systems □ other_______________________
15. What major climate change issues need to be addressed through research?
□ Cultivar/breed selection for tolerance □ Pest/disease management
□ Soils/nutrition management □ Irrigation efficiency □ Alternative energy
□ Other __________________________
16. Who do you think should finance interventions to address climate change needs for farmers?
□ Farmers themselves □ Government of Belize □ Regional/International partners
□ Others _____________________________
17. Are you prepared to finance the actions relating to Climate Change adaptation for agriculture?
□ Yes □ No
If yes, through what means or modus?
______________________________________________________________________
18. CARDI, BAHA, OIRSA, SIRDI, CREI – (Research Institutions)
How do you view the importance of pest modelling for Climate Change in agriculture?
□ Very important □ Somewhat important □ Unimportant
19. Who should decide what models should be developed?
□ Meteorology Department □ Farmers/producers □Research institutions □ Agriculture
Department
20. Who should be responsible for implementing and managing these models?
□ Meteorology Department □ Farmers/producers □Research institutions □ Agriculture
Department

National Agriculture Sector Adaptation Strategy to Address Climate Change in Belize
156
Annex II – Database of responses
Stakeholder Policy
makers
Support agencies
Producers
# Respondents 25
17
83 Issue Responses % Responses % Responses %
Agriculture considered most important sector for Belize’s economic development 16 64% 9 53% 45 54%
Agriculture considered most important sector for financial benefit to Belizeans 20 80% 10 59% 42 51%
Agriculture ranked as second most important sector for economic development 6 24% 3 18% 14 17%
Agriculture ranked as second most important sector for financial benefit to Belizeans 3 12% 3 18% 9 11%
CC effects on agriculture noted 21 84% X
64 77%
Knowledge of GMO policy 13 52% 12 71% 9 11%
Supports GMO policy 10 40% 12 71% 6 7%
Does not support GMO policy 1 4% 0 0% 3 4%
Organic agriculture as an economic opportunity 18 72% 10 59% 67 81%
Organic as an option for CC adaptation 19 76% 10 59% 66 80%
Actions to strengthen Land use management 22 88% 14 82% x
Research 20 80% 8 47% x Alternative energy 12 48% 4 24% x Integrated crop management 17 68% 11 65% x Watershed/wetlands 22 88% 11 65% x Marketing 7 28% 3 18% x Infrastructure 12 48% 9 53% x Insurance 15 60% 7 41% 66 80%
Farmers/Assoc. insurance 10 40% X
46 55%
Formal insurance sector 2 8% X
15 18%
Hybrid GOB/farmers 3 12% X
2 2%
Liaising needs –Sectors
0% Education 16 64% 14 82% x
Forestry 17 68% 10 59% x Lands 16 64% 10 59% x Energy 11 44% 7 41% x Meteorology 19 76% 12 71% x Tourism 4 16% 5 29% x Environment 12 48% 12 71% x Coastal Zone 12 48% 8 47% x Health 7 28% 2 12% x NGOs 13 52% 7 41% x
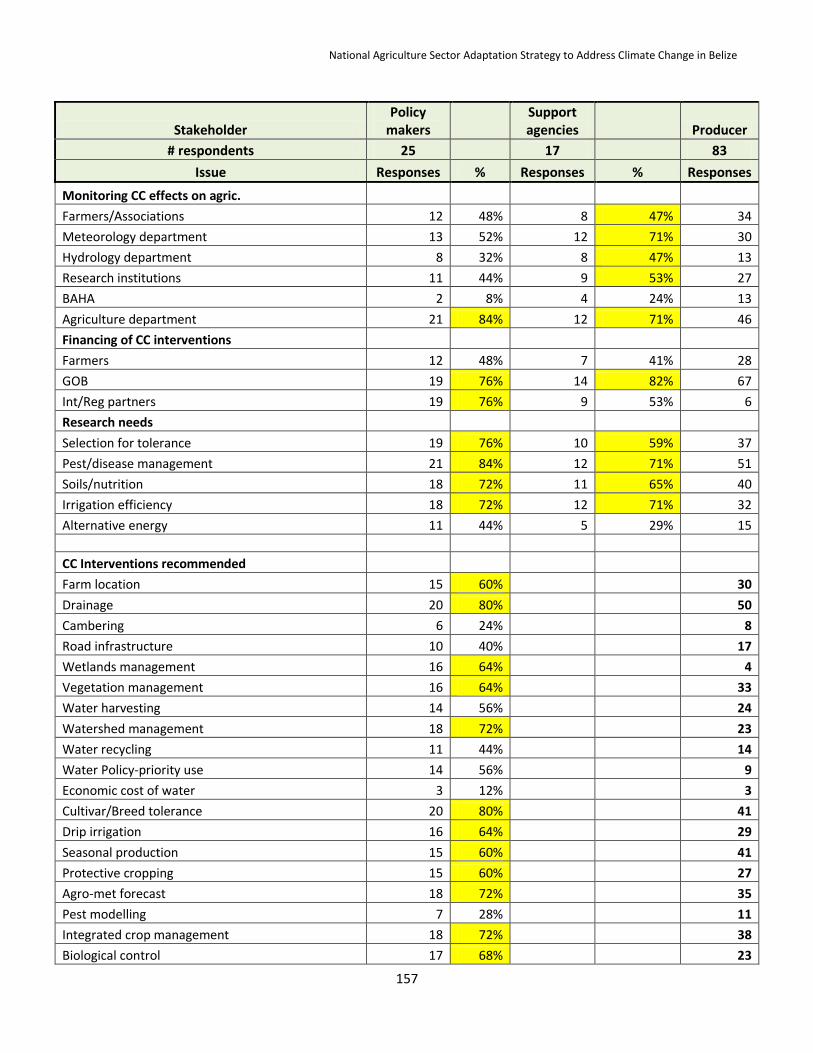
National Agriculture Sector Adaptation Strategy to Address Climate Change in Belize
157
Stakeholder Policy
makers
Support agencies
Producer
# respondents 25
17
83
Issue Responses % Responses % Responses
Monitoring CC effects on agric.
Farmers/Associations 12 48% 8 47% 34
Meteorology department 13 52% 12 71% 30
Hydrology department 8 32% 8 47% 13
Research institutions 11 44% 9 53% 27
BAHA 2 8% 4 24% 13
Agriculture department 21 84% 12 71% 46
Financing of CC interventions
Farmers 12 48% 7 41% 28
GOB 19 76% 14 82% 67
Int/Reg partners 19 76% 9 53% 6
Research needs
Selection for tolerance 19 76% 10 59% 37
Pest/disease management 21 84% 12 71% 51
Soils/nutrition 18 72% 11 65% 40
Irrigation efficiency 18 72% 12 71% 32
Alternative energy 11 44% 5 29% 15
CC Interventions recommended
Farm location 15 60% 30
Drainage 20 80% 50
Cambering 6 24% 8
Road infrastructure 10 40% 17
Wetlands management 16 64% 4
Vegetation management 16 64% 33
Water harvesting 14 56% 24
Watershed management 18 72% 23
Water recycling 11 44% 14
Water Policy-priority use 14 56% 9
Economic cost of water 3 12% 3
Cultivar/Breed tolerance 20 80% 41
Drip irrigation 16 64% 29
Seasonal production 15 60% 41
Protective cropping 15 60% 27
Agro-met forecast 18 72% 35
Pest modelling 7 28% 11
Integrated crop management 18 72% 38
Biological control 17 68% 23

National Agriculture Sector Adaptation Strategy to Address Climate Change in Belize
158
Biodiversity 13 52% 9
Research 12 48% 1
Manage water extraction 8 32% 9
Saltwater combat technology 11 44% 8
Soil amendment 11 44% 26
Compost 18 72% 51
Micro-organisms 13 52% 32
Irrigation 21 84% 44
Improved production 14 56% 31
Heat stress infrastructure 9 36% 11
Silvopastoral systems 15 60% 24
Agroforestry 1 4% 12
Producer Issues
Total respondents = 83 #
Responses % #
Responses %
Age - under 42 43 52% Pest control practices
Age- Under 54 25 30% Chemical pesticides 57 69%
Age - over 65 7 8% Organic pesticides 7 8%
Landscape Integrated pest management 19 23%
Flat 48 58% Cultivation practices 16 19%
Rolling 26 31% Very effective pest control 30 36%
Steep 6 7% Fairly effective pest control 48 58%
Years in farming Poor pest control 3 4%
1 to 10 years 18 22% Irrigation used 31 37%
11 to 20 years 28 34% No irrigation used 48 58%
21 years and more 37 45% Prepared to pay for water 31 37%
Farm location Enterprise profitable 75 90%
Flood plain 35 42% Support/advice needed
Coastal low lying 15 18% Technical assistance 46 55%
Close to forest 32 39% Credit 29 35%
Soil type Infrastructure 27 33%
Sandy 3 4% Technology 30 36%
Sandy loam 24 29% Market 2 2%
Loam 16 19% Imp. of weather forecast
Clay loam 28 34% Not important 2 2%
Heavy clay 8 10% Some extent 26 31%
Home consumption > 24% 18 22% Very much 52 63%
Seed source Prepared to pay for insurance 59 71%
Self supply 29 35% Would relocate farm 40 48%
Agric. Suppliers 42 51%
Farmers 12 14%
Min/CARDI 6 7%

National Agriculture Sector Adaptation Strategy to Address Climate Change in Belize
159
Annex III – Climate Change and Agriculture in Belize
ANNEX III A: IPCC Fifth Assessment Report Indicators
Summary of some of the main indicators captured in the IPCC AR-5 Report
Increase in greenhouse gas (GHG) concentrations: The concentration of greenhouse gases (GHG)
in the atmosphere continues to increase. In 2011, the concentration of carbon dioxide (CO2)—the most
significant GHG emitted into the atmosphere—reached 390.5 ppm or 40 percent higher than
concentrations measured prior to the industrial revolution (280 pm). In April 2014, global CO2
concentrations hit 402 ppm, the highest levels in over 800,000 years. There is near universal consensus
in the scientific community that this increase in GHG and CO2 concentrations, due to human activity,
has triggered a series of dynamic changes in the Earth’s climate system.
Increasing Ocean and Air Temperatures: As a result of increasing GHG concentrations, global
mean surface temperature (both land and oceans) has increased by 0.85°C since the late 19th
century.
More specifically, the last three decades have been the warmest period of the past 1400 years. The
number of warm days and nights has increased on a global scale, resulting in fewer cold days and
nights. And because of better data collection since the Fourth Assessment, the IPCC is also certain that
global average sea surface temperatures (SST) have increased as well.
Changes in Extreme Weather: In the United States, the impacts of extreme weather events like
Superstorm Sandy and Hurricane Katrina are beginning to leave a lasting impression of climate
change. And while economic and population growth also play a significant role in the overall impact of
extreme weather events, the IPCC states that heat waves, heavy precipitation events, tropical cyclones,
and drought have increased in many regions across the world. With only a few exceptions, wet regions
are becoming wetter, and dry regions are becoming drier, exacerbating impacts of both floods and
droughts around the world.
Loss in Ice Sheets, Glaciers, Sea Ice Extent, and Snow Cover: With the rise in air and ocean
temperatures, it’s no surprise that the planet’s ice and snow has begun to melt. In the past 20 years, ice
sheets in both Greenland and Antarctica have been losing mass. The rate of ice loss in the most recent
decade was eight-times faster in Greenland, and nearly five-times faster in Antarctica, compared to the
prior decade. Similarly, glaciers, Arctic sea ice, and snow cover in the Northern Hemisphere have also
decreased substantially.
Rise in Sea Level: Accounting for ocean currents, wind, and geography, global sea levels have risen,
largely due to the loss of glacier mass, sea ice, and ice sheets, as well as ocean expansion due to
warmer temperatures. According to the IPCC, sea levels have risen by 1.7 mm/year since 1901, a faster
rate since the mid-19th
century compared to the previous two millennia. In the last 20 years, the rate of
sea level rise has nearly doubled. (IPCC, 2014)

National Agriculture Sector Adaptation Strategy to Address Climate Change in Belize
160
IPCC SRES Climate Scenarios
The schematic below is an IPCC illustration of the Special Report on Emission Scenarios (SRES)
(IPCC, 2007). Climate Scenario A2 describes a very heterogeneous world with strong population
growth, slow economic development and slow technological change.
Climate Scenario B2 describes a world with a medium population and medium economic growth, more
oriented toward local solutions to reach economic, social and environmental sustainability.
Climate Scenario B1 describes a convergent world with the same global population that peaks by mid-
century and declines thereafter, as in A1, with emphasis on global solutions to economic, social and
environmental sustainability, including improved equity, but without additional climate initiatives.
Climate Scenario A1 describes a future world of very rapid economic growth, global population peaks
by mid-century and declines thereafter, and rapid introduction of new and more efficient technologies.
Three A1 groups are: A1F1 - fossil intensive; A1T - non-fossil energy sources; and, A1B - a balance
across all sources.
Illustration of IPCC Special Report on Emission Scenarios (SRES)

National Agriculture Sector Adaptation Strategy to Address Climate Change in Belize
161
ANNEX III B: Optimum Temperature and Growing Periods for some of Belize’s major crops
(Source: CGIAR 2013)

National Agriculture Sector Adaptation Strategy to Address Climate Change in Belize
162
ANNEX III C: Climate Change Severity Index
(Source: Anderson et. al., 2008)

National Agriculture Sector Adaptation Strategy to Address Climate Change in Belize
163
ANNEX III D: Sea Level Rise
The Inter Governmental Panel on Climate Change (IPCC) Fifth Assessment Report (AR5, 2013)
indicate that:
“Global mean sea level will continue to rise during the 21st century. Under all RCP scenarios, the rate
of sea level rise will very likely exceed that observed during 1971 to 2010 due to increased ocean
warming and increased loss of mass from glaciers and ice sheets.”
The confidence in projections of global mean sea level (MSL) rise has increased since AR4. Model
projections indicate that global MSL rise for 2081-2100 will likely be in the range of 0.26 to 0.55 m for
RCP 2.6, 0.32 to 0.63 m for RCP 4.5, 0.33 to 0.63 m for RCP6.0, and 0.45 to 0.82 m for RCP8.5
(medium confidence). The Figure below shows CMIP5 models global MSL projections under the
high, medium and low RCPs scenarios.
Projections of global mean sea level rise over the 21st century relative to 1986-2005 from a combination of the
CMIP5 ensemble with process-based models (RCP2.6 – RCP8.5) (SPM WGI, IPCC 2013)
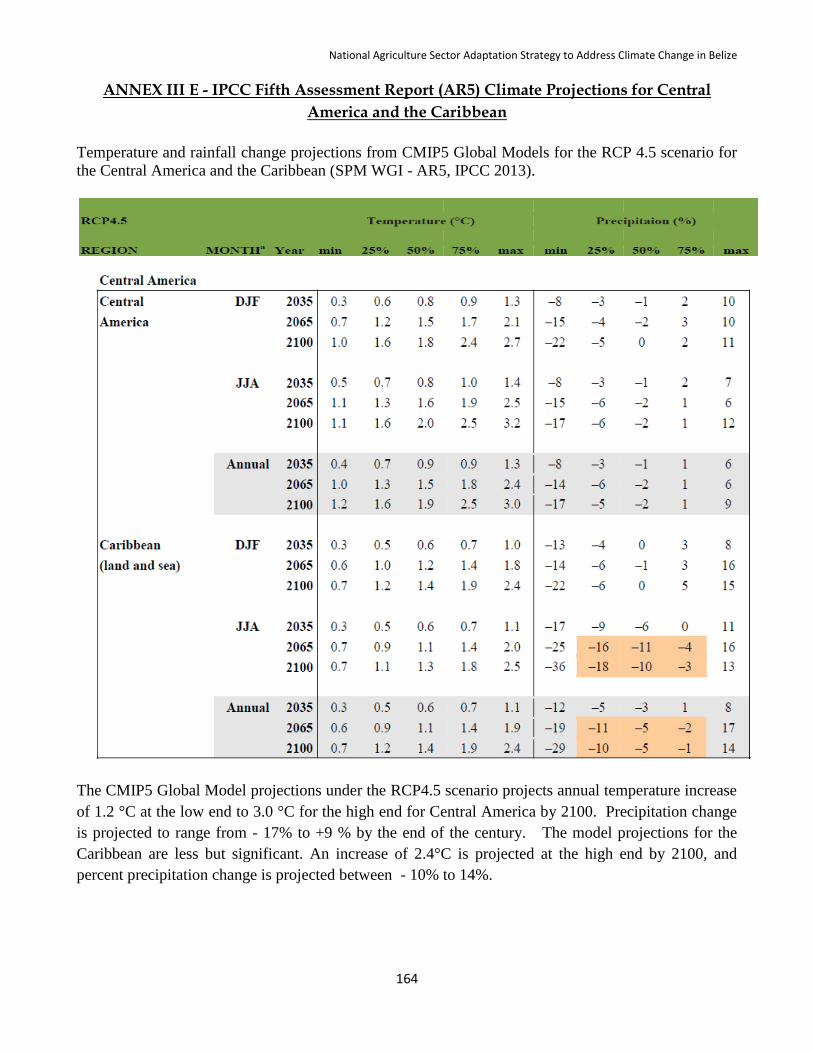
National Agriculture Sector Adaptation Strategy to Address Climate Change in Belize
164
ANNEX III E - IPCC Fifth Assessment Report (AR5) Climate Projections for Central
America and the Caribbean
Temperature and rainfall change projections from CMIP5 Global Models for the RCP 4.5 scenario for
the Central America and the Caribbean (SPM WGI - AR5, IPCC 2013).
The CMIP5 Global Model projections under the RCP4.5 scenario projects annual temperature increase
of 1.2 °C at the low end to 3.0 °C for the high end for Central America by 2100. Precipitation change
is projected to range from - 17% to +9 % by the end of the century. The model projections for the
Caribbean are less but significant. An increase of 2.4°C is projected at the high end by 2100, and
percent precipitation change is projected between - 10% to 14%.
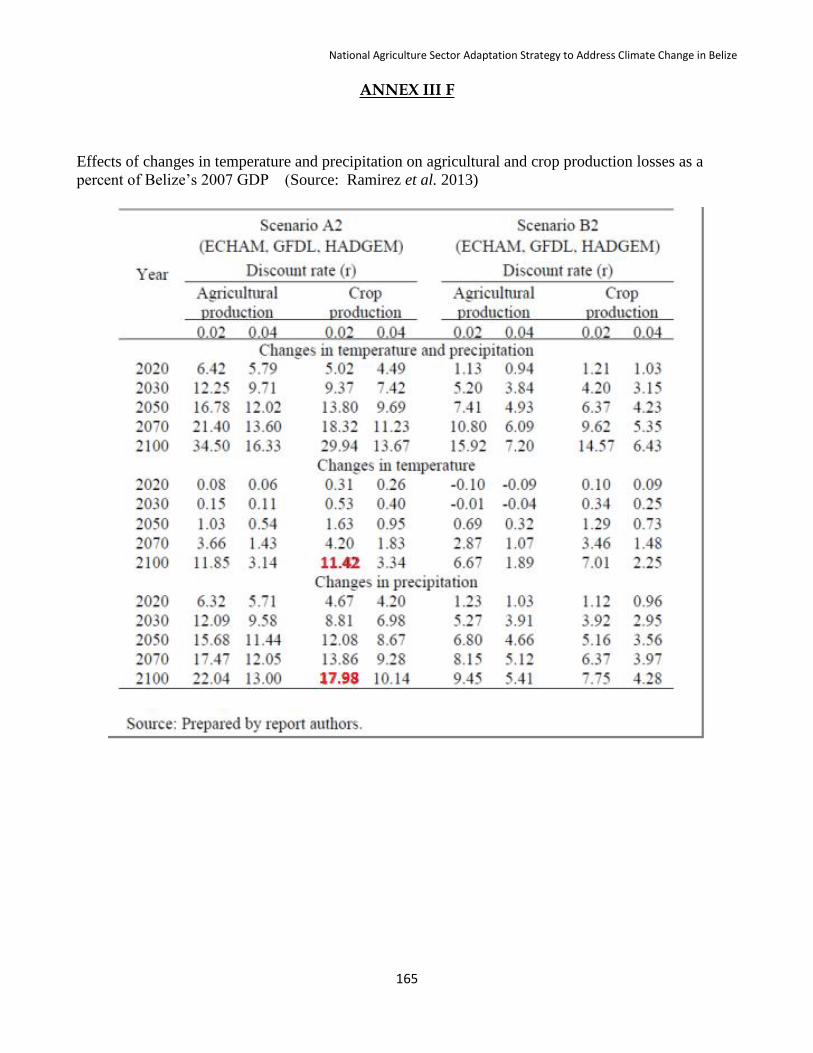
National Agriculture Sector Adaptation Strategy to Address Climate Change in Belize
165
ANNEX III F
Effects of changes in temperature and precipitation on agricultural and crop production losses as a
percent of Belize’s 2007 GDP (Source: Ramirez et al. 2013)
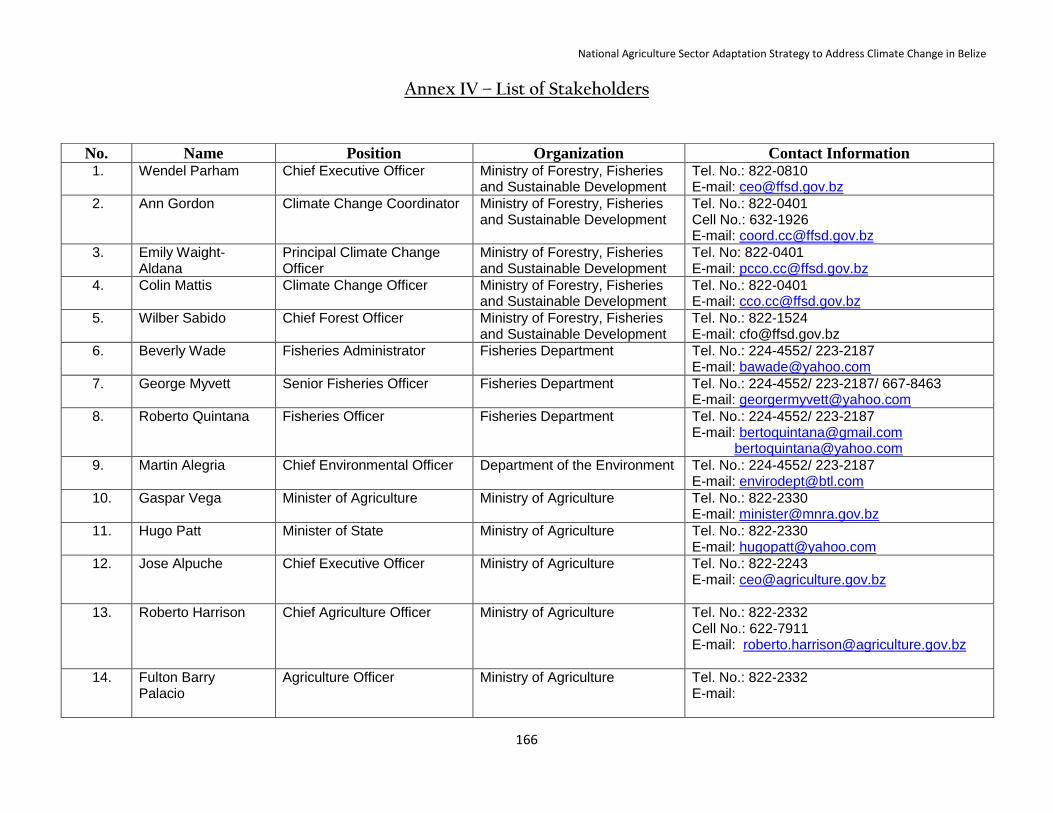
National Agriculture Sector Adaptation Strategy to Address Climate Change in Belize
166
Annex IV – List of Stakeholders
No. Name Position Organization Contact Information 1. Wendel Parham Chief Executive Officer Ministry of Forestry, Fisheries
and Sustainable Development Tel. No.: 822-0810 E-mail: [email protected]
2. Ann Gordon Climate Change Coordinator Ministry of Forestry, Fisheries and Sustainable Development
Tel. No.: 822-0401 Cell No.: 632-1926 E-mail: [email protected]
3. Emily Waight-Aldana
Principal Climate Change Officer
Ministry of Forestry, Fisheries and Sustainable Development
Tel. No: 822-0401 E-mail: [email protected]
4. Colin Mattis Climate Change Officer Ministry of Forestry, Fisheries and Sustainable Development
Tel. No.: 822-0401 E-mail: [email protected]
5. Wilber Sabido Chief Forest Officer Ministry of Forestry, Fisheries and Sustainable Development
Tel. No.: 822-1524 E-mail: [email protected]
6. Beverly Wade Fisheries Administrator Fisheries Department Tel. No.: 224-4552/ 223-2187 E-mail: [email protected]
7. George Myvett Senior Fisheries Officer Fisheries Department Tel. No.: 224-4552/ 223-2187/ 667-8463 E-mail: [email protected]
8. Roberto Quintana Fisheries Officer Fisheries Department Tel. No.: 224-4552/ 223-2187 E-mail: [email protected] [email protected]
9. Martin Alegria Chief Environmental Officer Department of the Environment Tel. No.: 224-4552/ 223-2187 E-mail: [email protected]
10. Gaspar Vega Minister of Agriculture Ministry of Agriculture Tel. No.: 822-2330 E-mail: [email protected]
11. Hugo Patt Minister of State Ministry of Agriculture Tel. No.: 822-2330 E-mail: [email protected]
12. Jose Alpuche Chief Executive Officer Ministry of Agriculture Tel. No.: 822-2243 E-mail: [email protected]
13. Roberto Harrison Chief Agriculture Officer Ministry of Agriculture Tel. No.: 822-2332 Cell No.: 622-7911 E-mail: [email protected]
14. Fulton Barry Palacio
Agriculture Officer Ministry of Agriculture Tel. No.: 822-2332 E-mail:

National Agriculture Sector Adaptation Strategy to Address Climate Change in Belize
167
No. Name Position Organization Contact Information 15. Ricardo Thompson Principal Agriculture Officer Ministry of Agriculture Tel. No.:822-2332
Cell No.: 621-5628 E-mail: [email protected]
16. Phillip Tate Policy Analyst Ministry of Agriculture Tel. No.: 802-2241 Cell No.: 623-3253 E-mail: [email protected]
17. Jose Novelo Project Officer Ministry of Agriculture Tel. No.: 822-2332 E-mail: [email protected]
18. Gareth Murillo Registrar of Cooperatives Ministry of Agriculture Tel. No.: 628-0595 E-mail: [email protected]
19. Andrew Harrison Climate Change Focal Point and Marketing Officer
Ministry of Agriculture Tel. No.: 626-9489 E-mail: [email protected]
20. Belarmino Esquivel Director of Extension Ministry of Agriculture Tel. No.: 630-5488 E-mail: [email protected]
21. Francisco Quiroz Director of Central Farm Ministry of Agriculture Tel. No.: 624-6538 E-mail: [email protected]
22. Carlos Itza Director Project Execution Unit
Ministry of Agriculture Tel. No.: 620-7155 E-mail: [email protected]
23. Ina Sanchez Acting Director of Research-NCCARD
Ministry of Agriculture Tel. No.: 623-0771 E-mail: [email protected]
24. Justaquio Tush Livestock Officer Ministry of Agriculture Tel. No.: 630-9634 E-mail.: [email protected]
25. Ana Howe Coordinator Agro-processing unit
Ministry of Agriculture Tel. No.: 634-9132 E-mail: [email protected]
26. Fay Garnet District Agriculture Coordinator-Cayo District
Ministry of Agriculture Tel. No.: 636-0918 E-mail: [email protected]
27. Carlos Tzul Acting District Agriculture Coordinator- Corozal District
Ministry of Agriculture Tel. No.: E-mail: [email protected]
28. Augustos Gilharry District Agriculture Coordinator- Orange Walk
Ministry of Agriculture Tel. No.: 623-8246 E-mail: [email protected]
29. Flint Wagner District Agriculture Coordinator-Toledo District
Ministry of Agriculture Tel. No.: 627-8061/662-0427 E-mail: [email protected]
30. Denzil Castillo District Agriculture Coordinator- Stann Creek District
Ministry of Agriculture Tel. No.: 669-2577 E-mail: [email protected]

National Agriculture Sector Adaptation Strategy to Address Climate Change in Belize
168
No. Name Position Organization Contact Information 31. Clifford Martinez District Agriculture
Coordinator- Belize District Ministry of Agriculture Tel. No.: 651-2597
E-mail: [email protected]
32. Wilbert Vallejos Commissioner of Lands Ministry of Natural Resources and the Environment
Tel. No.: 822-2249/2232/2711 E-mail: [email protected]
33. Caren Williams In-charge of LIC Land Information Centre (LIC), Ministry of Natural Resources and the Environment
Tel. No.: 822-2249/2232/2711 E-mail: [email protected]
34. General Office Orla Kantun-Coleman
Belmopan Director
Ministry of Trade, Private Sector Development & Consumer Protection
Tel. No.: 822-0405 E-mail: [email protected]
35. Yvonne S. Hyde Chief Executive Officer Ministry of Economic Development
Tel. No.: 822-2526/27 E-mail: [email protected]
36. Kathrine Mendez Deputy Authorizing Officer Ministry of Economic Development
Tel. No.: 822-2526 E-mail: [email protected]
37. Tracy Taeger-Panton
Chief Executive Officer Ministry of Tourism & Culture Tel. No.:227-2801/227-2802 E-mail: [email protected]
38. Abil Castaneda Senior Tourism Officer Ministry of Tourism & Culture Tel. No.: 227-2801/227-2802 E-mail: [email protected]
39. Candelaria Saldivar-Morter Eugene Palacio
Chief Executive Officer Director
Ministry of Local Government and Rural Development
Ministry of Local Government
Tel. No.: 822-2357 E-mail: [email protected] E-mail: [email protected] [email protected]
40. Yvette Alvarez Senior Economic Advisor Ministry of Finance Tel. No.: 822-2362 E-mail: [email protected]
41. Dennis Gonguez Chief Met Officer Meteorology Department, Ladyville
Tel. No.: 225-2012 E-mail: [email protected]/ [email protected]
42. Rudolph Williams Director Public Utilities Commission Tel. No.: 610-5244 E-mail: [email protected]/ [email protected]
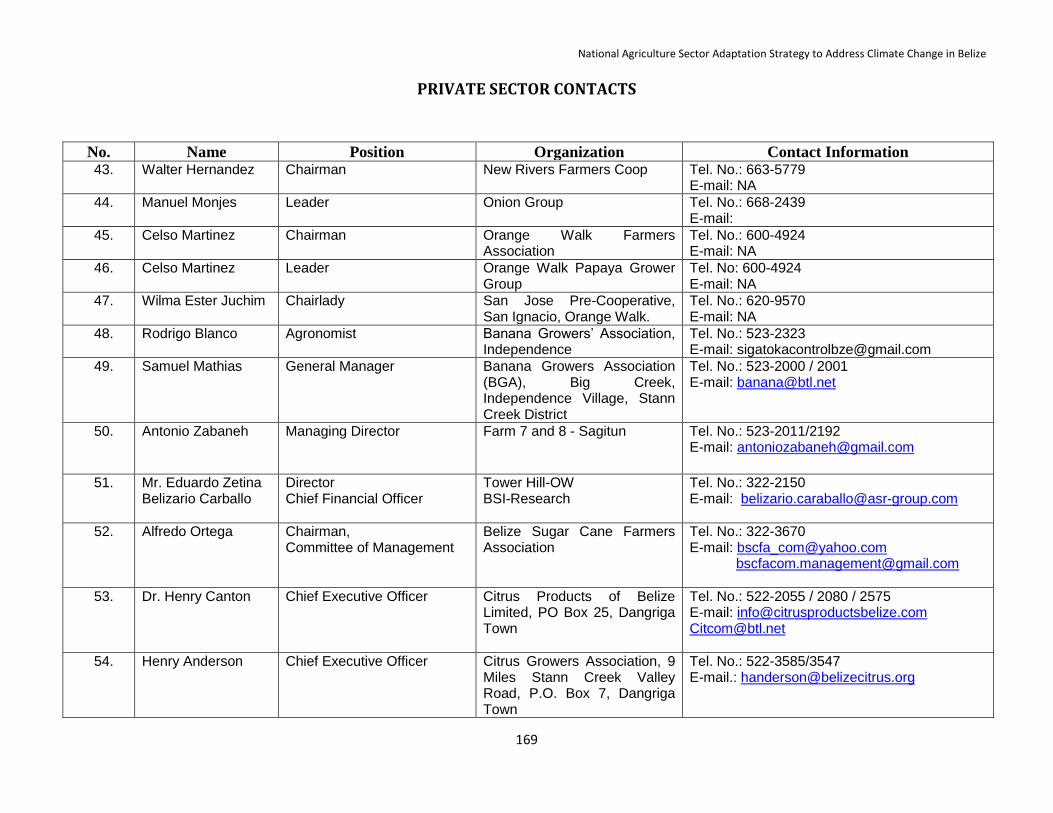
National Agriculture Sector Adaptation Strategy to Address Climate Change in Belize
169
PRIVATE SECTOR CONTACTS
No. Name Position Organization Contact Information 43. Walter Hernandez Chairman New Rivers Farmers Coop Tel. No.: 663-5779
E-mail: NA
44. Manuel Monjes Leader Onion Group Tel. No.: 668-2439 E-mail:
45. Celso Martinez Chairman Orange Walk Farmers Association
Tel. No.: 600-4924 E-mail: NA
46. Celso Martinez Leader Orange Walk Papaya Grower Group
Tel. No: 600-4924 E-mail: NA
47. Wilma Ester Juchim Chairlady San Jose Pre-Cooperative, San Ignacio, Orange Walk.
Tel. No.: 620-9570 E-mail: NA
48. Rodrigo Blanco Agronomist Banana Growers’ Association, Independence
Tel. No.: 523-2323 E-mail: [email protected]
49. Samuel Mathias General Manager Banana Growers Association (BGA), Big Creek, Independence Village, Stann Creek District
Tel. No.: 523-2000 / 2001 E-mail: [email protected]
50. Antonio Zabaneh Managing Director Farm 7 and 8 - Sagitun
Tel. No.: 523-2011/2192 E-mail: [email protected]
51. Mr. Eduardo Zetina Belizario Carballo
Director Chief Financial Officer
Tower Hill-OW BSI-Research
Tel. No.: 322-2150 E-mail: [email protected]
52. Alfredo Ortega Chairman, Committee of Management
Belize Sugar Cane Farmers Association
Tel. No.: 322-3670 E-mail: [email protected] [email protected]
53. Dr. Henry Canton Chief Executive Officer Citrus Products of Belize Limited, PO Box 25, Dangriga Town
Tel. No.: 522-2055 / 2080 / 2575 E-mail: [email protected] [email protected]
54. Henry Anderson Chief Executive Officer Citrus Growers Association, 9 Miles Stann Creek Valley Road, P.O. Box 7, Dangriga Town
Tel. No.: 522-3585/3547 E-mail.: [email protected]

National Agriculture Sector Adaptation Strategy to Address Climate Change in Belize
170
No. Name Position Organization Contact Information 55. Henry Warrinton
Gilberto Vivas
Director General Manager
Fruta Bomba, P.O. Box 192, Corozal Town
Tel. No.: 423-0333/0336/0050 E-mail: [email protected] E-mail:[email protected]
56. Thomas Tillett Luis Armando Choco
TCGA Project Coordinator IDB/MIF Executive Director
Toledo Cacao Growers Association, P.O. Box 160, George Price Street, Punta Gorda Town, Toledo District
Tel. No.: 722-2992 Fax: 722-0109 E-mail: [email protected] www.tcgbelize.com E-mail: [email protected]
57. Elroy Foreman Representative Delta Pride Limited, Agriculture Services, Big Creek Blvd
Tel. No.: 533-3030 E-mail: [email protected]
58. Orlando Habet Jake Rempel
Executive Secretary Chairman
Belize Poultry Association, 9 Far West St., San Ignacio, Cayo District P.O. Box 274
Tel. No.: 824-3221 E-mail: [email protected]
59. Alistair Macpherson Chief Executive Officer Belize Livestock Producers Association (BLPA), 47 ½ George Price Highway, P.O. Box 183, Belmopan City
Tel. No.: 822-3883 E-mail: [email protected]
60. Frank Redmond Representative Belmaize, P.O. Box 13, San Ignacio, Cayo District
Tel. No.: 824-3353 E-mail: [email protected]
61. Esmeralda Quiroz Manager Cayo Tropical Fruits Ltd. / Big H, 35 Buena Vista St., San Ignacio, Cayo District
Tel. No.: 824-2646 / 2444 E-mail: [email protected]
62. Cashew Growers Association, 117 North Front St., Belize City
Tel. No.: 222-4072 E-mail: [email protected]
63. Rudy Pletts Manager Country Meat Products, P.O. Box 427, Belize City
Tel. No.: 823-0420/610-3038 E-mail: [email protected]
64. Abdala Bedran Director/Manager Running W Brand Meats Tel. No.: 824-2126 E-mail: [email protected]
65. Craig Clark Manager Sol Farms Limited, Western Highway, Teakettle Village, Cayo District
Tel. No.: 628-9040 E-mail: [email protected]

National Agriculture Sector Adaptation Strategy to Address Climate Change in Belize
171
No. Name Position Organization Contact Information 66. Rio Azul Processing and
Cannery, Blue Creek, P.O. Box 2, Orange Walk Town
Tel. No.: 323-0983 E-mail: [email protected]
67. Marie Sharp Manager Marie Sharp Fine Food Products, P.O. Box 6, Dangriga Town
Tel. No.: 522-2370 E-mail: [email protected]
68. Maurice Westby Dawn Banner
President Belize Rural Area Development Group
Tel. No.: 629-8612 or 6229988 E-mail: [email protected]
69. Samuel Westby Chairman Northern Crop and Livestock Cooperative
Tel. No.: 635-4457 E-mail: [email protected]
70. Wayne Moody Robert Gongora
Chairman Belize River Valley Grains Producer
Tel. No.: 604-7590 or 610-4138 E-mail: [email protected]
71. Rudolf Crawford Chairman Crooked Tree Livestock Producers/ Belize United Farmer Field School
Tel. No.: 607-2193 or 207-2193 E-mail: NA
72. Jose Matias Miranda President La Pasadita Farmers Group Tel. No.: 633-3257 E-mail: NA
73. Victor Padilla Herman Ramirez
Treasurer President
Maskall Farmer Cooperative, Maskall Village
Tel. No.: 205-5563 E-mail: N/A
74. Ruben Pineda Alex Pineda
President Los Pequeños Agricultores y Ganaderos de Nago Bank
Tel. No.: 630-4639 or 655-7832/668-1239 E-mail: [email protected]
75. Dinsdale Thompson Chairman Belize River Valley Poultry Producers
Tel. No.: 633-8292 E-mail: NA
76. Paul Cassanova Project Coordinator CYDP Agriculture Development, 37 Miles, Phillip Goldson Highway
Tel. No.: 661-5900 E-mail: [email protected]

National Agriculture Sector Adaptation Strategy to Address Climate Change in Belize
172
AQUACULTURE
No. Name Position Organization Contact Information 77. Alvin Henderson General Manager Royal Mayan Farmers Ltd.,
Savannah Area, Independence Village, Stann Creek District
Tel. No.: 533-3066/3055 Fax: 520-3011 E-mail: [email protected]/ [email protected]
78. David Fleming General Manager Belize Aquaculture Ltd., Mile 4, Placencia Road, Stann Creek District
Tel. No.: 521-2100 E-mail: [email protected]
79. c/o Alvin Henderson General Manager Shrimp Growers Association, c/o Alvin Henderson, Independence Village, Stann Creek District
Tel. No.: 523-2282 E-mail: [email protected]
80. Carol Dujon Project Manager Belize National Tilapia Small Producers Cooperative Society Ltd.
Tel. No.: 625-5914 E-mail: [email protected]
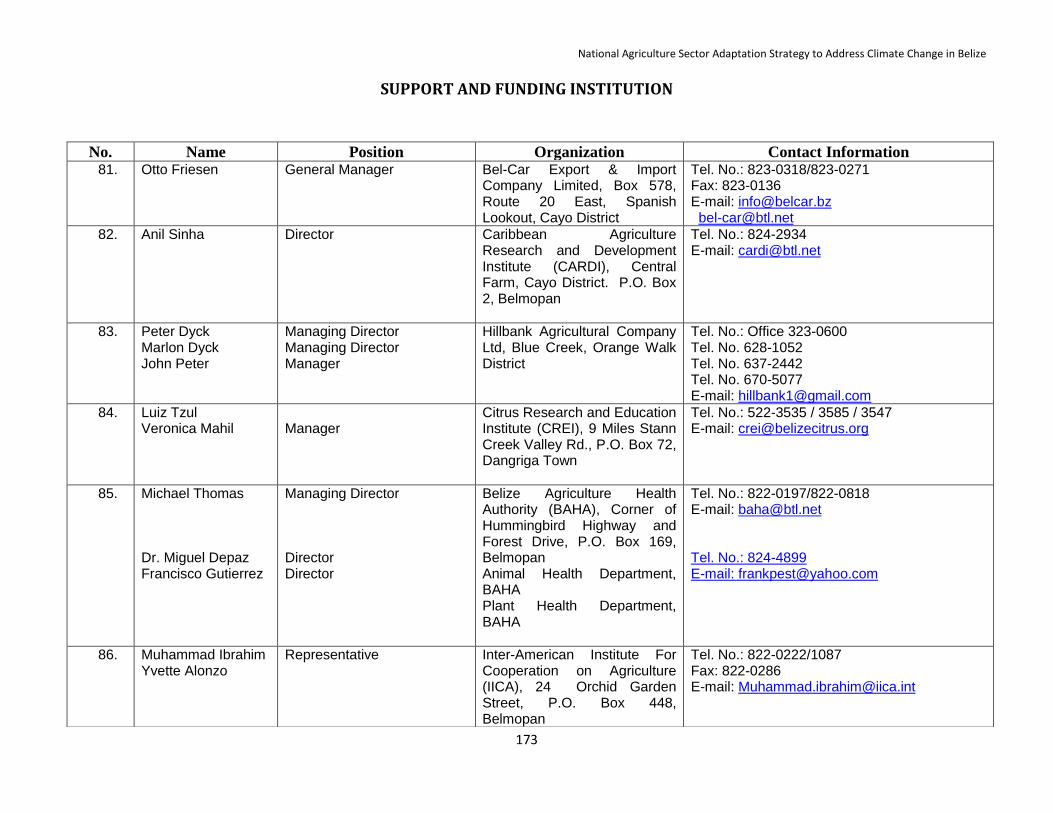
National Agriculture Sector Adaptation Strategy to Address Climate Change in Belize
173
SUPPORT AND FUNDING INSTITUTION
No. Name Position Organization Contact Information 81. Otto Friesen General Manager Bel-Car Export & Import
Company Limited, Box 578, Route 20 East, Spanish Lookout, Cayo District
Tel. No.: 823-0318/823-0271 Fax: 823-0136 E-mail: [email protected] [email protected]
82. Anil Sinha Director Caribbean Agriculture Research and Development Institute (CARDI), Central Farm, Cayo District. P.O. Box 2, Belmopan
Tel. No.: 824-2934 E-mail: [email protected]
83. Peter Dyck Marlon Dyck John Peter
Managing Director Managing Director Manager
Hillbank Agricultural Company Ltd, Blue Creek, Orange Walk District
Tel. No.: Office 323-0600 Tel. No. 628-1052 Tel. No. 637-2442 Tel. No. 670-5077 E-mail: [email protected]
84. Luiz Tzul Veronica Mahil
Manager
Citrus Research and Education Institute (CREI), 9 Miles Stann Creek Valley Rd., P.O. Box 72, Dangriga Town
Tel. No.: 522-3535 / 3585 / 3547 E-mail: [email protected]
85. Michael Thomas Dr. Miguel Depaz Francisco Gutierrez
Managing Director Director Director
Belize Agriculture Health Authority (BAHA), Corner of Hummingbird Highway and Forest Drive, P.O. Box 169, Belmopan Animal Health Department, BAHA Plant Health Department, BAHA
Tel. No.: 822-0197/822-0818 E-mail: [email protected] Tel. No.: 824-4899 E-mail: [email protected]
86. Muhammad Ibrahim Yvette Alonzo
Representative Inter-American Institute For Cooperation on Agriculture (IICA), 24 Orchid Garden Street, P.O. Box 448, Belmopan
Tel. No.: 822-0222/1087 Fax: 822-0286 E-mail: [email protected]

National Agriculture Sector Adaptation Strategy to Address Climate Change in Belize
174
No. Name Position Organization Contact Information 87. Stephen Williams
Gordon Holder
In charge of Micro propagation Lab Campus Administrator
UB-Central Farm Tel. No.: 824-4934/824-3775 E-mail: [email protected] [email protected] E-mail: [email protected]
88. Andrew Godoy Representative Belize Tourism Industry Association, P.O. Box 62, 10 North Park Street, Belize City
Tel. No.: 227-1144 E-mail:[email protected]
89. Mark Miller Executive Director Plenty International Belize, P.O. Box 72, Punta Gorda Town, Toledo District
Tel. No.: 722-2198/722-2198 E-mail: [email protected]
90. William Usher Representative Belize Agro-Enterprise Ltd, 18 Haulover Creek Street, Belmopan
Tel. No.: 662-3518 E-mail: [email protected]
91. Roque Mai Representative Belize Marketing and Development Corporation (BMDC), 117 North Front St., P.O. Box 479, Belize City
Tel. No.: 227-2585 Fax: 227-7656 E-mail: [email protected]
92. Miriam Serrut Registrar Pesticides Control Board, Central Farm, Cayo District
Tel. No.: 824-2640 E-mail: [email protected]
93. Michael Singh Chairman Belize Trade and Investment Development Service (BELTRAIDE), 14 Orchid Garden Street, Belmopan
Tel. No.: 822-3737/1075 E-mail: [email protected]
94. Fermin Blanco Representative OIRSA, National Agriculture Show Grounds, P.O. Box 426, Belmopan
Tel. No.: 822-0521 E-mail: [email protected]
95. Marcus Osorio Manager Sugar Industry Research and Development Institute (SIRDI), 1 Fonseca St., Orange Walk Town
Tel. No.: 322-3141 or 610 - 2851 E-mail:[email protected] or [email protected]
96. National Committee for Coordination of Agriculture Research and Development (NCCARD), c/o Central Farm Agriculture Research Station, Central Farm, Cayo District
Tel. No.: 824-2129 / 2131 E-mail: [email protected]

National Agriculture Sector Adaptation Strategy to Address Climate Change in Belize
175
No. Name Position Organization Contact Information 97. Robert Valent Resident Representative United Nations Development
Programme (UNDP), Lawrence Nicholas Building, Third Floor, South Ring Road, P.O. Box 53, Belmopan
Tel. No.: 822-3364 E-mail: [email protected]
98. Tanith Bello
Jesus Baguene
Acting Ambassador Programme Officer
Country Office Belmopan
EU- Delegation – Jamaica
Tel. No.: 822-0868/822-0869 E-mail:
99. Anneke Jensen Representative Inter-American Development Bank, Belize Marina Towers, 1024 Newtown Barracks, Belize City
Tel. No.: 221- 5300 E-mail: [email protected]
100. Fernando Yah Mission Chief Republic of China (ROC) Taiwanese Technical Mission, P.O. Box 43, San Ignacio, Cayo District
Tel. No.: 824-3033 E-mail: [email protected] [email protected]
101. Franklyn Magloire Assistant General Manager- Credit Operations
Development Finance Corporation Bliss Parade, Belmopan
Tel: 822-2575 E-mail : [email protected]
102. Celia Mahung Executive Director Toledo Institute for Development and the Environment (TIDE), P.O. Box 150, Punta Gorda Town
Tel. No.: 722-2274 / 2431 E-mail: [email protected]
103. Henry Canton General Manager Agricultural Development & Services Limited (ADS), P.O. Box 132, Dangriga Town
Tel. No.: 522-2110 / 2113 Email: [email protected]

National Agriculture Sector Adaptation Strategy to Address Climate Change in Belize
176
Annex V – Workshop Participants
List of participants – Presentation of Draft Strategy Friday, April 4
th, 2014 – La Inmaculada Credit Union Limited, Orange Walk Town
No. Name Position Organization Contact Information 1. Ricardo Escarraga Farmer – sugarcane 77 San Francisco Street, Orange Walk Town Tel. No.: 302-3986
2. Andres Cob Farmer – sugarcane Corozal District Tel. No.: 631-7655
3. Dario Cocom Farmer – vegetables San Narciso Street, Orange Walk Town Tel. No.: 620-7707 E-mail: [email protected]
4. Luis Chan Farmer – vegetables
Consejo Village, Corozal District Tel. No.: 607-2530
5. Demetrio Cano Farmer – vegetables Caledonia Village, Corozal District Tel. No.: 660-5117
6. Fidel Pineda Farmer – cattle, sheep, goat San Antonio Village, Corozal District Tel. No.: 652-5784
7. Alvin Alfaro Farmer – sugarcane Bella Vista Village, Corozal District Tel. No.: 630-2316 E-mail: [email protected]
8. Albertico Alamilla Farmer – sugarcane Douglas Village, Orange Walk District Tel. No.: 650-8748
9. Sergio Hernandez Extension Officer and Ag. District Agriculture Coordinator
Agriculture Department – Corozal District Tel. No.: 605-0860 E-mail: [email protected]
10. Adrian Zetina Research Coordinator Sugar Industry Research and Development Institute – 1 Fonseca Street, Orange Walk Town
Tel. No.: 600-2947 E-mail: [email protected]
11. Jeffery Joseph Agriculture Engineer Coordinator
Sugar Industry Research and Development Institute – 1 Fonseca Street, Orange Walk Town
Tel. No.: 633-3295 E-mail: [email protected]
12. Ermin Gonzalez Field Officer Sugar Industry Research and Development Institute – 1 Fonseca Street, Orange Walk Town
Tel. No.: 670-2382 E-mail: [email protected]
13. Ronaldo Gonzalez Field Officer Sugar Industry Research and Development Institute – 1 Fonseca Street, Orange Walk Town
Tel. No.: 601-4042 E-mail: [email protected]
14. Saul Osorio Field Officer Sugar Industry Research and Development
Institute – San Estevan Village, Orange Walk
District
Tel. No.: 670-8357 E-mail: [email protected]

National Agriculture Sector Adaptation Strategy to Address Climate Change in Belize
177
No. Name Position Organization Contact Information
15. Marvin Garcia Field Officer Sugar Industry Research and Development
Institute – August Pine Ridge Village, Orange
Walk District
Tel. No.: 662-7822 E-mail: [email protected]
16. Albino Vargas Project Coordinator SSEDAT II – La Inmaculada Credit Union Limited – 5 Park Street, Orange Walk Town
Tel. No.: 632-9822 E-mail: [email protected]
17. Cesar Carballo Representative SSEDAT II – La Inmaculada Credit Union Limited – 5 Park Street, Orange Walk Town
Tel. No.: 630-9292 E-mail: [email protected]
18. Raul Cocom Service Provider SSEDAT II – La Inmaculada Credit Union Limited – 5 Park Street, Orange Walk Town
Tel. No.: 661-8970 E-mail: [email protected]
19. Arturo Cantun Reporter Love FM News and Music Power – 108 Belize Street, Orange Walk Town
Tel. No.: 605-9194 E-mail: [email protected]
20. Dennis Jones
Managing Director Belize Enterprise for Sustainable Technology – Mile 54 Hummingbird Highway, Belmopan
Tel. No.: 822-3150/822-3043 E-mail: [email protected]
21. Lemuel Palacio
Procurement Officer Belize Enterprise for Sustainable Technology – Mile 54 Hummingbird Highway, Belmopan
Tel. No.: 822-3150/822-3043 E-mail: [email protected]
22. Francine Magloire
Consultant Belize Enterprise for Sustainable Technology – Mile 54 Hummingbird Highway, Belmopan
Tel. No.: 822-3150/822-3043 E-mail: [email protected]
23. Ramon Frutos
Consultant Belize Enterprise for Sustainable Technology – Mile 54 Hummingbird Highway, Belmopan
Tel. No.: 822-3150/822-3043 E-mail: [email protected]
24. Natalie Bucknor
Executive Assistant Belize Enterprise for Sustainable Technology – Mile 54 Hummingbird Highway, Belmopan
Tel. No.: 822-3150/822-3043 E-mail: [email protected]/[email protected]
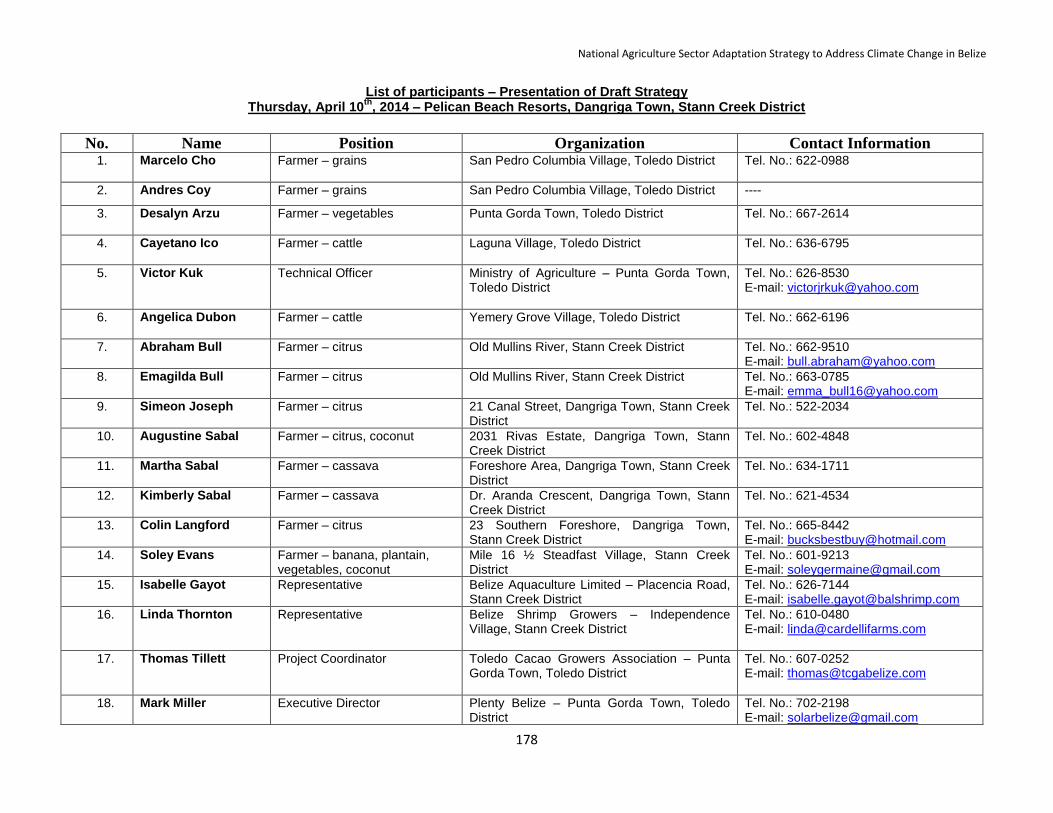
National Agriculture Sector Adaptation Strategy to Address Climate Change in Belize
178
List of participants – Presentation of Draft Strategy Thursday, April 10
th, 2014 – Pelican Beach Resorts, Dangriga Town, Stann Creek District
No. Name Position Organization Contact Information 1. Marcelo Cho Farmer – grains San Pedro Columbia Village, Toledo District Tel. No.: 622-0988
2. Andres Coy Farmer – grains San Pedro Columbia Village, Toledo District ----
3. Desalyn Arzu Farmer – vegetables Punta Gorda Town, Toledo District Tel. No.: 667-2614
4. Cayetano Ico Farmer – cattle
Laguna Village, Toledo District Tel. No.: 636-6795
5. Victor Kuk Technical Officer Ministry of Agriculture – Punta Gorda Town, Toledo District
Tel. No.: 626-8530 E-mail: [email protected]
6. Angelica Dubon Farmer – cattle Yemery Grove Village, Toledo District Tel. No.: 662-6196
7. Abraham Bull Farmer – citrus Old Mullins River, Stann Creek District Tel. No.: 662-9510 E-mail: [email protected]
8. Emagilda Bull Farmer – citrus Old Mullins River, Stann Creek District Tel. No.: 663-0785 E-mail: [email protected]
9. Simeon Joseph Farmer – citrus 21 Canal Street, Dangriga Town, Stann Creek District
Tel. No.: 522-2034
10. Augustine Sabal Farmer – citrus, coconut 2031 Rivas Estate, Dangriga Town, Stann Creek District
Tel. No.: 602-4848
11. Martha Sabal Farmer – cassava Foreshore Area, Dangriga Town, Stann Creek District
Tel. No.: 634-1711
12. Kimberly Sabal Farmer – cassava Dr. Aranda Crescent, Dangriga Town, Stann Creek District
Tel. No.: 621-4534
13. Colin Langford Farmer – citrus 23 Southern Foreshore, Dangriga Town, Stann Creek District
Tel. No.: 665-8442 E-mail: [email protected]
14. Soley Evans Farmer – banana, plantain, vegetables, coconut
Mile 16 ½ Steadfast Village, Stann Creek District
Tel. No.: 601-9213 E-mail: [email protected]
15. Isabelle Gayot Representative Belize Aquaculture Limited – Placencia Road, Stann Creek District
Tel. No.: 626-7144 E-mail: [email protected]
16. Linda Thornton Representative Belize Shrimp Growers – Independence Village, Stann Creek District
Tel. No.: 610-0480 E-mail: [email protected]
17. Thomas Tillett Project Coordinator Toledo Cacao Growers Association – Punta Gorda Town, Toledo District
Tel. No.: 607-0252 E-mail: [email protected]
18. Mark Miller Executive Director Plenty Belize – Punta Gorda Town, Toledo District
Tel. No.: 702-2198 E-mail: [email protected]
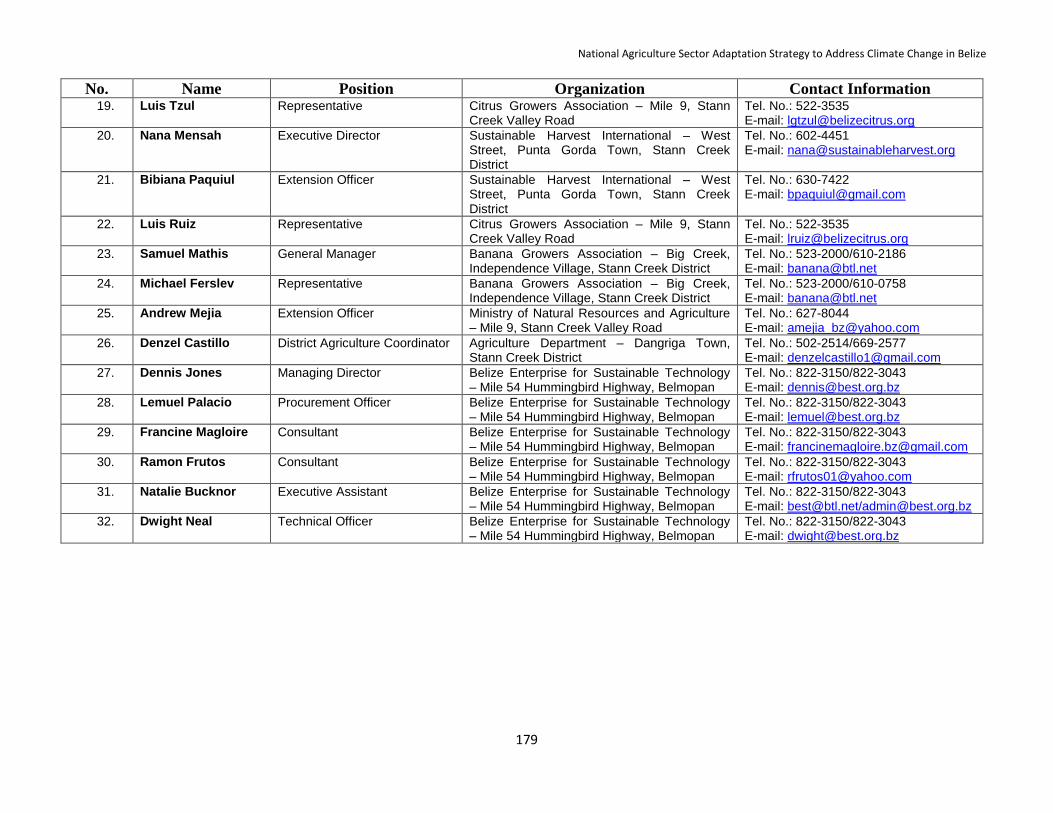
National Agriculture Sector Adaptation Strategy to Address Climate Change in Belize
179
No. Name Position Organization Contact Information 19. Luis Tzul Representative Citrus Growers Association – Mile 9, Stann
Creek Valley Road Tel. No.: 522-3535 E-mail: [email protected]
20. Nana Mensah Executive Director Sustainable Harvest International – West Street, Punta Gorda Town, Stann Creek District
Tel. No.: 602-4451 E-mail: [email protected]
21. Bibiana Paquiul Extension Officer Sustainable Harvest International – West Street, Punta Gorda Town, Stann Creek District
Tel. No.: 630-7422 E-mail: [email protected]
22. Luis Ruiz Representative Citrus Growers Association – Mile 9, Stann Creek Valley Road
Tel. No.: 522-3535 E-mail: [email protected]
23. Samuel Mathis General Manager Banana Growers Association – Big Creek, Independence Village, Stann Creek District
Tel. No.: 523-2000/610-2186 E-mail: [email protected]
24. Michael Ferslev Representative Banana Growers Association – Big Creek, Independence Village, Stann Creek District
Tel. No.: 523-2000/610-0758 E-mail: [email protected]
25. Andrew Mejia Extension Officer Ministry of Natural Resources and Agriculture – Mile 9, Stann Creek Valley Road
Tel. No.: 627-8044 E-mail: [email protected]
26. Denzel Castillo District Agriculture Coordinator Agriculture Department – Dangriga Town, Stann Creek District
Tel. No.: 502-2514/669-2577 E-mail: [email protected]
27. Dennis Jones
Managing Director Belize Enterprise for Sustainable Technology – Mile 54 Hummingbird Highway, Belmopan
Tel. No.: 822-3150/822-3043 E-mail: [email protected]
28. Lemuel Palacio
Procurement Officer Belize Enterprise for Sustainable Technology – Mile 54 Hummingbird Highway, Belmopan
Tel. No.: 822-3150/822-3043 E-mail: [email protected]
29. Francine Magloire
Consultant Belize Enterprise for Sustainable Technology – Mile 54 Hummingbird Highway, Belmopan
Tel. No.: 822-3150/822-3043 E-mail: [email protected]
30. Ramon Frutos
Consultant Belize Enterprise for Sustainable Technology – Mile 54 Hummingbird Highway, Belmopan
Tel. No.: 822-3150/822-3043 E-mail: [email protected]
31. Natalie Bucknor
Executive Assistant Belize Enterprise for Sustainable Technology – Mile 54 Hummingbird Highway, Belmopan
Tel. No.: 822-3150/822-3043 E-mail: [email protected]/[email protected]
32. Dwight Neal
Technical Officer Belize Enterprise for Sustainable Technology – Mile 54 Hummingbird Highway, Belmopan
Tel. No.: 822-3150/822-3043 E-mail: [email protected]
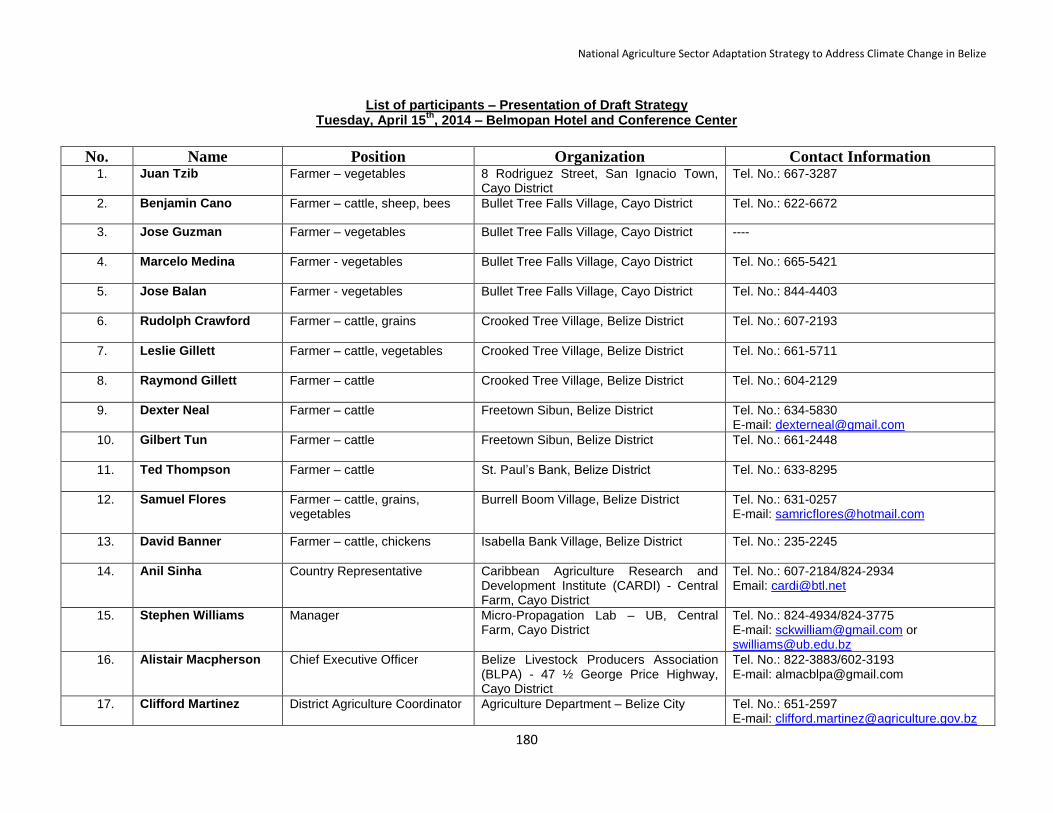
National Agriculture Sector Adaptation Strategy to Address Climate Change in Belize
180
List of participants – Presentation of Draft Strategy Tuesday, April 15
th, 2014 – Belmopan Hotel and Conference Center
No. Name Position Organization Contact Information 1. Juan Tzib Farmer – vegetables 8 Rodriguez Street, San Ignacio Town,
Cayo District Tel. No.: 667-3287
2. Benjamin Cano Farmer – cattle, sheep, bees Bullet Tree Falls Village, Cayo District Tel. No.: 622-6672
3. Jose Guzman Farmer – vegetables Bullet Tree Falls Village, Cayo District ----
4. Marcelo Medina Farmer - vegetables
Bullet Tree Falls Village, Cayo District Tel. No.: 665-5421
5. Jose Balan Farmer - vegetables Bullet Tree Falls Village, Cayo District Tel. No.: 844-4403
6. Rudolph Crawford Farmer – cattle, grains Crooked Tree Village, Belize District Tel. No.: 607-2193
7. Leslie Gillett Farmer – cattle, vegetables Crooked Tree Village, Belize District Tel. No.: 661-5711
8. Raymond Gillett Farmer – cattle Crooked Tree Village, Belize District
Tel. No.: 604-2129
9. Dexter Neal Farmer – cattle Freetown Sibun, Belize District
Tel. No.: 634-5830 E-mail: [email protected]
10. Gilbert Tun Farmer – cattle Freetown Sibun, Belize District Tel. No.: 661-2448
11. Ted Thompson Farmer – cattle St. Paul’s Bank, Belize District Tel. No.: 633-8295
12. Samuel Flores Farmer – cattle, grains, vegetables
Burrell Boom Village, Belize District Tel. No.: 631-0257 E-mail: [email protected]
13. David Banner Farmer – cattle, chickens Isabella Bank Village, Belize District
Tel. No.: 235-2245
14. Anil Sinha Country Representative Caribbean Agriculture Research and Development Institute (CARDI) - Central Farm, Cayo District
Tel. No.: 607-2184/824-2934 Email: [email protected]
15. Stephen Williams Manager Micro-Propagation Lab – UB, Central Farm, Cayo District
Tel. No.: 824-4934/824-3775 E-mail: [email protected] or [email protected]
16. Alistair Macpherson Chief Executive Officer Belize Livestock Producers Association (BLPA) - 47 ½ George Price Highway, Cayo District
Tel. No.: 822-3883/602-3193 E-mail: [email protected]
17. Clifford Martinez District Agriculture Coordinator Agriculture Department – Belize City
Tel. No.: 651-2597 E-mail: [email protected]
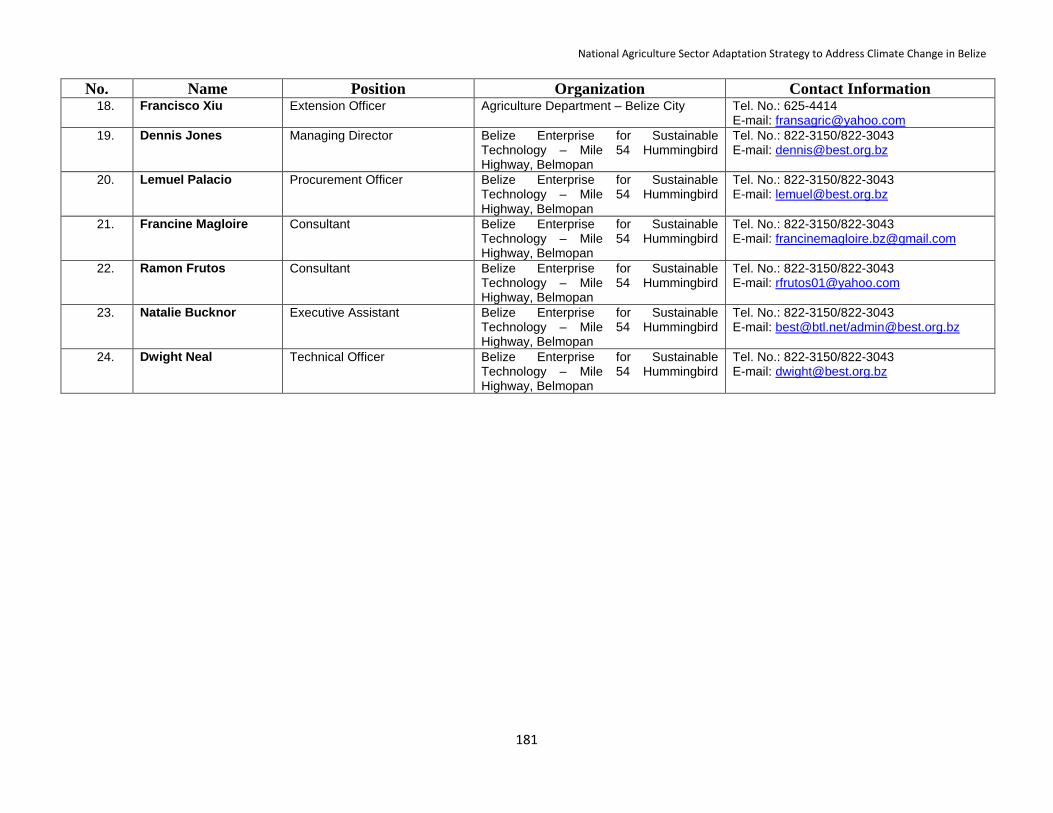
National Agriculture Sector Adaptation Strategy to Address Climate Change in Belize
181
No. Name Position Organization Contact Information 18. Francisco Xiu Extension Officer Agriculture Department – Belize City
Tel. No.: 625-4414 E-mail: [email protected]
19. Dennis Jones
Managing Director Belize Enterprise for Sustainable Technology – Mile 54 Hummingbird Highway, Belmopan
Tel. No.: 822-3150/822-3043 E-mail: [email protected]
20. Lemuel Palacio
Procurement Officer Belize Enterprise for Sustainable Technology – Mile 54 Hummingbird Highway, Belmopan
Tel. No.: 822-3150/822-3043 E-mail: [email protected]
21. Francine Magloire
Consultant Belize Enterprise for Sustainable Technology – Mile 54 Hummingbird Highway, Belmopan
Tel. No.: 822-3150/822-3043 E-mail: [email protected]
22. Ramon Frutos
Consultant Belize Enterprise for Sustainable Technology – Mile 54 Hummingbird Highway, Belmopan
Tel. No.: 822-3150/822-3043 E-mail: [email protected]
23. Natalie Bucknor
Executive Assistant Belize Enterprise for Sustainable Technology – Mile 54 Hummingbird Highway, Belmopan
Tel. No.: 822-3150/822-3043 E-mail: [email protected]/[email protected]
24. Dwight Neal
Technical Officer Belize Enterprise for Sustainable Technology – Mile 54 Hummingbird Highway, Belmopan
Tel. No.: 822-3150/822-3043 E-mail: [email protected]
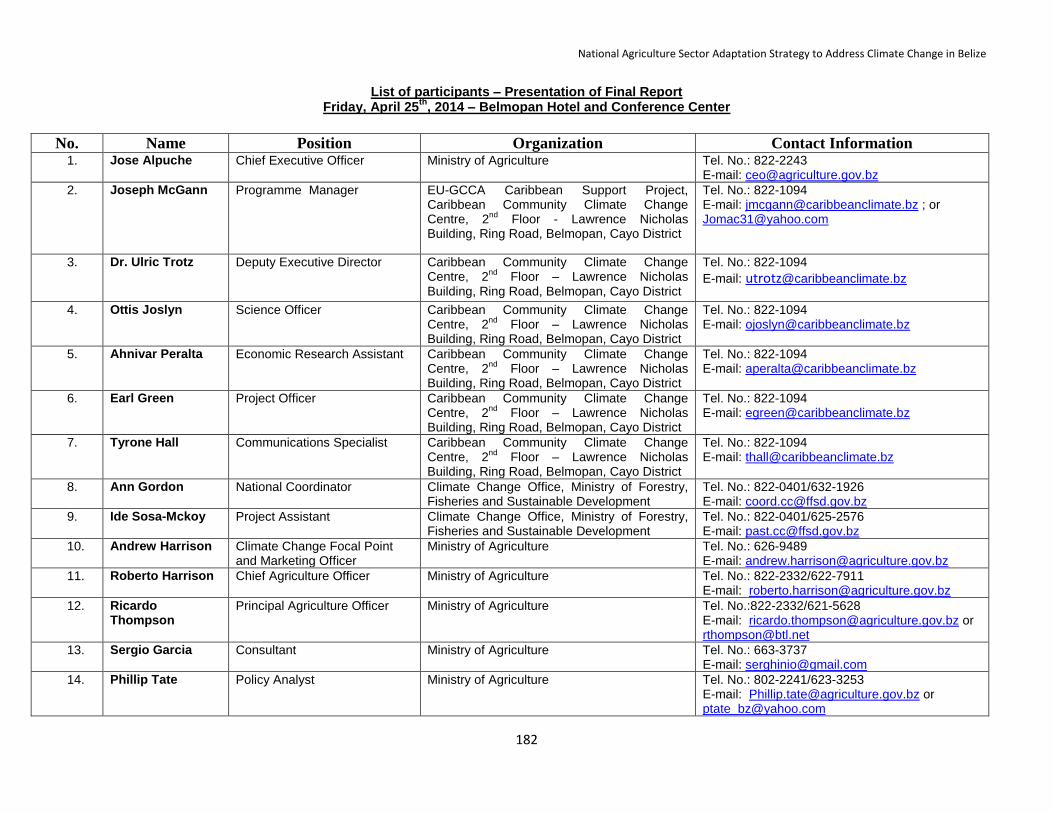
National Agriculture Sector Adaptation Strategy to Address Climate Change in Belize
182
List of participants – Presentation of Final Report Friday, April 25
th, 2014 – Belmopan Hotel and Conference Center
No. Name Position Organization Contact Information 1. Jose Alpuche Chief Executive Officer Ministry of Agriculture Tel. No.: 822-2243
E-mail: [email protected]
2. Joseph McGann Programme Manager EU-GCCA Caribbean Support Project, Caribbean Community Climate Change Centre, 2
nd Floor - Lawrence Nicholas
Building, Ring Road, Belmopan, Cayo District
Tel. No.: 822-1094 E-mail: [email protected] ; or [email protected]
3. Dr. Ulric Trotz Deputy Executive Director Caribbean Community Climate Change Centre, 2
nd Floor – Lawrence Nicholas
Building, Ring Road, Belmopan, Cayo District
Tel. No.: 822-1094
E-mail: [email protected]
4. Ottis Joslyn Science Officer
Caribbean Community Climate Change Centre, 2
nd Floor – Lawrence Nicholas
Building, Ring Road, Belmopan, Cayo District
Tel. No.: 822-1094 E-mail: [email protected]
5. Ahnivar Peralta Economic Research Assistant Caribbean Community Climate Change Centre, 2
nd Floor – Lawrence Nicholas
Building, Ring Road, Belmopan, Cayo District
Tel. No.: 822-1094 E-mail: [email protected]
6. Earl Green Project Officer Caribbean Community Climate Change Centre, 2
nd Floor – Lawrence Nicholas
Building, Ring Road, Belmopan, Cayo District
Tel. No.: 822-1094 E-mail: [email protected]
7. Tyrone Hall Communications Specialist Caribbean Community Climate Change Centre, 2
nd Floor – Lawrence Nicholas
Building, Ring Road, Belmopan, Cayo District
Tel. No.: 822-1094 E-mail: [email protected]
8. Ann Gordon National Coordinator Climate Change Office, Ministry of Forestry, Fisheries and Sustainable Development
Tel. No.: 822-0401/632-1926 E-mail: [email protected]
9. Ide Sosa-Mckoy Project Assistant Climate Change Office, Ministry of Forestry, Fisheries and Sustainable Development
Tel. No.: 822-0401/625-2576 E-mail: [email protected]
10. Andrew Harrison Climate Change Focal Point and Marketing Officer
Ministry of Agriculture Tel. No.: 626-9489 E-mail: [email protected]
11. Roberto Harrison Chief Agriculture Officer Ministry of Agriculture Tel. No.: 822-2332/622-7911 E-mail: [email protected]
12. Ricardo Thompson
Principal Agriculture Officer Ministry of Agriculture Tel. No.:822-2332/621-5628 E-mail: [email protected] or [email protected]
13. Sergio Garcia Consultant Ministry of Agriculture
Tel. No.: 663-3737 E-mail: [email protected]
14. Phillip Tate Policy Analyst Ministry of Agriculture Tel. No.: 802-2241/623-3253 E-mail: [email protected] or [email protected]

National Agriculture Sector Adaptation Strategy to Address Climate Change in Belize
183
No. Name Position Organization Contact Information 15. Ina Sanchez Acting Director of Research-
NCCARD Ministry of Agriculture Tel. No.: 623-0771
E-mail: [email protected]
16. Clifford Martinez District Agriculture Coordinator Agriculture Department, Belize City Tel. No.:203-2842 E-mail: [email protected]
17. Maria Cooper Economist Ministry of Finance Tel. No.: 822-2362 E-mail: [email protected]
18. Dennis Gonguez Chief Meteorological Officer Meteorology Department, Ladyville Tel. No.: 225-2012 E-mail: [email protected]
19. Stephen Williams Manager Micro-Propagation Lab – UB, Central Farm, Cayo District
Tel. No.: 824-4934/824-3775 E-mail: [email protected] or [email protected]
20. Miles Geban
Videographer 13 Productions – 57 Albert Street, Belize City Tel. No.: 624-1889/610-1313/227-1313
21. Renee Trujillo
Journalist Love FM News and Music Power – 7145 Slaughterhouse Road, Belize City
Tel. No.: 203-2098/203-0528 E-mail: [email protected]
22. Yvette Alonzo
Agricultural Economist and Policy Analyst
Inter-American Institute for Cooperation on Agriculture – 24 Orchid Garden, Belmopan
Tel. No.: 822-0222 E-mail: [email protected]
23. Dennis Jones
Managing Director Belize Enterprise for Sustainable Technology – Mile 54 Hummingbird Highway, Belmopan
Tel. No.: 822-3150/822-3043 E-mail: [email protected]
24. Lemuel Palacio
Procurement Officer Belize Enterprise for Sustainable Technology – Mile 54 Hummingbird Highway, Belmopan
Tel. No.: 822-3150/822-3043 E-mail: [email protected]
25. Francine Magloire
Consultant Belize Enterprise for Sustainable Technology – Mile 54 Hummingbird Highway, Belmopan
Tel. No.: 822-3150/822-3043 E-mail: [email protected]
26. Ramon Frutos
Consultant Belize Enterprise for Sustainable Technology – Mile 54 Hummingbird Highway, Belmopan
Tel. No.: 822-3150/822-3043 E-mail: [email protected]
27. Natalie Bucknor
Executive Assistant Belize Enterprise for Sustainable Technology – Mile 54 Hummingbird Highway, Belmopan
Tel. No.: 822-3150/822-3043 E-mail: [email protected]/[email protected]
28. Dwight Neal
Technical Officer Belize Enterprise for Sustainable Technology – Mile 54 Hummingbird Highway, Belmopan
Tel. No.: 822-3150/822-3043 E-mail: [email protected]

184
Contact Us:
CARIBBEAN COMMUNITY
CLIMATE CHANGE CENTRE 2nd Floor, Lawrence Nicholas Building
Ring Road, P.O. Box 563 Belmopan, Belize.
Tel: +(501)822-1094/822-1104
Fax: +(501)822-1365 Email: [email protected]
Website: www.caribbeanclimate.bz
or
National Climate Change Office Ministry of Forestry, Fisheries and Sustainable
Development 2 Slim Lane, Belmopan
Belize
Tel: +(501)822-0810 or 822-0401 Fax: +(501) 822-2396
Email: [email protected] Website: www.climatechange.ict.gov.bz