a near real -time procedure for f lood hazard … · a near real -time procedure for f lood hazard...
TRANSCRIPT
E-proceedings of the 36th IAHR World Congress 28 June – 3 July, 2015, The Hague, the Netherlands
1
A NEAR REAL-TIME PROCEDURE FOR FLOOD HAZARD MAPPING AND RISK ASSESSMENT IN EUROPE
FRANCESCO DOTTORI(1), PETER SALAMON(1), MILAN KALAS(1), ALESSANDRA BIANCHI(1), JUTTA THIELEN(1), LUC FEYEN(1) (1) European Commission, Joint Research Centre, Ispra, Italy
ABSTRACT
The availability of a real-time operational system for mapping flood hazard and assessing potential consequences might be extremely useful to help emergency response and management and to mitigate the impact of large flood events. This work describes the development of an experimental procedure for rapid flood risk assessment within the European Flood Awareness System (EFAS), which since 2012 provides operational flood predictions for the major European rivers as part of the Copernicus Emergency Management Services. The hydro-meteorological data set available in EFAS is used to derive long-term streamflow simulations and design flood hydrographs in a wide number of locations, covering all the major European river network. Flood hydrographs are then used as input to a hydrodynamic 2D model to create a high-resolution dataset of areas at risk of flooding for different return periods. Whenever a flood event is forecasted in EFAS, the flood maps of the river network sections potentially involved are merged together, based on the estimated magnitude of the event. In order to take into account the different flood forecasts available in EFAS, different combinations of flood hazard maps may be produced, to highlight the possible range of uncertainty in predictions. The merged flood maps can be combined with the available spatial information about land use, population, urban areas and infrastructures, to assess the potential impact of the forecasted flood event in terms of economic damage, affected population, major infrastructures and cities. A preliminary version of the procedure has been successfully tested in reproducing flooded areas and impacts in the recent floods in Bosnia-Herzegovina, Croatia and Serbia. Moreover, the reduced computational times are compatible with near real-time applications, even in case of multiple flood events affecting several countries. Currently, the integration of the procedure within EFAS for operational use is being tested.
Keywords: EFAS, 2D hydraulic model, real-time, flood hazard mapping, flood risk assessment
1. INTRODUCTION
River floods are recognized as one of the major causes of economic damages and loss of human lives worldwide (Commission EC, 2007). Several studies point out that the impact of floods in the next decades could be dramatically increased by the ongoing socio-economic and climatic changes (e.g., UN-ISDR Scientific and Technical Committee, 2009; Di Baldassarre and Ulhenbrook, 2012). Despite the ongoing efforts in flood prevention and mitigation, large areas in Europe are still prone to catastrophic floods, as demonstrated by the recent events in 2013 in Danube and Elbe river basins, in 2014 in Serbia, Bosnia-Herzegovina and Croatia, along with many other localized but yet severe flood events.
As for all weather-induced hazards, mathematical models for predicting and mapping flood hazard and risk may help reducing catastrophic impacts on population and assets. Some of these issues have been addressed at the Joint Research Centre of the European Commission (JRC) with the development of the European Flood Awareness System (EFAS). The development of EFAS began in 2002 after the large scale inundations in Central Europe, with the aim of providing harmonized flood forecasts for the trans-national European river basins. Since 2012, the system provides operational flood predictions in major European rivers as part of the Copernicus Emergency Management Services (EMS).
Currently, EFAS does not include an operational procedure for real-time mapping of flood hazard and assessing potential consequences of forecasted events. The availability of such a procedure would provide valuable information to increase preparedness and help emergency response. Here, we describe an experimental methodology to translate EFAS flood forecasts into flood hazard maps, and to combine hazard, exposure and vulnerability information to produce risk estimations in near-real time at European scale.
2. METHODOLOGY
2.1 The European Flood Awareness System (EFAS)
The detailed description of the EFAS structure can be found in the published literature (Bartholmes et al., 2009; Pappenberger et al., 2010; Thielen et al., 2009). Hereafter, only a general description is provided. The EFAS hydro-meteorological forecasting chain is composed by: (a) a hydrological model, (b) weather forecasts, and (c) meteorological observations. Hydrological simulations are performed with Lisflood, a hybrid between a conceptual and a physical

E-proceedings of the 36th IAHR World Congress, 28 June – 3 July, 2015, The Hague, the Netherlands
2
rainfall–runoff distributed model, designed to reproduce the main hydrological processes of medium to large river basins (see van der Knijff et al.,2010). The model setup for Europe is calibrated using discharge data from a large dataset of river gauges, and a database of observed meteorological fields (maps of spatially interpolated point measurements of precipitation and temperature, updated daily). Based on this calibration, a reference hydrological simulation for the period 1990-2013 is run for the European window at 5 km resolution, and constantly updated with new data. This reference simulation is used in EFAS both to create initial conditions for daily hydrological runs driven by the latest weather predictions, and to evaluate streamflow forecasts in every grid point of the simulation domain.
The calibrated Lisflood setup is used to perform 10-day streamflow forecasts updated twice per day, by forcing the hydrological model with initial conditions from the EFAS climatological run and with forecast weather fields. In the current EFAS system, input weather forecasts derive from different meteorological models and include both deterministic (ECMWFHiRes, DWD) and ensemble forecasts (COSMO-LEPS and ECMWF-ENS), provided twice per day with lead times up to 10 days. To produce flood warnings in each point of the river network, forecasted discharges coming from each model run are compared with four exceedance thresholds, derived from the reference hydrological simulation using the 1, 2, 5 and 20-year return period values. Thresholds are presented in Section 2.3 and range from “low” (water levels higher than normal but no flooding expected) to “severe” (very high possibility of flooding, potentially severe flooding expected).
2.2 Database of flood hazard maps
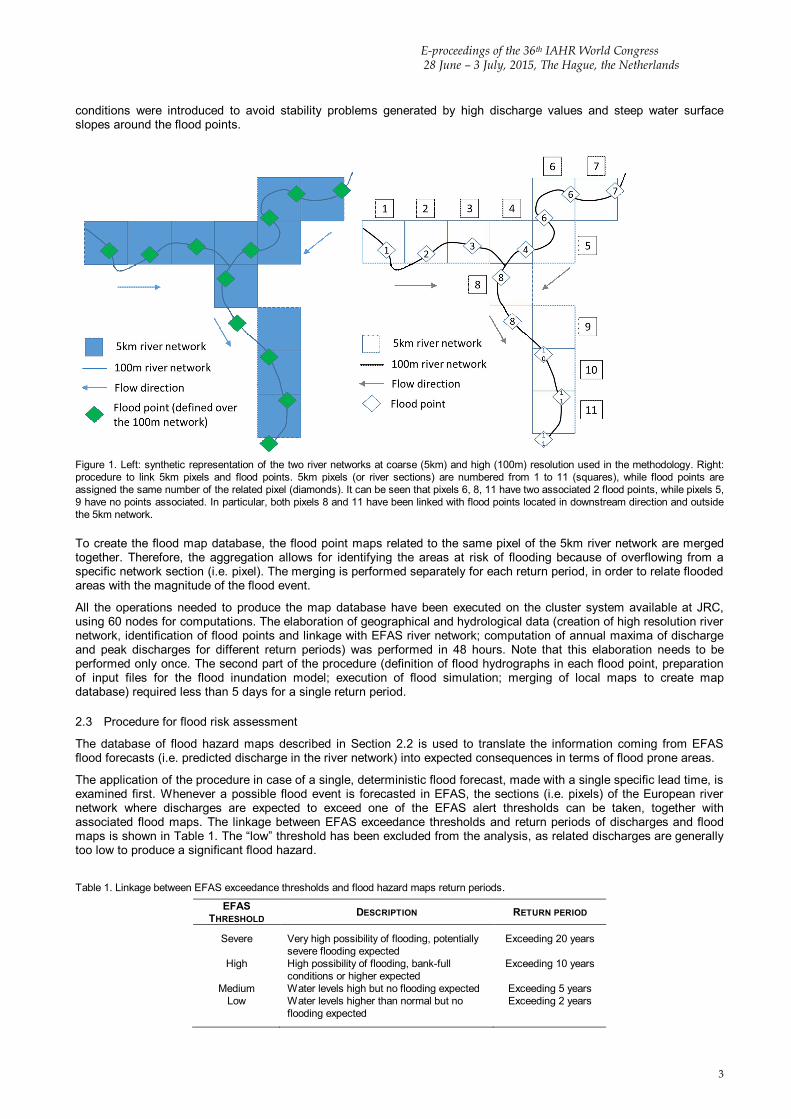
The methodology used to produce local flood maps is mostly based on the experimental procedure for Pan-European hazard mapping documented in Alfieri et al. (2013). Here, the original procedure is briefly summarized and the most relevant modifications and improvements are described. The flood hazard mapping procedure is based on the climatological database of discharges available in EFAS, which is part of the reference simulation of Lisflood described in Section 2.1. In this work, the climatology used for flood mapping covers a period of 23 years from 1990 to 2013, at 5km resolution. Maps of daily annual maxima of discharge are then extracted for each grid element of the EFAS river network, and fitted with a Gumbel extreme value distribution to estimate peak discharge maps for return periods of 10, 20, 50, 100, 200 and 500 years. All the streamflow information (daily and extreme discharges) is then downscaled to a higher resolution river network (100m), which has been derived from SRTM Digital Elevation Model (DEM) and Drain Direction (DD) raster maps (Lehner et al., 2006). Figure 1 shows a synthetic representation of the two river networks. The network considered in the procedure includes only the rivers with an upstream drainage area larger than 500 km2. This choice is due to the resolution of the available climatology, which is not able to correctly resolve localized precipitation patterns at small scale (Alfieri et al., 2013).
The 100m river network is used to identify the so called “flood points”, where flood simulations will be executed. Points are identified starting from river basin outlets and moving upstream along the river network, defining a point each 5km at regular spacing, till the threshold value of minimum upstream area of 500 km2 is reached.
Flood points are then linked to a section of the EFAS river network, in order to assign to each point a discharge hydrograph. In fact, the two river networks at coarse and high resolution may not coincide everywhere: that is, some sections of the 100m network may lie outside the EFAS (5km resolution) network (as represented in Figure 1). Therefore, the following procedure is adopted.
if a flood point lies within a pixel of the 5km river network, they are linked together; if a flood point is outside the 5km network, it is linked with the closest 5km pixel along upstream direction.
Discharge information in each flood point (daily and extreme discharges) is then assigned from the corresponding 5km pixel.
It is important to note that, with this procedure, some 5km pixel might have more than one associated flood point, or none (see the right-hand scheme in Figure 1 for a visual explanation). Moreover, some local incoherencies may arise due to the mentioned differences between 100m and 5km networks: for instance, flood points located downstream a river junction might receive discharge values for 5km pixels belonging to one of the upstream tributaries. Although practical applications showed that these incoherencies generally have a limited influence, they have been manually corrected wherever possible.
After classification, for each flood point a synthetic flood hydrograph is derived from available discharge climatology. The hydrographs are derived considering the average of annual maxima of daily discharge for different durations, peak discharges for all the reference return periods, and the time of concentration (see Alfieri et al., 2013 for a detailed description). In order to account for the poor representation of river channels in the available DTM, flood hydrographs are reduced by subtracting a discharge value corresponding to estimated bankfull discharge (note that “bankfull” here is referred to the river bed usually occupied by water, that is, without considering floodplain areas delimited by embankments). This value is supposed to be equal to the 2-years return period discharge, as calculated from the reference climatology.
The flood inundation model LISFLOOD-FP (Bates et al., 2010) has been applied to perform all the 2D hydrodynamic simulations. The model is based on a simplified approximation of the Shallow Water Equations, which is particularly suited to simulate gradually-varied flow processes over large areas. Flow equations are solved over a regular grid of cells, and outputs in terms of water depth and flow velocity can be produced, Model settings regarding domain size and roughness values were mostly retained from previous work by Alfieri et al. (2013). In addition, modifications in boundary
E-proceedings of the 36th IAHR World Congress
28 June – 3 July, 2015, The Hague, the Netherlands
3
conditions were introduced to avoid stability problems generated by high discharge values and steep water surface slopes around the flood points.
Figure 1. Left: synthetic representation of the two river networks at coarse (5km) and high (100m) resolution used in the methodology. Right: procedure to link 5km pixels and flood points. 5km pixels (or river sections) are numbered from 1 to 11 (squares), while flood points are assigned the same number of the related pixel (diamonds). It can be seen that pixels 6, 8, 11 have two associated 2 flood points, while pixels 5, 9 have no points associated. In particular, both pixels 8 and 11 have been linked with flood points located in downstream direction and outside the 5km network.
To create the flood map database, the flood point maps related to the same pixel of the 5km river network are merged together. Therefore, the aggregation allows for identifying the areas at risk of flooding because of overflowing from a specific network section (i.e. pixel). The merging is performed separately for each return period, in order to relate flooded areas with the magnitude of the flood event.
All the operations needed to produce the map database have been executed on the cluster system available at JRC, using 60 nodes for computations. The elaboration of geographical and hydrological data (creation of high resolution river network, identification of flood points and linkage with EFAS river network; computation of annual maxima of discharge and peak discharges for different return periods) was performed in 48 hours. Note that this elaboration needs to be performed only once. The second part of the procedure (definition of flood hydrographs in each flood point, preparation of input files for the flood inundation model; execution of flood simulation; merging of local maps to create map database) required less than 5 days for a single return period.
2.3 Procedure for flood risk assessment
The database of flood hazard maps described in Section 2.2 is used to translate the information coming from EFAS flood forecasts (i.e. predicted discharge in the river network) into expected consequences in terms of flood prone areas.
The application of the procedure in case of a single, deterministic flood forecast, made with a single specific lead time, is examined first. Whenever a possible flood event is forecasted in EFAS, the sections (i.e. pixels) of the European river network where discharges are expected to exceed one of the EFAS alert thresholds can be taken, together with associated flood maps. The linkage between EFAS exceedance thresholds and return periods of discharges and flood maps is shown in Table 1. The “low” threshold has been excluded from the analysis, as related discharges are generally too low to produce a significant flood hazard.
Table 1. Linkage between EFAS exceedance thresholds and flood hazard maps return periods.
EFAS THRESHOLD DESCRIPTION RETURN PERIOD
Severe Very high possibility of flooding, potentially
severe flooding expected Exceeding 20 years
High High possibility of flooding, bank-full conditions or higher expected
Exceeding 10 years
Medium Water levels high but no flooding expected Exceeding 5 years Low Water levels higher than normal but no
flooding expected Exceeding 2 years
E-proceedings of the 36th IAHR World Congress, 28 June – 3 July, 2015, The Hague, the Netherlands
4
The procedure to select river network pixels and exceedance thresholds needs to be modified when forecasts consist of an ensemble of several members, as for EFAS. The criterion here used is based on the return period of the maximum discharge calculated over the full forecasting period, taking the EFAS VAREPS (ensemble predictions provided by ECMWF to EFAS, Alfieri et al., 2014) median discharge forecasts at each river grid cell. River grid cells where the maximum discharge exceeded 10 years return period are considered in the further analysis. The river grid cells at the 5km resolution are reclassified into classes exceeding critical return period of available flood hazard maps (10, 50, 100, 200, 500 years) and the corresponding 100m resolution flood maps are identified and tiled together. Where more maps overlap, the maximum depth value is taken. The same approach will be also applied in the operational system.
After the mosaic operation has been completed according to the specified criteria, the flood event hazard map is combined with the available spatial information about land use, population, urban areas and infrastructures. This allows to obtain a first estimate of the potential impacts in terms of exposed population, major infrastructures and cities.
Finally, economic losses are computed by overlaying the information regarding flood hazard (flood extent and depths) with the exposure and vulnerability of exposed assets, expressed as damage functions relating water depth, land use and economic loss. The damage functions applied for this study were developed at JRC by Huizinga (2007) for all the EU-27 countries, based on a database of empirical and synthetic damage curves for a number of countries. Separate functions are derived for the land use classes more vulnerable to flooding (residential, commercial, industrial, agricultural). To account for the variable value of assets within one country, damage values are corrected considering the ratio between the GDP of affected regions (identified according to the Nomenclature of Territorial Units for Statistics (NUTS), administrative level 1) and country’s GDP, following the approach proposed by Jongman et al. (2012).
After all the impacts have been computed, the results are aggregated at EU region scale, using the classification of EUMetNet (the network of European Meteorological Services, www.meteoalarm.eu). This classification is basically a combination of levels 1 and 2 of the NUTS classification, according to the EU country, and has been chosen to obtain areas of aggregation with a comparable extent. Table 2 presents the complete list of impact and risk descriptors applied in the procedure.
Table 2. List of impact descriptors aggregated at EU-region scale and included in the risk assessment.
RISK – IMPACT DESCRIPTORS DESCRIPTION DATA SOURCES
Region Name EU regions potentially affected EU regions defined by EUMetNet
classification
Country EU countries potentially affected EFAS database
River(s) at risk of flooding
Rivers where EFAS is forecasting a flood involving the EU region
EFAS database
Affected area Area potentially affected within the region (km2)
Database of flood hazard maps
Affected towns and cities
List of major towns and cities potentially affected within the region
Map of major urban areas (internally developed)
Economic damage Total economic damage aggregated over the affected area (euro)
Damage curves (Huizinga, 2007) Flood hazard maps Corine land cover
Affected population Total resident population in the affected EU region area
Population layer (Batista e Silva et al., 2012)
Affected major infrastructures
List and total length of motorways, national roads, railways, airports within the affected area (km)
Maps of infrastructures (internally developed)
3. PRELIMINARY APPLICATIONS AND RESULTS
A preliminary version of the procedure for rapid risk assessment has been tested on the catastrophic floods that in May 2014 affected Serbia, Croatia and Bosnia-Herzegovina. The most affected areas were the region around Sava River, between the confluence of Rivers Bosna and Drina, along with several minor tributaries.
In this first test, impact analysis has been limited to land use and population affected by flooding. Economic losses have not been included in this preliminary analysis, because damage functions and population data are still not available for Serbia and Bosnia-Herzegovina, and no damage estimations have been provided.
In the foreseen operational system, the procedure will be implemented directly in the EFAS forecast analysis chain and will be executed immediately when the EFAS hydrological forecast becomes available. The procedure is designed in the way that the spatial spread of the potentially affected areas over the full forecasting domain should not degrade the overall performance of the analysis. The full execution time of the procedure is currently up to 30 minutes. In the
E-proceedings of the 36th IAHR World Congress
28 June – 3 July, 2015, The Hague, the Netherlands
5
operational setup we expect to be able to deliver the result of the analysis within one hour after the EFAS forecast runs are finished.
3.1 Flood hazard mapping
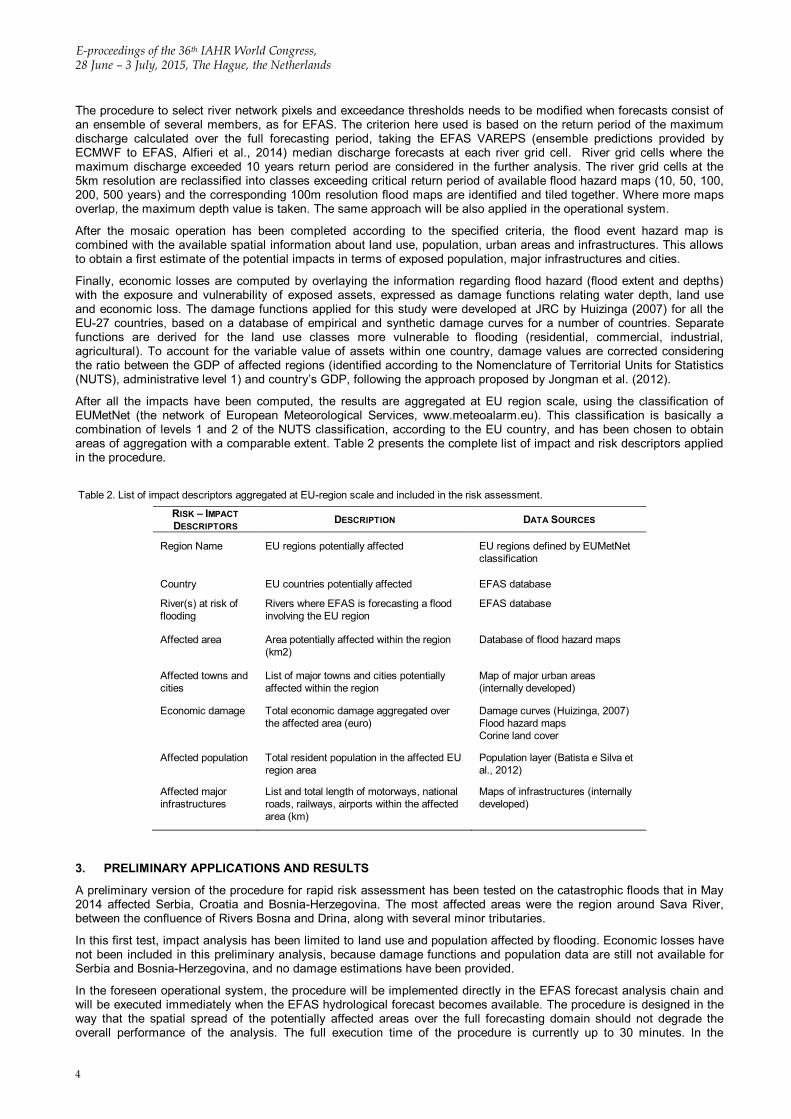
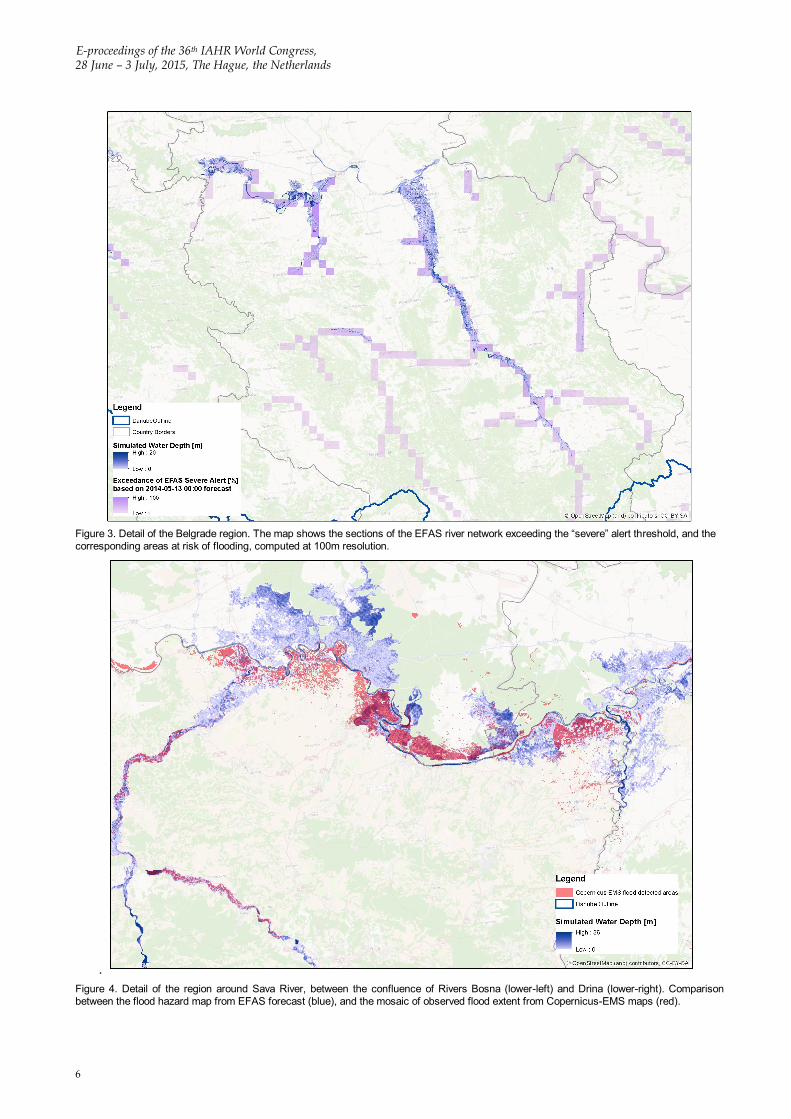
The EFAS forecast issued on May 13th for the Danube river basin has been selected to apply the mapping procedure. The selection criterion takes into account those pixels where the number of forecast runs exceeding the ‘severe” threshold is superior to a specific value, set equal to 25%. For most of the selected pixels, the lead time was between 4-5 days, consistently with actual occurrence of peak discharges in the corresponding river reaches. For this test, only the “severe” and “high” threshold has been considered (see Table 1).
Figure 2 shows the Danube River basin with the sections of EFAS river network selected, while Figure 3 shows a detail of the produced flood hazard map with the corresponding EFAS river network.
Figure 2. Danube River basin and sections of the EFAS river network with probability of exceeding the “severe” threshold based on ECMWF VAREPS. The different tones of blue indicate the exceedance probability.
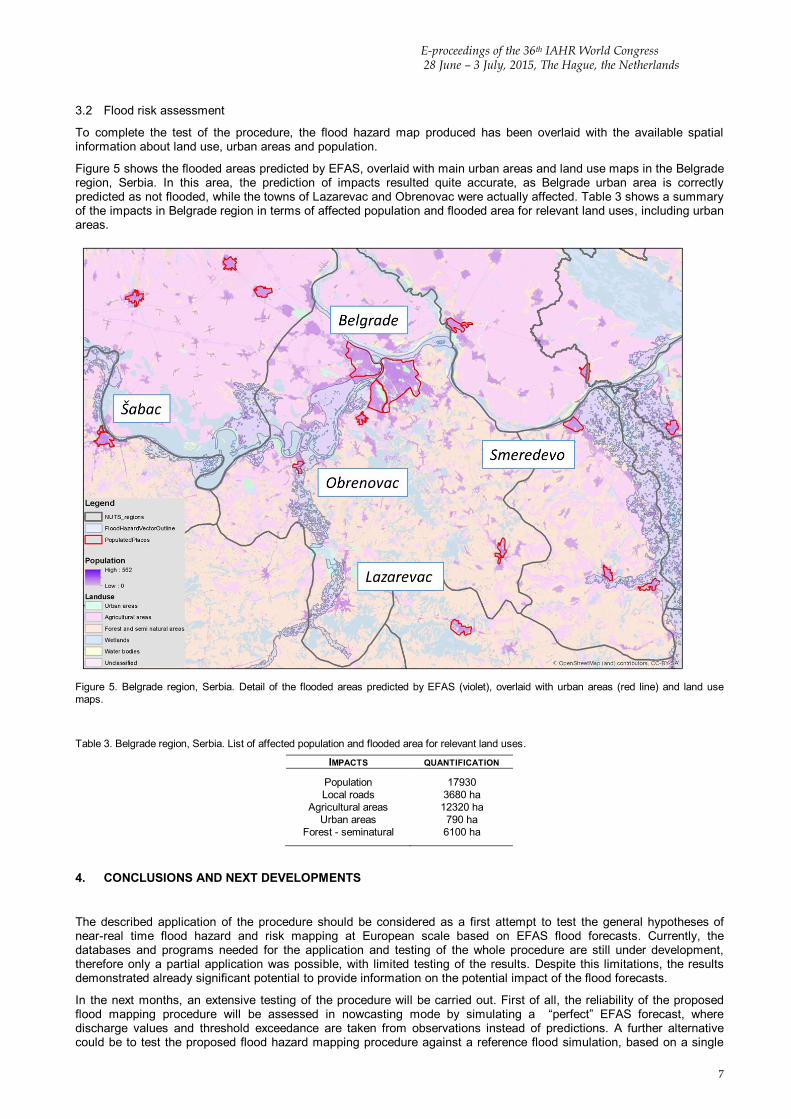
In order to have a first validation of the procedure, the flood hazard map produced has been compared with a mosaic of the flood extent maps produced by the Copernicus Emergency Management System from satellite imagery (2014).To produce a more consistent flood map of the event, the pixels exceeding the “high” EFAS threshold and the related maps were also considered. Figure 4 shows a comparison between observed and simulated flood maps. As can be seen from the visual comparison, predicted flooded areas are generally overestimating the actual flood extent: while the majority of observed flooded areas are actually included in the predicted map, large areas around the rivers Sava and Drina are indicated to be at risk, but were not affected. This can be explained considering that flood simulations do not include protective structures smaller than 100m x 100m due to the DEM coarse resolution (Alfieri et al., 2013). For the same reason, topographic features like river channels and embankments may not be well reproduced, thus complicating the reproduction of flooding process. Moreover, EFAS forecast might have overestimated peak discharge in some reaches (Alfieri et al., 2014).
It is interesting to note that the merged flood map, despite being a mosaic of maps coming from different simulations and return periods, is not affected by physical inconsistencies (such as cuts of water depth values at the external border, and abrupt depth changes where different maps overlap). This occurs because the variation of discharge across a river reach is always gradual, as border areas are generally taken from maps with the lowest return period. Also, differences between 5 and 10 years RP maps, and between 10 and 20 years maps are relevant but not too large, and do not result in relevant border effects when merged together.
E-proceedings of the 36th IAHR World Congress, 28 June – 3 July, 2015, The Hague, the Netherlands
6
Figure 3. Detail of the Belgrade region. The map shows the sections of the EFAS river network exceeding the “severe” alert threshold, and the corresponding areas at risk of flooding, computed at 100m resolution.
. Figure 4. Detail of the region around Sava River, between the confluence of Rivers Bosna (lower-left) and Drina (lower-right). Comparison between the flood hazard map from EFAS forecast (blue), and the mosaic of observed flood extent from Copernicus-EMS maps (red).
E-proceedings of the 36th IAHR World Congress
28 June – 3 July, 2015, The Hague, the Netherlands
7
3.2 Flood risk assessment
To complete the test of the procedure, the flood hazard map produced has been overlaid with the available spatial information about land use, urban areas and population.
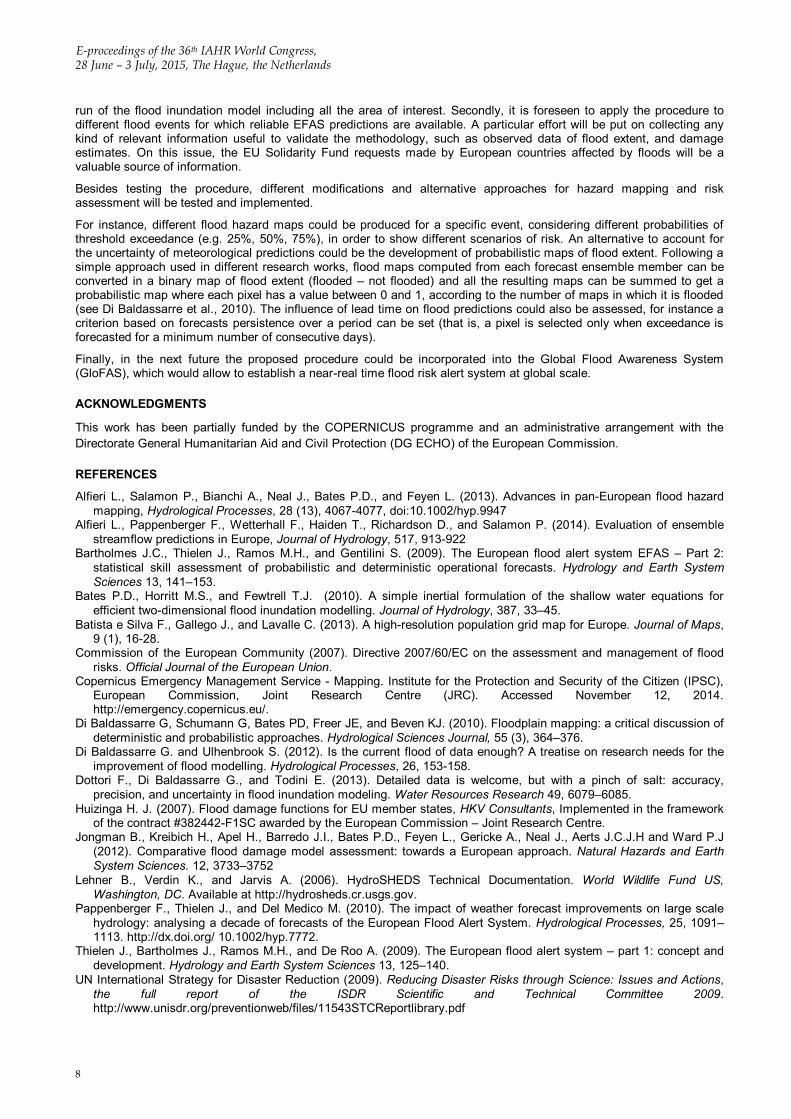
Figure 5 shows the flooded areas predicted by EFAS, overlaid with main urban areas and land use maps in the Belgrade region, Serbia. In this area, the prediction of impacts resulted quite accurate, as Belgrade urban area is correctly predicted as not flooded, while the towns of Lazarevac and Obrenovac were actually affected. Table 3 shows a summary of the impacts in Belgrade region in terms of affected population and flooded area for relevant land uses, including urban areas.
Figure 5. Belgrade region, Serbia. Detail of the flooded areas predicted by EFAS (violet), overlaid with urban areas (red line) and land use maps.
Table 3. Belgrade region, Serbia. List of affected population and flooded area for relevant land uses.
IMPACTS QUANTIFICATION
Population 17930 Local roads 3680 ha
Agricultural areas 12320 ha Urban areas 790 ha
Forest - seminatural 6100 ha
4. CONCLUSIONS AND NEXT DEVELOPMENTS
The described application of the procedure should be considered as a first attempt to test the general hypotheses of near-real time flood hazard and risk mapping at European scale based on EFAS flood forecasts. Currently, the databases and programs needed for the application and testing of the whole procedure are still under development, therefore only a partial application was possible, with limited testing of the results. Despite this limitations, the results demonstrated already significant potential to provide information on the potential impact of the flood forecasts.
In the next months, an extensive testing of the procedure will be carried out. First of all, the reliability of the proposed flood mapping procedure will be assessed in nowcasting mode by simulating a “perfect” EFAS forecast, where discharge values and threshold exceedance are taken from observations instead of predictions. A further alternative could be to test the proposed flood hazard mapping procedure against a reference flood simulation, based on a single
E-proceedings of the 36th IAHR World Congress, 28 June – 3 July, 2015, The Hague, the Netherlands
8
run of the flood inundation model including all the area of interest. Secondly, it is foreseen to apply the procedure to different flood events for which reliable EFAS predictions are available. A particular effort will be put on collecting any kind of relevant information useful to validate the methodology, such as observed data of flood extent, and damage estimates. On this issue, the EU Solidarity Fund requests made by European countries affected by floods will be a valuable source of information.
Besides testing the procedure, different modifications and alternative approaches for hazard mapping and risk assessment will be tested and implemented.
For instance, different flood hazard maps could be produced for a specific event, considering different probabilities of threshold exceedance (e.g. 25%, 50%, 75%), in order to show different scenarios of risk. An alternative to account for the uncertainty of meteorological predictions could be the development of probabilistic maps of flood extent. Following a simple approach used in different research works, flood maps computed from each forecast ensemble member can be converted in a binary map of flood extent (flooded – not flooded) and all the resulting maps can be summed to get a probabilistic map where each pixel has a value between 0 and 1, according to the number of maps in which it is flooded (see Di Baldassarre et al., 2010). The influence of lead time on flood predictions could also be assessed, for instance a criterion based on forecasts persistence over a period can be set (that is, a pixel is selected only when exceedance is forecasted for a minimum number of consecutive days).
Finally, in the next future the proposed procedure could be incorporated into the Global Flood Awareness System (GloFAS), which would allow to establish a near-real time flood risk alert system at global scale.
ACKNOWLEDGMENTS
This work has been partially funded by the COPERNICUS programme and an administrative arrangement with the Directorate General Humanitarian Aid and Civil Protection (DG ECHO) of the European Commission.
REFERENCES
Alfieri L., Salamon P., Bianchi A., Neal J., Bates P.D., and Feyen L. (2013). Advances in pan-European flood hazard mapping, Hydrological Processes, 28 (13), 4067-4077, doi:10.1002/hyp.9947
Alfieri L., Pappenberger F., Wetterhall F., Haiden T., Richardson D., and Salamon P. (2014). Evaluation of ensemble streamflow predictions in Europe, Journal of Hydrology, 517, 913-922
Bartholmes J.C., Thielen J., Ramos M.H., and Gentilini S. (2009). The European flood alert system EFAS – Part 2: statistical skill assessment of probabilistic and deterministic operational forecasts. Hydrology and Earth System Sciences 13, 141–153.
Bates P.D., Horritt M.S., and Fewtrell T.J. (2010). A simple inertial formulation of the shallow water equations for efficient two-dimensional flood inundation modelling. Journal of Hydrology, 387, 33–45.
Batista e Silva F., Gallego J., and Lavalle C. (2013). A high-resolution population grid map for Europe. Journal of Maps, 9 (1), 16-28.
Commission of the European Community (2007). Directive 2007/60/EC on the assessment and management of flood risks. Official Journal of the European Union.
Copernicus Emergency Management Service - Mapping. Institute for the Protection and Security of the Citizen (IPSC), European Commission, Joint Research Centre (JRC). Accessed November 12, 2014. http://emergency.copernicus.eu/.
Di Baldassarre G, Schumann G, Bates PD, Freer JE, and Beven KJ. (2010). Floodplain mapping: a critical discussion of deterministic and probabilistic approaches. Hydrological Sciences Journal, 55 (3), 364–376.
Di Baldassarre G. and Ulhenbrook S. (2012). Is the current flood of data enough? A treatise on research needs for the improvement of flood modelling. Hydrological Processes, 26, 153-158.
Dottori F., Di Baldassarre G., and Todini E. (2013). Detailed data is welcome, but with a pinch of salt: accuracy, precision, and uncertainty in flood inundation modeling. Water Resources Research 49, 6079–6085.
Huizinga H. J. (2007). Flood damage functions for EU member states, HKV Consultants, Implemented in the framework of the contract #382442-F1SC awarded by the European Commission – Joint Research Centre.
Jongman B., Kreibich H., Apel H., Barredo J.I., Bates P.D., Feyen L., Gericke A., Neal J., Aerts J.C.J.H and Ward P.J (2012). Comparative flood damage model assessment: towards a European approach. Natural Hazards and Earth System Sciences. 12, 3733–3752
Lehner B., Verdin K., and Jarvis A. (2006). HydroSHEDS Technical Documentation. World Wildlife Fund US, Washington, DC. Available at http://hydrosheds.cr.usgs.gov.
Pappenberger F., Thielen J., and Del Medico M. (2010). The impact of weather forecast improvements on large scale hydrology: analysing a decade of forecasts of the European Flood Alert System. Hydrological Processes, 25, 1091–1113. http://dx.doi.org/ 10.1002/hyp.7772.
Thielen J., Bartholmes J., Ramos M.H., and De Roo A. (2009). The European flood alert system – part 1: concept and development. Hydrology and Earth System Sciences 13, 125–140.
UN International Strategy for Disaster Reduction (2009). Reducing Disaster Risks through Science: Issues and Actions, the full report of the ISDR Scientific and Technical Committee 2009. http://www.unisdr.org/preventionweb/files/11543STCReportlibrary.pdf