a neonatal phantom for cr and dr quality...
TRANSCRIPT
25 april 2008 ljrutz ncaapm 1
A Neonatal Phantom for CR and DR Quality Assurance
25 april 2008 ljrutz ncaapm 2
Acknowledgements
Research supported by an NIH STTRGrant # 2R42HD040747 Phases 1&2
Gammex, Inc. Grantee Washington University, St. Louis, MO
25 april 2008 ljrutz ncaapm 3
Washington University
Steven Don – Pediatric Radiologist, PIBruce Whiting – Imaging Physicist, Co-investigator
Parinaz Massoumzadah – Imaging PhysicistGlenn Fletcher – Medical Physicist
Charles Hildebolt – StatisticianRuth Holdener – Technologist
Summer students
25 april 2008 ljrutz ncaapm 4
Participating University Investigators
Duke UniversityDon Frush – Pediatric RadiologistEhsan Samei – Imaging Physicist
Henry FordMichael Flynn – Imaging Physicist
Oregon Health Science UniversityKatharine Hopkins – Pediatric Radiologist
Paul Brown – Medical Physicist

25 april 2008 ljrutz ncaapm 5
Gammex, Inc.
R&D, Engineering & Production Staff
Disclosure• L. Rutz currently contracted consultant for Gammex, Inc
25 april 2008 ljrutz ncaapm 6
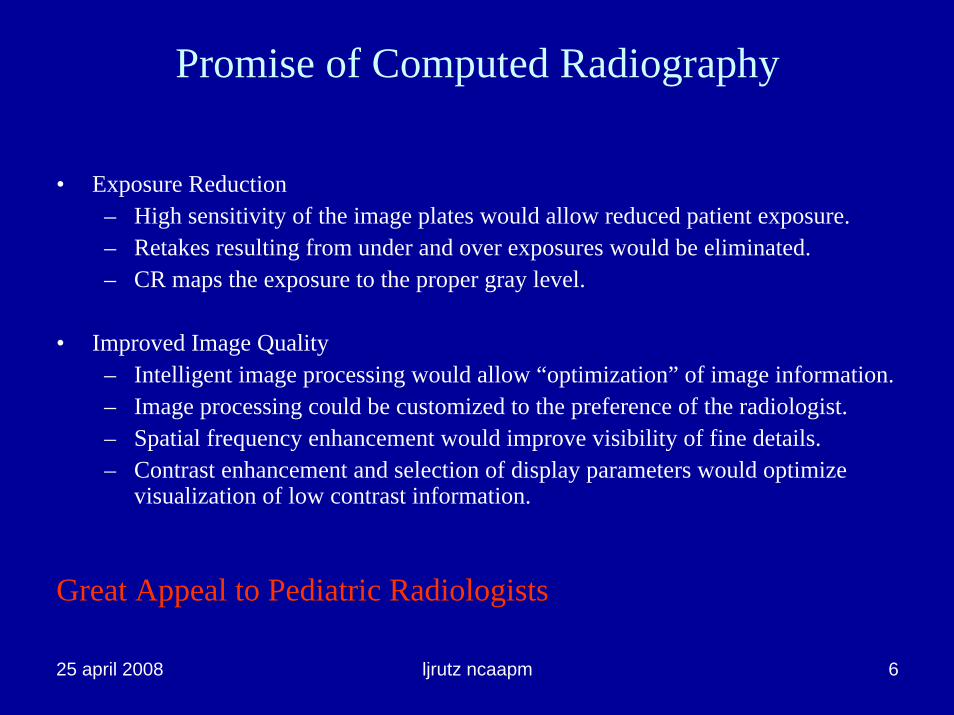
Promise of Computed Radiography
• Exposure Reduction– High sensitivity of the image plates would allow reduced patient exposure.– Retakes resulting from under and over exposures would be eliminated.– CR maps the exposure to the proper gray level.
• Improved Image Quality– Intelligent image processing would allow “optimization” of image information.– Image processing could be customized to the preference of the radiologist.– Spatial frequency enhancement would improve visibility of fine details.– Contrast enhancement and selection of display parameters would optimize
visualization of low contrast information.
Great Appeal to Pediatric Radiologists
25 april 2008 ljrutz ncaapm 7
Computed radiography is different from screen/film radiography.
• The CR system uses a-priori knowledge of the anatomy to optimize the image.
• Application of gray-scale mapping and spatial frequency enhancement.
• Histogram analysis plays a key role in the image processing.– Selection of data to be treated as anatomy.– Scaling of data into proper display range.
25 april 2008 ljrutz ncaapm 8
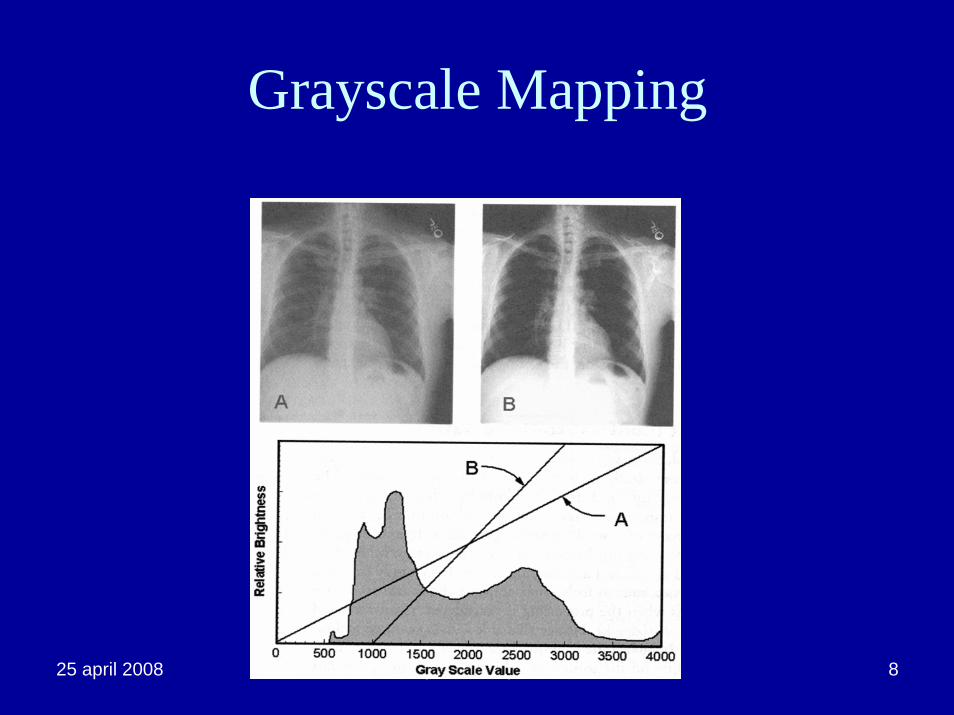
Grayscale Mapping
25 april 2008 ljrutz ncaapm 9
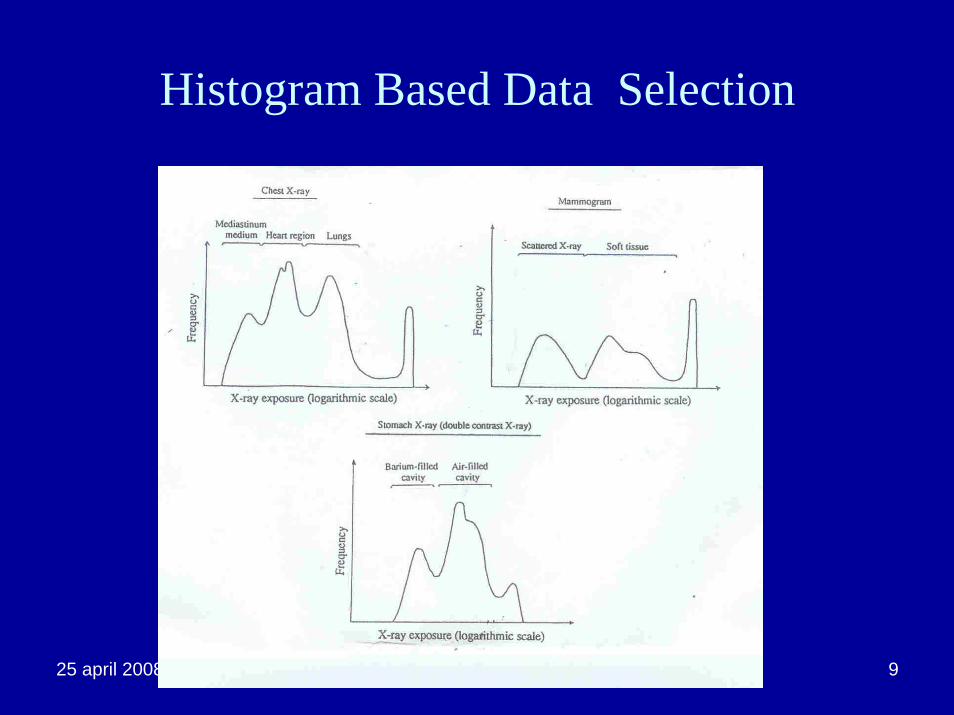
Histogram Based Data Selection
25 april 2008 ljrutz ncaapm 10
Effect on Routine Quality Assurance
• Image quality assessment now includes the effects of image processing.
• Image processing depends on a-priori knowledge of the anatomy being imaged.– Tissue attenuation characteristics.– Size– Expected histogram shape.
25 april 2008 ljrutz ncaapm11
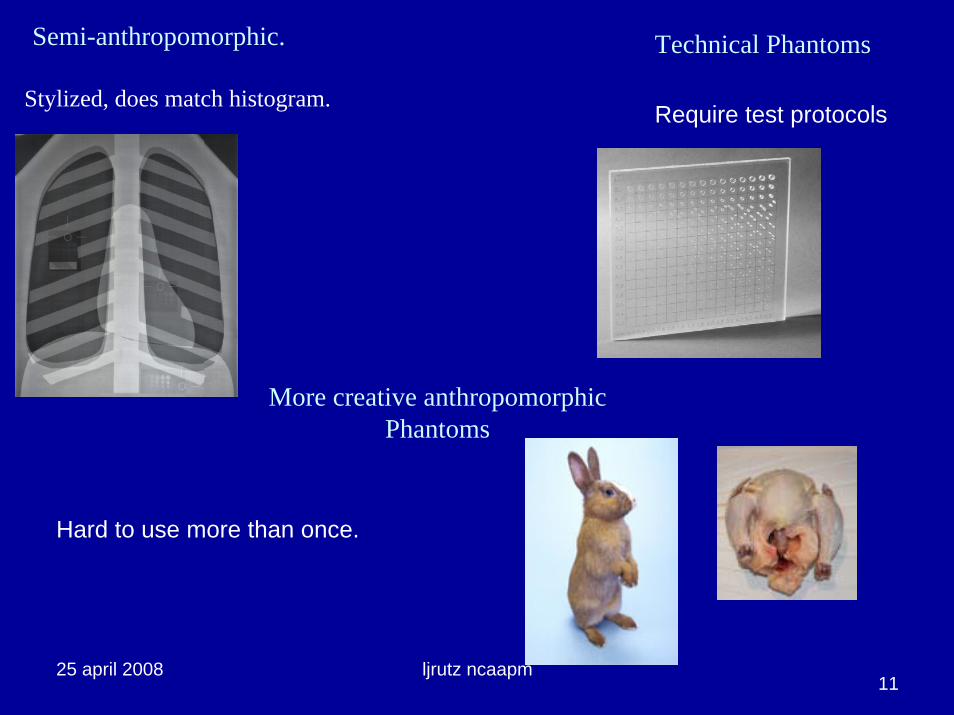
More creative anthropomorphic Phantoms
Hard to use more than once.
Require test protocolsStylized, does match histogram.
Semi-anthropomorphic. Technical Phantoms
25 april 2008 ljrutz ncaapm 12
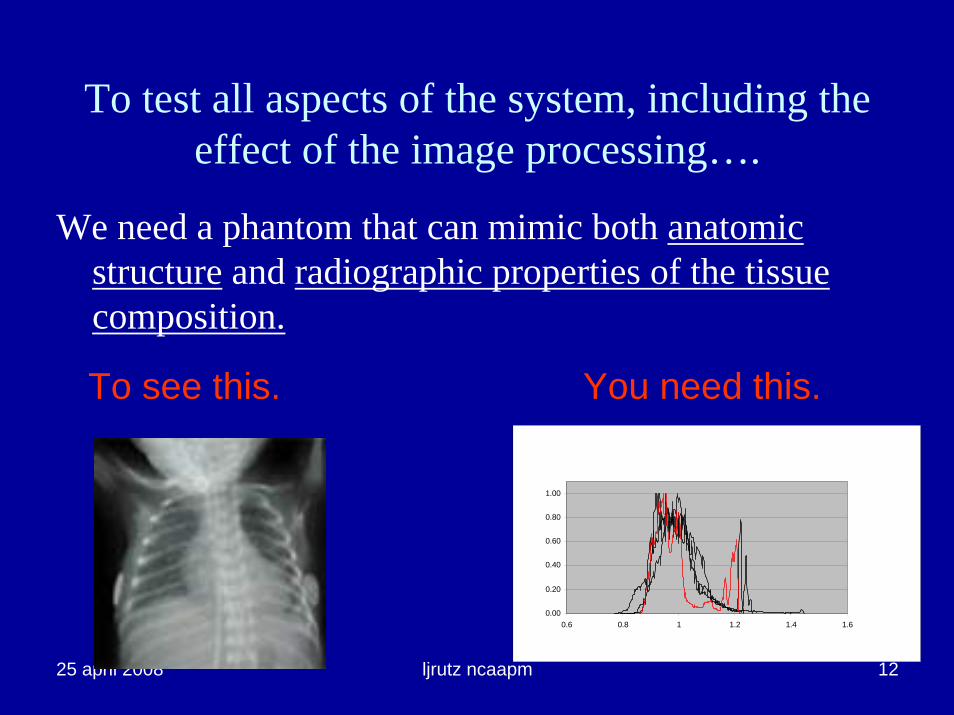
To test all aspects of the system, including the effect of the image processing….
We need a phantom that can mimic both anatomic structure and radiographic properties of the tissue composition.
To see this. You need this.
0.00
0.20
0.40
0.60
0.80
1.00
0.6 0.8 1 1.2 1.4 1.6
25 april 2008 ljrutz ncaapm 13Solution?
25 april 2008 ljrutz ncaapm 14
OK, Back to the Drawing Board
• Design a New Phantom• Build a Prototype• Test against Physics Requirements• Test against Clinical Requirements.
SteveBruce
Lois
?

25 april 2008 ljrutz ncaapm 15
Why build a Neonatal chest phantom
• Importance of CR for dose reduction in Pediatric Radiology
• Technical difficulty of imaging neonates with CR
– Small size of structures, and similar tissue attenuation characteristics, challenge the technical limits of the system.
– Image quality factors of resolution and signal to noise ratio are stressed in neonatal imaging.
• If a system tests well for neonatal imaging it should be capable of good image quality in general.
25 april 2008 ljrutz ncaapm 16
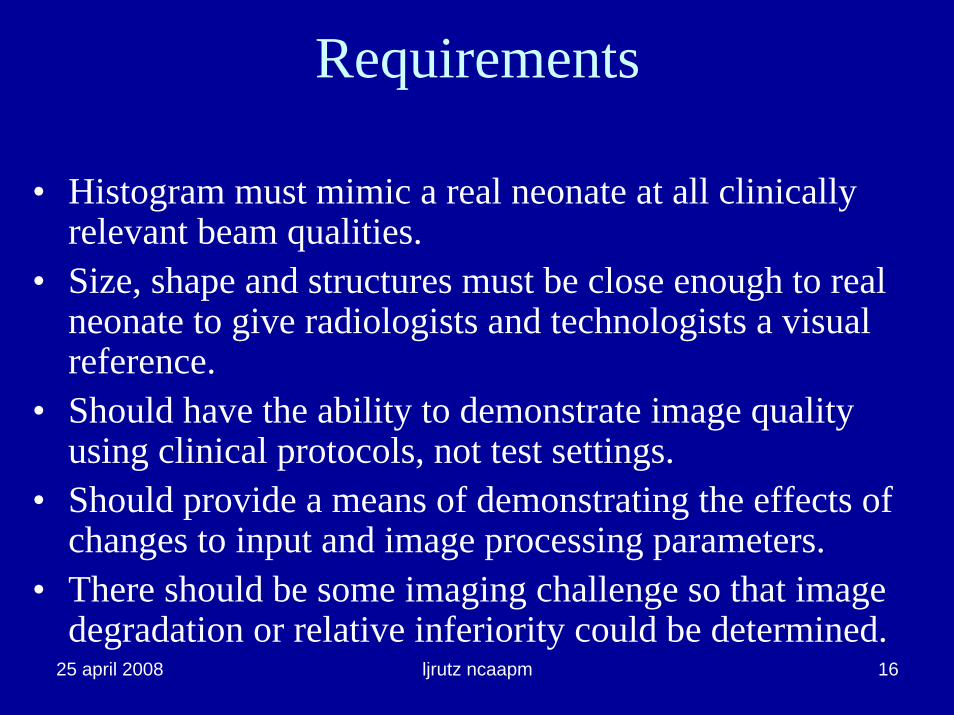
Requirements
• Histogram must mimic a real neonate at all clinically relevant beam qualities.
• Size, shape and structures must be close enough to real neonate to give radiologists and technologists a visual reference.
• Should have the ability to demonstrate image quality using clinical protocols, not test settings.
• Should provide a means of demonstrating the effects of changes to input and image processing parameters.
• There should be some imaging challenge so that image degradation or relative inferiority could be determined.
25 april 2008 ljrutz ncaapm 17
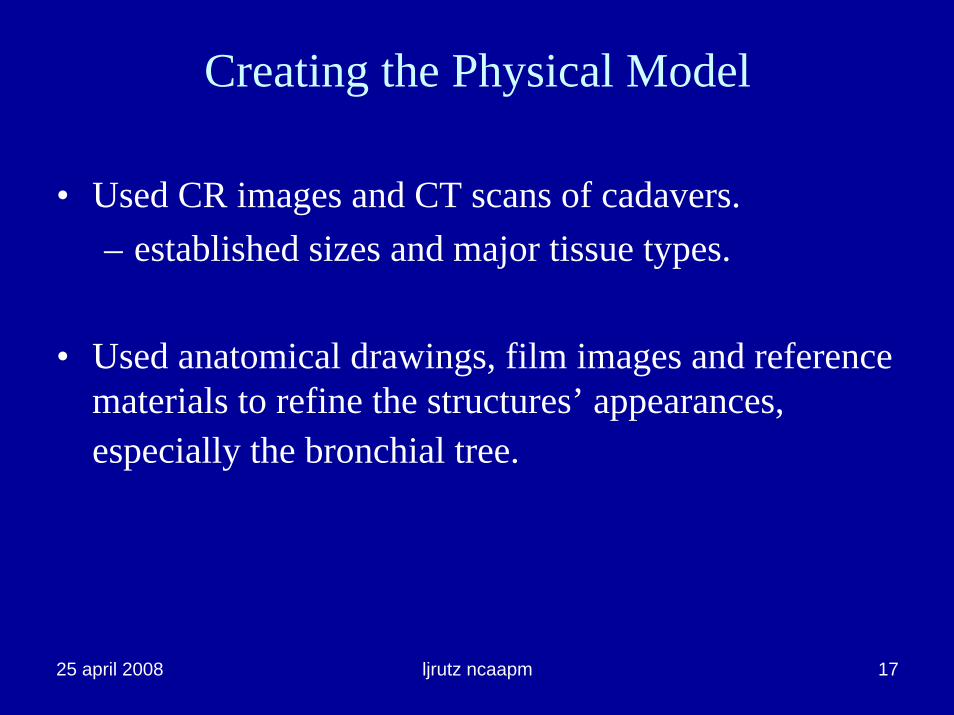
Creating the Physical Model
• Used CR images and CT scans of cadavers.– established sizes and major tissue types.
• Used anatomical drawings, film images and reference materials to refine the structures’ appearances, especially the bronchial tree.
25 april 2008 ljrutz ncaapm 18
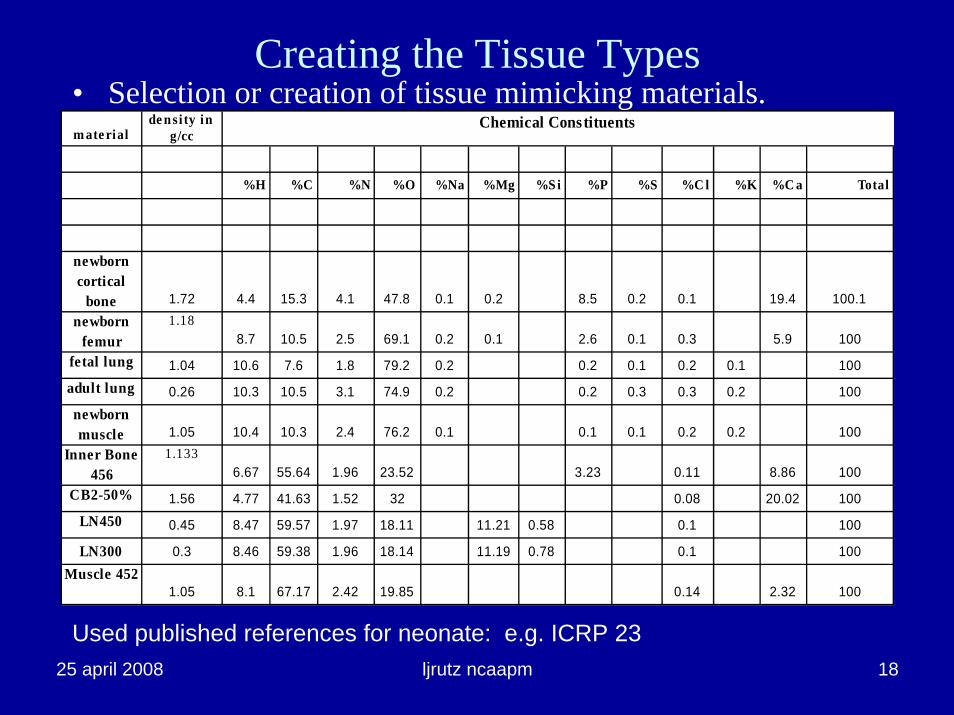
m ate rialde nsi ty in
g/cc
%H %C %N %O %Na %Mg %S i %P %S %C l %K %C a Total
newborn cortical
bone 1.72 4.4 15.3 4.1 47.8 0.1 0.2 8.5 0.2 0.1 19.4 100.1newborn
femur1.18
8.7 10.5 2.5 69.1 0.2 0.1 2.6 0.1 0.3 5.9 100fetal lung 1.04 10.6 7.6 1.8 79.2 0.2 0.2 0.1 0.2 0.1 100adult lung 0.26 10.3 10.5 3.1 74.9 0.2 0.2 0.3 0.3 0.2 100newborn muscle 1.05 10.4 10.3 2.4 76.2 0.1 0.1 0.1 0.2 0.2 100
Inner Bone 456
1.1336.67 55.64 1.96 23.52 3.23 0.11 8.86 100
CB2-50% 1.56 4.77 41.63 1.52 32 0.08 20.02 100LN450 0.45 8.47 59.57 1.97 18.11 11.21 0.58 0.1 100
LN300 0.3 8.46 59.38 1.96 18.14 11.19 0.78 0.1 100Muscle 452
1.05 8.1 67.17 2.42 19.85 0.14 2.32 100
Chemical Constituents
Creating the Tissue Types• Selection or creation of tissue mimicking materials.
Used published references for neonate: e.g. ICRP 23
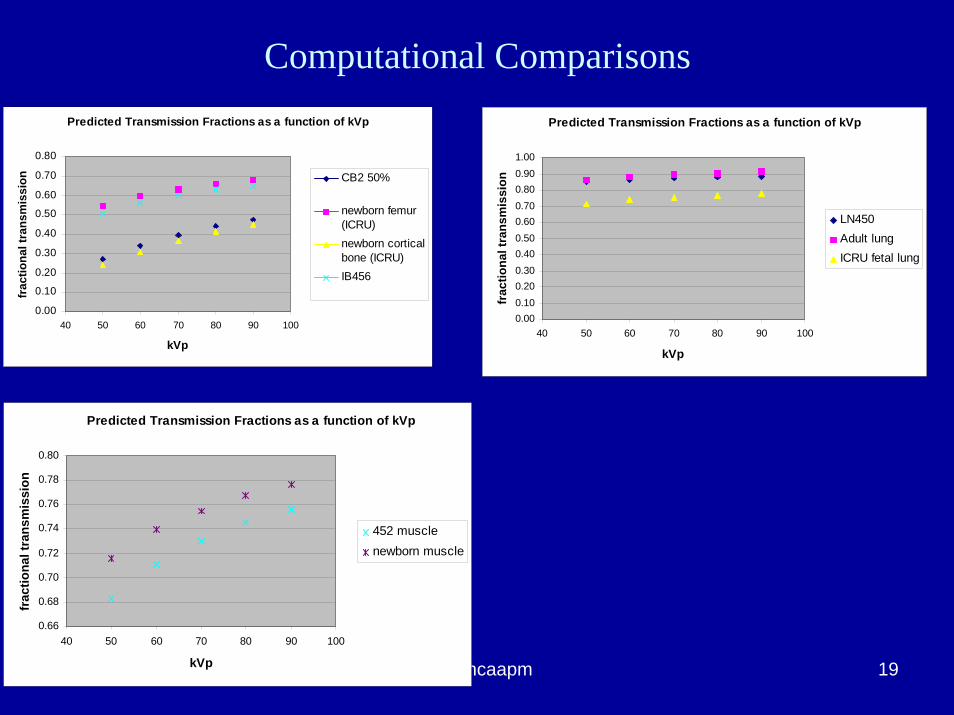
25 april 2008 ljrutz ncaapm 19
Predicted Transmission Fractions as a function of kVp
0.000.100.200.300.400.500.600.700.800.901.00
40 50 60 70 80 90 100
kVp
frac
tiona
l tra
nsm
issi
on
LN450Adult lungICRU fetal lung
Predicted Transmission Fractions as a function of kVp
0.00
0.10
0.20
0.30
0.40
0.50
0.60
0.70
0.80
40 50 60 70 80 90 100
kVp
frac
tiona
l tra
nsm
issi
on CB2 50%
newborn femur(ICRU)newborn corticalbone (ICRU)IB456
Predicted Transmission Fractions as a function of kVp
0.66
0.68
0.70
0.72
0.74
0.76
0.78
0.80
40 50 60 70 80 90 100
kVp
frac
tiona
l tra
nsm
issi
on
452 musclenewborn muscle
Computational Comparisons

25 april 2008 ljrutz ncaapm 20
Muscle at 90 kVp
0.000.100.200.300.400.500.600.700.800.901.00
0 5 10 15 20 25 30 35 40 45 50
mm muscle material
fract
iona
l tra
nsm
issi
on
90 kvp calc90 kvp meas
Lung material 90 kVp y = 0.9869e-0.0112x
y = 0.9711e-0.0119x0.000.100.200.300.400.500.600.700.800.901.00
0 5 10 15 20 25 30 35 40 45 50 55 60 65 70 75 80 85 90 95
mm Lung material
frac
tiona
l tra
nsm
issi
on
calcmeasExpon. (calc)Expon. (meas)
Bone at 90 kVp
0.000.10
0.200.30
0.400.50
0.600.70
0.800.90
1.00
0 5 10 15 20 25 30 35 40 45 50
mm Bone
frac
tiona
l tra
nsm
issi
on
calcmeas
Validation of Computation
25 april 2008 ljrutz ncaapm 21
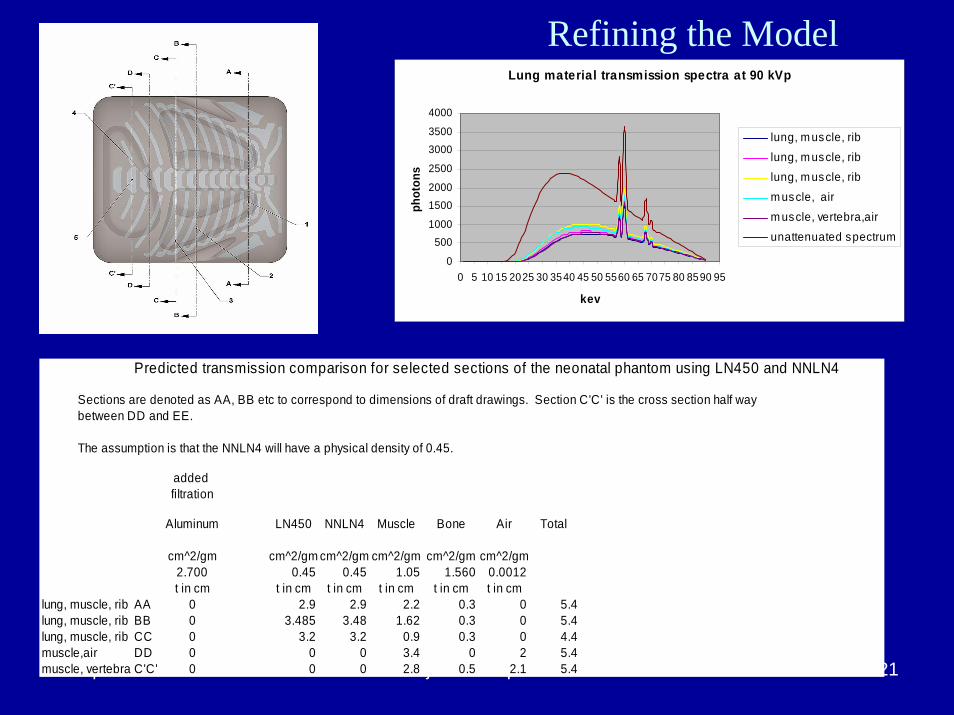
Lung material transmission spectra at 90 kVp
0
5001000
15002000
2500
30003500
4000
0 5 10 15 2025 30 3540 45 50 5560 65 7075 80 8590 95
kev
phot
ons
lung, m uscle, rib
lung, m uscle, riblung, m uscle, rib
m uscle, air
m uscle, vertebra,air
unattenuated spectrum
Predicted transmission comparison for selected sections of the neonatal phantom using LN450 and NNLN4
Sections are denoted as AA, BB etc to correspond to dimensions of draft drawings. Section C'C' is the cross section half waybetween DD and EE.
The assumption is that the NNLN4 will have a physical density of 0.45.
added filtration
Aluminum LN450 NNLN4 Muscle Bone Air Total
cm^2/gm cm^2/gm cm^2/gm cm^2/gm cm^2/gm cm^2/gm2.700 0.45 0.45 1.05 1.560 0.0012t in cm t in cm t in cm t in cm t in cm t in cm
lung, muscle, rib AA 0 2.9 2.9 2.2 0.3 0 5.4lung, muscle, rib BB 0 3.485 3.48 1.62 0.3 0 5.4lung, muscle, rib CC 0 3.2 3.2 0.9 0.3 0 4.4muscle,air DD 0 0 0 3.4 0 2 5.4muscle, vertebra C'C' 0 0 0 2.8 0.5 2.1 5.4
Refining the Model
30
40
50
60
70
80
90
100
110
120
130
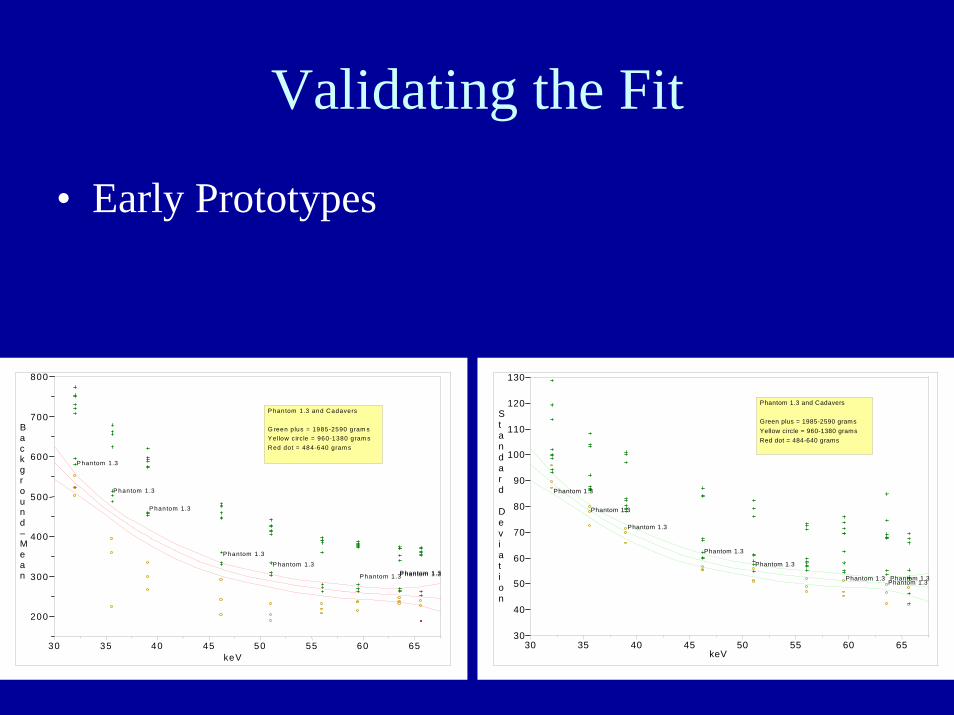
Standard
Deviation
Phantom 1.3
Phantom 1.3
Phantom 1.3
Phantom 1.3
Phantom 1.3
Phantom 1.3 Phantom 1.3Phantom 1.3
30 35 40 45 50 55 60 65keV
Phantom 1.3 and Cadavers
Green plus = 1985-2590 gramsYellow circle = 960-1380 gramsRed dot = 484-640 grams
200
300
400
500
600
700
800
Background–Mean
P hantom 1.3
Phantom 1.3
P hantom 1.3
Phantom 1.3
P hantom 1.3
Phantom 1.3P hantom 1.3P hantom 1.3
30 35 40 45 50 55 60 65keV
P hantom 1.3 and Cadavers
G reen plus = 1985-2590 gram sY ellow c ircle = 960-1380 gram sR ed dot = 484-640 gram s
Validating the Fit
• Early Prototypes
25 april 2008 ljrutz ncaapm 23
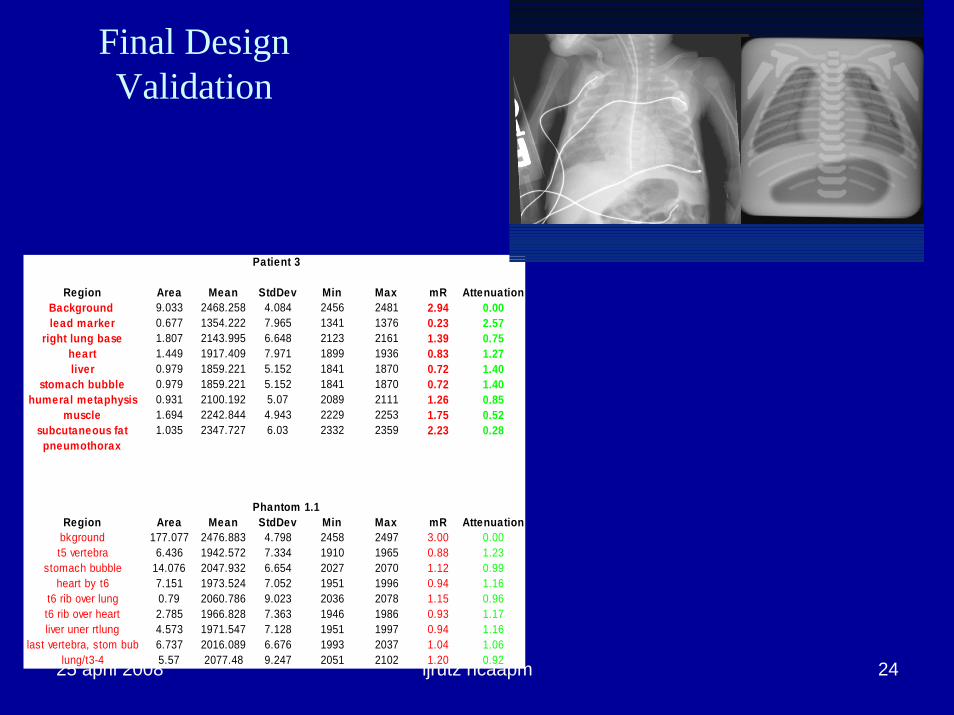
Validation: Phantom adequately represents a 1kg to 2kg neonate both anatomically and
radiographically.
• Thirty clinical images were compared to phantom images obtained using identical technique factors at three sites on three different CR systems.
• The raw image data were analyzed using ImageJ .• Pixel values of the whole body, right lung base, heart, liver,
stomach bubble, humeral metaphysis, muscle, subcutaneous fat and pneumothorax were normalized relative to direct exposure (air) for each image.
• The results were plotted against the weight distribution of the patients.
25 april 2008 ljrutz ncaapm 24
Patient 3
Region Area Mean StdDev Min Max mR AttenuationBackground 9.033 2468.258 4.084 2456 2481 2.94 0.00lead marker 0.677 1354.222 7.965 1341 1376 0.23 2.57
right lung base 1.807 2143.995 6.648 2123 2161 1.39 0.75heart 1.449 1917.409 7.971 1899 1936 0.83 1.27liver 0.979 1859.221 5.152 1841 1870 0.72 1.40
stomach bubble 0.979 1859.221 5.152 1841 1870 0.72 1.40humeral metaphysis 0.931 2100.192 5.07 2089 2111 1.26 0.85
muscle 1.694 2242.844 4.943 2229 2253 1.75 0.52subcutaneous fat 1.035 2347.727 6.03 2332 2359 2.23 0.28
pneumothorax
Phantom 1.1Region Area Mean StdDev Min Max mR Attenuation
bkground 177.077 2476.883 4.798 2458 2497 3.00 0.00t5 vertebra 6.436 1942.572 7.334 1910 1965 0.88 1.23
stomach bubble 14.076 2047.932 6.654 2027 2070 1.12 0.99heart by t6 7.151 1973.524 7.052 1951 1996 0.94 1.16
t6 rib over lung 0.79 2060.786 9.023 2036 2078 1.15 0.96t6 rib over heart 2.785 1966.828 7.363 1946 1986 0.93 1.17liver uner rtlung 4.573 1971.547 7.128 1951 1997 0.94 1.16
last vertebra, stom bub 6.737 2016.089 6.676 1993 2037 1.04 1.06lung/t3-4 5.57 2077.48 9.247 2051 2102 1.20 0.92
Final Design Validation
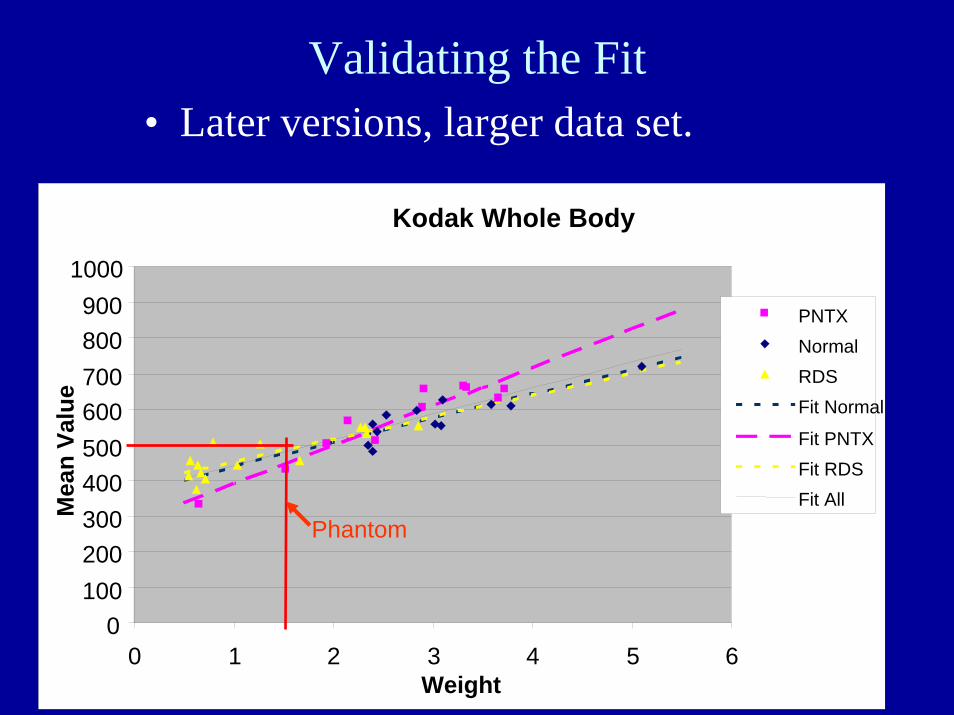
Kodak Whole Body
0100200300400500600700800900
1000
0 1 2 3 4 5 6Weight
Mea
n Va
lue
PNTXNormalRDSFit Normal
Fit PNTXFit RDSFit All
Validating the Fit
Phantom
• Later versions, larger data set.

25 april 2008 ljrutz ncaapm 26
Phantom Weight (in kg)*
Center Heart Thorax T3 rib Humerus
Wash U 1.1 1.1 1.4 1.7
OHSU 1.0 1.3 1.5 1.5
Duke 1.2 1.2 1.6 1.5
*based on log neonate weight and log size
25 april 2008 ljrutz ncaapm 27
Validating the Histogram Equivalence
• Whole body histograms made from clinical images.– Use ImageJ.– Distributions of size and technique factors.– Included best approximation of thorax area to
match phantom.

comparison of histogram for 10 normal neonates and phantom
0
5000
10000
15000
20000
25000
30000
1400 1600 1800 2000 2200 2400 2600 2800 3000
pixel value
freq
uenc
y of
pix
el
bjc_01
bjc_04
bjc_05
bjc_06
bjc_07
bjc_08
bjc_09
bjc_10
bjc_11
bjc_12
phantom_withraw rad
Histogram Comparisons
normalized histogram comparison for 10 normal neonates and phantom
0.000.20
0.400.60
0.801.00
0.6 0.8 1 1.2 1.4 1.6
pixel value as fraction of the mean
frequ
ency
as
frac
tion
of th
e m
axim
um
frequ
ency
bjc_01bjc_4bjc_5bjc_6bjc_7bjc_8bjc_10bjc_11bjc_12ph_04 with raw radiation
25 april 2008 ljrutz ncaapm 29
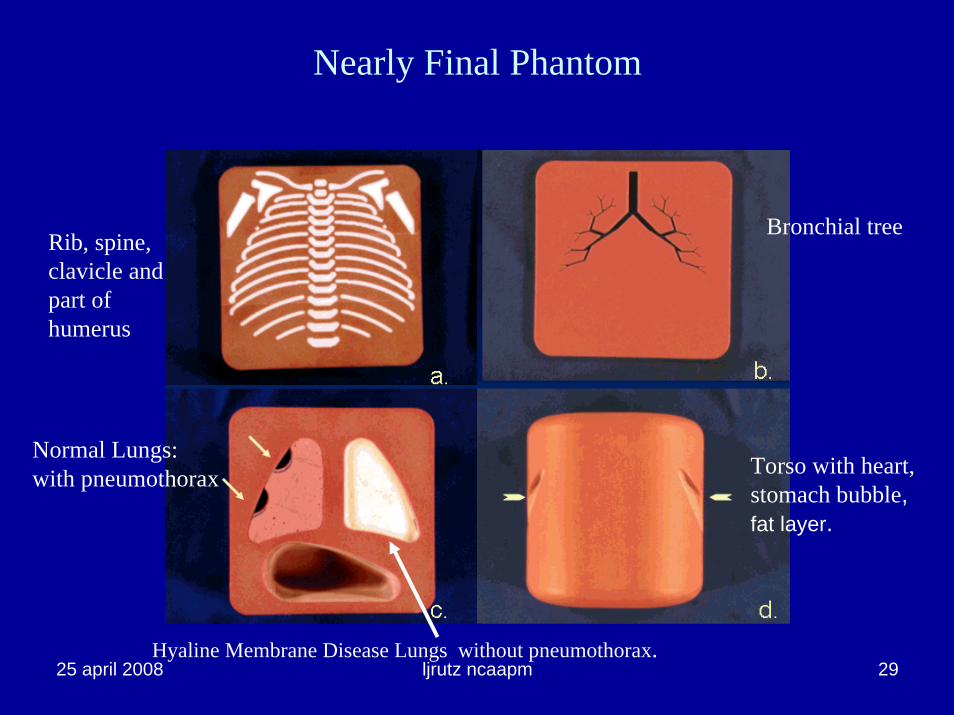
Nearly Final Phantom
Torso with heart, stomach bubble, fat layer.
Rib, spine, clavicle and part of humerus
Bronchial tree
Normal Lungs: with pneumothorax
Hyaline Membrane Disease Lungs without pneumothorax.
25 april 2008 ljrutz ncaapm 30
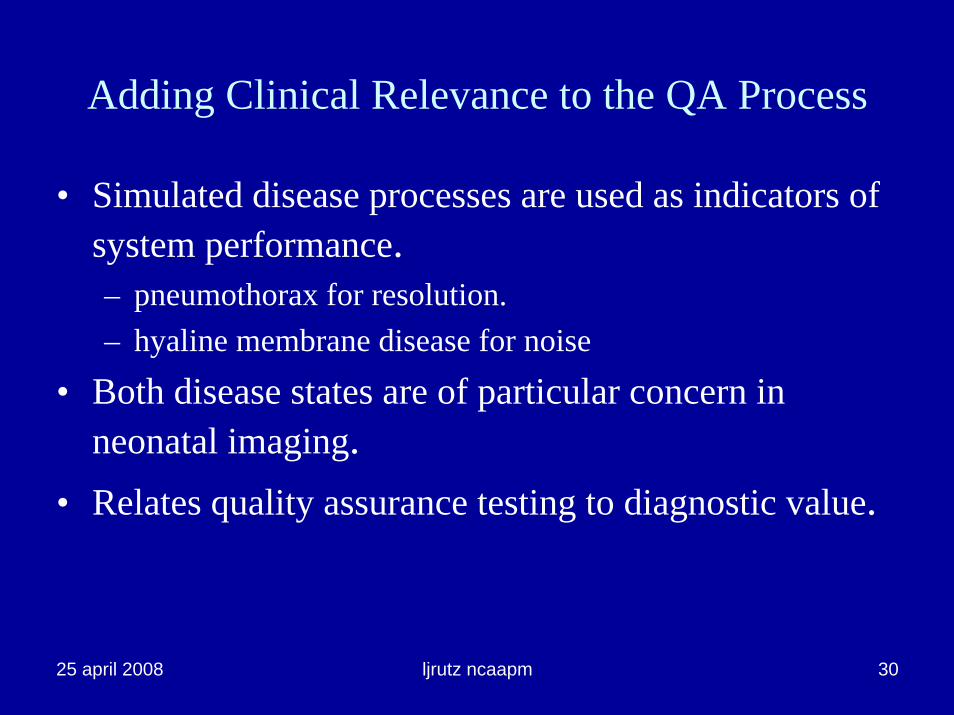
Adding Clinical Relevance to the QA Process
• Simulated disease processes are used as indicators of system performance.– pneumothorax for resolution.– hyaline membrane disease for noise
• Both disease states are of particular concern in neonatal imaging.
• Relates quality assurance testing to diagnostic value.

25 april 2008 ljrutz ncaapm 31
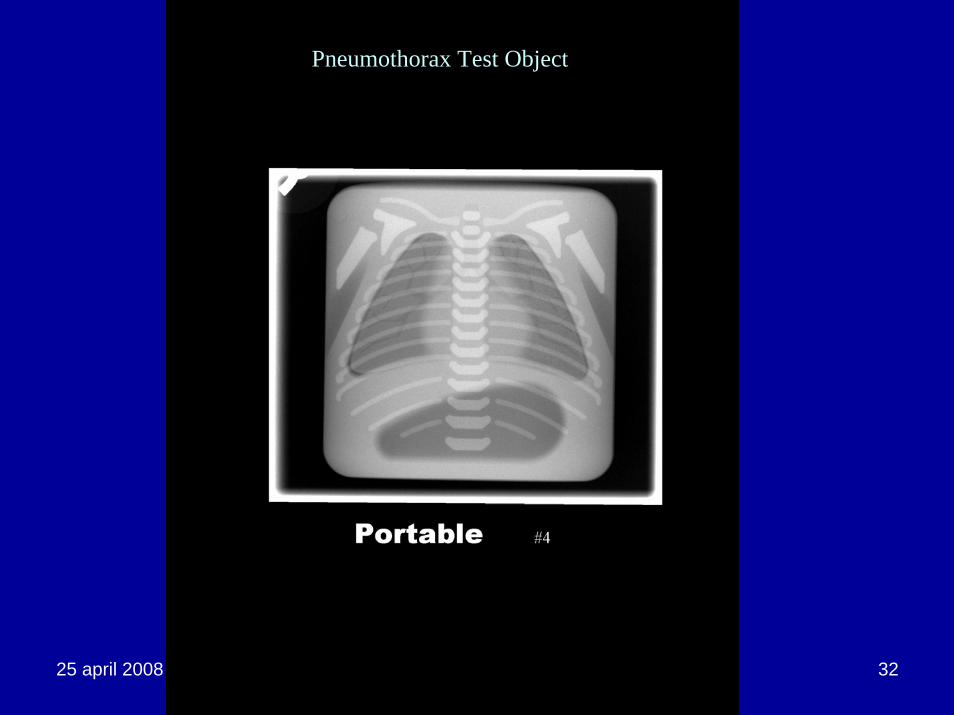
Pneumothorax
• Common problem in the NICU.• Signs are a lucent (black) area against the lung.
– Can be any size or shape, from a fine border along the edge to a balloon sized shadow.
• Often also shows a very fine opaque (white) line along the lung border.
• This is the pleural thickening line that results from the compression of the lung as the air pushes against it.
• Typical size of the line is on the order of 0.2 mm.
25 april 2008 ljrutz ncaapm 32
Pneumothorax Test Object
25 april 2008 ljrutz ncaapm 33
Hyaline Membrane Disease
• Radiologists have difficulty distinguishing between healthy and hyaline membrane disease at low exposures.– ALARA is important.– Attempts to avoid retakes for noise resulted in Dose Creep.
• Use of the HMD Lung to assess lower limit of exposure has been demonstrated.– As noise limit is approached, the HMD lung texture becomes
indistinguishable from the normal lung and muscle tissue.
25 april 2008 ljrutz ncaapm 34
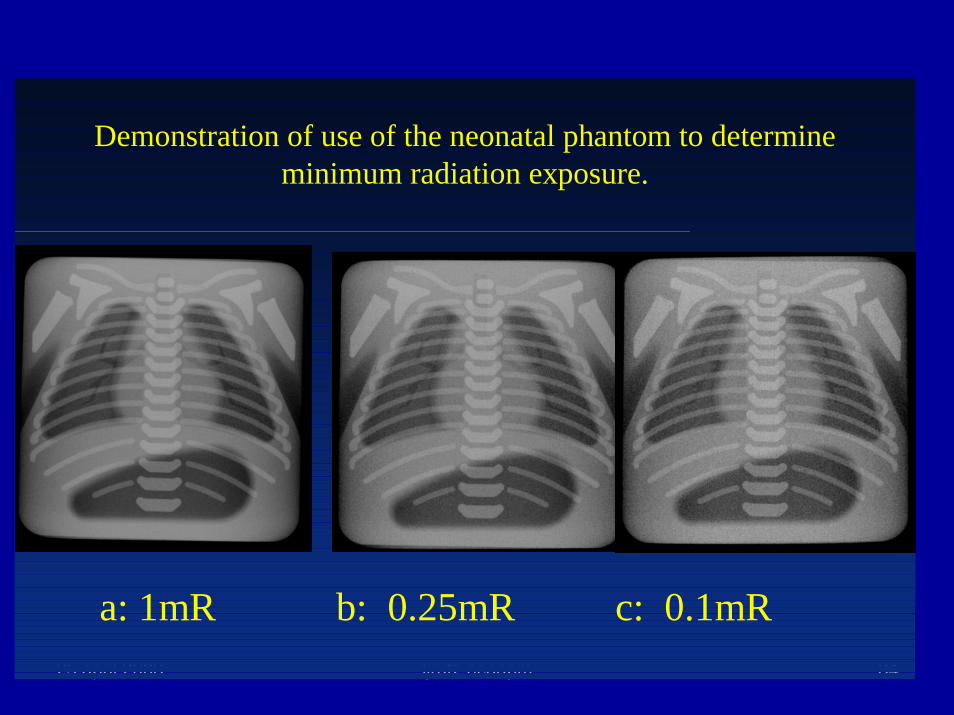
a: 1mR b: 0.25mR c: 0.1mR
Demonstration of use of the neonatal phantom to determine minimum radiation exposure.
25 april 2008 ljrutz ncaapm 35
Summary
• Simple and effective phantom for routine quality assurance of CR.– Capable of full system assessment using clinical
imaging protocols.• Anticipate other applications.
– Teaching– Acceptance Testing– Evaluation of new imaging techniques, e.g.
filtration, processing parameter selection.