a new momentum strategy based on chinese securities market
TRANSCRIPT

International Journal of Business and Management; Vol. 14, No. 12; 2019 ISSN 1833-3850 E-ISSN 1833-8119
Published by Canadian Center of Science and Education
90
A New Momentum Strategy Based on Chinese Securities Market Jin Zhang1, Yuxiu Zhang2 & Yongqi Dong1
1 School of Business Administration, South China University of Technology, Guangzhou, China 2 State Key Laboratory of Organic Geochemistry, Guangzhou Institute of Geochemistry, Chinese Academy of Sciences, Guangzhou, China Correspondence: Jin Zhang, School of Business Administration, South China University of Technology, Guangzhou, 510640, China. E-mail: [email protected]
Received: September 11, 2019 Accepted: October 24, 2019 Online Published: November 8, 2019
doi:10.5539/ijbm.v14n12p90 URL: https://doi.org/10.5539/ijbm.v14n12p90 Abstract Facing the current gaps with regard to the momentum effect in Chinese securities market, a momentum strategy was constructed to compare the securities market price under the effective market theory with under the non-effective market theory by the Hushen 300 index from 2006 to 2015 and a stock price residual measurement model. An important result was that the root cause of the momentum effect was systematic irrational behavior. On this basis, a new momentum strategy was constructed based on RSP (Residual of Stock Price), and the performance of that strategy was tested in different ranking and holding periods. The new momentum strategies were obtained positive average cumulative abnormal returns in the super short-term, short term and medium term. This finding confirmed the significant existence of the momentum effect in China’s stock market and the validity of the RSP momentum strategy. Therefore, this finding can be contributed to effectively addressed the current gaps and examine the applicability of classic asset pricing theory and behavioral finance theory in China's stock market. Finally, after considering the transaction costs, the momentum strategy is effective in both theory and practice. Keywords: Momentum strategy, Residual of Stock Price (RSP), Cumulative abnormal return, Systematic irrational behavior 1. Introduction Since Fama et al. (1970) formally put forward the efficient market hypothesis (EMH), the classical financial theory has undergone considerable development. However, based on in-depth stock market research, many scholars have found that several types of market visions exist in the security market. These findings violate the efficient market hypothesis. One of these visions is the Momentum Effect (JT Price Momentum Effect), which was proposed by Jegadeesh and Titman (1993). Subsequently, Rouwenhorst (1998), and Liew (2000) confirmed that the momentum effect exists to some extent in the European stock market and also yields a profit. Jegadeesh and Titman (2001) further pointed out that, as the market develops, the momentum effect still exists as the market vision. Rong Chen et al. (2014), Zhen Lu et al. (2007), and Linjie Zhou et al. (2002) found that a short-term momentum effect exists in the Chinese stock market. As such, the momentum strategy can lead to a significant profit. However, Bo Liu and Tianlei Pi (2007), Xin Yang and Zhanhui Chen (2004), Yonghong Wang and Xuejun Zhao (2001) and other scholars concluded that no momentum effect exists in the Chinese stock market. Therefore, these scholars argued that the use of the momentum strategy cannot bring about significant profits. In trying to find a momentum effect exists in the Chinese stock market, the scholars have been very inconsistent. This is effectively the first gap about current momentum effect research. The researchers who found that the momentum effect does exit in Chinese stock market only found evidence of a very weak momentum effect. The momentum effect in Chinese stock market is less than the momentum effect in the US stock market. For example, Zhen Lu and Hengfu Zou (2007) found that Chinese stock market can obtain a maximum of 0.44% of the average monthly excess return. Jegadeesh and Titman (2001) found that the US stock market can obtain a maximum of 1.49% of the average monthly excess return. Chinese stock market (as a typical non-effective market) (QuanJia and Zhangwu Chen, 2003) and as an emerging stock market, has many system deficiencies, making the Chinese stock market’s non-effective nature more intense, relative to Europe, the United States and other mature stock markets. Chinese stock market is clearly more non-effective than the stock market in Europe and America.
ijbm.ccsenet.org International Journal of Business and Management Vol. 14, No. 12; 2019
91
However, Chinese stock market momentum effect is also weaker than the European and American stock markets’ momentum effect. This is the second gap regarding current momentum effect research. The weak momentum effect of Chinese stock market also results in weak momentum profits, while Chi Xie et al. (2008) found that most open-end funds used a momentum investment strategy. This is the third gap regarding current momentum effect research. In order to show that a strong momentum effect exists in Chinese stock market, the only way to solve the three major gap pertaining to the study of momentum effects is to find a new, more theoretically-sound support of the momentum strategy. On this basis, the price of the securities was compared in the effective market theory with in the non-efficient market theory. The root cause of the momentum effect was systematic irrational behavior. A new stock price residual momentum strategy (RSP momentum strategy) was constructed. After deducting the transaction costs, the profitability of the new RSP momentum strategy was tested. 2. Literature Review With the help of the various momentum strategies, the existence of the momentum effect in the stock market was tested. The construction standards of any momentum strategy are the key to formatting a momentum strategy. Those construction standards directly affect the performance of the momentum strategy in the holding period. In order to test the existence of the momentum effect, Jegadeeshs and Titman (1993; 2001) used the cumulative abnormal rate of return (CAR) to construct both a "winner portfolio" and a "loser portfolio" during the ranking period. On this basis, they formed a "momentum portfolio", and then tested that portfolio’s performance during different holding periods. In subsequent research, scholars adopted the cumulative abnormal rate of return (CAR) as the basis for the construction of a momentum investment portfolio (Liew & Vassalou, 2000; Novy-Marx, 2011; Barroso & Santa-Clara, 2014). When researching the momentum effect test in the Chinese stock market, most scholars inherited the research of Jegadeesh and Titman and used the data from different time scales to test Chinese stock market momentum effect. They also constantly improved the quality of data processing. Rong Chen et al. (2014) used the JT price momentum strategy to test the momentum effect. This study used the data of the Chinese stock market from 1997 to 2010, and found that the momentum effect does exist in short-term periods. Yonghong Wang and Xuejun Zhao (2001) also used the JT price momentum strategy to test the momentum effect. This study used Chinese stock market data from 1993 to 2000. However, they concluded that the momentum effect does not actually exist in the Chinese stock market. The two primary reasons for the differences in these conclusions are the different sample selection range and the different standards applied to the construction of the momentum strategies. Some scholars realized from very early on the importance of the construction standards of momentum strategies. Many fruitful studies have been conducted. Chan et al. (1996) built an earnings momentum strategy based on the standard of unexpected earnings (SUE). Lee and Swaninathan (2000) built a trading momentum strategy based on trading volume (TV). George and Hwang (2004) constructed a new price momentum strategy. Their strategy was based on the approaching degree of reference between the current stock price and the highest price during the past 52 weeks. Although the scientific standards employed to construct these momentum strategies have been continuously enhanced, the fact remains that the theoretical foundation of the construction standards of momentum strategy is still insufficient. In fact, many of the strategies have only been developed from some sort of behavioral finance perspective. In the framework of the classical financial theory, the price of the securities was compared in the effective market theory with in the non-efficient market theory. Based on a more solid theoretical support and a more scientific standard, the momentum strategy was built. According to the efficient market hypothesis, stock prices reflect all relevant information and follow a random path. As such, the stock price does not follow any rules whatsoever. However, an effective market basically only exists in theory. In reality, the capital market is not an effective market, and that is especially true of the Chinese stock market. The discovery of the momentum effect presents a strong challenge to the efficient market hypothesis (Fama, 1998). Jegadeesh and Titman (1993) concluded that the existence of the momentum effect is actually due to the lack of investor response to information. Subsequently, Barberis et al. (1998), Daniel et al. (1998) and Hong and Stein (1999) applied the research results of psychology experiments to the cause of the momentum effect. These scholars created the famous BSV, DHS and HS models used to describe the irrational trading behavior of investors. Considering the constraints on the ability of investors to collect and process information, their trading behavior often systematically deviates from the rational standard. At the same time, investors are subject to the huge cost of arbitrage. As such, the stock price continues to deviate from the theoretical value, resulting in the inertia of the securities return. The investors’ irrational trading behavior causes

ijbm.ccsenet.org International Journal of Business and Management Vol. 14, No. 12; 2019
92
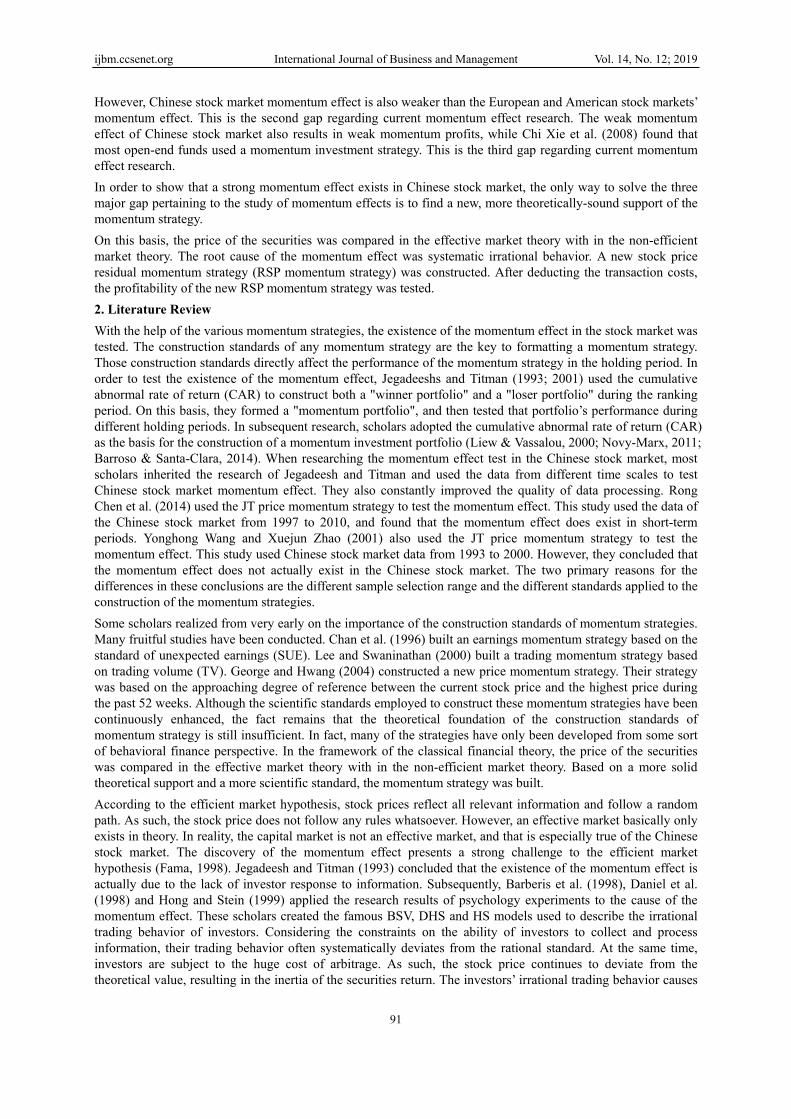
the momentum effect. The more irrational the behavior is, the more obvious the resultant momentum effect. Sharpe (1964) introduced the capital asset pricing model (CAPM). The CAPM is based on the efficient market hypothesis and rational investment. This famous model describes the stock price under the circumstances of an efficient market. Therefore, the larger the deviation from the actual price to the theoretical price based on the CAPM, the more irrational is the trading behavior and the more significant should be the momentum effect (as shown in Figure 1).
Figure 1. Logical derivation of the residual of stock price (RSP) momentum strategy stock price
Considering the above discussion, the stock price was defined as either a “winner portfolio” or a “loser portfolio”. The determination is based on the degree to which the stock price has deviated from the CAPM model. A new momentum strategy was constructed to test the performance of that strategy during different holding periods. Similar to the study of Blitz et al. (2011), this strategy can avoid the inherent JT price strategy time varying risk drawbacks, at least to a certain extent. 3. Materials and Methods 3.1. Stock Price Residual Measurement Model Based on the traditional financial framework, the degree that the original stock price deviates from the theoretical stock price (according to the CAPM) is used as the standard upon which to build a momentum strategy. The search procedure can be divided into the following four stages: First, based on the CAPM, the theoretical equilibrium stock price was confirmed. Secondly, based on the CAPM, the difference between the original stock price and the stock price, which is the stock price residual, was calculated. Thirdly, the residual in the ranking period was calculated and sorted. The "winner portfolio" and "loser portfolio" was identified. Finally, the "winner portfolio" and "loser portfolio" was practiced, and the cumulative abnormal return in the holding period was calculated to verify the existence and significance of the momentum effect. Beta (β) is the most important parameter in the CAPM model. Beta measures the systematic risk of the security. Although Wuqing Wu et al. (2008) pointed out that it is more accurate to compute beta by using a BEKK model, calculating the theoretical equilibrium price, rather than attempting to better fit the original stock price. Therefore, the classical financial theory was adopted to estimate beta as follows:
2, ,
2 2( )it mt im t
it
mt mt
cov R R σβ
σ σ= =
(Note 1)(1)
Less price More price
Herd behavior (Irrational of systematic)
Stock price is the theoretical equilibrium price (CAPM)
Prices continue to deviate from the theoretical equilibrium price, which are stock price residuals, and then the momentum effect produces.
The more systematic the irrational behavior is, the greater the stock price.
The less systematic the irrational behavior is, the smaller the stock price.
The momentum effect is weaker.The momentum effect
is more obvious.
Inefficient market (Investors are irrational)Efficient market
Continue

ijbm.ccsenet.org International Journal of Business and Management Vol. 14, No. 12; 2019
93
Here, iβ is the beta for stock i , 2
,im tσ is the covariance of stock i and market portfolio m in the t phase, and 2
,m tσ is the variance of the market portfolio in t period. After calculating the beta, the equilibrium price by CAPM in t period was calculated as follows:
, +1*
1 (i t
it
f M f
PP
r r rβ=
+ + − ) (Note 2)(2) In reality, the stock price is composed of two parts. One part is the equilibrium price in theory. The second part is the stock price residuals that are caused by the irrational exchange. The stock price residual is:
*it i iP P Pε = − .
In order to identify the irrational trading behavior in the ranking period, the cumulative residuals price (CRP) is calculated as follows:
1=
T
it itt
CRP Pε ε
=
(3) Existing studies usually regard portfolios which have the top 10% cumulative abnormal return as the “winner portfolios.” Portfolios which have the lowest 10% cumulative abnormal return are regarded as “loser portfolios”. This method is simple and easy to use, but the method does not conform to the rules of statistics. Thus, according to the statistics on the distribution rule, the cumulative RSP mean cross section in ranking period 𝑀CRP
εwas selected as the basic point, the mean cross section above one standard deviation was selected as the “winner portfolio”, and the mean cross below one standard deviation was selected as the “loser portfolio”. In other words, the stock which follows CRPit
ε≻ 𝑀CRPε+ σε
CRP is the “winner portfolio”, while the stock which follows CRPitε≺ 𝑀CRP
ε- σεCRP is the “loser portfolio”.
After identifying the “winner portfolio” and “loser portfolio” in the ranking period, the “winner portfolio” was bought and the “loser portfolio” was sold simultaneously in the holding period. Then the average cumulative abnormal return (ACAR) was calculated to verify the existence of the momentum effect. Xiaofen Tan and Yufei Lin (2012) and other scholars have shown that the profitability is significantly different in the momentum strategies in the different "ranking-holding periods". Therefore, a variety of “ranking-holding period” momentum strategies was constructed to verify the significant existence in time and the life cycle of the momentum effect. Tajaddini et al. (2015), Garleanu et al. (2013) believed that traditional academic research often ignores the impact of transaction costs on the performance of the trading strategy and the blind pursuit of profit. However, because the transaction costs of the bull and bear markets are quite different, the positive trading performance was taken into account to verify the validity of the RSP momentum strategy in practical operations. 3.2. Data Selection and Processing Methods The selection of research objects is very important to the promotion of the research conclusion. Due to its overall response to the stock market, the Hushen 300 index receives considerable attention. The constant constituent stock of the Hushen 300 index not only represents the stock market, but also reflects the historical changes in the stock market. Therefore, the constant constituent stock of the Hushen 300 index was chosen as the research object. Most companies listed on the Shanghai and Shenzhen Stock Market implemented split share structure reform in 2005. Therefore, the stocks which were permanently present in the Hushen 300 index were chosen, from January 1, 2006, to December 31, 2015. At the same time, Qiuming Gao et al. (2014), Zhanyu Zhu et al. (2003), Zhen Lu and Hengfu Zou (2007) all found the existence of a momentum effect in the Chinese stock market within four weeks of an ultra-short term. Therefore, the weekly data was used to verify the findings. The data used are from the Wind database. Excel 2010 was applied to calculate the original data for the following processing: (1) Considering the change of different stocks’ names, the stocks retained in the Hushen 300 index were selected during the period from January 1, 2006 to December 31, 2015. A total of 104 stocks were found. (2)Class ST/PT shares were excluded, including BOE A (000725), Angang Steel (000898), Eastern Airlines (600115), and Yili (600887). (3)Previous researchers basically chose periodic intervals in the “ranking-holding period” of momentum strategies (Bo Liu &, 2007; Tajaddini et al., 2015). This choice not only ignored the significant periodic interval but also strengthened the cyclical of momentum effect. In order to more carefully find the existing period of the momentum strategy, a non-periodic interval mode for the “ranking-holding period” was adopted. In this method,

ijbm.ccsenet.org International Journal of Business and Management Vol. 14, No. 12; 2019
94
J and K were selected as 1, 2, 3, 4, 6, 8, 12, 26 and 52 weeks. (4)The overlapping period method was used to build the momentum strategy. (5)After deducting the transaction costs of the different market conditions, the effectiveness of the RSP momentum strategy in practice was tested. Going through the above five steps, after processing, 101 stocks were selected as the research objects in the Hushen 300 index to build the RSP momentum strategy. 4. Results and Discussion 4.1 The Empirical Comparison between the Stock Price Residual (RSP) Momentum Strategy and the Traditional Momentum Strategy during Different “Ranking-Holding Periods” In theory, the RSP momentum strategy is more reasonable than the traditional price momentum strategy with regard to the inspection of the momentum effect. Now, real data were used to test the RSP momentum strategy in the following conditions. Because the overlapping sample was adopted to calculate the cumulative abnormal return, the t statistic was calculated by using the autoregressive consistency Newey-West standard deviation (Newey and West, 1987). The statistical results are shown in Table 1. Table 1. The statistical results of the stock price residual momentum strategy
K=1 K=2 K=3 K=4 K=6 K=8 K=12 K=26 K=52
J=1 0.00748*** 0.00799** 0.00447 0.00433 0.00847* 0.01193** 0.00466 0.00791 -0.00192 (3.488) (2.785) (1.391) (1.179) (1.991) (2.504) (0.815) (0.956) (-0.161)
J=2 0.0027 -0.00192 -0.00368 -0.00185 0.00615 0.00225 0.00306 0.00702 0.00578 (1.335) (-0.268) (-1.220) (-0.515) (1.46) (0.479) (0.569) (0.861) (0.502)
J=3 -0.0008 -0.00212 -0.00288 0.00272 0.01005** 0.003308 0.00419 0.00585 0.00138 (-0.375) (-0.738) (-0.888) (0.765) (2.371) (0.712) (0.775) (0.729) (0.120)
J=4 0.00198 0.00176 0.00629 0.01144*** 0.01277*** 0.00889 0.01052 0.0068 0.00816 (0.906) (0.633) (1.856) (2.979) (2.872) (1.830) (1.727) (0.800) (0.690)
J=6 0.00375 0.00547 0.00693* 0.00958** 0.01422*** 0.01687*** 0.02155*** 0.01729 0.01325 (1.794) (1.955) (2.034) (2.527) (3.156) (3.585) (3.908) (1.947) (1.108)
J=8 0.00254 0.00038 0.00077 0.00505 0.00939* 0.01309** 0.01457* 0.0115 0.01041 (1.189) (0.132) (0.236) (1.334) (2.145) (2.634) (2.600) (1.154) (0.793)
J=12 0.00063 0.00446 0.00779* 0.01193** 0.01943*** 0.0211*** 0.01991*** 0.02472* 0.00762 (0.269) (1.431) (2.148) (2.761) (3.865) (3.714) (2.990) (2.384) (0.521)
J=26 0.00102 0.00172 0.00144 0.0022 0.00296 0.00214 -0.00033 0.00753 0.01444 (0.486) (0.597) (0.416) (0.550) (0.632) (0.412) (-0.052) (0.732) (0.935)
J=52 0.0029 0.00487 0.0068 0.0096 0.01264* 0.01539** 0.02592*** 0.04476*** 0.07079*** (1.229) (1.346) (1.559) (1.878) (2.164) (2.411) (3.183) (3.295) (3.407)
Note. The t-test is for two tailed rest; * indicates that the coefficient is significant in ɑ=0.1; ** indicates the coefficient is significant in ɑ=0.05; *** indicates the coefficient is significant in ɑ=0.01. Other tables are similar.
In table 1, the momentum strategy based on RSP obtains significant positive average cumulative abnormal return in the ultra-short term and in the medium term. The short-term strategy focuses on a testing time interval of one month (ultra-short term), three months (short term), half-year (short mid-term) and one year (interim). 73 of the 81 time interval portfolios obtained a positive cumulative average abnormal return. In addition, 26 time interval portfolios were able to obtain a significant positive cumulative average abnormal return, not one portfolio obtained a significant negative cumulative average abnormal return. When both the ranking period and the holding period is one week, significantly, the portfolios can obtain a 0.74% average cumulative abnormal return with a significant momentum effect. In addition, the cumulative abnormal return significantly decreases when the holding period increases. This finding also shows that the effect of the ranking period on the holding period decreases as time goes on. There is even a slight reversal of 52 weeks in the holding period. When the ranking period is two or three weeks and the holding period is less than four weeks, there will be an insignificant statistical reversal. In addition, and almost of the negative average cumulative abnormal returns are within this range of time interval portfolios. When both the ranking and holding period are from one to three months, there will be a statistically significant positive average cumulative abnormal return in most portfolios. At the same time, the momentum effect is also very significant. Specifically, when the ranking period is six weeks (1.5

ijbm.ccsen
months) omost signHowever52 weeksaverage csignifican
Figur
Note. “6-4 Tare similar.
After theaverage cand mediperiod arsignificanIn order twith the e
net.org
or 12 weeks (tnificant. Wher, the average cs and the holdicumulative abnt average cum
re 2. The aver
Time interval com
e empirical tecumulative abium-term. Thre both mediunt momentum to further studexisting mome
Int
three months)en the rankingcumulative abing period is m
bnormal returnmulative abno
rage cumulativ
mbination” repres
est, it was founormal return
he momentumum-term (e.geffect or reve
dy the effectiventum strategy
ternational Jour
) and the holdig period is 26bnormal returnmore than foun. In particularormal return w
ve abnormal rm
sents that the mom
und that thens when both t
m effect exists. as shown inersal exists. veness of they was compar
rnal of Business
95
ing period is f6 weeks (sixns are positive
ur weeks,mosr, when the ra
will be 7.08%.
return of the timomentum effe
mentum of a rank
stock price mthe ranking ans and is signin Figure 2).
strategy, thered. The test r
s and Managem
from four to 1months), no
e in the holdinst of the portfoanking and ho
ime interval poect king period is six
momentum strnd holding peificant, especiWhen the ra
momentum stesults are sho
ment
2 weeks, the msignificant m
ng period. Wheolios can obta
olding periods
ortfolios of m
weeks and a hold
rategy obtainriods are ultraially when th
anking period
trategy based wn in Table 2
Vol. 14, N
momentum efmomentum effhen the rankingain a significans are both 52 w
most significan
ding period is 4 w
ns significantlya-short term, she ranking an is short mid
on stock pric2.
No. 12; 2019
ffect is the fect exists. g period is nt positive weeks, the
nt RSP
weeks; others
y positive short-term
nd holding d-term, no
ce residual
ijbm.ccsenet.org International Journal of Business and Management Vol. 14, No. 12; 2019
96
Table 2. Statistical test results of the JT price momentum strategy
K=1 K=2 K=3 K=4 K=6 K=8 K=12 K=26 K=52
J=1 0.00015 0.00206 0.00032 -0.00391 -0.01038*** -0.00523 -0.00591 -0.01576** -0.00889 (0.096) (1.02) (0.136) (-1.411) (-3.106) (-1.464) (-1.372) (-2.491) (-1.008)
J=2 0.00015 0.00206 0.00032 -0.00391 -0.01038*** -0.00523 -0.00591 -0.01655** -0.00728 (0.096) (1.02) (0.136) (-1.411) (-3.106) (-1.464) (-1.372) (-2.493) (-0.768)
J=3 0.00166 -0.00173 -0.00694** -0.01150*** -0.01020** -0.00675 -0.00998* -0.02299*** -0.01675 (1.027) (-0.765) (-2.430) (-3.315) (-2.689) (-1.671) (-2.048) (-3.450) (-1.804)
J=4 -0.00181 -0.00551** -0.01105*** -0.01445*** -0.01073** -0.00822** -0.01277*** -0.02129 -0.01113 (-1.076) (-2.324) (-3.620) (-4.093) (-2.718) (-1.938) (-2.572) (-3.135) (-1.187)
J=6 -0.00316 -0.00570** -0.00813*** -0.00894** -0.00763* -0.00624 -0.00918 -0.02052*** -0.01414 (-1.699) (-2.313) (-2.805) (-2.697) (-1.982) (-1.476) (-1.855) (-3.020) (-1.422)
J=8 -0.00164 -0.00264 -0.00693* -0.00800** -0.008 -0.00794 -0.01066* -0.02450*** -0.01987 (-0.903) (-1.053) (-2.219) (-2.331) (-1.956) (-1.754) (-2.059) (-3.379) (-1.876)
J=12 -0.0017 -0.00366 -0.00682** -0.00811** -0.00734 -0.0064 -0.01101* -0.02262*** -0.02131 (-0.880) (-1.364) (-2.087) (-2.188) (-1.702) (-1.330) (-1.986) (-2.875) (-1.844)
J=26 -0.00323 -0.00552* -0.00904** -0.01141*** -0.01454*** -0.01624*** -0.02230*** -0.03263*** -0.04912***
(-1.644) (-2.048) (-2.788) (-3.104) (-3.308) (-3.406) (-3.955) (-3.875) (-3.880)
J=52 -0.00287 -0.00547* -0.00823** -0.01101*** -0.01438*** -0.01770*** -0.02811*** -0.04580*** -0.06141***
(-1.533) (-2.075) (-2.644) (-3.087) (-3.357) (-3.714) (-4.742) (-5.225) (-4.652) In Table 2, the JT price momentum strategy only obtains a slight but insignificant positive cumulative abnormal return in the short term. Also, in the short mid-term, mid-term and interim, the JT strategy can only obtain negative cumulative abnormal returns. In other words, the application of the JT price momentum strategy cannot in aggregate win in the market. This finding is consistent with the conclusions of Yonghong Wang (2001), Linjie Zhou and Hengfu Zou (2007), Bo Liu and Tianlei Pi (2007) et al. The performance of the JT price momentum strategy is not strong in the Chinese stock market. However, this does not indicate that momentum strategies are inv and alid or that the momentum effect disappears in the Chinese stock market. Compared with developed countries such as the United States, China is not a mature capital market. An irrational performance should be expected and more obvious. Therefore, the possibility of momentum strategy profits should be higher, and the momentum effect should be stronger (in the Chinese stock market). Jegadeesh(1990), Grinblatteta et al.(1995) found that, although academia pays more attention to the reversal strategy, in practice, the investors still apply the momentum strategy as their main investment strategy. Therefore, a momentum strategy that can achieve significant strong benefits in the Chinese stock market is more important. The RSP was regard as a measure of the systematic irrational behavior upon which to build the RSP momentum strategy. Through empirical testing, the strategy can achieve significant positive cumulative abnormal returns was proved. The findings thus confirmed that the significant strong momentum effect does in fact exist in the Chinese stock market. Also, through the comparison of empirical results, the performance of the RSP momentum strategy is indeed better than the JT price momentum strategy in the Chinese stock market. Due to space limitations, this strategy was not compared with the other three momentum strategies. However, according to previous studies, the superiority of the strategies can be confirmed. Shinong Wu and Chaopeng Wu (2003) found that the application of the earning momentum strategy can obtain the highest income rate of 0.685% per month in the Shanghai Stock Market. Xiao Jun and Weizhong Chen (2006) researched the volume momentum strategy in the Chinese stock market and found that the volume momentum strategy can obtain the highest income rate of 1.16% per month. Mingtao Wang and Dan Li (2015) tested the 52-week momentum strategy in the Chinese stock market and found that this strategy can obtain the highest income rate of 1.1% per month. The profitability of each of these three strategies is in fact lower than the RSP momentum strategy that was constructed. Therefore, the RSP momentum strategy is better than the earnings momentum strategy, volume momentum strategy and 52-week highest momentum strategy in the condition of the cumulative abnormal return. The meaning of this finding is the RSP momentum strategy may bring more benefits to investors. 4.2 The Performance of the RSP Momentum Strategy in Different Market Statuses Different market statuses are directly related to the performance of the momentum strategy and to the momentum effect. Cooper et al. (2004) pointed out that the market is closely related to the momentum effect. When the market is rising, the momentum strategy gains are significant. Conversely, when the market goes down, the
ijbm.ccsenet.org International Journal of Business and Management Vol. 14, No. 12; 2019
97
momentum strategy gains are insignificant. Therefore, the performance of the RSP momentum strategy under conditions of different market statuses was compared. These comparisons not only make the relevance of the momentum effect and the market status more explicit, but they also test the robustness of the RSP momentum strategy, which in turn can provide fund companies and other institutions with a new investment strategy. The theoretical studies on the state of the stock market differ to a significant extent. The most influential proposal in the beginning was the BB method created by Bry and Boschan(1971). Paga and Sossounov(2003) later modified the BB method to make it more scientific. Wu Xu et al. (2014) used the BB method to divide the stock market into the bull, bear and shock markets. From Table 3, the most obvious momentum effect appears in the short term (four to 12 weeks) and interim (52 weeks). In order to make a more concise and clear description of the problem, only the RSP momentum strategy in different market states from four to 12 weeks was compared. The results are shown in Table 3. Table 3.The statistical results of the RSP momentum strategy in Different market states
Market State K=4 K=6 K=8 K=12 Bull market J=4
0.00741 (0.818)
0.00320 (0.289)
-0.00207 (-0.144)
0.02274 (1.187)
J=6 0.00230 (0.248)
0.00619 (0.484)
0.03095* (2.064) 0.05791** (2.860)
J=8 0.00467 (0.446)
0.02037 (1.477)
0.04150 (2.233)
0.07582** (3.558)
J=12 0.04225*** (3.301)
0.05631*** (3.534)
0.07865*** (4.413)
0.10347*** (5.177)
Bear market J=4
0.02238 (1.657)
0.01638 (0.946)
-0.00079 (-0.043)
0.01033 (0.450)
J=6 0.01089 (0.793)
0.00047 (0.028)
-0.00204 (-0.107)
0.02418 (1.127)
J=8 -0.01496 (-1.140)
-0.02355 (-1.339)
-0.02634 (-1.322)
-0.00787 (-0.341)
J=12 -0.01927 (-1.180)
-0.00889 (-0.466)
-0.01292 (-0.576)
-0.02679 (-0.812)
Shock market J=4
0.00681 (1.680)
0.00680 (1.344)
0.00643 (1.194)
0.00419 (0.687)
J=6 0.00355 (0.855)
0.00509 (1.073)
0.00574 (1.164)
0.00258 (0.448)
J=8 0.00178 (0.412)
0.00120 (0.258)
0.00026 (0.055)
-0.00319 (-0.563)
J=12 -0.00355 (-0.902)
-0.00413 (-0.869)
-0.00291 (-0.546)
-0.00935 (-1.543)
In Table 3, the performance of the RSP momentum strategy is closely related to the state of the stock market. The RSP momentum strategy can obtain significantly positive cumulative average abnormal returns in a bull market. In addition, the momentum effect is more significant. On the contrary, this strategy obtains insignificantly negative average cumulative abnormal returns in a bear market, but the reversal effect under the circumstances was still observe. This strategy may obtain positive or negative average cumulative abnormal returns in a “shock” market, but the positive appears more frequently. This finding indicates that the momentum effect is relatively weak in a shock market. In the four to 12-week time interval, nearly 40% of the time intervals obtain positive cumulative abnormal returns, even in bear markets. These extremely high returns are difficult to achieve in the study of the existing momentum strategy. The results also show that proposed strategy has some robustness. In Table 3, when the ranking period is 12 weeks and the holding period is from four to 12 weeks, the performance of the RSP momentum strategy is most inconsistent between bull market and bear markets. The momentum effect is more obvious in a bull market, while the reversal effect is more obvious in a bear market. Therefore,

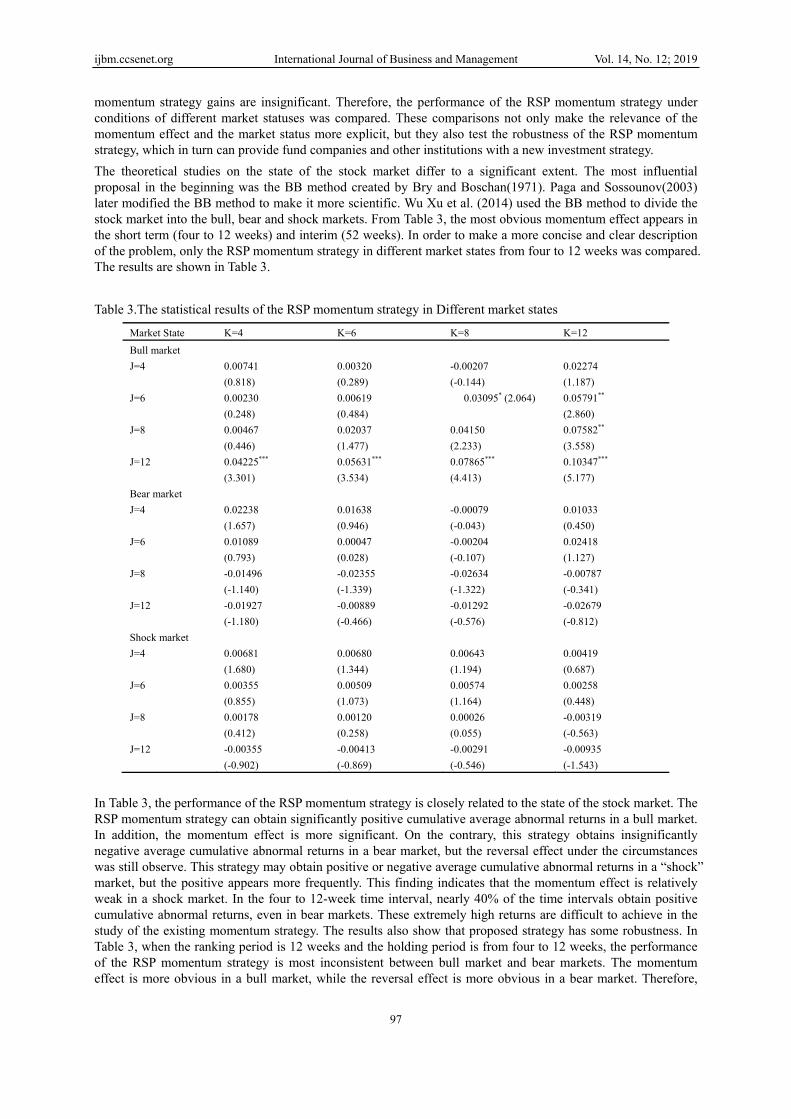
ijbm.ccsen
taking themomentuof these tin a bull m
Note. “12-4similar.
4.3 The PMomentuthe studiconstructcost shouillustrate costs), onthe main momentuand 0.3%the sellincalculatedwas deducalculatedcommissistrategy bbe calcula
IA
net.org
e ranking perium strategy botwo markets (market and is
Figure 3. Th4 Time interval co
Profitability ofum strategies ies conductedted was operatuld be verified
the problem nly the explicicomponents o
um was deduc% transaction cng of short std, 1.3% trans
ucted when seld, 3.2% tranion was deducby using the foated:
STAAC RA =
Int
iod of 12 weekoth in bull and(Fig. 3). As shbelow zero in
he performancombination” repr
f the RSP Momare usually ac
d up till nowtional in prac
d. Therefore thsimply (and cit transaction of explicit trancted. Generallycommission wtocks. Therefosaction commilling stocks in
nsaction comcted when sel
following form
inSACAR W−
ternational Jour
ks as an examd bear marketshown in Fig. 3n a bear marke
e of stock pricresents the mome
mentum Strateccompanied by
w have neglectice, the returhe transactionconsidering thcosts were consaction costsy speaking, in
when trading sore, when theission was den the holding pmission waslling stocks inmula, the avera
1.3‰ncrease ×
rnal of Business
98
mple, the averas was drawn, i3, the rate of aet.
ce residual moentum of a rankin
egy after Deduy transactioncted this probrn using the mn costs into imhat investors gonsidered. Becs, the stamp dun the Chinesestock. In addite cumulativeeducted whenperiod. When
deducted wn the holding page cumulativ
1.3‰ outWN
×−
s and Managem
age cumulativin order to shoaverage cumu
omentum in thng period is 12 w
ucting Transaccosts in actuablem. To con
momentum strmplicit and expgenerally onlycause stamp duty and transae stock markettion, they shouabnormal retbuying stock
n the abnormalwhen buyingperiod. Specifve abnormal re
3‰ increaseL−
ment
e abnormal reow the differeulative abnorm
he state of bulweeks, and a hold
ction Costs al implementanfirm the RSategy after deplicit types w
y pay attentionduty and transaction commist, investors muld pay 0.19%urn of each “
ks and 1.3% tl return of eacstocks and
fically, based eturn in the m
3.2‰ ouL× −
Vol. 14, N
eturns based oences in the prmal return is a
ll and bear mading period is 4 w
ation. HoweveSP momentumeducting the t
were divided. In to explicit traction commi
ssion in each smust pay 1% s% of the week“winner portftransaction coch “loser portfalso 1.3% tron the RSP m
momentum por
1.3‰out ×
No. 12; 2019
on the RSP rofitability above zero
arkets weeks; others
er, most of m strategy ransaction In order to ransaction issions are stock price tamp duty ly yield in folio” was ommission folio” was ransaction
momentum rtfolio can
(4)
ijbm.ccsenet.org International Journal of Business and Management Vol. 14, No. 12; 2019
99
Table 4. The statistical test results of the RSP momentum strategy after deducting transaction costs
K=1 K=2 K=3 K=4 K=6 K=8 K=12 K=26 K=52
J=1 0.00072 0.00105 -0.00221 -0.00186 0.00228 0.00643 -0.00108 0.00097 -0.00695
(0.375) (0.395) (-0.741) (-0.537) (0.553) (1.398) (-0.196) (0.122) (-0.604)
J=2 -0.00409* -0.00689*** -0.00912*** -0.00765** 0.00077 -0.00252 -0.00223 0.00091 0.00082
(-2.141) (-2.762) (-3.174) (-2.223) (0.191) (-0.561) (-0.436) (0.116) (0.074)
J=3 -0.00648*** -0.00690** -0.00792** -0.00222 0.00414 -0.00154 -0.0018 0.00004 -0.00362
(-3.421) (-2.606) (-2.629) (-0.677) (1.023) (-0.348) (-0.350) (0.005) (-0.331)
J=4 -0.0035 -0.00327 0.00138 0.00631 0.00665 0.00249 0.00343 0.00139 0.00255
(-1.776) (-1.278) (0.436) (1.753) (1.563) (0.537) (0.581) (0.172) (0.225)
J=6 -0.00321 -0.00109 0.00063 0.00268 0.00663 0.00886* 0.01414** 0.01287 0.00961
(-1.600) (-0.402) (0.190) (0.733) (1.541) (1.983) (2.663) (1.506) (0.828)
J=8 -0.00437* -0.00654* -0.00694* -0.00332 -0.00016 0.00308 0.00729 0.00519 0.00497
(-2.138) (-2.363) (-2.214) (-0.924) (-0.037) (0.651) (1.347) (0.534) (0.389)
J=12 -0.00601** -0.00308 -0.00037 0.00368 0.00936 0.01224** 0.01112 0.01277 0.0004
(-2.678) (-1.024) (-0.106) (0.895) (1.939) (2.246) (1.733) (1.263) (0.028)
J=26 -0.00602*** -0.00601* -0.00694* -0.00706 -0.00733 -0.00862 -0.01203 -0.00514 0.00085
(-2.943) (-2.138) (-2.062) (-1.815) (-1.615) (-1.723) (-1.949) (-0.513) (0.056)
J=52 -0.00408 -0.00254 -0.00056 0.00161 0.00326 0.00564 0.01678* 0.03799*** 0.06470***
(-1.765) (-0.713) (-0.129) (0.318) (0.566) (0.898) (2.086) (2.833) (3.123)
In table 4, although most time interval combinations cannot obtain the significant positive average cumulative abnormal returns after deducting the transaction costs (most of the time), there are still five time interval combinations which can obtain significant positive cumulative abnormal returns. Specifically, the weekly cumulative excess yields were as high as 6.47% using the 52-52 combination. This finding also further confirmed the validity of the RSP momentum strategy which was constructed. Compared with existing studies of momentum strategies, such a result is rare. Because Chinese stock market is a non-effective market, the RSP momentum strategy may bring less potential market risks and more benefits to investors. 5. Conclusions Facing the three major gap of current momentum effect research (the gap regarding the existence of the momentum effect in the Chinese stock market, the contradiction between the weak momentum effect and the ineffectiveness of the Chinese stock market, and the conflict of the weak momentum effect and momentum investment behavior), a new momentum strategy based on CAPM with the Chinese Hushen 300 index from 2006 to 2015 was found to support the existence of a strong momentum effect is the key to resolving the current conflict. To this end, starting from the perspective of the classical financial framework, and comparing the market price of securities under effective market conditions with the market price of securities under non-effective market conditions, the root cause of the momentum effect was drawn out in this paper, namely systematic irrational behavior. On this basis, a new RSP momentum strategy was constructed. The strategy is based on stock price residuals (RSP). In addition, the performance of the strategy was tested under different order-holding periods. This study found: At the time of ultra-short-term/short-term and medium-term, the momentum strategy of RSP can obtain significantly positive cumulative abnormal returns, thus confirming the existence of a strong momentum effect in the Chinese stock market and the new strategy is better than the earnings momentum strategy, volume momentum strategy and 52-week highest momentum strategy. Therefore, the RSP momentum strategy is valid. This study contributes to address the gaps of current momentum effect research and examine the applicability of classic asset pricing theory and behavioral finance theory in China's stock market. Finally, after considering transaction costs, the momentum strategies of RSP in practice are feasible. However, some shortages exist in this study. The Chinese stock market started too late to form a sufficient amount of longitudinal data. Therefore, the RSP momentum strategy has not yet been verified in terms of long-term profits performance. At the same time, the transaction costs were simplified, and the influence of implicit transaction costs on the RSP momentum strategy was ignored. Both of these shortcomings provide
ijbm.ccsenet.org International Journal of Business and Management Vol. 14, No. 12; 2019
100
direction for further research. References Barberis, N., Shleifer, A., & Vishny, R. (1998). A model of investor sentiment. Journal of Financial Economics,
49, 307-343. https://doi.org/10.1515/9781400829125-015 Barroso, P., & Santa-Clara, P. (2015). Momentum has its moments. Journal of Financial Economics, 116(1),
111-120. https://doi.org/10.1016/j.jfineco.2014.11.010 Blitz, D., Huij, J., & Martens, M. (2011). Residual momentum. Journal of Empirical Finance, 18(3), 506-521.
https://doi.org/10.2139/ssrn.2319861 Bo, L., & Pi, T. L. (2007). Momentum and contrarian strategies: the new evidence from the stock market in
Shanghai and Shenzhen in China. Journal of Financial Research, (8), 154-166. Bry, G., & Boschan, C. (1971). Cyclical Analysis of Time Series: Selected Procedures and Computer Programs.
The National Bureau of Economic Research, the United States. Chan, L. K. C., Jegadeesh, N., & Lakonishok, J. (1996). Momentum strategies. The Journal of Finance, 51(5),
1681-1713. https://doi.org/10.2307/2329534 Chen, R., Chen, H. H., & Zheng, Z. L. (2014). Behavioral finance interpretation of momentum effect. Systems
Engineering-Theory and Practice, 34(3), 613-622. https://doi.org/10.12011 /1000-6788 (2014)3-613 Chi, X., Zhang, T. Y., & Yu, X. (2008). A study on open-end fund managers’ momentum trading behavior.
Chinese Journal of Management Science, 16(1), 32-41. https://doi.org/10.16381/j.cnki.issn1003-207x Cooper, M. J., Gutierrez, R. C., & Hameed, A. (2004). Market States and Momentum. Journal of Finance, 59(3),
1345-1365. https://doi.org/10.2307/1913610 Daniel, K., Hirshleifer, D., & Subrahmanyam, A. (1998). Investor psychology and security market under- and
overreactions. The Journal of Finance, 53(6), 1839-1886. https://doi.org/10.1111/0022-1082.00077 Fama, E. F. (1998). Market efficiency, long-term returns and behavioral finance. Journal of Financial
Economics, 49, 283-306. https://doi.org/10.1016/S0304-405X(98)00026-9 Gao, Q. M., Hu, H. C., & Yan, X. (2014). On Characteristics and Formation Mechanisms of Momentum Effect
in China's A-share Market. Journal of Finance and Economics, 40(2), 97-107. https://doi.org/10.16538/j.cnki.jfe.2014.02.007
Garleanu, N., & Pedersen, L. H. (2013). Dynamic trading with predictable returns and transaction costs. The Journal of Finance, 68(6), 2309-2340. https://doi.org/10.1111/jofi.12080
George, T. J., & Hwang, C. Y. (2004). The 52-week high and momentum investing. The Journal of Finance, 59(5), 2145-2167. https://doi.org/10.1111/j.1540-6261.2004.00695.x
Grinblatt, M., Titman, S., & Wermers, R. (1995). Momentum Investment Strategies, Portfolio Performance, and Herding: A Study of Mutual Fund Behavior. The American Economic Review, 85(5), 1088-1105.
Hong, H., & Stein, J. C. (1999). A unified theory of under reaction, momentum trading, and overreaction in asset markets. The Journal of Finance, 54(6), 2143-2184. https://doi.org/10.1111/0022-1082.00184
Jegadeesh, N. (1990). Evidence of Predictable Behavior in Security Returns. The Journal of Finance, 45(3), 881-898. https://doi.org/10.1111/j.1540-6261.1990.tb05110.x
Jegadeesh, N., & Titman, S. (1993). Returns to buying winners and selling losers: implications for stock market efficiency. The Journal of Finance, 48(1), 65-90. https://doi.org/10.2307/2328882
Jegadeesh, N., & Titman, S. (2001). Profitability of momentum strategies: an evaluation of alternative explanations. The Journal of Finance, 56(2), 699-720. https://doi.org/10.2139/ssrn.166840
Jia, Q., Chen, Z. W. (2003). An empirical analysis of efficiency in China stock market. Journal of Financial Research, (7), 86-92.
Jun, X., Chen, W. Z., & Wang, Y. X. (2006). Volume-Based Price Momentum Strategies in China Stock Marke. Journal of Tongji University (NATURAL SCIENCE EDITION), 34(8), 1126-1130. https://doi.org/10.3321/j.issn:0253-374X.2006.08.028
Lee, C. M. C., & Swaminathan, B. (2000). Price momentum and trading volume. The Journal of Finance, 55(5), 2017-2069. https://doi.org/10.1111/0022-1082.00280

ijbm.ccsenet.org International Journal of Business and Management Vol. 14, No. 12; 2019
101
Liew, J., & Vassalou, M. (2000). Can book-to- market, size and momentum be risk factors that predict economic growth? Journal of Financial Economics, 57(2), 221-245. https://doi.org/10.1016 / S030-405X (00)00056-8
Lu, Z., & Zou, H. F. (2007). Momentum and reversal in China stock market. Economic Research, (9), 145-155. Malkiel, B. G., & Fama, E. F. (1970). Efficient Capital Markets: A Review of Theory and Empirical Work.
Journal of Finance, 25(2), 383-417. https://doi.org/10.1111/j.1540-6261.1970.tb00518.x Newey, W. K., & West, K. D. (1987). A Simple, Positive Semi-Definite, Heteroskedasticity and Autocorrelation
Consistent Covariance Matrix. Econometrica, 55(3), 703-708. https://doi.org/10.2307/1913610 Novy-Marx, R. (2015). Is momentum really momentum? Journal of Financial Economics, 103(3), 429-453.
https://doi.org/10.1016/j.jfineco.2011.05.003 Pagan A, R., & Sossounov, K. A. (2003). A Simple Framework for Analyzing Bull and Bear Markets. Journal of
Applied Econometrics, 18(1), 23-46. https://doi.org/10.1002/jae.664 Rouwenhorst, K. G. (1998). International momentum strategies. The Journal of Finance, 53(1), 267-284.
https://doi.org/10.2139/ssrn.4407 Sharpe, W. F. (1964). Capital Asset Prices: A theory of market equilibrium under conditions of risk. The Journal
of Finance, 19(3), 425-442. https://doi.org/10.1111/j.1540-6261.1964.tb02865.x Tajaddini, R., Crack, T. F., & Roberts, H. (2015). Price and earnings momentum, transaction costs, and an
innovative practitioner technique. International Review of Finance, 15(4), 555-597. https://doi.org/10.1111/irfi. 12065
Tan, X. F., & Lin, Y. F. (2012). Momentum and Reversal Effects in China's A-Share Market: Empirical Evidence and Theoretical Interpretation. Financial Review, (1), 93-102.
Wang, M. T., & Li, D. (2015). The Momentum Strategy and its Effectiveness in A-share Market Empirical Study Based upon Highest Price of Previous 52 Trading Weeks. Securities Market Herald, (7), 64-71.
Wang, Y. H., Zhao, X. J. (2001). An empirical analysis of "momentum strategy" and "inversion Strategy" in Chinese stock market. Economic Research, (6), 56-61.
Wu, S. N., & Wu, C. P. (2003). An empirical study on "price inertia strategy" and "surplus inertia strategy" in Chinese stock market. Economic Science, (4), 41-50. https://doi.org/10.19523 /j.jjkx. 2003.04.005
Wu, W. Q., Chen, M., & Liu, W. (2008). The statistical characteristics of the time-varying betas and the applications to the stock index futures in China stock market. Systems engineering theory and Practice, (10), 14-23. https://doi.org/10.3321/j.issn:1000-6788.2008.10.002
Wu, X., Song, G. H., & Xu, L. (2014). Study on the relationship among feedback trading, fund performance and Market Volatility: Based on the perspective of the securities market stability. Investment Research, (11), 111-122.
Yang, X., & Chen, Z. H. (2004). Empirical studies of momentum and contrarian strategies in the Chinese stock market. Journal of Tsinghua University (Science and Technology), 44(6), 758-761. https://doi.org/ 10.16511 /j.cnki.qhdxxb.2004.06.011
Zhou, L. J. (2002). Study on the profitability of momentum strategy in China's Stock Market. World Economy, (8), 60-64.
Zhu, Z. Y., Wu, C. F., & Wang, C. W. (2003). Profit of Chinese stock market price momentum under different inspection cycle. World Economy, (8), 62-67.
Notes Note 1. This formula is the transformation of the CAPM model. We can refer to the book of “Investment Science” authored by David G. Luenberger. Note 2. , +1i tP
is the 1t + week's daily closing price numerical average, fr is the three-month treasury bill rate.
Copyrights Copyright for this article is retained by the author(s), with first publication rights granted to the journal. This is an open-access article distributed under the terms and conditions of the Creative Commons Attribution license (http://creativecommons.org/licenses/by/4.0/).