a new nondominated sorting genetic algorithm...
TRANSCRIPT
A new nondominated sorting genetic algorithm based to the regression line
For fuzzy traffic signal optimization problem
H. Asadi a, , R.Tavakkoli Moghaddam b
,N. Shahsavari Pour c, E. Najafi *d
a,d, Department of Industrial Engineering, Science and Research Branch, Islamic Azad University, Tehran, Iran
b, School of Industrial Engineering, College of Engineering, University of Tehran, Tehran, Iran
c, Department of Industrial Technology and Management, Vali-e-Asr University Of Rafsanjan Iran
*Corresponding author. E-mail: [email protected]
Abstract Traffic jam is a daily problem in nearly all major cities in the world and continues to increase with
population and economic growth of urban areas. Traffic lights, as one of the key components at intersections, play
an important role in control of traffic flow. Hence, study and research on phase synchronization and time optimi-
zation of the traffic lights could be an important step to avoid creating congestion and rejection queues in a urban
network. Here, we describe the application of NSGA-II, a multi-objective evolutionary algorithm, to optimize
both vehicle and pedestrian delays in an individual intersection. Results show that parameters found by improved
NSGA-II can be superior to those defined by a traffic engineer with respect to several objectives, including total
queue length of vehicles and pedestrians.
In this paper, we improve NSGA-II algorithm based to the regression line to find a Pareto-optimal solution or a
restrictive set of Pareto-optimal solutions based on our solution approaches to the problem, named PDNSGA
(Non-dominated Sorting Genetic Algorithm based on Perpendicular Distance). In this paper, our purpose is to
present a solution methodology to obtain all Pareto-optimal solutions to optimize traffic signal timing and enable
the decision-makers to evaluate a greater number of alternative solutions. The proposed algorithm has the capabil-
ity of searching Pareto front of the multi-objective problem domain. Further jobs should be concerned on the sig-
nal timing optimization method for the oversaturated coordinated intersections or small-scale road network and
real-field applications with the traffic signal controller. The high speed of the proposed algorithm and its quick
convergence makes it desirable for large scheduling with a large number of phases. Furthermore, we have used the
mean deviation from the ideal point (MDI) measure to compare the performance of the MOGA, PDNSGA,
NSGA-II, and WBGA by the ANOVA method. It is demonstrated that the our proposed algorithm (PDNSGA)
gives better outputs than those of MOGA, NSGA-II, and WBGA in traffic signal optimization problem, statistical-
ly .
Keyword: traffic signal systems; genetic algorithm; vehicle and pedestrian delays; ANOVA.
1. Introduction
Traffic congestion is a daily problem in nearly all major cities in the world and continues to
increase with population and economic growth of urban areas. The increasing traffic demand
strains the existing transportation system, especially when the network is oversaturated during
peak hours. Oversaturation occurs when the queues of vehicles on a receiving street interfere
with the performance of the respective adjacent upstream streets, and though these conditions
may last for only a short time, the time to clear the network may be significant. Costs of infra-
structure renewal and expansion may be cost-prohibitive, and under limited budgets, viable
strategies are needed that enhance the mobility and efficiency of the existing traffic without
investing in new infrastructure.
There are two objectives for this research. We develop an effective procedure to optimize sig-
nal timing of an individual intersection by minimizing both vehicle and pedestrian delays.
Traffic signals aim generally to minimize average vehicle delay, but pedestrian delay is not
taken into account. Such a strategy is reasonable for rural areas or highways where very few
pedestrians interfere with vehicular traffic. However, in a central business district with a lot of
pedestrians walking around, the strategy that only optimizes vehicle flows would not be suita-
ble, because the pedestrian delay is ignored. Ignoring
pedestrian delay might even result in people choosing to use vehicles more frequently than
walking. Therefore, when pedestrian flows start to have influence on vehicle flows, pedestrian
signal plans should be optimized considering delays for both groups. Traffic signal plan opti-
mization should be a trade-off between vehicle and pedestrian delays by minimizing travel de-
lay for all the travelers.
Ishaque et al. [42] analyzed effect of signal cycle timing on both vehicle and pedestrian de-
lays in a hypothesized network by a VISSIM microsimulation model. Aiming to minimize the
multimodal travel delay and travel costs, they found that optimal cycle lengths under light traf-
fic conditions (60 to 72 seconds) were shorter than optimal cycle lengths under heavy traffic
conditions (90 seconds). However, they only discussed eight fixed-time non-coordinated signal
plans with single or double exclusive pedestrian phases. In addition, pedestrian compliance ef-
fect was not considered in the research. Based on their research in 2005, Ishaque et al. [43]
studied trade-offs between pedestrian and vehicle traffics in the same hypothetical network by
a VISSIM microsimulation model. Aiming to optimize average travel cost per person in all
modes of the network, they
found that shorter cycle lengths were beneficial for pedestrians, and that signal plans advanta-
geous to vehicles might be disadvantageous to pedestrians. Based on different proportions of
pedestrians to vehicle users and different pedestrian time values, suitability of three different
pedestrian phase types was analyzed, so that the optimal network performance could be
achieved for all road users. Compared with their previous research, pedestrian compliance ef-
fect was considered in the research, and the variety of signal plans was improved. However, the
variety was still limited to a two-phase vehicle signal plans with single exclusive or double ex-
clusive, or staggered pedestrian crossing phase(s). A deterministic model ([11],[12]) was pro-
posed that incorporated both pedestrian and vehicle delays in a signal coordination plan. The
author(s) analyzed the running results of the model on a hypothesized five-intersection arterial
with various offsets, and found that the best offsets for vehicles and pedestrians along the arte-
rial were not necessarily the same. In order to minimize total pedestrian and vehicle user cost,
an optimal signal coordination plan could be achieved by balancing between pedestrian and
vehicular delays. Li et al. [54] developed a traffic signal optimization strategy, programmed in
Matlab, for an individual intersection to minimize weighted total vehicle and pedestrian delays.
The total vehicle and pedestrian delays on sidewalk were calculated based on their determinis-
tic queuing model, respectively. Total pedestrian delay on crosswalk was calculated based on
an empirical pedestrian speed model, which considered interactions between pedestrian pla-
toons. Mehan [68] and Barzegar[15] worked on traffic signal control for an isolated intersec-
tion signal (adjacent intersection) with fuzzy controller methods.
Gokulan and Srinivasan [14] adopted a type-2 fuzzy set and designed a distributed multi-
agent traffic-responsive signal control system. This system was tested on virtual road networks
with several scenarios. Results showed the superior performance of the approach in handling
unplanned and planned incidents and obstructions.
Recently, metaheuristic algorithms [13] have become very popular as optimization methods for
solving traffic light scheduling problems. A first attempt corresponds to the study of Rouphail
et al., where a genetic algorithm (GA) was coupled with the CORSIM [38] microsimulator for
the timing optimization of nine intersections in the city of Chicago (USA). The results, in terms
of total queue size, where limited due to the delayed convergence behavior of the GA. Turky et
al. [71] used a GA to improve the performance of traffic lights and pedestrians crossing control
in a unique intersection with four-way two-lane junction. The algorithm solved the limitations
of traditional fixed-time control for passing vehicles and pedestrians, and it employed a dynam-
ic control system to monitor two sets of parameters.
Odeh [67] presented a hybrid algorithm that combines Fuzzy Logic Controller (FLC) and Ge-
netic Algorithms (GAs) and its application on a traffic signal system. It has been used to adopt
the decision rules of FLCs that define an intelligent traffic signal system, obtaining a higher
performance compared to a classical FLC-based control. The simulation results yielded by the
hybrid algorithm show an improvement of up to 34% in the performance with respect to a
standard traffic signal controller. Another signal control methodology is formulated as a quad-
ratic programming problem to minimize and balance the link queues, therefore, minimizing the
risk of queue spillback [9]. Göttlich [65] presented a numerical approach for the optimization
of switching points as a function of time based upon the macroscopic traffic flow model. The
numerical discussion relies on an equivalent reformulation of the original problem as well as a
mixed-integer discretization of the flow dynamics. The large-scale optimization problem is
solved using derived heuristics within the optimization process. Collotta [27] proposed a novel
approach to dynamically manage the traffic lights cycles and phases in an isolated intersection.
The target of the work is a system that, comparing with previous solutions, offers improved
performance, which is flexible and can be implemented on off-the-shelf components. The pro-
posed system combines the advantages of the WSN, such as easy deployment and maintenance,
flexibility, low cost, noninvasiveness, and scalability, with the benefits of using four parallel
fuzzy controllers, i.e., better performance, fault-tolerance, and support for phase-specific man-
agement.
Asadi and Shahsavari [58] presented a new fuzzy multi-objective mathematical model to
minimize the length of traffic queue and pedestrian delays to optimize the control of fluctuating
traffic volumes such as oversaturated or unusual load conditions. The problem is solved by ge-
netic algorithm, and a new defuzzification method is introduced. Duerr [22] used a GA with a
microscopic traffic simulator as the fitness evaluator to minimize the performance index (PI)
which considered vehicle behavior at intersections and transit stops. The optimization results of
a seven-node arterial in Würzburg (Germany) and temporal deviation of each phase duration
from the standard setting at each node showed that travel time dropped 25% and 5% for buses
and cars, respectively. Furthermore, so as to optimize signal control under oversaturated traffic
condition, Girianna and Benekohal [31],[32] applied a GA to a grid network of arterials. The
optimization results of a hypothesized twenty-node network and green time of each phase at an
intersection showed that queues were successfully distributed spatially over different intersec-
tions and temporarily over different signal cycles.
In this paper, we apply a new multi-objective genetic algorithm to find a Pareto-optimal so-
lution or a restrictive set of Pareto-optimal solutions based on our solution approaches to the
problem. In this paper, our purpose is to present a solution methodology to obtain all Pareto-
optimal solutions to optimize signal timing and enable the decision-makers to evaluate a great-
er number of alternative solutions. The purpose of this study is to extend this methodology to
reach a solution to multi-objective optimal control problems under the framework of NSGA-II.
This paper is organized as follows. In Section 2, we present the problem definition and the
problem formulation. In Section 3, a solution procedure is introduced. We develop an algo-
rithm, namely PDNSGA. To illustrate the proposed approach, a number of examples are pre-
sented in Section 4. The related results of this algorithm are analyzed by the analysis of vari-
ance (ANOVA) method in Section 5. Finally, conclusion is given in Section 6.
2. Multi-objective Mathematical model
Traffic signal timing planning is a typical multi-objective optimization problem; for a signal-
ized system, an optimal timing plan is usually required to meet four typical objectives (mini-
mizing delay, minimizing stops, minimizing fuel consumption, maximizing progression). The
problem discussed in this paper is minimizing the queue length on each side of an intersection
during peak hours with fuzzy entrance and exit rates on each side of the intersection. Generally,
traffic signals aim to minimize average vehicle delay, but pedestrian delay is not taken into ac-
count. Such a strategy is reasonable for rural areas or highways where very few pedestrians in-
terfere with vehicular traffic. However, in a central business district with a lot of pedestrians
walking around, the strategy that only optimizes vehicle flows would not be suitable because
the pedestrian delay is ignored. Ignoring pedestrian delay might even result in people choosing
to use vehicles more frequently than walking. Traffic signal plan optimization should be a
trade-off between vehicle delay and pedestrian delay by minimizing travel delay for all the
travelers. Therefore, when pedestrian flows start to have an influence on vehicle flows, pedes-
trian signal plans should be optimized considering delays for both groups.
Fuzzy logic is a powerful tool for processing nondeterministic and non-linear problems. It
can represent fuzzy and qualitative knowledge, and so, it can imitate human to reason. As we
know, a seasoned traffic police can handle traffic quickly and effectively.
Actually, the merely reasons and makes decisions by making use of interrelated qualitative
knowledge. The process of reasoning and decision-making can be described as follows: for a
lane, if there are many vehicles arriving in, more green time is allocated. Otherwise, less green
time is allocated or the phase turns to the next one. Of cause, it is necessary to simultaneously
consider traffic demands in other lanes when changing the phase. The control process is shown
in Figure 1. The traffic intensity can be denoted by queue length before stop line or traffic den-
sity on the approaches in the current or next phase.
Traffic signal timing changes at different hours of day, and the amount of traffic on each street
and the intersection is used to help increase the efficiency of lights. Although this method has
been improved in control of intersections, but in a very busy intersection and in cities that have
particular traffic treatment, the control of intersection will be faced with this problems. So, we
need to have a system to respond to variations of the traffic patterns quickly. This study is
made to optimize green time duration in order to minimize traffic jam length. Prior to the opti-
mization process, road-detector should gather data related to intersection traffic. These data are
required to make decisions if current conditions are sufficient, or they have to be improved.
(see fig.1).
For the sake of clarification, we have conducted a sensitivity analysis on the traffic light at a
two-phase intersection, and then it is developed for a four-phase traffic problem. When phase I
has red time (T1), traffic jam length in this phase has an increasing rate. On the contrary, traffic
jam length of phase II with green time has a decreasing rate. Red time (WALK time) in each
phase is the sum of green time in other phases which increases as green time devoted to each
phase increases; therefore, jam length in other phases may also increase.
The pedestrian’s queue length has an incremental rate, and reaches its highest level at the end
of green time (point A1 , A2). As soon as intersection’s red time starts, all the pedestrians cross
the intersection immediately(WALK time). As a result, pedestrians’ queue is equal to zero (see
Fig.2). In addition, the model considers the compliance effect of pedestrians. In order to avoid
waiting for the next WALK interval, certain pedestrians increase their waking speed and begin
their crossing without a Walk indication. The majority of these phenomena happen during the
flashing DONT WALK time. The aim of this research is to obtain the optimal traffic light
green and red time to minimize the fuzzy queue length of vehicles and pedestrians. Notations
used for the problem formulation are as follow:
: The number of phases in an intersection.
: The Lower bound of the green time in phase i.
: The upper bound of the green time in phase i.
: The fuzzy entrance flow rate of cars in red time duration in Phase i.
: The fuzzy entrance flow rate of cars in green time duration in Phase i.
: The fuzzy exit flow rate in green time duration in Phase i.
: The fuzzy entrance cars in red time duration in Phase i.
: The fuzzy entrance cars in green time duration in Phase i.
: The fuzzy exit cars in green time duration in Phase i.
:The fuzzy entrance rate of pedestrians in red time duration (DONT WALK) in Phase i.
:The fuzzy entrance pedestrians in red time duration in Phase i.
: Duration of the analysis period.
: The red time duration in Phase i.
: The green time duration in Phase i.
: The cycle time duration in phase i.
: Number of cycles time in the TS.
: The fuzzy queue length when red time duration in Phase i and j-th cycle time is end-
ed.
: The fuzzy queue length when green time duration in Phase i and j-th cycle time is
ended.
The problem is formulated as in the following model presented by Asadi and Shahsavari
(2013):
)) (13)
(14)
Subject to:
(15)
(16)
(17)
(18)
(19
(20)
= (21)
(22)

Eq. (13) minimizes the total queue length of vehicles in all phases of the intersection;
Eq. (14) minimizes the total queue length of pedestrians in all phases of the intersection.
Eq. (15) restricts green time in per-phase to take a value within a lower bound li and an upper
bound Ui. Eq. (16) represents the red time duration in Phase I; Eq. (17) represents the fuzzy
entrance cars in red time duration in Phase i.
Eq. (18) represents the fuzzy entry cars in green time duration in Phase i. Eq. (19) represents
the fuzzy exit cars in green time duration in Phase i. The Eq. (20) shows that the cycle time
duration in per phases is equal to the total green and red time. Eq. (21) represents the number
of cycle time in per phases. When green time duration in Phase i and j-th cycle time is ended,
the fuzzy queue length is calculated by Eq. (21). If the last cycle time
Duration is equal to m in the time period studied (TS), the objective function in equation (13)
will minimize the .
There are various solution approaches to solve the multi-objective problem. Among the most
widely used techniques are sequential optimization, e-constraint method, weighting method,
goal programming, goal attainment, and distance-based and direction-based methods. In this
study, we also proposed a novel genetic algorithm to obtain Pareto-optimal solutions based on
the distance to the regression line (GADRL) for this problem.
3. Novel genetic algorithm
Evolutionary algorithms for multi-objective (MO) optimization are currently gaining signifi-
cant attentions from researchers in various fields due to their effectiveness and robustness in
searching for a set of global trade-off solutions. This growing interest is reflected by the signif-
icantly increasing number of different evolutionary-based approaches and variations of the ex-
isting method published in technical literatures. The purpose of this study is to extend this
methodology to obtain the solution to multi-objective optimal control problems under the
framework of NSGA-II. The Nondominated Sorting Genetic Algorithm (NSGA) proposed by
Srinivas and Deb [69] was one of the first evolutionary algorithm for solving multi-objective
optimization problems. Although NSGA has been successfully applied to solving many prob-
lems, the main criticisms of this approach has been its high calculation's volume of nondomi-
nated sorting, lack of elitism, and need for specifying a tunable parameter called sharing pa-
rameter. Recently, Deb et al. [25] reported an improved version of NSGA, which they called
NSGA-II, to address all the above issues.
3.1. Multi-objective optimization and genetic algorithms
Being a population-based approach, GA is well-suited to solve multi-objective optimization
problems. A generic single-objective GA can be modified to find a set of multiple non-
dominated solutions in a single run. The ability of GA to simultaneously search different re-
gions of a solution space makes it possible to find a diverse set of solutions to difficult prob-
lems with non-convex, discontinuous, and multi-modal solutions spaces. The crossover opera-
tor of GA may exploit structures of good solutions with respect to different objectives to create
new non-dominated solutions in unexplored parts of the Pareto front. In addition, most multi-
objective GAs do not require the user to prioritize, scale, or weigh objectives. Therefore, GAs
have been the most popular heuristic approaches to multi-objective design and optimization
problems. Jones et al. [45] reported that 90% of the approaches to multi-objective optimization
aimed to approximate the true Pareto front for the underlying problem. A majority of these
used a meta-heuristic technique, and 70% of all metaheuristics approaches were based on evo-
lutionary approaches. The first multi-objective GA, called vector evaluated GA (or VEGA),
was proposed by Schaffer [64].
Over the years, numerous techniques have been developed. Some of the well-known and
credible algorithms used in many application and their performances tested in several compara-
tive studies include vector evaluated genetic algorithm (VEGA), multi-objective genetic algo-
rithm (MOGA), weight-based genetic algorithm (WBGA), random weight genetic algorithm
(RWGA), niched Pareto genetic algorithm (NPGA), Pareto envelop-based selection algorithm
PESA, Pareto archived evolution strategy (PAES), non-dominated sorting
genetic algorithm (NSGA), fast non-dominated sorting genetic algorithm (NSGA-II), strength
Pareto evolutionary algorithm (SPEA), improved Strength Pareto evolutionary algorithm
(SPEA-2), rankdensity-based genetic algorithm (RDGA), and dynamic multi-objective evolu-
tionary algorithm (DMOEA) . Generally, multi-objective genetic algorithms differ based on
their fitness assignment procedure, elitism, or diversification approaches. Santa Chávez [48]
presented a multi-objective ant colony algorithm for the Multi-Depot Vehicle Routing Problem
with Backhauls (MDVRPB), where three objectives of traveled distance, traveling times, and
total consumption of energy are minimized. An ant colony algorithm is proposed to solve the
MDVRPB. The solution scheme allows one to find a set of ordered solutions in Pareto fronts
by considering the concept of dominance.
Zhao [78] proposed a multi-objective optimization approach for quality and efficiency in
mixed-model assembly line (MMAL) by selecting the cycle time at each station. Zhu [83] pre-
sented an early attempt to solve one-to-many-to-one dynamic pickup-and-delivery problem
(DPDP) by proposing a multi-objective memetic algorithm called LSH-MOMA, which is a
synergy of multi-objective evolutionary algorithm and locality-sensitive hashing (LSH) based
local search. Hajipour and Tavakkoli-Moghaddam [76] presented a Vibration Damping Opti-
mization (VDO) algorithm to solve multi-objective optimization problems for the first time. To
do this, fast non-dominated sorting and crowding distance concepts were used in order to find
and manage the Pareto-optimal solution.
3.1.2. NSGA-II: a brief overview
The notion of non-dominated sorting genetic algorithm(NSGA) was first suggested by Gold-
berg [37]. The main idea behind the non-dominated sorting procedure is that a ranking selec-
tion method is used to emphasize the good points, and a niching method is used to maintain a
stable subpopulations of the good points. NSGA differs from a simple genetic algorithm only
in the way the selection operator works. The crossover and mutation operators remain as usual.
The efficiency of NSGA lies in the way that multiple objectives are reduced to a single fitness
measure by the creation of number of fronts, sorted according to non-domination. Although
NSGA approach has been successfully applied to a number of multi-objective optimization
problems, the main criticisms of the NSGA approach have been: (i) its high computational
complexity of non-dominated sorting, O(MN 3) where M is the number of objectives and N is
the population size; (ii) the lack of elitism; (iii) the need for specifying the tunable sharing pa-
rameter, share. Recently, Deb et al. [25] reported an improved version of NSGA, which they
called NSGA-II, to address all of these issues. Specifically, NSGA-II alleviates all the above
difficulties by introducing a fast non-dominated sorting procedure with O(MN 2) computation-
al complexity, an elitist-preserving approach, and a parameter less niching operator for diversi-
ty preservation (crowded comparison operator). NSGA-II also incorporates a simple but effi-
cient penalty parameter-less approach for solving constrained multi-objective optimization
problems. The constraint-handling approach in NSGA-II uses the binary selection operator,
where two solutions are picked up from the population and the better solution is chosen as fol-
lows:
1. If both the solutions are feasible, choose the solution with a better no-dominated rank.
2. If one is feasible and the other is not, choose the feasible solution.
3. If both of the solutions are infeasible, choose the solution with a smaller overall constraint
violation. In the context of constrained multi-objective optimization, Deb modified the defi-
nition of domination between two solutions i and j as follows. A solution i is said to con-
strained-dominate a solution j if any of the following conditions is true.
1. Solution i is feasible and solution j is not.
2. Solutions i and j are both infeasible, but solution i has a smaller overall constraint viola-
tion.
3. Solutions i and j are feasible and solution i dominates solution j.
The effect of using this constrained-domination principle is that any feasible solution has a
better non-domination rank than any infeasible solution. All feasible solutions are ranked ac-
cording to their non-domination level based on the objective function values. However, be-
tween two infeasible solutions, the solution with a smaller constraint violation has a better
rank. In fact, when an evolutionary algorithm is applied to multi-objective optimization, two
major problems should be considered. The first is how to maintain various populations to
prevent premature convergence and achieve a well-distributed trade-off front; the second is
how to achieve fitness assignment and selection, separately, to guide the search towards the
Pareto-optimal front.
3.2 Implementation details of the proposed algorithm for multi-objective optimal control
problems
In GA terminology, solution vector is called an individual or a chromosome. Chromo-
somes are made of discrete units called genes. Each gene controls one or more features of the
chromosome. In the original implementation of GA by Holland, genes are assumed to be bina-
ry digits. In later implementations, more varied gene types have been introduced. Normally, a
chromosome corresponds to a unique solution x in the solution space. This requires a mapping
mechanism between the solution space and the chromosomes.
This mapping is called an encoding. In fact, GA works on the encoding of a problem, not on
the problem itself.
In this paper, the chromosomes show the sum of green time duration of the traffic light sys-
tem. Chromosome length depends on a number of lighting groups inside each intersection.
GA operates with a collection of chromosomes, called a population. The population is nor-
mally and randomly initialized. The number of chromosomes inside the population is also

needed to be decided, because the number of the solutions determines the speed of the optimi-
zation and the accuracy of the solution found. If too many solutions are generated in the popu-
lation, then longer duration of time is needed to find the fittest optimization. but if the number
of the solutions is too little or small, the genetic algorithm may face the problem of finding the
fittest optimizations.
The key feature of our GA-based optimization strategy is the formulation of regression line,
named PDNSGA (Nondominated Sorting Genetic Algorithm base on Perpendicular Distance).
Linear regression attempts to model the relationship between two variables by fitting a linear
equation to observed data. One variable is considered to be an explanatory variable, and the
other is considered to be a dependent variable. For example, a modeler might want to relate the
weights of individuals to their heights using a linear regression model. The formula for the
best-fitting line (or regression line) is y = mx + b, where m is the slope of the line, and b is the
y-intercept. This equation itself is the same one used to find a line in algebra; but it should be
noted that in statistics, the points do not lie perfectly on a line — the line is a model around
which the data lie if a strong linear pattern exists.
Linear regression consists of finding the best-fitting straight line through the points. The
best-fitting line is called a regression line. The black diagonal line in Figure 3 is the regression
line which consists of the predicted score on Y for each possible value of X. The vertical lines
from the points to the regression line represent the errors of prediction. As we can see, the red
point is very near to the regression line; its error of prediction is small. By contrast, the yellow
point is much higher than the regression line; therefore, its error of prediction is large.
we may have noticed that we have not specified what is meant by "best-fitting line." By far,
the most commonly-used criterion for the best-fitting line is the line that minimizes the sum of
the squared errors of prediction. That is the criterion that was used to find the line in Figure 4.
The last column in Table 1 shows the squared errors of prediction. The sum of the squared er-
rors of prediction shown in Table 1 is lower than it would be for any other regression line. No-
tice that error column sums (Y-Y') equal zero.
In this study, we use the specifications of regression line to improve the performance of
NSGA-II algorithm according to density estimation. To get an estimate of the density of solu-
tions surrounding a particular solution in the population, we calculate the perpendicular dis-
tance from the perpendicular line to the regression line passing through the point
( that n is the number of objectives. In NSGA-II algorithms, the crowded-
comparison operator guides the selection process at the various stages of the algorithm toward
a uniformly spread-out Pareto optimal front. In this study, we use a new crowded-comparison
operator described below. Although Fig. 5 illustrates the crowding-distance computation for
two objectives, the procedure is applicable to more than two objectives as well.
Determine the mean value (f1,f2) for each objective in each non-dominated sorting
front.
Calculate the regression line for each non-dominated sorting by the following equation:
∑
∑N
1=i
i
N
1=i
ii
1)F-1F(
2)F-1)(F2F-1F(
=b (23)
1Fb.-2Fa (24)
a+b.F1=2F (25)
Find the equation of a line passing through the mean point ( and perpendicular
to the regression line (red line in Fig 3) using the following equation; two lines are per-
pendicular if b1.b2=-1. In other words, the slopes of the two lines ( must be
negative reciprocals of each other:
(16)
Calculate the distance (blue line in fig. 3) between each solution in the non-dominated
sorting ( and perpendicular regression line passing through point ,
reached in equation (16) using the following equation:
2
i
2
i )V-2()U-1( iii ffd (16)
For example, we obtained the regression line and perpendicular the regression line passing
through the mean point ( and crowding-distance ( according to the following table
2:
If we use the crowded-comparison operator according to NSGA-II algorithm, we choose
point 4 that has lesser crowding distance than point 5. That is, between two solutions with dif-
fering non-domination ranks, we prefer the solution with the lower (better) rank. Otherwise, if
both solutions belong to the same front, then we prefer the solution that is located in a lesser
crowded region. In the proposed approach, we replace the crowding distance approach with a
new approach that eliminates the above difficulties to some extent. The new approach does not
require any user-defined parameter for maintaining diversity among population members. The
new approach chooses point 5 because it has a greater distance compared to point 4 that is lo-
cated in a lesser crowded region. Globally, point 5 is better than point 4 as it leads to diver-
gence and extends in non-dominated solutions; it enables the decision-makers to evaluate a
greater number of alternative solutions.
The details of the algorithm can be outlined as follows:
Comment [g1]: Nondominated what? Insert
a noun after this adjective
Comment [HA2R1]:
Comment [g3]: Consider rewriting this part
completely.
Step 1. Initially, a random parent population 𝑃0 is created. The population is sorted
based on the nondomination.
Each solution is assigned a fitness (or rank) equal to its no-domination level. The usual
binary tournament selection, recombination, and mutation operators are used to create
an offspring population 𝑄0 of size 𝑁. Let 𝑡 =0
Step 2. A combined population 𝑅𝑡 = 𝑃𝑡 ∪ 𝑄𝑡 is formed. The population 𝑅𝑡 is of size
2𝑁. Then, the population 𝑅𝑡 is sorted according to nondomination. The best non-
dominated set 𝐹𝑖 is formed.
Step 3. The perpendicular distance operator ≺𝑛 is chosen to sort the non-dominated set
𝐹𝑖 in a descending order. The best 𝑁 members of the set are chosen for the new popula-
tion 𝑃𝑡+1.
Step 4. The new population 𝑃𝑡+1 is now used for selection, crossover, and mutation to
create a new population 𝑡+1.
Step 5. When the termination condition meets, the loop stops; otherwise, 𝑡 = 𝑡 + 1, and
turn back to Step 2.
4. Illustrative example
The site of our case study chosen for this study is a major arterial in Central Tehran, regu-
larly crossed by cars, trucks, public transportation buses and mopeds. Adopting the formalism
introduced in Section 3, the signalized area in Fig. 6 is modelled with 8 links, including 4 input
and 4 output links.
The model is programmed in the Microsoft Excel 2007 software using the Visual Basic Appli-
cation (VBA). problem data given in Table 3 is entered in the application software. We assume
that the Time period studied (AT) to be equal to 30 minute. In other words, in every 30 minutes,
road detectors send the traffic data for optimization Process. Also, assume that the Lower
bound of the green time duration in per phase, Li, is equal to 10 seconds, and the upper bound
of the green time duration in per phase, Ui, is equal to 138 seconds.
In this example, there are 268, 435, 456 solutions. The presented model is solved in order to
obtain the optimal solution. The GA parameters are set as follows. G=100, N=70, one-point
crossover rate=0.85, mutation rate=0.2. The program is run on a Pentium 4 PC with CPU 2.8
GHz; =10, =15, =110, =34, and its best Pareto solution are obtained accord-
ing to fig. 2.
5 Experimental evaluation
In order to test the convergence of the algorithm, the optimization results (see fig 7)of the
proposed algorithm after 50 generations and 100 generations are compared. As illustrated in
Figure 8, the converged speed of the proposed algorithm is relatively fast. After 50 generations,
the optimization results have already got a relatively good convergence, which is similar to the
optimization results after 100 generations. In this way, the evaluation generation can be re-
duced when it is necessary to consider the calculation time. Although the accuracy of the solu-
tion may be lower, the accuracy can still be acceptable based on the experimental results.
This section evaluates the performance of our proposed GADRL and the WBGA [29]. These
algorithms are coded and implemented in Excel 2007 by the VBA and are run on a Pentium 4.
This section evaluates the performance of the proposed PDNSGA, NSGA-II, MOGA, and
WBGA. These algorithms are coded and implemented in Excel 2007 by the VBA and are ran
on a Pentium 4 PC with CPU 2.8 GHz and 512 MB of RAM memory. We use the mean devia-
tion from the ideal point (MDI) as a common performance measure to compare these algo-
rithms computed by:
k
FF
MDI
ii
k
i
i
2i
*2i
*
1
)F2-2()F1-1(∑
(26)
where F1* and F2* are the best solutions obtained by each algorithm for a given instance.
F1 and F2 are the total queue length of vehicles and pedestrians for a given algorithm, respec-
tively, and k is the number of point in each Pareto solution. The PDNSGA, NSGA-II, MOGA,
and WBGA are implemented with same parameters for twenty five times. Their results are ana-
lyzed via the analysis of variance (ANOVA) method. The means plot and the least significant
different (LSD) interval for the MOGA, PDNSGA, NSGA-II, and WBGA are shown as Figure
9. It is demonstrated that our proposed algorithm (PDNSGA) gives better outputs than MOGA,
NSGA-II, and WBGA in this problem, statistically.
The proposed PDNSGA procedure has several advantages in speed, flexibility, and accuracy,
which would be prominent during its application. Firstly, the proposed PDNSGA procedure
runs efficiently. It takes less than half a minute for the proposed PDNSGA procedure to run 50
generations with 5
Different random seeds in VBA, while it takes NSGA-II around 3.5 minutes to run 50 genera-
tions with only one random seed. Secondly, the proposed GA procedure is flexible, therefore,
can be used in different intersections under different circumstances. The variation includes ge-
ometric design of the intersection, vehicle and pedestrian volumes, initial queues, and other
traffic relevant parameters. Thus, the signal plan selected by the PDNSGA procedure would be
a suitable solution, particularly for that intersection with those traffic characteristics. Moreover,
although the analysis period is set as 30 minutes in the tests, it can be set as any positive values,
such as 10, 5, or 2 minutes. The shorter the analysis period is, the faster the signal plan re-
sponds to the change of traffic demands. With a cycle-length-long analysis period, the
PDNSGA procedure can realize real time signal plan optimization. However, frequent switches
between two pedestrian crossing patterns and big signal timing difference between adjacent
cycles should be avoided. Otherwise, either one of them can cause the confusion of both driv-
ers and pedestrians, which might bring severe safety issues. In addition, if an object-oriented
platform can be set up, the application of the proposed procedure would be even more user-
friendly and easier to use. The proposed GA procedure considers pedestrian and vehicle delay
in the total user time. However, there are other transportation users as well, e.g., cyclists and
buses. Therefore, including the delay of other transportation users into the total user time could
be one of the areas for further research.
6 CONCLUSION
A GA optimization procedure is developed in this paper to optimize signal timing of an indi-
vidual intersection by minimizing total user time which considers both vehicle and pedestrian
delays. In order to verify the proposed optimization procedure, the impact of vehicle and pe-
destrian volumes on signal plans is tested in a hypothesized intersection. Signal plans selected
by the GA procedure are reasonable. Phase lengths increase with the growth of the correspond-
ing critical vehicle or pedestrian volumes.
The main contribution of this paper is presentation of a multi-objective optimization algo-
rithm to optimize traffic signal timing at oversaturated intersection. In the proposed algorithm,
throughput maximum and average queue ratio minimum are selected as the optimization objec-
tives to meet the characteristics of oversaturated traffic flow. A problem-solving algorithm
which found an optimal solution considers the total queue length of vehicles and pedestrians.
To solve the given problem, a new genetic algorithm (PDNSGA) was also developed. The
model was programmed in the Microsoft Excel 2007 software using the Visual Basic Applica-
tion (VBA). The proposed algorithm has the capability of searching Pareto front of the multi-
objective problem domain. Further jobs should be concerned with the signal timing optimiza-
tion method for oversaturated coordinated intersections or small-scale road network and real-
field applications with the traffic signal controller. The high speed of the proposed algorithm
and its quick convergence makes it desirable for large scheduling with a large number of phas-
es. Furthermore, we have used the mean deviation from the ideal point (MDI) measure to com-
pare the performance of the MOGA, PDNSGA, NSGA-II, and WBGA by the ANOVA method.
By considering uncertainty in processing time, this model can be extended to the cases which
can be more realistic.
The proposed GA procedure is only capable of optimizing signal plans for an individual in-
tersection. However, there might be several intersections that need to be optimized by minimiz-
ing the total user time of both vehicles and pedestrians, especially in a central business district.
Therefore, expanding the object of the GA procedure from an individual intersection to a net-
work or arterial could be one of the areas for further research
.
References
[1] Fink, S. Vob, ―Solving the continuous flow
shop scheduling problem by meta-
heuristics‖, European Journal of Operational
Research151 , 400–414(2003).
[2] Kumar, A. Prakash, R. Shankar, M.K. Ti-
wari, Psycho-Clonal algorithm based ap-
proach to solve continuous flow shop
scheduling problem, Expert Systems with
Applications 31 ,504–514(2006).
[3] Oulamara, ―Makespan minimization in a no-
wait flow shop problem with two batching
machines‖, Computers and Operations Re-
search 34 ,1033–1050.(2007)
[4] A.R. Rahimi-Vahed, S.M. Mirghorbani, ―A
multi-objective particle swarm for a flow
shop scheduling problem‖, Journal of Com-
binatorial Optimization 13 79–102(2007).
[5] Aytug, H., Khouja, M., & Vergara, F. E.
―Use of genetic algorithms to solve produc-
tion and operations management: a review‖.
International Journal of Production Re-
searches, 41(17), 3955–4009(2003).
[6] American Association of State Highway and
Transportation Officials (AASHTO), ―A
Manual on User Benefit Analysis of High-
way and Bus Transit Improvements‖,
FHWA. Washington, D.C.(2003)
[7] American Association of State Highway and
Transportation Officials (AASHTO) Manual
on Uniform Traffic Control Devices for
Streets and Highways. FHWA. Washington,
D.C,. (0223).
[8] Artificial Intelligence in Transportation (In-
formation for Application). TRB, Artificial-
Intelligence and Advanced Computing Ap-
plications Committee, Washington,
D.C.( 0227).
[9] Aboudolas, K., Papageorgiou, M., Kouvelas,
A. & Kosmatopoulos, E, ―A rolling-horizon
quadrat-icprogramming approach to the sig-
nal control prob-lem in large-scale congest-
ed urban road networks‖, Transportation
Research Part C: Emerging Technol-ogies,
18, 680–94(2010)
[10] Toktas, M. Azizoglu, S.K. Koksalan, ―Two-
machine flow shop scheduling with two cri-
teria: Maximum earliness and makespan‖,
European Journal of Operational Research
157,286–295(2004).
[11] Bhattacharya, P. ―Methodology to Optimize
for Pedestrian Delay and Vehicular Delay in
aSignal Network‖. M.S. thesis. University
of Missouri-Columbia, (2004).
[12] Bhattacharya, P., Virkler, M. R. ―Optimiza-
tion for Pedestrian and Vehicular Delay in a
Signal Network‖. In Transportation Re-
search Record 1939, TRB, National Re-
search Council, Washington, D.C, pp. 115–
122(2005).
[13] Blum, C., Roli, A.. Metaheuristics in com-
binatorial optimization: overview and con-
ceptual comparison. ACM Comput. Surveys
(CSUR) 35 (3), 268–308.(2003)
[14] B. P. Gokulan and D. Srinivasan, ―Distrib-
uted geo-metric fuzzy multiagent urban traf-
fic signal control,‖ IEEE Trans. Intell.
Transp. Syst., vol. 11, no. 3, pp. 714–727,
Sep. (2010).
[15] B. Barzegar, ―Fuzzy logic controller for traf-
fic signal control-ler unit system and model-
ling with colored petri net,‖ Indian Journal
of Science and Technology, vol. 4, no. 11,
pp. 1420–1428, (2011)
[16] C. Cai and T. M. Le, ―APPROXIMATE
DYNAMIC PROGRAMMING CON-
TROLLER FOR MULTIPLE INTERSEC-
TIONS,‖, pp. 1–23(2010).
[17] Coello CAC, Pulido GT. ―A micro-genetic
algorithm for multiobjective optimization.
In: Evolutionary multi-criterion optimiza-
tion‖. First international conference, EMO
2001, 7–9. Zurich, Switzerland: Springer;
(2001).
[18] Corne DW, Knowles JD, Oates MJ.‖ The
Pareto envelope-based selection algorithm
for multiobjective optimization. In‖: Pro-
ceedings of sixth international conference
on parallel problem solving from Nature,
18–20 September, 2000. Paris, France:
Springer; (2000).
[19] Corne D, Jerram NR, Knowles J, Oates J.
PESA-II: region-based selection in evolu-
tionary multiobjective optimization. In: Pro-
ceedings of the genetic and evolutionary
computation conference (GECCO- 2001),
San Francisco, CA, 2001.
[20] Coello CAC. ―An updated survey of GA-
based multiobjective optimization tech-
niques‖. ACM Comput Surv ;32(2):109–
43(2000).
[21] Chilukuri, V., Virkler, M. R. ―Validation of
HCM Pedestrian Delay Model for Interrupt-
ed Facilities‖. In Journal of Transportation
Engineering 131 (12), ASCE, Reston, VA,
pp. 939–945(2005)
[22] Duerr, P. Dynamic Right-of-Way for Transit
Vehicles: Integrated Modeling Approach for
Optimizing Signal Control on Mixed Traffic
Arterials. In Transportation Research Rec-
ord: Journal of the Transportation Research
Board, No. 1731. TRB, National
[23] Research Council, Washington, D.C, pp.
31–39.(2000)
[24] Ravindran, A. Noorul Haq, S.J. Selvakuar,
R. Sivaraman, ―Flow shop scheduling with
multiple objective of minimizing makespan
and total flow time‖, International Journal of
Advance Manufacturing Technology 25
1007–1012(2005).
[25] Deb K, Pratap A, Agarwal S, Meyarivan T.
―A fast and elitist multiobjective genetic al-
gorithm‖ NSGA-II. IEEE Trans Evol Com-
put;6(2):182–97(2002)
[26] Dimopoulos, C., & Zalzala, A. M. S. (2000).
―Recent developments in evolutionary com-
putation for manufacturing optimization:
problems, solutions and comparisons. IEEE
Transactions on Evolutionary Computation,
4(2), 93–113(2000).
[27] Mario Collotta ,Lucia Lo Bellb , Giovanni
Pau ‖A novel approach for dynamic traffic
lights management based on Wireless Sen-
sor Networks and multiple fuzzy logic con-
trollers.‖ Expert Systems with Applica-
tions,Volume 42, Issue 13, Pages 5403–
5415.(2015)
[28] Bertolissi,‖ Heuristic algorithm for schedul-
ing in the no-wait flow shop, Journal of Ma-
terials Processing Technology‖ 107 ,459–
465(2000).
[29] F.C.R. Spieksma, G.J. Woeginger, ―The no-
wait flow-shop paradox‖, Operation Re-
search Letter 33,603–608(2005).
[30] Gen, M., & Cheng, R. .‖ Genetic algorithms
and engineering optimization‖. New York:
Wiley(2000).
[31] Girianna, M., and R. F. Benekohal. ―Dy-
namic Signal Coordination for Networks
with Oversaturated Intersections‖ In Trans-
portation Research Record 1811, TRB, Na-
tional Research Council, Washington, D.C.
pp. 122–13(2002).
[32] Girianna, M., and R. F. Benekohal. Using
Genetic Algorithms to Design Signal Coor-
dination for Oversaturated Networks. In
Journal of ITS: Technology, Planning, and
Operations, Vol. 8, No. 2, pp. 117–
129(2004)
[33] Henry, R. D. Signal Timing on a Shoestring.
Publication FHWA-HOP-07-006, Section 4.
[34] FHWA,http://ops.fhwa.dot.gov/Publications
/signal_timing/04.htm. Accessed Dec. 27,
(0229).
[35] Hajela P, lin C-y. Genetic search strategies
in multicriterion optimal design. Struct Op-
timization ;4(2):99–107(1992).
[36] H.W. Thornton, J.L. Hunsucker, ―A new
heuristic for minimal makespan in flow
shops with multiple processors and no in-
termediate storage‖, European Journal of
Operational Research 152 , 96–114(2004).
[37] Horn J, Nafpliotis N, Goldberg DE. ―A
niched Pareto genetic algorithm for multi-
objective optimization. In: Proceedings of
the first IEEE conference on evolutionary
computation. IEEE world congress on com-
putational intelligence, 27–29 June, 1994.
Orlando, FL, USA: IEEE; (1994).
[38] Holm, P., Tomich, D., Sloboden, J.,
Lowrance, C.,‖Traffic analysis toolbox vol-
ume iv: guidelines for applying corsim mi-
crosimulation modeling software.‖ Tech-
nical Report, National Technical Infor-
mation Service—5285 Port Royal Road
Springfield, VA 22161, USA—Final Re-
port.(2007)
[39] Hansancebi, O., F. Erbatur, ―Evaluation of
crossover techniques in genetic algorithm
based optimum structural design‖. Comput-
er and structures, 78: 435-448(2000)
[40] J.L. Bouquard, J.C. Billaut, M.A. Kubzin,
V.A. Strusevich, ―Two-machine flow shop
scheduling problems with no-wait
jobs‖,Operations Research Letters 33 (3)
255–262(2005).
[41] J. Grabowski, J. Pempera, Some local search
algorithms for no-wait flow shop problem
with makespan criterion, Computers and
Operations Research 32 ,2197–2212(2005)
[42] Ishaque, M. M., Noland, R. B. ―Multimodal
Microsimulation of Vehicle and Pedestrian
Signal Timings‖. In Transportation Re-
search Record 1939, TRB, National Re-
search Council, Washington, D.C, pp. 107–
114(2005).
[43] Ishaque, M. M., Noland, R.B. ―Trade-offs
between Vehicular and Pedestrian Traffic
Using Micro-Simulation Methods‖. In
Transportation Policy 14, pp. 124-
138(2007).
[44] J.B. Wang, Flow shop scheduling problems
with decreasing linear deterioration under
dominant machines, Computers and Opera-
tions Research 34, 2043–2058.(2007)
[45] Jones DF, Mirrazavi SK, Tamiz M. ―Multi-
objective meta-heuristics‖: an overview of
the current state-of-the-art. Eur J Oper
Res;137(1):1–9.(2002)
[46] Jensen MT. ―Reducing the run-time com-
plexity of multiobjective EAs: The NSGA-II
and other algorithms.‖ IEEE Trans Evol
Comput;7(5):503–15(2003).
[47] Johnson, S.M. ―Optimal two- and three-
stage production schedules with setup times
included,‖Naval Research Logistics Quar-
terly, 1: (1),61-68(1954).
[48] Jhon Jairo Santa Chávez , John Willmer Es-
cobarand Mauricio Granada Echeverri ,‖A
multi-objective Pareto ant colony algo-rithm
for the Multi-Depot Vehicle Routing prob-
lem with Backhauls‖ , International Journal
of Industrial Engineering Computations 7 ,
35–48(2016)
[49] Kamburowski, J. ―The nature of simplicity
of Johnson’s algorithm,‖ Omega-
International Journal of Management Sci-
ence, 25: (5), 581-584(1997).
[50] Knowles JD, Corne DW. ―Approximating
the nondominated front using the Pareto ar-
chived evolution strategy‖. Evol Com-
put;8(2):149–72.(2000)
[51] Konak A, Coit DW, Smith AE. ―Multi-
objective optimization using genetic algo-
rithms‖: a tutorial. Reliability Engineering
& System Safety ;9(1): 992–1007(2006).
[52] L.H. Su, Y.Y. Lee, ―The two-machine flow
shop no-wait scheduling problem with a
single server to minimize the total comple-
tion time‖, Computers and Operations Re-
search, in press,
doi:10.1016/j.cor.2007.01.002.
[53] Lu H, Yen GG. ―Rank-density-based multi-
objective genetic algorithm and benchmark
test function study‖. IEEE Trans Evol Com-
put;7(4):325–43(2003).
[54] Li, M., Alhajyassen, W. K. M., Nakamura,
H. ―A Traffic Signal Optimization Strategy
Considering Both Vehicular and Pedestrian
Flows.‖ Presented at the 89th Annual Meet-
ing of the Transportation Research Board,
Washington, D.C., (2009)
[55] M. Yazdani, M. Zandieh, R. Tavakkoli-
Moghaddam and F. Jolaic . ―Two meta-
heuristic algorithms for the dual-resource
constrained exible job-shop scheduling
problem ‖ . Scientia Iranica E 22(3), 1242-
1257(2015)
[56] M.L. Espinouse, P. Formanowicz, B. Penz,
―Minimizing the makespan in the two-
machine no-wait flow shop with limited ma-
chine availability‖, Computers and Industri-
al Engineering 37, 497–500(1999).
[57] Murata T, Ishibuchi H. MOGA:‖ multi-
objective genetic algorithms‖. In: Proceed-
ings of the 1995 IEEE international confer-
ence on evolutionary computation, 29 No-
vember–1 December, 1995. Perth, WA,
Australia: IEEE; (1995).
[58] N. Shahsavari Pour, H. Asadi, and M. Pour
Kheradmand , ―Fuzzy Multiobjective Traf-
fic Light Signal Optimization‖ , Journal of
Applied Mathematics , Volume, 7
es ,(2013).
[59] Osman, I.H. & Potts, C.N. ―Simulated an-
nealing for permutation flow-shop schedul-
ing‖. OMEGA, The International Journal of
Management Science. 17(6), 551-557(1989).
[60] Ogbu F.A. & Smith D.K. ―The application
of the simulated annealing algorithms to the
solution of the n / m / Cmax flowshop prob-
lem‖. Computers & Operations Re-
search,17(3), 243-253((1990).
[61] R. Tavakkoli-Moghaddam, A.R. Rahimi-
Vahed, A.H. Mirzaei, ―Solving a bi-criteria
permutation flow shop problem using im-
mune algorithm‖, in: Proceedings of the
First IEEESymposiumonComputational In-
telligence, vol. 1,Honolulu,Hawaii , pp.
4(2007)
[62] Roess, P.R., McShane, W. R., and Prassas,
E. S, Traffic Engineering, Prentice Hall,
Upper Saddle River, New Jersey (2004)
[63] S.G. Ponnambalam, H. Jagannathan, M. Ka-
taria, ―A. Gadicherla, A TSP-GA multi-
objective algorithm for flow shop schedul-
ing‖,International Journal of Advanced
Manufacturing Technology 23 , 909–
915.(2004)
[64] Schaffer JD. ―Multiple objective optimiza-
tion with vector evaluated genetic algo-
rithms‖. In: Proceedings of the international
conference on genetic algorithm and their
applications, (1985).
[65] Simone Göttlich, Michael Herty, Ute Zieg-
ler ―Modeling and o tim-ing traffic light set-
tings in road networks‖Computers & Opera-
tions Re-search, Volume 55, Pages 36-
51(2015)
[66] Sarker R, Liang K-H, Newton C. ―A new
multiobjective evolutionary algorithm‖. Eur
J Oper Res ,140(1):12–23(2002).
[67] S. M. Odeh, A. M. Mora, M. N. Moreno,
and J. J. Merelo ,‖A Hybrid Fuzzy Genetic
Algorithm for an Adaptive Traffic Signal
System: Hindawi Publishing Corporation
Advances in Fuzzy Systems ,Article ID
378156, 11 pages(2015)
[68] S. Mehan, ―Introduction of traffic light con-
troller with fuzzy control system,‖ Interna-
tional Journal of Electronics & Communica-
tion Technology, vol. 2, no. 3, pp. 119–
122,( 2011)
[69] Srinivas N, Deb K. ―Multiobjective optimi-
zation using nondominated sorting in genet-
ic algorithms.‖ J Evol Comput 2(3):221–
48.(1994)
[70] T. Murata, H. Ishibuchi, H. Tanaka, ―Multi-
objective genetic algorithm and its applica-
tions to flow shop scheduling‖, Computers
and Industrial Engineering 30 957–
968(1996)
[71] Turky, A.M., Ahmad, M.S., Yusoff, M.Z.,
Hammad, B.T.‖Using genetic algorithm for
traffic light control system with a pedestrian
crossing.‖ RSKT ’09: Proceedings of the
Fourth International Conference on Rough
Sets and Knowledge Technology. Berlin,
Heidelberg, pp. 512–519(2009).
[72] Virkler, M. R. Prediction and Measurement
of Travel Time along Pedestrian Routes. In
Transportation Research Record 1636, TRB,
National Research Council, Washington,
D.C., 1998, pp. 37–42.
[73] Virkler, M. R. "Signal Coordination Bene-
fits for Pedestrians. In Transportation Re-
search Record 1636, TRB, National Re-
search Council, Washington", D.C., pp. 77–
82(1998).
[74] Virkler, M. R. Scramble and Crosswalk
―Signal Timing. In Transportation Research
Record‖ 1636, TRB, National Research
Council, Washington, D.C., , pp. 83–
87(1998)
[75] Virkler, M. R. ―Pedestrian Compliance Ef-
fects on Signal Delay‖. In Transportation
Research Record 1636, TRB, National Re-
search Council, Washington, D.C., , pp. 88–
91(1998).
[76] V. Hajipour, E. Mehdizadeh and R. Tavak-
koli-Moghaddam,‖A novel Pareto-based
multi-objective vibra-tion damping optimi-
zation algorithm to solve multi-objective op-
timization problems‖, Scientia Iranica E
21(6), 2368-2378(2014).
[77] Xiujuan L, Zhongke S.‖ Overview of multi-
objective optimization methods‖. J Syst Eng
Electron ;15(2):142–6(2004).
[78] Xiaosong Zhao, Chia-Yu Hsu, Pei-Chann
Chang, Pei-Chann Changb andLi Li ,‖A ge-
netic algorithm for the multi-objective opti-
mization of mixed-model assembly line
based on the mental workload‖ , Engineer-
ing Applications of Artifi-cial Intelligence,
Volume 47, Pages 140–146 (2016)
[79] Yen GG, Lu H. ―Dynamic multiobjective
evolutionary algorithm: adaptive cell-based
rank and density estimation‖. IEEE Trans
Evol Comput;7(3):253–74.(2003)
[80] Zitzler E, Thiele L. Multiobjective evolu-
tionary algorithms: a comparative case study
and the strength Pareto approach. IEEE
Trans Evol Comput ,3(4):257–71.(1999)
[81] Konak et al. / ―Reliability Engineering and
System Safety‖ 91 992–1007(2006)
[82] Zitzler E, Laumanns M, Thiele L. SPEA2:
improving the strength Pareto evolutionary
algorithm. Swiss Federal Institute
Techonology: Zurich, Switzerland;( 2001).
[83] Zexuan Zhu, Jun Xiao, Shan He, Zhen Ji,
Yiwe Sun ,‖A multi-objective memetic al-
gorithm based on locality-sensitive hashing
for one-to-many-to-one dynamic pickup-
and-delivery problem ―, Information Sci-
ences Volume 329, 2016, Pages 73–
89(2016)
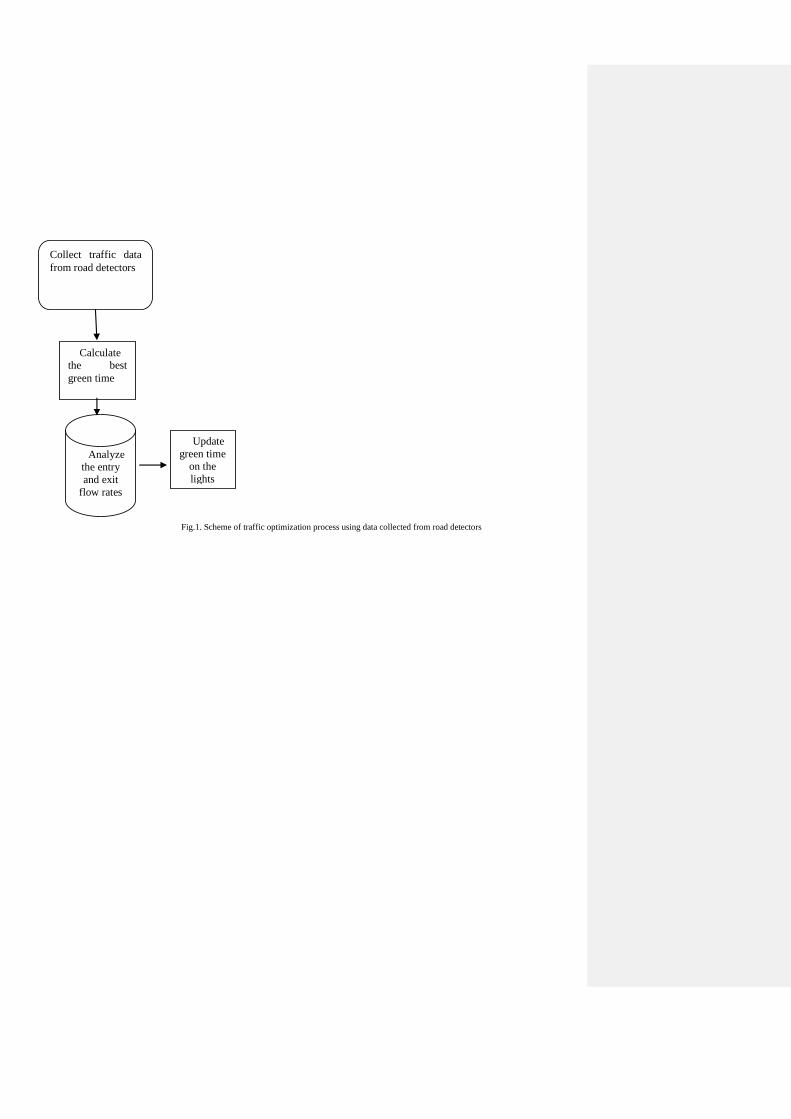
Fig.1. Scheme of traffic optimization process using data collected from road detectors
Analyze
the entry
and exit
flow rates
Calculate
the best
green time
Update
green time
on the
lights
Collect traffic data
from road detectors
Table 1. Example data.
X
Y Y' Y-Y' (Y-Y')2
1 1 1.21 -0.21 0.044
2 2 1.635 0.365 0.133
3 1.3 2.06 -0.76 0.578
4 3.75 2.485 1.265 1.6
5 2.25 2.91 -0.66 0.436
Time
Phas
e1
phas
e 2 T
1
T
2
Cycle time
A
1
A2
Que
ue
FIG.2.sensitivity analysis for two phases intersection
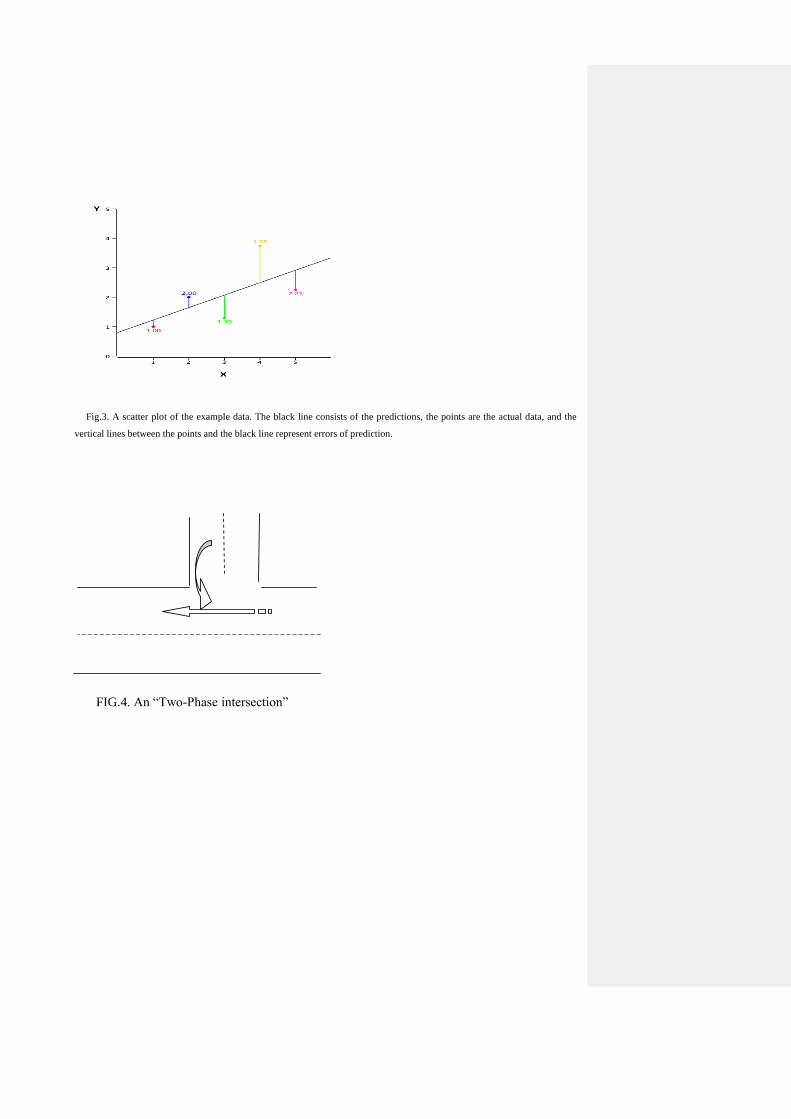
Fig.3. A scatter plot of the example data. The black line consists of the predictions, the points are the actual data, and the
vertical lines between the points and the black line represent errors of prediction.
FIG.4. An ―Two-Phase intersection‖
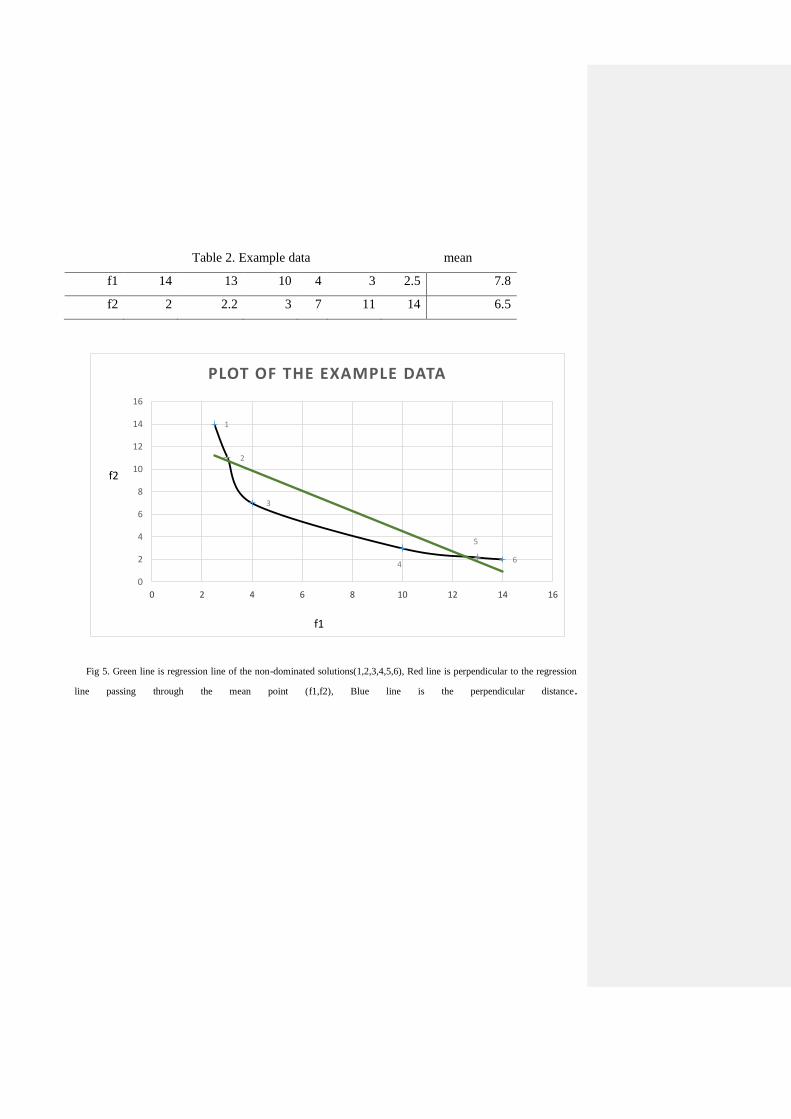
Table 2. Example data mean
f1 14 13 10 4 3 2.5 7.8
f2 2 2.2 3 7 11 14 6.5
6
5
4
3
2
1
0
2
4
6
8
10
12
14
16
0 2 4 6 8 10 12 14 16
PLOT OF THE EXAMPLE DATA
f1
f2
Fig 5. Green line is regression line of the non-dominated solutions(1,2,3,4,5,6), Red line is perpendicular to the regression
line passing through the mean point (f1,f2), Blue line is the perpendicular distance.
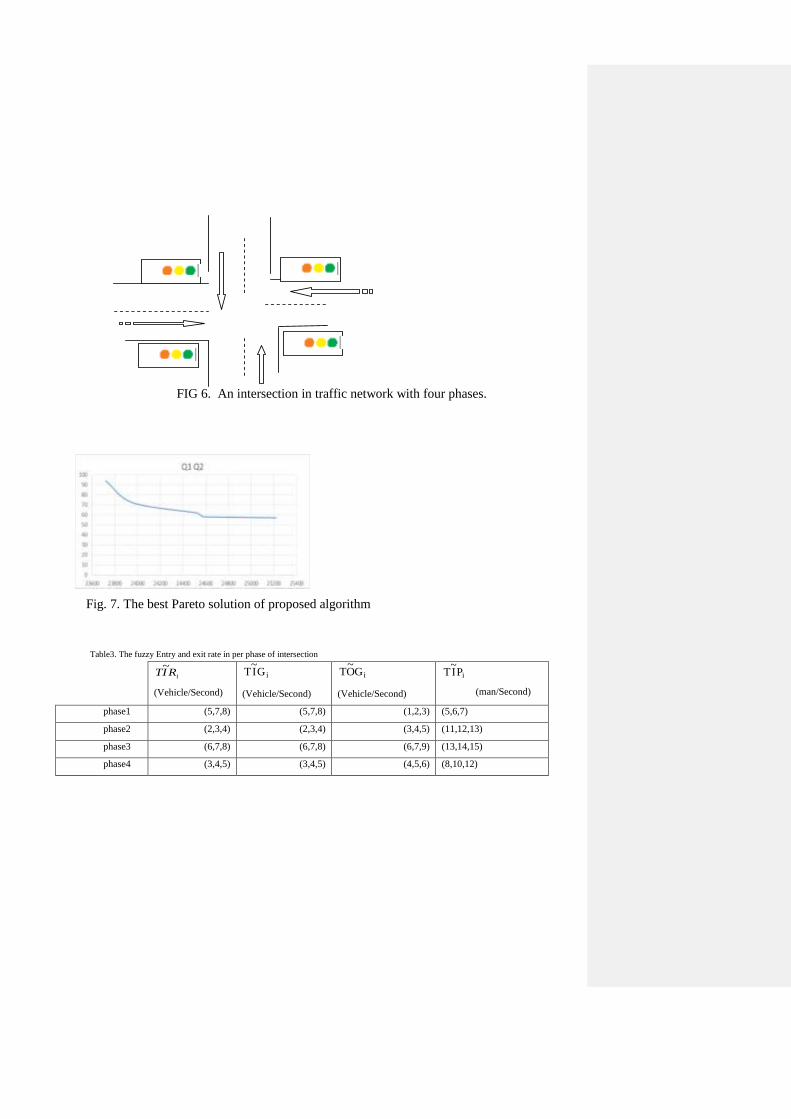
FIG 6. An intersection in traffic network with four phases.
Fig. 7. The best Pareto solution of proposed algorithm
Table3. The fuzzy Entry and exit rate in per phase of intersection
iRIT~
(Vehicle/Second)
iGI~
T
(Vehicle/Second)
iGO~
T
(Vehicle/Second)
iPI~
T
(man/Second)
phase1 (5,7,8) (5,7,8) (1,2,3) (5,6,7)
phase2 (2,3,4) (2,3,4) (3,4,5) (11,12,13)
phase3 (6,7,8) (6,7,8) (6,7,9) (13,14,15)
phase4 (3,4,5) (3,4,5) (4,5,6) (8,10,12)
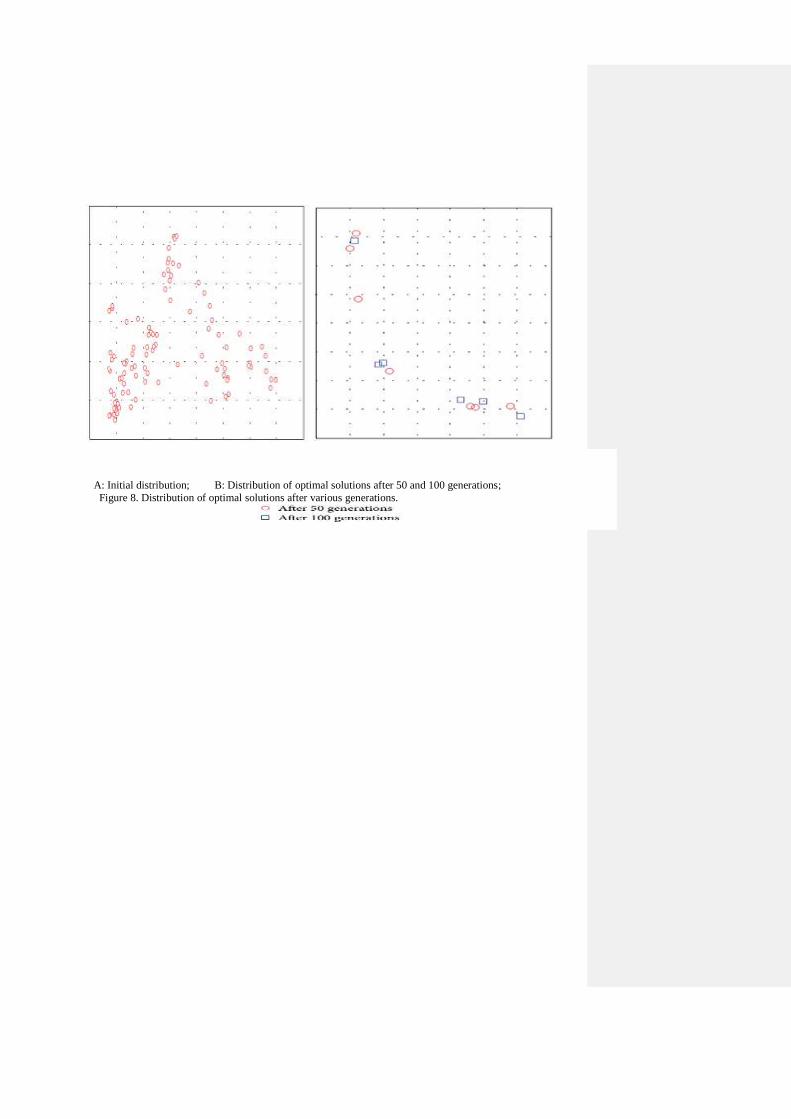
A: Initial distribution; B: Distribution of optimal solutions after 50 and 100 generations;
Figure 8. Distribution of optimal solutions after various generations.
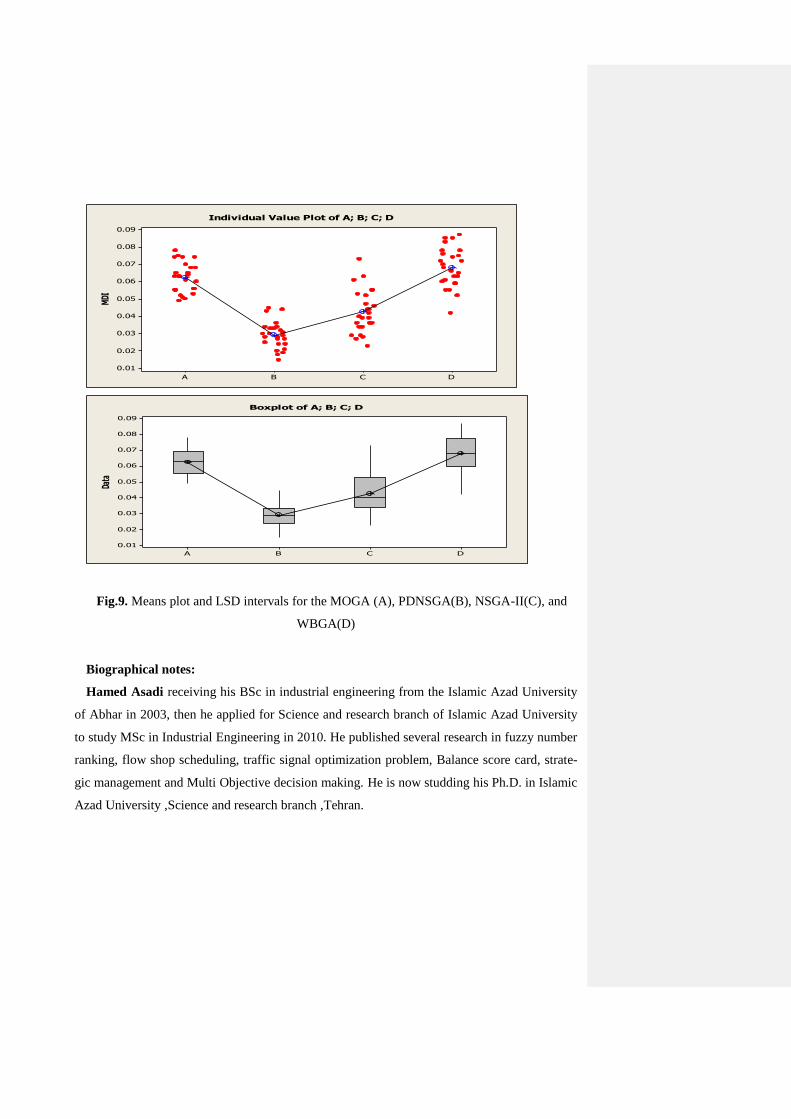
MDI
DCBA
0.09
0.08
0.07
0.06
0.05
0.04
0.03
0.02
0.01
Individual Value Plot of A; B; C; D
Data
DCBA
0.09
0.08
0.07
0.06
0.05
0.04
0.03
0.02
0.01
Boxplot of A; B; C; D
Fig.9. Means plot and LSD intervals for the MOGA (A), PDNSGA(B), NSGA-II(C), and
WBGA(D)
Biographical notes:
Hamed Asadi receiving his BSc in industrial engineering from the Islamic Azad University
of Abhar in 2003, then he applied for Science and research branch of Islamic Azad University
to study MSc in Industrial Engineering in 2010. He published several research in fuzzy number
ranking, flow shop scheduling, traffic signal optimization problem, Balance score card, strate-
gic management and Multi Objective decision making. He is now studding his Ph.D. in Islamic
Azad University ,Science and research branch ,Tehran.
Nasser Shahsavari-Pour is Assistant Professor of Industrial Engineering at the University of
Vali-e-Asr, Rafsanjan, Iran. He received his MS and PhD degrees from Sharif University of
Technology and Tehran Science and Research University in Iran, respectively. He has pub-
lished more than 40 papers in reputable academic journals (JCR and ISI) and conferences.
Esmail najafi : is Assistant Professor of Industrial Engineering at the University in Islamic
Azad University ,Science and research branch, Iran. He received his PhD degrees from Tehran
Science and Research University in Iran, respectively. He has published more than 40 papers in
reputable academic journals (JCR and ISI) and conferences.
Reza Tavakkoli-Moghaddam received his MS degree in Industrial Engineering from Melbourne Uni-
versity, Australia, and his PhD degree from Swinburne University of Technology, UK. He is currently Professor
of Industrial Engineering at Tehran University, Iran. His research interests include facility layouts and location
design, cellular manufacturing systems, sequencing and scheduling, and using meta-heuristics for combinatorial
optimization problems. He is the author of over 100 journal papers and 150 papers in conference proceedings.