a new panel test facility for effective ... - tu-freiberg.de
TRANSCRIPT

Presented at 17th European Conference on Thermophysical Properties, September 5-8, 2005, Bratislava
1
A New Panel Test Facility for Effective Thermal Conductivity Measurements up
to 1650 °C
G. Barth, U. Gross, R. Wulf
Institut für Wärmetechnik und Thermodynamik, Technische Universität Bergakademie
Freiberg, 09596 Freiberg, Germany, email: [email protected]
Abstract
A new steady state panel test facility is presented which has been designed and constructed
for effective thermal conductivity measurements of insulations in the temperature range
between 300 °C and 1650 °C following ASTM C201-93 and DIN V ENV-1094 standards.
Square shaped samples (length 400 mm) are used, heated from above and settled on a water
cooled calorimeter system to obtain a one dimensional steady state temperature field. The heat
is supplied by electrical heating elements freely hanging inside a furnace which is completely
constructed from ceramic components to withstand temperatures up to about 1800 °C. The
calorimeter system consists of a square central measuring zone (length 100 mm) surrounded
by guarding loops to avoid heat losses in all directions. The samples, e.g. a number of fibre
mats one on top of the other up to maximum height 110 mm, are open to ambient pressure and
atmosphere (air). Measurements include heat flow rate (taken in the central calorimeter),
temperature differences across individual layers of the sample (measured by series of
thermocouples which regularly have to be calibrated), thickness of the respective layers
(before and after the experiment). The thermal conductivities range from 0.025 to 2 Wm-1K-1,
and both isotropic and non isotropic materials can be investigated due to the one dimensional
characteristic of the temperature field. Measurements for alumina fibre mats are presented and
good agreement is found with respective results from other methods and test facilities.

Presented at 17th European Conference on Thermophysical Properties, September 5-8, 2005, Bratislava
2
1. Introduction
Development and application of extremely high temperature insulations is a big challenge for
thermophysical properties measurements. Related investigations have been carried out since
more than 25 years by a research group at the Institut für Wärmetechnik und Thermodynamik
(IWTT) of TU Bergakademie Freiberg. Measuring facilities have been designed, constructed
and operated representing various measuring principles. For more details regarding
temperature and thermal conductivity ranges, geometry of the samples etc., see Wulf et al.
(2004, 2005).
Extended experiments showed that non isotropic materials like, e.g., fibre mats are best
investigated with panel test procedures following the standards DIN V ENV-1094 and ASTM
C201/C202/C182 respectively despite the high efforts of the test procedures (Wulf et al.,
2004, 2005). Up to now three generations of panel test facilities have been developed by the
IWTT group following this principle with step-by-step improved construction details and the
maximum application temperature which increased from 1150 °C in the first set up to
1450 °C in the next facility, PMA2, which is still in operation (for more details see Barth et
al. (1995) and Gross et al. (2001)). In this contribution a new facility, PMA4, will be
presented which has been designed and constructed for effective thermal conductivity
measurements of insulations within 0.025 and 2 Wm-1K-1 in the temperature range between
300 and 1650 °C. Due to the chosen measuring principle and arrangement, PMA4
measurements are restricted to porous media containing ambient atmosphere (air) at ambient
pressure.
2. Design and operation of PMA4
2.1 Measuring principle
The panel test facility PMA4 is designed for steady state measurements closely following the
DIN V ENV-1094 standard. A square-shaped plane sample is used (for details see table 1)
uniformly heated and cooled at its upper and lower front surfaces respectively by using
electrical heating elements and cooling water passing through a calorimeter system for the
measurement of heat flow rate Q& . After establishment of a steady state the effective thermal
conductivity can easily be evaluated from the measured temperature difference T∆ across the
sample following

Presented at 17th European Conference on Thermophysical Properties, September 5-8, 2005, Bratislava
3
T
dAQ
eff ∆λ
&= (1)
with A and d as the cross section area and thickness of the sample respectively.
This sounds easy, however, lots of problems have to be overcome with respect to the
establishment of an actually one dimensional heat flow and to the best possible avoidance of
further measuring errors.
2.2 Design
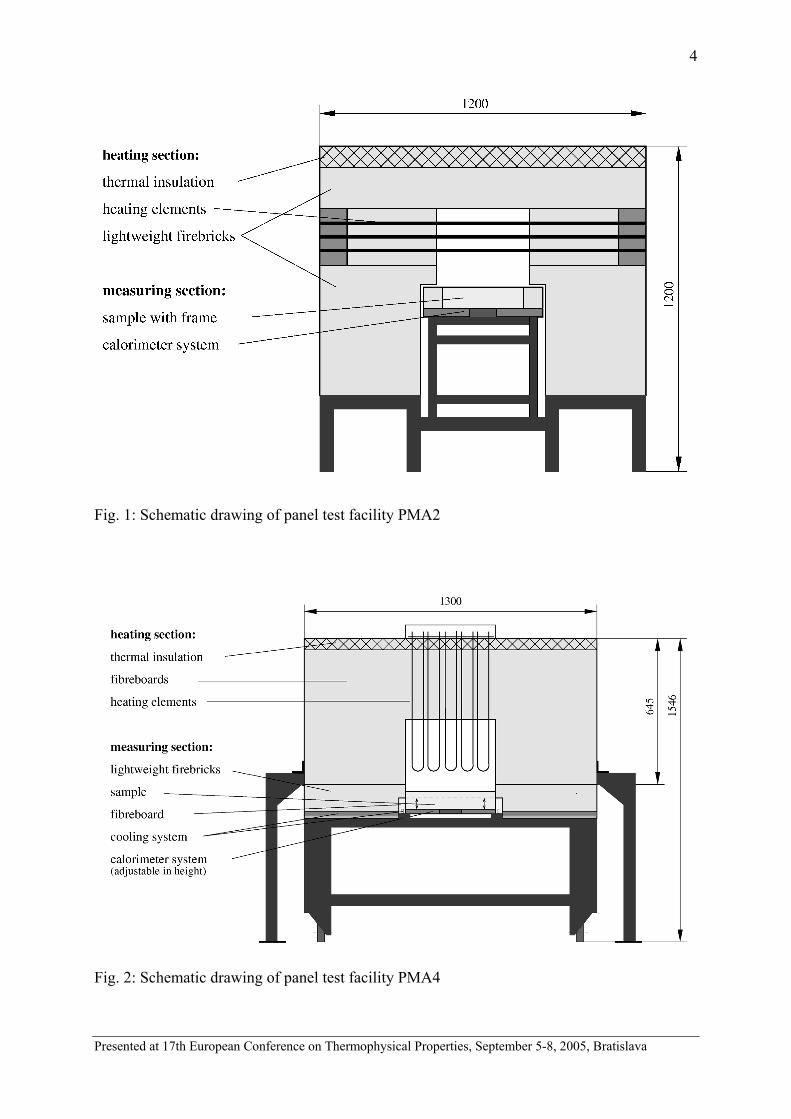
Both facilities, PMA2 and PMA4, are composed of two sections, namely the heating section
as the fixed upper part and the removable measuring section as the lower part. Both of the
facilities differ from each other with respect to the construction principle of the heating
section, applied materials and heating elements, see figs. 1 and 2 and also table 1 with some
details of the design.
PMA2 PMA4
Temperature range / °C 300 to 1450 300 to 1650
Sample dimensions / mm 300 x 300 x 120(max) 400 x 400 x 110(max)
Active cross section / mm 100 x 100 100 x 100
Heating elements
Number
Material
Arrangement
18
SiC
Horizontal
15
Moly-D (U shaped)
hanging vertically
Construction materials
Heating section
Measuring section
lightweight firebricks
lightweight firebricks
ceramic fibreboards
lightweight firebricks
Table 1: Some details of the panel test facilities PMA2 and PMA4
Presented at 17th European Conference on Thermophysical Properties, September 5-8, 2005, Bratislava
4
Fig. 1: Schematic drawing of panel test facility PMA2
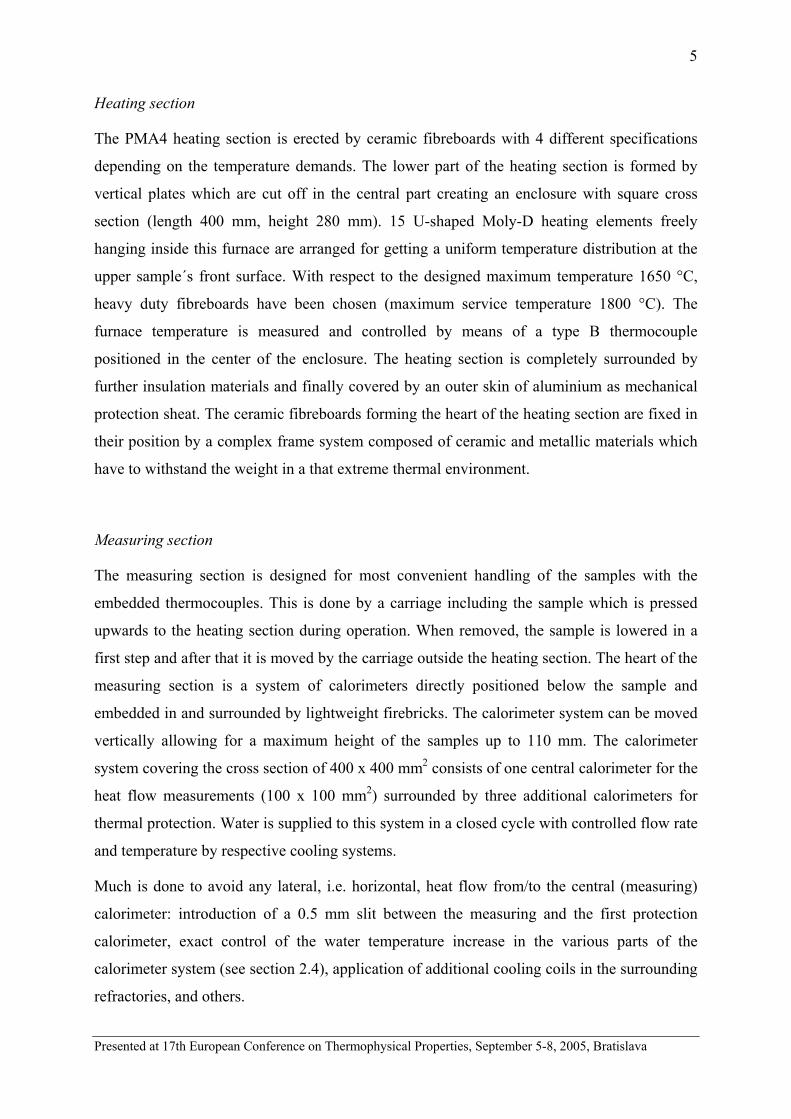
Fig. 2: Schematic drawing of panel test facility PMA4
Presented at 17th European Conference on Thermophysical Properties, September 5-8, 2005, Bratislava
5
Heating section
The PMA4 heating section is erected by ceramic fibreboards with 4 different specifications
depending on the temperature demands. The lower part of the heating section is formed by
vertical plates which are cut off in the central part creating an enclosure with square cross
section (length 400 mm, height 280 mm). 15 U-shaped Moly-D heating elements freely
hanging inside this furnace are arranged for getting a uniform temperature distribution at the
upper sample´s front surface. With respect to the designed maximum temperature 1650 °C,
heavy duty fibreboards have been chosen (maximum service temperature 1800 °C). The
furnace temperature is measured and controlled by means of a type B thermocouple
positioned in the center of the enclosure. The heating section is completely surrounded by
further insulation materials and finally covered by an outer skin of aluminium as mechanical
protection sheat. The ceramic fibreboards forming the heart of the heating section are fixed in
their position by a complex frame system composed of ceramic and metallic materials which
have to withstand the weight in a that extreme thermal environment.
Measuring section
The measuring section is designed for most convenient handling of the samples with the
embedded thermocouples. This is done by a carriage including the sample which is pressed
upwards to the heating section during operation. When removed, the sample is lowered in a
first step and after that it is moved by the carriage outside the heating section. The heart of the
measuring section is a system of calorimeters directly positioned below the sample and
embedded in and surrounded by lightweight firebricks. The calorimeter system can be moved
vertically allowing for a maximum height of the samples up to 110 mm. The calorimeter
system covering the cross section of 400 x 400 mm2 consists of one central calorimeter for the
heat flow measurements (100 x 100 mm2) surrounded by three additional calorimeters for
thermal protection. Water is supplied to this system in a closed cycle with controlled flow rate
and temperature by respective cooling systems.
Much is done to avoid any lateral, i.e. horizontal, heat flow from/to the central (measuring)
calorimeter: introduction of a 0.5 mm slit between the measuring and the first protection
calorimeter, exact control of the water temperature increase in the various parts of the
calorimeter system (see section 2.4), application of additional cooling coils in the surrounding
refractories, and others.

Presented at 17th European Conference on Thermophysical Properties, September 5-8, 2005, Bratislava
6
2.3 Sample temperature measurements
The PMA4 measuring device is designed for plate and mat shaped insulations with a cross
section of 400 x 400 mm2. Within the total height of 110 mm several samples can be used one
on top of the other with respective temperature measurements above, below and in between.
Doing this, two or more measuring points can be obtained from one steady state experiment
by evaluation of the readings for the various layers at different mean temperatures. For these
measurements 5 thermocouples are fixed in each of the cross sections where type K and B
elements are used below and above 1000 °C respectively being regularly calibrated before
and after application. As an example a three sample arrangement is shown in fig. 3 enabling
data logging and evaluation for the upper two ones.
Fig. 3: Arrangement of thermocouples for a sample consisting of three layers

Presented at 17th European Conference on Thermophysical Properties, September 5-8, 2005, Bratislava
7
2.4 Heat flow measurements
The heat flow rate Q& vertically passing through the sample is measured by means of the
calorimeter system
( ) ( )waterwaterpwater TcVQ ∆ρτ∆
=& (2)
with waterV as the volume of a measuring cylinder and τ∆ as the time to fill it between two
levels given by two electric resistance sensors. Before starting a water flow rate measurement
the difference of the outlet temperatures of the measuring and the first protection calorimeter
is controlled to be zero by respective variations of the flow rate. By this, optimum adiabatic
conditions are realized for the central calorimeter as both of the calorimeters contain
meandering channels being in parallel, with the inlet positions but also the outlet positions
close to each other. This important temperature difference is measured by a series of three
type J thermocouples, and the temperature increase ( )waterT∆ in the central part by a
respective series of five type J elements as well.
2.5 Control and data aquisition
The various systems for control and organization of the measuring procedure and for the
measurements are operated in a completely automatic way. Two PCs, one for control and
operation, the other one for the measurements, communicate with each other and additionally
with the temperature control unit of the heating device. By this, not only the sample
temperature measurements and the step-by-step temperature increase and decrease
respectively are organized but also the measuring and adjusting processes for the calorimeter
system. All results are available online enabling the plot of spacial and temporal temperature
profiles and also the complete data evaluation and documentation.
One typical measuring series consists of a stepwise increase of the furnace temperature up to a
given maximum value including respective intermediate steady states for the measurements.
The duration of such a series typically amounts to more than 7 days in the automized version.
Respective protection systems for, e.g., emergency cooling allow the facility to be run 24
hours and 7 days a week with online information by internet about status and measured
results.

Presented at 17th European Conference on Thermophysical Properties, September 5-8, 2005, Bratislava
8
3. First experiments and numerical simulation
Experiments
For the first tests a ceramic fibreboard has been used as a three layer sample with the total
height 92 mm. The regular set of thermocouples (see section 2.3) has been supplemented by
additional temperature sensors outside the central (measuring) cross section to obtain more
informations about the temperature profile. In these experiments the heating rate war chosen
to be 0.5 Kmin-1 with 8 steady state interrupts. After finishing the first run, a visual inspection
of the furnace (heating section) brought a couple of cracks as expected which proved to
stabilize in the next few experiments without negative effects on the operation.
Detailed evaluation of the measured temperature histories shows the establishment of a steady
state after roughly 8 or 10 hours. The readings of the respective five thermocouples in one
measuring cross section are regularly found to keep within the limits of accuracy (for example
± 4K for type B elements at 1600°C). Outside this central region the temperatures begin to
decline symmetrically in radial direction. This finding is supported by slight concentric
modifications of the refractory surface colour at the upperside of the measuring section.
Accuracy and sensitivity of the calorimetric heat flow measurements have been checked for
by varying water flow rates and respective temperature increases. The water temperature
difference ( )waterT∆ decreases with the furnace temperature due to the simultaneously reduced
heat flow rate Q& , and 500 °C should be regarded as the lower limit of the furnace temperature
for effective thermal conductivity measurements with the PMA4. Below that, the uncertainty
of the water temperature difference measurement starts to increase sensibly. Nevertheless, the
limiting furnace temperature (500 °C) allows thermal conductivity measurements at the mean
temperature of about 300 °C in the lower layers of the sample.
Numerical investigations
These first experiments have been supplemented by a 3D finite element (FEM) simulation of
the measuring facility using a commerical code by MSC-MARC. With the temperature
dependent properties taken from producers´ catalogues and from own measurements with
different facilities, steady state temperature and heat flux distributions have been obtained.
These results will not be discussed here in detail, however, important findings and
conclusions will be summarized now:
Presented at 17th European Conference on Thermophysical Properties, September 5-8, 2005, Bratislava
9
- Validation: Lots of additional thermocouples have been installed inside the PMA4 in
course of the construction for to get more information about establishment of the
steady state, but also for validation of the FEM simulations. All the measurements
inside and close to the sample and also inside the surrounding heating section show
excellent agreement with the FEM calculations. Some deviations are found at far away
locations in the outer parts of the measuring section which probably are due to
questionable data for the refractories as taken from producers´ catalogues.
- Temperature distribution inside the sample: The isotherms have been confirmed to be
exactly plane surfaces being parallel to each other and also to the upper side of the
calorimeter. This holds for the central part, and the deformation of the isotherms
(decreasing temperatures) clearly begins outside the measuring cross section.
- Heat flow distribution inside the sample: Temperature gradients orthogonal to the
vertical (measuring) direction would yield lateral heat losses bringing erroreous
measuring results. All the FEM simulations with wide ranging parameter variations
confirmed the unidirectional character of the heat flow in the central (measuring) part
of the sample with lateral heat losses only far outside this region.
4. Effective thermal conductivity results with fibre mats
After finishing the first experiments and numerical studies, PMA4 was part of an extended
research project where commercial insulations have been investigated with various thermal
conductivity measuring devices (see Wulf et al., 2004, 2005). A comparison of
aluminosilicate fibre mat measurements (maximum service temperature 1250 °C) showed
very good agreement of all panel test results including those from PMA4 (see Wulf et al.,
2004).
Further measurements have been focused on materials with a higher application temperature
(i.e. alumina fibre mats, 72 % Al2O3, maximum service temperature 1650 °C). Ageing proved
to be a very serious problem for the uppermost thermocouples where a strong drift of the
reading was found after repeated application above 1300 °C which is thought to be due to
diffusion processes. Some of the first measured series had to be repeated and after that only
new thermocouples have been used for such sensible locations. Regular calibration of all the
applied thermocouples is a must.

Presented at 17th European Conference on Thermophysical Properties, September 5-8, 2005, Bratislava
10
Fig. 4: PMA4 measurements: thermal
conductivity of an alumina fibre mat
(bulk density 60 kg m-3)
Fig. 5: PMA4 meaurements: thermal
conductivity of alumina fibre mats in
comparison with PMA2 results

Presented at 17th European Conference on Thermophysical Properties, September 5-8, 2005, Bratislava
11
Figs. 4 and 5 show some of the results measured with a three layer sample with individual
thicknesses of 23 to 24 mm and the furnace temperature up to 1650 °C. The respective
measurements have been taken for increasing and decreasing temperatures as well. Depending
on the three layer arrangement two series of results have been obtained with excellent
agreement, one for the upper and one for the intermediate layer with the maximum mean
temperatures 1500 °C and 1250 °C respectively (fig. 4). These results are supplemented
(fig. 5) by respective PMA2 results (maximum furnace temperature 1300 °C) and additional
data for larger bulk densities are included. For the latter ones the scattering of data proved to
be much stronger, a behaviour which can be attributed (see Wulf et al., 2004, 2005) to the
general experience of strong local density variations in these fibre mats. The uncertainty of
the measurements has been evaluated to be within 1.6 and 6.2 %, following GUM (1995).
5. Advanced evaluation – ´true´ vs. ´mean´ thermal conductivity
Thermal conductivities of high temperature porous media measured with various methods
occasionally exhibit different results. This can partially be due to the relatively high
temperature difference within the sample leading to the mean effective thermal conductivity
( ) ( )dTTTT
1T1
2
1
2
T
Teff
21
T
Teffmeaneff ∫−== λλλ (3)
In contrary to steady state procedures, transient hot-wire measurements are performed at
nearly constant temperature yielding results which occasionally are called ´true´ thermal
conductivity (Krönert, 1987 and Anderson/Mikkelson, 2000). The difference between ´mean´
and ´true´ values may grow very large in cases of a strong non linear conductivity vs.
temperature relationship and, additionally, for big temperature differences within the sample.
Both, the comparison of results from two different sources and also the practical application
of measured data is asking for transformation of ´mean´ into ´true´ values by respective
advanced evaluation of measured data. Bolte (1957) was the first to suggest a procedure for
the point-by-point transformation based on the temperature relationship ( )12 TfT = for the
sample with 1T and 2T as the hot and cold side temperatures respectively and additionally
based on the knowledge of the ´true´ thermal conductivity ( )2eff Tλ for the lower temperature
limit which is, however, usually not available.

Presented at 17th European Conference on Thermophysical Properties, September 5-8, 2005, Bratislava
12
An advanced evaluation procedure can be applied if the type of function ( )Teffλ in eq.3 is
available, e.g., from the physical background. There will be some unknown parameters in it
which easily can be adjusted by application of the mean square error minimization method
upon eq.3 to minimize the difference of measured (left hand side) and calculated thermal
conductivities (right hand side):
( ) ( ) ( ) imummindTT,..,c,b,aTT
1T,..,c,b,af
2k
1i i
T
Teff
i
T
Teff
21
1
2
1
2
→⎥⎥⎦
⎤
⎢⎢⎣
⎡−⎟
⎟⎠
⎞⎜⎜⎝
⎛
−= ∑ ∫
=
λλ (4)
A common function type for the effective thermal conductivity of fibre mats is suggested,
e.g., by the DIN V ENV-1094 standard
( ) 3eff bTTaT +=λ (5)
representing the superposition of gas phase conduction and radiation. Easily it can be shown
mathematically, that for this type of function the ´mean´ thermal conductivity is always langer
than the ´true´one.
This prediction is also valid for insulations like calcium silicate, but
( ) 3eff cT
T1bTaT ++=λ (6)
is here the more appropriate function type including additional contributions of the solid
(crystal) phase. With this, the difference between ´mean´ and ´true´ values is smaller as the
function type is more similar to a linear relationship. Anyway, the decisive role is played by
the temperature difference across the sample. Due to the arrangement (see section 2.3) of the
various layers temperature differences keep relatively small and subsequently the differences
between measured mean values and the thermal conductivities from the advanced evaluation
are small keeping regularly below 1 % for layer thickness around 25 mm which is typical for
the PMA4 measurements, however, rising up to 4 and 5 % in case of 50 mm. For most of the
measurements there will be no need for the efforts of advanced evaluation.
6. Conclusions
Design and operation of a new panel test facility for effective thermal conductivity
measurements of insulations is reported. First tests showed the successful operation up to the
maximum temperature of 1650 °C. Design and construction has been accompanied by

Presented at 17th European Conference on Thermophysical Properties, September 5-8, 2005, Bratislava
13
numerical simulations which confirm the correctness of boundary conditions and further
assumptions of the method. First experimental thermal conductivity results show good
agreement with respective measurements from other facilities.
Acknowledgement
The financial support of design, construction and testing of the PMA4 facility by the Saxony
Government is greatly appreciated. Furthermore the authors like to express their thank to Dr.
Hans Gründler for his valuable contributions for design.
References
Andersen F B, Mikkelsen J, 2000: Thermal Conductivity Measurements of Cathode Insulation
Materials. Light Metals 429 -435
Barth G, Gross U, Staudte W, Gründler H, 1995: High–temperature test facility for thermal-
conductivity measurements of insulation. Proc. of Eurotherm Seminar 44
Bolte W, 1957: Die Bestimmung der wahren Stoffeigenschaften aus den mittleren, besonders
bei der Wärmeleitzahl. Brennstoff-Wärme-Kraft 9 373 – 375
Gross U, Barth G, Wulf R, Tran L T S, 2001: Thermal conductivity of non-isotropic materials
measured by various methods. High Temperatures - High Pressures 33 141 – 150
GUM 1995: Guide to Expression of Uncertainty in Measurement International Organization
for Standardization (Schweiz)
Krönert, W, 1987: Vergleichende Beurteilung von Wärmeleitfähigkeitsdaten. Keramische
Zeitschrift 39 [10] 691 - 694
Wulf R, Gross U, Barth, G, 2004: Wärmeleitfähigkeit keramischer Fasermatten –
vergleichende Messungen mit unterschiedlichen Methoden. Keramische Zeitschrift 56 [9/10]
554 – 561
Wulf R, Gross U, Barth, G, 2005: Intercomparison of Insulation Thermal Conductivities
Measured by Various Methods. European Conference on Thermophysical Properties
Bratislava