a new perspective on climate change and … · a new perspective on climate change and variability:...
TRANSCRIPT

.
Proc Indian Natn Sci Acad, 69, A, No.5, September 2003, pp. 585-602@ Printed in India.
A NEW PERSPECTIVE ON CLIMATE CHANGE ANDVARIABILITY: A FOCUS ON INDIA
R A PIELKE Sr.*, D DU1TA S NIYOGI, T N CHASE AND J L EASTMAN
1371, Campus Delivery, Department of Atmospheric Science, Colorado State University,Fort Collins, CO 80523-1371 (USA)
(Received 07 August 2002; Accepted 18 October 2002)
Our paper overviews the global context of climate change in terms of the Earth's heat budget. It is shownthat the Earth's climate system, as tl1e major store for heat, has warmed less than suggested by the IPCC reports.In terms of top of the atmosphere radiative\heating, the globally-averaged radiative imbalance between 1955-1995 is about 0.3 W m-2.
Then we focus on India and discuss the role of land-use change, vegetation dynamics, and aerosols inaltering the regional climate on India. The current and natural landscape of the region is illustrated with 50kIn horizontal grid scales and the effect on India's weather and climate is simulated using the NCAR CCM3GCM. .
Using NDVI satellite data, vegetation growth is shown to be closely correlated with precipitation thatfell two months earlier. Aerosols are shown to significantly alter the direct and diffuse sunlight that reachesvegetation, which subsequently has an effect on carbon assimilation and transpiration. Population increases arepresented as a primary driver of these regional climate changes in India.
,Key Words: Regional Climate; Earth's Heat Budget; Climate Change; Indian Climate; Regional AerosolEffects; Regional Land-use Change Effects; Regional Vegetation Dynamics
1 Introduction
This article begins with a discussion of climate inthe context of Earth system heat storage changes.It builds on the discussion in Pielkel, in which heatis shown to be an appropriate metric to assess theclimate system. When the term "global warming" isused, for example, heat in units of Joules is theappropriate metric to use. Among the conclusionsis that the Earth system has not warmed as muchas implied by the IPCC2. Indeed it is spatialredistribution of heat by such effects Qf land-usechange and anthropogenic aerosols which appear toexert a larger human influence on the Earth climatesystem than the radiative effect of doubling of carbondioxide concentrations, as recently summarized inPielke et ai.3. This issue is illustrated in this article,with a particular emphasis on India.
2 Global Perspective
This section describes how an examination of theglobal heat budget allows a straightforward explanationfor understanding one of the consequences of humanchanges in the composition of the Earth's atmosphere.Data and analysis provided in Levitus et ai.4.5 onincreases in heat stored within the world's oceansprovide a unique opportunity to explore this perspective.The use of a global heat budget to assess thisconsequence of hu~an perturbations of the Earth"system was also introduced by Pielkel.
This section expresses the Levitus et ai.4.5 data interms of long-term, globally-averaged values of heatflux (W m-2), and relates the fluxes to the radiativeforcing of the Earth's climate system. These fluxesprovide a constraint on estimates of radiative forcingsuch as provided by the Intergovernmental Panel onClimate Change (IPCC). Such an assessment of theglobal heat budget was provided in Peixoto and Oort6,based on the study of Ellis et ai. 7, but this perspectiveis not appropriately utilized in the IPCC reports.*Author for Correspondence. Email: [email protected]

'R
A PIELKE et at.586
The Levitus et al. data provide an opportunity toassess the portion of this radiative forcing which isactually warming the Earth system. To do this, theLevitus et al. ocean data is reported in W m-2.Expressingtheir data in this manner provides a constraint on thenet radiative forcing that Tesults from the terms listedin Fig. 3 of the Statement for Policymakers.
The heat budget for the Earth system can beexpressed as
ff RN dAdt = ff Q dVdt+ ff Q dVdt
t.A&rth t,Vatmos t,Vocean ...(1)
+ other heat reservoirs
A few terms used in this article are worthhighlighting at the onset. Radiative forcing is definedby the IPCC as
"a measure of the influence a factor has in alteringthe balance of incoming and outgoing energy in theEarth-atmosphere system, and is an index of theimportance of the factor as a potential climate changemechanism. It is expressed in W m-2."
We ~se the additional terms as follows. Equilibriumradiative forcing refers to the portion of an increaseor decrease in radiative forcing that has resulted in achange in the Earth system such that the outgoingradiative fluxes have become equal in magnitude tothe incoming fluxes. Non-equilibrium radiative forcingis the remaining portion of the radiative forcing whichis still warming (or cooling) the Earth system. Non-equilibrium radiative forcing is also referred to as theradiative imbalance of the Earth's system. In thecontext of climate sensitivity, heat storage within theEarth system changes when there is a radiativeimbalance. Heat content refers to the internalenergy contained within the Earth system and isexpressed in Joules. The heat budget equation forthe Earth system expresses the change of heat contentas a result of fluxes of heat into and out of the system,which is simply a statement of the conservation ofenergy. The heating rate refers to the introduction(or removal) of energy from the Earth system perunit of time. The radiative flux divergence is theterm used to describe the differences in the radiativefluxes integrated across any time period.
The IPCC presents estimates of the change inradiative forcing of the climate system between 1750and 2000 (presented in Fig. 3 of the Statement forPolicymakers2). Uncertainty values are presentedfor each forcing. The global mean radiative forcingof the climate system for 2000, relative to 1750associated with well-mixed anthropogenic greenhousegases (primarily carbon dioxide and methane) is 2.43W m-2. The direct aerosol effect is -0.5 W m-2,tropospheric and stratospheric ozone effects are +0.35and -0.15 W m-2, respectively, and a change in solarheating of 0.3 W m-2 was also estimated, with most ofthe increase in the early 20th Century. The total radiativeforcing due to these effects is +2.43 W m-2. The indirecteffect of aerosols is estimated as -1 W m-2, (but withan uncertainty from 0 to -2 W m-2). Thus a continuousrate of 1.43 W m-2 of radiative forcing (i.e., 2;43 '- 1
= 1.43 W m-2) would correspond to a transfer of 2.30x 10²³ J of energy per decade into the climate system.
where RN is the global mean non".equilibrium radiativeforcing, AEarlh is the area of the Earth, Q is the heatingrate, Va,mosisthe volume of the atmosphere1and Voceanis the volume of the ocean.
Since the troposphere encompasses about 80%, ofthe mass of the atmosphere, eq. (1) can also beintegrated from the tropopause downward in order torelate more closely to the IPCCperspective of radiativeforcing of the Earth system. It is important to note thatRN is not ilie quantity discussed in the IPCC,Statementfor Policymakers2, but is .the instantaneous radiativeflux divergence. Temperatures regionally within theEarth system can change without a change in the leftside of eq. (1). Cooling in one region can occur withwarming elsewhere. However, unless the global meannon-equilibrium radiative forcing is non-zero, therewill be no Earth system integrated heat change.
When the Earth system experiences a radiativeforcing change, after some time the system respondsby reaching a new thermal equilibrium states.Thus, for any change in radiative forcing, there willbe two components: ihe fractional portion of theequilibrium response, which has been achieved, andthe remaining radiative imbalance. The equilibriumcomponent is reflected in changes in the Earth systemheat that have already occurred, and the imbalancecomponent refers to heating or cooling of theEarth system which continues.
When considering the anthropogenic greenhousegas radiative forcing felt by the Earth since 1750, andbecause some portion of that forcing has alreadyresulted in warming the Earth, the non-equilibriumforcing, RN, is the relevant term for calculating changesfrom the present to some point in the future. Thisquantity is approximately equal to the additional heatstored in the ocean. Following Levitus et ai.4, other

A NEW PERSPECnVE ON CLIMATE CHANGE AND VARIABILITY 587
The Levitus et al.4 data have large positive andnegative amplitudes over the time period from the earl y1950s to the mid 1990s. Satellite observations andmodels need to fesolve this variability in order toimprove our confidence in those tools.
One interesting consequence of displaying the datain terms of eq. (1) is that if a time period had zeroheat storage change in the Earth system, there wouldbe no "unrealized warming", such as dis~ussed, forexample, by Wetherald et al.ll. The cbncept encapsulated by the term "unrealized heating" moreappropriately refers to storage of heat in a non-atmospheric reservoir (i.e., primarily the ocean), withthe "realization" of the warming only occurring whenthere are interfacial transfers of heat into the atmosphere.
Short-term radiative imbalances' can also beassessed. The effect of the Pinatubo volcanic eruptionof 1991, for instance, produced a radiative fluxdivergenceof-4 W m-2inAugustand September 1991,which gradually reduced to zero by MiIch 199312. .Thiseffect resulted in a reduction of 5.64 x 10²² Joules ofheating within the Earth system [according to eq. (1)].
When presenting observations, it is important toassess the accuracy of the observational data. Levitus(2001, personal communication) has concludedthat the "decadal" variation in the upper 300 metersis real. Below 300 meters the amount of data decreaseswith depth which is why the Levitus et al.4 paperused 5-year running means. Thus their data shouldbe interpreted as more of a challenge to modelersand observationalists than a confident diagnosis ofthe actual variations in heat content of the ocean ondecadal time scales.
Over the period of observational record (1955-1995), the Levitus et al.4 data produces an averageheating rate of about 0.3 W m-2. The model values ofBarnett et al.13 and Levitus et al.5 are close to the long-term value. However, the large decadal variability inthe observations should raise concerns as,to whetherthe models' long-term agreement with observations onthis time period occurs for the right reasons. Moreover,from this perspective, the IPCC should presentthe magnitudes of planetary energy imbalancesimulated by all of the models used in the IPCC '.
To be able to predict future climate change, inprinciple, it is necessary to be able to evaluate the actualcurrent and future heating of the climate system fromanthropogenic and natural sources as well as wherethis heat is accumulating. For example, if heat is storedin the ocean at depths greater than 3 kIn (where
heat reservoirs, such as sea ice and continental icesheets, are assumed to be inconsequentially small.Thus, the radiative forcing of the system is a resultof the left side of eq. (1). The first term on the rightof eq. (1) is observed to be small (and essentially zerofrom 1979-2001; http://www.ghcc.msfc.nasa.gov/temperature) .
The use of eq. (1) provides an alternativ~perspectiveto the concept of effective climate sensitivity, in whichtemperature is used as part of the analysis. As discussedin Raper et al.9 following their eq. (1), for example,a global average surface air temperature along witha climate feedback parameter are used to evaluate thesensitivity of the Earth system to atmospheric radiativeforcing. With eq. (1) of this commentary, however, theissue of feedback does not need to be estimated, sincea closed heat budget is expressed by that equation.
The IPCC Statement for Policymakers2 is missingimportant information because it fails to distinguishequilibrium from imbalance radiative forcing as mostof the radiative forcing portrayed has already beenrealized in the climate system. The labelling of the leftaxis with the terms "warming" and "cooling" couldbe misinterpreted to mean that the entire listed radiativeforcing is continuing to warm or cool. A figure isneeded that portrays the actual current radiative forcingto the climate system that is felt at any particular time,in this instance in 2000. As this planetary energyimbalance is virtually the same as the energy storedin the top 3 km of the oceans, and other energy storesin the climate system are much smallerS, we canexamine either the global mean non-equilibriumradiative flux or the ocean storage to evaluate thisquantity. Peixoto and Oort (see ref. [6], page 351) evenconcluded that such a relation exists between theradiative forcing and ocean heat storage over the annualtime scale. They showed that the agreement betweenthe annual variations of net radiation at the top of theatmosphere is in good agreement, both in phase andamplitude, with the ocean heat storage.
The construction of such a figure using RN wouldrequire, for instance, knowledge of the net flux atthe top of the atmosphere, averaged over the entireplanet and averaged over a year, or instantaneouslymeasured. In either case, direct observation of thisquantity is difficult, given the required precision(0.1 W m-2). An alternative approach is to use a modelto calculate this quantity, however, the entire suite ofclimate forcings and feedbacks are not yet includedin the models, as discussed by Pielkel.1o.
R A PIELKE et at.588
Levitus et at. data up to the present and achievingannual time resolution. The reduction of theuncertainties in the global lI:tean radiative forcing isalso a clear priority. This requires improved monitoringof the agents of "this forcing, including aerosols andtheir influences on cloud microphysical processes..
Thus, there are several major reasons that theassessment of the Earth system's heat budget is sovaluable..Earth's heat budget observations, within the limits
of their representativeness and accuracy~ prov~ean observational constraint on the radiative for8ingimposed in retrospective climate modelling.
.A snapshot at any time documents the accumulatedheat storage and its change since the last assessmen~.Unlike temperature, in which there is a time lagafter a heat change is imposed before thetemperature would reach an equilibrium value,there are no time lags associated with heat changes.
.Since there is little heat storage associatedwith the surface temperature, its application as amonitor of Earth system climate change is notuseful in evaluating the heat storage changes ofthe Earth system. The heat storage changes,rather than surface temperatures, should beused t8 determine what fraction of the radiativefluxes at the top of the atmosphere are in r~diativeequilibrium. Of course, since surface tempe~turehas such an important impact on human activities,its accurate monitoring should remain a focus ofclimate researchl8.However, as discussed in Pielke et al.3 and Pielkel6
it is not only the net energy imbalance globallywhich is an important climate indicator; it appearsthat the spatial redistribution of energy has asignificant, perhaps dominant, effect on the Earth'sclimate. In the following section, we discuss this issuewith respect to India.
3 Examples of Regional Climate Change andEnergy Redistribution Mechanisms
Affecting India
While the data shows a positive overall net planetaryenergy imbalance since the 1950s, the climate of Indiahas undergone a much more complicated set of changeswhich could not be diagnosed by the globally-averagedheat budget. Here we discuss these complications andsome of the processes that may affect regional energydistribution. In the Asian monsoon region, several veryeffective studies of regional climate have beenperformed, as summarized by Fu et al.18. Papers
observations were not reported in the Levitus et al.studies), instead of lost to space, this could beaccomplished through relatively small-scale areas ofvertical turbulent mixing and three-dimensionalcirculations, which the coarse spatial resolution of theGCMs data might not be able to adequately simulate.Moreover, the latest assessment of ~opospheric heat(July 2002) shows that the atmospiCre has rfiturnedto near its 1979 value, after the warm recent ENSOevent. This rapid cooling of the atmosphere, inconjunction with the Levitus etal.4.5 studies, indicatethat a scientific priority should be to precisely observethe global ocean heat content.
An assessment of the heat storage within theEarth's climate system offers a unique perspective onglobal change. If the heat actually remains within theEarth system in the deeper ocean, for example, whilethe heat content of the remainder of the heat reservoirsin the Earth system remains unchanged, sudden transfersof the heat between components of the system (fromthe ocean into the atmosphere) could produce rapid,unanticipated changes in global weather. Similarly,relatively large warming and cooling radiative forcings(e.g., well-mixed greenhouse gases and the indirecteffect of aerosols) could be in near balance at present,suggesting that sudden climate changes could occurif one of these forcings becomes dominant. On theother hand, if a large portion of the increased radiativefluxes are lost to space, as the atmosphere adjusts, suchas through a change in cloud cover (see ref. [14]), thiswould suggest that the climate system is relativelymore resilient to continued anthropogenic heatingeffects than conventionally assumed.
The IPCC would present a more scientificallyrobust picture of the anthropogenic effect on theclimate system by presenting a figure in terms ofplanetary energy imbalance in which observed changesin heat within the Earth system would be used toconstrain the global mean radiative forcing. Therelatively small accumulation of heat within theEarth's climate system to date also elevates thesignificance of anthropogenic land-use change asan influence on the global and regional climate asdiscussed later in this article15-17, since this changeappears to alter the long-term global atmosphericcirculrtion even though the net average globalchanges in heat content may be small.
The assessment of the heat storage and its changesover time should be a focus of international climatemonitoring programmes. This includes extending the

A NEW PERSPECTIVE ON CLIMATE CHANGE AND VARIABILITY 589
We performed model simulations using the NationalCenter for Atmospheric Research Community ClimateModel (NCAR CCM3) in order to investigate theeffect of observed historical land-cover change onIndian Climate. Because the Indian subcontinent isstrongly affected by large, hemispheric.scalecirculations such as monsoons and Walker.Hadleycells, we explored the effect of regional land.coverchange depicted in Fig. 1. Shaded cells in the figurerepresent deviations from natural (i.e., agricultural) ~vegetation. It has been shown in the past thatglobal changes in historical vegetation can have largeclimatic effects both regionally and at far throughatmospheric teleconnections and shifts in large-scalecirculation featUres (e.g, refs. [15],[28]).
Fig. 2 shows the 12.year average differenc~ innear-surface temperature between the current GCMsimulation and the natural vegetation GCMsimulation produced by the land-cover changes shownin Fig. 1. Statistically significant changes at the 10 and5% levels are shaded in light and dark, respectively.Significance is assessed using a t-test and substantiallymore than 10% of the area is affected by significantchanges in temperature. Most of the Maritimecontinent and southeast Asian peninsula showssignificantly increased temperature during thismonth. The majority of India, however, showscooling. The average temperature change in the areaindicated, by the dashed line box in Fig. 2 is 0.07°C.
Simulated precipitation changes resulting from theland.coverchangesinFig.1 are shown in Fig. 3. Again,significant regional shifts in precipitation occur overmuch of southeast Asia and the Maritime continent.Precipitation decreases over much of the Indian landarea and increase significantly in the Bay of Bengal.The precipitation change over the entire dashed boxin Fig. 3 is negligible as the positive anomalies overocean areas and the negative anomalies over land verynearly cancel out. These precipitation changes on aseasonal scale can potentially cause significant changesin the vegetation greenness and natural landscapes,which in tUrn have a feedback on the regional climate.This issue is discussed in the following section.
reported on include Xuel9, Wei et al.20, Fu and WenZl,Wei and FU22, Ojimaetal.23 ,Yasunari etal.24, and Kanaeet al.Z5. Among the conclusions are that land-surfaceconditions have been significantly modified by humanactivities, and, as a result, the Asian monsoon todayis different in its geographic influences and temporalevolution from what would occur with a humanundisturbed Asian landscape. .
In the IPCC Special Report on The Regi6nalImpacts of Climate Change: An Assessment ofVulnerabilityZ6, several conflicting feedbacks can befound for the Indian region. These include possiblescenarios where the region may show a positivefeedback due to atmospheric changes, whileconsiderations of additional model complexities tendto reverse the conclusions. As an example, a summaryof the different GCM simulations considered over theIndian monsoon region provided an area-averagedincrease in summer monsoon rainfall though its spatialdistribution was highly variable among the differentGCMs. Accordingly a consensus increase in monsoonrainfall over the monsoon region was obtained.Subsequent studiesZ7 which considered aerosol effects,in addition to the COz effects used in the IPCCassessment, led to consistent simulations showing amarginal reduction in the monsoon precipitation. Thishighlights the variability of the tropical system and thedifficulty associated with projecting regional climateeffects over the Indian monsoon region. This is becauseof the numerous interactive features active over thehighly diverse Indian subcontinent and the inabilityof the models to consider each of these interactionsexplicit! y to skillfully represent regional climate change.
In this section, we will consider themes that needto be considered in future assessments for regionalclimate studies, particularly over the Indian region. Thethemes include the dynamic changes in regional landuse and links between the regional radiative andhydrological features. Land-use change processes canbe reviewed under two headings: the natural successiondue to specie interaction and resource allocation, andthe human-induced/population stress-based land-usechange. The radiative and hy~ologicai'link will alsobe established by proposing a feedback betweenregional haze and aerosols as a driver for regional watervapour exchange and the hydrology.~
3.2 Vegetation Dynamics and Land-Use Change
The changes in regional landscape are dynamicand continue affecting both the large-scale and thesmaller mesoscale weather and climate regimes.Jnteractions
on these space scales occurs betweenthe land surface and the atmosphere as discussed in
3.1 Land-Cover ChangeOne often overlooked process affecting the regional
redistribution of energy which changes in land cover.

590 R A PIELKE et at.
Warm Crop-Fig. Regions of changed vegetation in the. GCM simulatiow5
Fig. 2 Difference (degrees C) in near-surface air temperature (current-natural vegetation model simulation) for land-cover change!shown in Fig. r

A NEW PERSPECnYE ON CLIMATE CHANGE AND VARIABILITY 591
Precipitation DifferenceCurrent-Natural Vegetation
60E 120E 130E50E 70E 80E 90E 100E 110EFig.
3 As in Fig. 2 but for precipitation rate difference (mm/day)
ref. [29]. Hence understanding the dynamics ofland-use change over the Indian region is animportant component of our ability to understandclimate. The changes in the land-use patterns can bedue to natural specie interaction and specie dominancebecause of changes in the regional climate or due tomanmade policies. The issue of population changeis also very pertinent over the Indian region. Wewill discuss these features from the perspective ofincluding them inthe climate change and variabilityassessment over the Indian region.
3.2.1
BackgroundPrecipitation processes have a direct link with the
vegetation evolution in a majority of the Indiansubcontinent. With the advent of the monsoons, theimmediate greening of the landscape is a ubiquitousfeature of the monsoon region. Indeed in satelliteobservations, there is a strong co-linearity betweenprecipitation amounts and the greenness fraction overIndia. Changes in the landscape as a dynamic andinteractive response to rainfall amounts and patternshave been identified as one of the missing componentsof land-surface process modelling over the tropics and
Indian subcontinent in particular29. Though the effectsare visible over the short -term observations, the relationbetween precipitation and regional landscape can beextended to a longer time scale. In that, with thepotential for a regional weather change involvingprecipitation and temperature changes, there can bedirect feedbacks on the natural landscape in the region.Landscape changes in turn can cause interactivealterations in the regional cli~ate as discussed earlierin this paper and more extensively in studies such asPielke28. Whether the landscape and the regionalatmosphere seek to obtain equilibrium in the Gaiansense, or whether the coupled changes in the landscapeand the regional atmosphere make the survival of thefittest specie in the Darwinian context over Indiaremains to be investigated. This balance (or imbalance)can cause land-use resilience (or alteration) and hasa feedback on the atmospheric systems' heat balance/imbalance potential.
In either case, a scenario where a combination ofthe two i.e., some species dominating with theirresilience and some biome species interacting with thehabitat leading to a more synergistic environmentthrough resource allocation is plausible. Indeed, as

592 R A PIELKE et at.
discussed in Niyogi et ai.3!, one of the environmentalmodulators controlling the shift from the Gaian to theDarwinian response could be the regional hydrology.That is, when the hydrological conditions arenon-limiting, the system tends to invest the resource(water vapour or soil moisture) in the differentcomponents leading to an interactive and unifiedresponse. This unified response makes the systemmore resilient and significantly less prone to asingle specie dominance or aridness. /
On the other hand, with lesser resource availability(such as during a drought), the Earth system tends tobe more conservative and the individual componentshave a lesser propensity in investing the resources theyhave access to, in other system components. This leadsto a system which is less interactive, and the individualcomponents more responsive to perturbations andhence more vulnerable to specie dominance or extinctiondepending on the environmental signal.
In understanding the newer challengestowards developing an integrated regional climateassessment, partic\llarly over the tropical regionssuch as the Indian subcontinent, there is hence a needto study the interactive role of vegetation dynamicsin a changing climate.
3.2.2 Modelling Land-Use/Land-Cover FeedbackSeveral potential techniques exist for linking
the regional weather and the land-use/land cover.These range from simple regression models32.33 thatrelate past weather observations to landscapecharacteristics changes, and resulting equations/classification schemes are used for potential vegetationchanges for probable changes in the regional weather(surface temperature and precipitation, e.g., HoldridgeClassification System). These functional modelstend to provide a good fit for the direct effects butofte~tend to ignore the more pervasive indirect effectsbecause of the nonlinear complexity and the limitationsin using observations for developing such relations.Hence, a relatively complex form of regressionmodels involving the resource allocation schemes34can be applied. Govariance and co-limitations to theregression models for changes in the surface weatherand the corresponding change to the surface landscapeare introduced. For example, the vegetation growth istypically a function of growing degree days anddrought days in the growing season. There are differentregional perturbations that can be made depending onthe function form (such as linear or parabolic), stress
due genetic adaptation (one specie winning over theother), and soil and management practices.
Though there are limited studies evaluating the useof such regression and/or resource allocation modelsfor the Indian region, their use for linking! socio-economic stresses, environmental effects due topollution and regional land-use change appears tobe promising. A class of the resource allocationmodel deals with the sol called crop growth models.Lu et al.35 report the use of such a crop model forinteractive feedback between the landscape and theregional weather for a seasonal simulation over thecentral United States. Such coupli~s are potentiallyideal for regional and seasonal &;,tudies over certainIndian regions where a concentrated agricultural activityis practiced. Further, there are a number of studies thathave been reported for the Indian region validating thecrop models such as CERES-MAIZE, which appearto have a good agreement between the weather factorsand the vegetation/crop growth. However, linking thedifferent models in a heterogeneous land use, or mixedfarming environment, which is typical of the Indian,is necessary before they can be applied for regionalclimate modelling studies.
A third set of models that can be applied forstudying the coupling between the vegetation dynamics!land-use and the regional atmosphere are the ecologicalmodels. These models tend to apply mechanisticrelations based on leaf- and canopy-scale responsesto environmental changes for transpiration,photosynthesis and energy and water balance. Thoughapplying these models can produce a relatively morerealistic outcome from the coupled studies, scaling theleaf- and canopy-scale relations to a region remainsone of the ongoing challenges for these models.Lu et al.35 and Eastman et al.36.37 applied differentecological models (CENTURY, GEMTM) coupled toan atmospheric model (RAMS) and have foundthat vegetation dynamics sigI;lificantly feedback toinfluence the seasonal weather patterns. Eastmanet al.36 found that the biogeochemical effect ofdoubled CO2 in the Great Plains had a more immediateand more significant effect in seasonal weatherthan the radiative effect of doubling CO2,
Incorporating the important perturbations such asfrom landfalling tropical storms, and prolonged droughtsand the resulting changes in soil and plant nutrientstrategies remains one of the biggest challenges indeveloping these couplings. The interactive feedbackshave been studied over the midlatitude regions, but the

A NEW PERSPECTIVE ON CLIMATE CHANGE AND VARIABILITY 593
associated with CO2 changes, and needs to be consideredin any comprehensive future assessment. It should benoted that often, despite dramatic leaf-level impactsdue to weather changes, the natural ecosystem tendsto be resilent and does not show a dramatic response.This feature is generally true for most ecologicalcommunities, but the changes introduced via manmade!population demands will have a potential for a morepermanent and significant impact, and is discussed inthe following sections.
3.2.3 Considerations for Human Population inLand-use Models
The role of population on the evolution and theprojection of land-use change in understandingclimate variability over India is an important andmissing component of climate change studies. Thisfeature is not presently considered in ecologicalmodels, which are generally based on results inEurope and other western countries, where populationis not a critical driver. As an example, the United Stateshas typically seen a growth in the population in thelast 50 years from about 150 million to about 275million, while for the same period: India's populationhas changed from approximately 375 million toover 1 billion. Translating this information intopopulation density provides estimates of30 persons per square kilometer for the U.S. and about350 persons per square kilometer for India. Thechanges in the population density have a directeffect on resource allocation and land-use change.Population information also needs to include thesignificantly less resource use per capita in Indiathan in the western countries. Interestingly, thesedramatic increases in the population density do notshow any significant change in the statewide statisticsfor land-use change in India.
As an example, Haryana in northern India hasabout 2.5% forest and 81% agriculture and thesefigures have not shown any systematic change at astatewide regional scale in the last 30 years. However,there are significant microscale land-use alterationsevident in several parts of the state. Consequently, thescale of the population land-use model will be a criticalfactor in considering these feedbacks for regionalclimate studies. This then poses additional questionsabout using national averages (or even statewidestatistics) for developing climate assessments forregions such as India. These land-use change driverscan be considered as microscale changes, yet they may
strategies will be significantly different in the semiaridregions of India. Further, most of the ecological modelsgenerally fail to reprog~e the extreme environment(e.g., very dry or very wet soil and atmosphere)satisfactoril y, and therefore model simulations over theIndian region are prone to a higher level of uncertaintywhen assessing the sensitivity of the differentenvironmental forcings on regional climate.
Further, the ability to provide more realisticvegetation changes as boundary conditions significantlyimproves the model performance. So it may not be asmuch a choice of model, but the representation of thecorrect regional drivers that could be the critical aspect.It is important to realize' that no single model cancompletely simulate the local, regional, and continentalvegetation dynamics, and efforts are needed to comparethe different modelling approaches with the observedvegetation dynamics over the monsoon region.
Similarly, the ecological models appear to be abetter choice for the land-use land-cover changeanalyses since the regression or resource allocationestimates based on the preindustrial level CO2 changescannot be interpreted with the same certainty as theeffects due to CO2 changes from the present-day valuesto projected doubling.
As an example given in ref. [38], the response inplant-C°2 interactions is known to be different andwill have significant interactions with the soil moisture39.Specifically corresponding to the land-use over theIndian region, results from Niyogi et at. 40 suggest each
biome has a different strategy to account for CO2changes with regard to soil moisture availability.Considering only the biogeochemical feedback ofincreased CO2 levels, regions in the north that generallyhave winter wheat and other C3 crops will tend to showa positive response to CO2 changes if the monsoonprecipitation is not affected (or reduced). On the otherhand, if the CO2 increase indeed causes a decrease inthe monsoonal rains over the Indian region, then thecentral and the southern belt with maize and other C4predominance will tend to show a preferentialdominance in the landscape.
However, these broad conclusions do not considerany management practices or additional financialinvestment as an input to crop response. However,events such as drought or high soil moisture availabilityneed to be explicitly considered in carbon stock andregional weather variability assessments. This is becausethe hydrological feedback can enhance, or completelybalance, or even reverse the biogeochemical effects

594 R A PIELKE et at.
have significant feedbacks within the regional climatesystem, and this needs to be investigated further.
3.3 Analysis of Land-use/Land Cover andPrecipitation Changes over India
In order to quantify the year-to-year variability weobtained the Advanced Very High ResolutionRadiometer (AVHRR) Normalized DifferenceVegetation Index (NDVI) dataset from the GoddardSpace Flight Center's Distributed Active ArchiveCenter (DAAC) for 1989 through 2000, excluding1994, which was an incomplete record. This datasetis used to derive the Leaf Area Index (LA!) for thecoupled GEMTM/RAMS modelling system. Thedata have a pixel size of 8 kIn that were scaled upto the grid. The vegetation classes are based onOlson's Global Ecosystem (OGE) dataset. The datasetemploys 1 kIn pixel sizes, which were used todetermine the most dominant vegetation class in each50 kIn grid cell (Fig. 4).
The dataset was derived using 1993 AVHRR dataand ground truthing. For this analysis, the NDVI valueswere masked with a land-water mask and accordingto three broader vegetation classes: urban, semi-desert,and desert, and any remaining classes for ease ofinterpretation. Shown in Fig. 5 is a breakdown ofvegetation predominance for the indicated vegetationtype. Water was intentionally left off the figure andamounted to nearly 36% of the grid cells. The figureindicates that nearly 5% of the domain area is coveredwith the urban class, while desert and semi-desertcombine to over 18%.
We first examined the monthly domain-averagedNDVI for each of the three broadly defined classes.The results are shown in Fig. 5. The seasonal cycleis readily apparent for each class. The figure alsodisplays the active and break monsoon periodsfor winter and summer monsoons and their localminima and maxima. In addition, there appears to
Dominant Vegetation (DX = 50km)
Fig. 4 Dominant vegetation classes over the Indian region

A NEW PERSPECTIVE ON CLIMATE CHANGE AND VARIABILITY 595
Fig. 5 Domain relative vegetation class percentages
Fig. 6 Domain-averaged monthly NDVI from 1982-2000 excluding 1994


A NEW PERSPECTIVE ON CLIMATE CHANGE AND VARIABILITY 599
India (Trivandrum), Parameswaran et ai.57 indicate
aerosol mass loading to change from about 30
micrograms per metre cube during the day to about
90 during the nocturnal conditions. At a monthly scale,
assuming a dry environment, the concentrations in
the aerosol loading was found to be approximately
100 mmg/m3 in the winter months, to about 250 mmgl
m3 during the summer. Without normalizing for
constant humidity considerations, these values range
from about 100 in the winter mo?th to about 600 in
the summer.
Aerosol feedbacks area dominant feature of
the Indian environment and therefore have a
potential to have a dramatic feedback on the
regional climate. However, the aerosol composition
over the Indian region appears to show large
latitudinal variability (from the Himalayan region to
the so_uthern Indian tip).
For example; measurements by Sarkar et ai.58
indicate total and black carbon concentrations in urban
Delhi to be 14 and 2 mmg/m3respectively, while values
off the Indian Ocean correspond to be about 2 and 0.2
mmg/m3. Therefore, the feedback will be different
depending on whether it is a northeast monsoon or a
southwest mC1l1soon. Further, the aerosol transport is
largely due to the monsoonal winds over the region.
The aerosol source regions can be quite variable
ranging from Arabia to the Himalayas. In addition to
the source region, the aerosol patterns are governed
by at least two factors: the regional topography and
the rainfall occurrence. As shown in Roswintiartiet at. 59 the aerosol plume can be trapped and recirculated
over the western coast due the Western Ghats. However,
once it escapes the Western Ghats, it has a potential
to transport itself hundreds of km both inland as
well as offshore. Within this perspective, there is a
need to develop a synthesis for possible modulation
in the hydrological cycle component of the regional
climate system over India.
however, the direct effect on the radiative component(direct and diffuse irradiance) of the vegetation-atmosphere interaction has not been explicitlyconsidered49.
Considering that the global solar irradiancecomprises the direct beam and the diffuse radiation,the increase in the atmospheric particles lead to morepiffuse radiation in the atmosphere5o. The changes inthe diffuse to direct ratio of the atmospheric radiation(DDR) due to aerosol loading. have been establishedtprough several surface and remote-sensed observing~tudies. The radiative effects of aerosol loading andi~s impact on DDR are well known, and relatively well~nderstood. The question then is, what will be thepotential effect of aerosols on regional radiation andthe terrestrial hydrology?
For the Indian region, Reddy and Venkataraman50.5'present a 0.25 degree grid incrementaero$ol emissionct:atabase. They report PM2.5 emitted was 0.5 and2~0 Tg yr1 for the 100% and the 50% control scenario,respectively, applied to coal burning in the power andindustrial sectors. Coal combustion was the majorsource of PM2.5 (92%) primarily consisting of fly ashapd accounted for 98% of the "inorganic fraction"e~issions (difference between PM2.5 and blackcarbon+organic matter) of 1.6 Tg yr'. Black carbone,missions wereestimatedatO.l Tg yr', with58%fromdiesel transport, and organic matter emissions at0.3 Tg yr', with 48% from brick-kilns. Fossil fuelconsumption and emissions peaked at large pointindustrial sources and in 22 cities with elevatedarea fluxes in northern and western India.
, Therefore, a synthesis involving aerosol interactionover India is feasible. Additionally, analysis fromINDOEX has led to increased understanding betweenthe aerosol-terrestrial radiation interactions. As anexample, George53 reports changes in surfaceradiation of about 25 W m-2 with and without dustand aerosol loading in this region.
Studies such as Ansmann54, Mohanty et ai.55, andRaman et ai.56 describe two distinct zones over the.Indian subcontinent with and without aerosol fronts.These regions evolved dynamically depending onthe source area. The aerosol optical depths are nearly50% lower for the region without aerosol air mass.Further, there are significant diurnal and seasonalchanges in the aerosol concentrations as revealedfrom surface observations over different regionsin India. As an example, for the southern tip of
4 Comparison of the Observational Record overIndia with Global Model Simulations
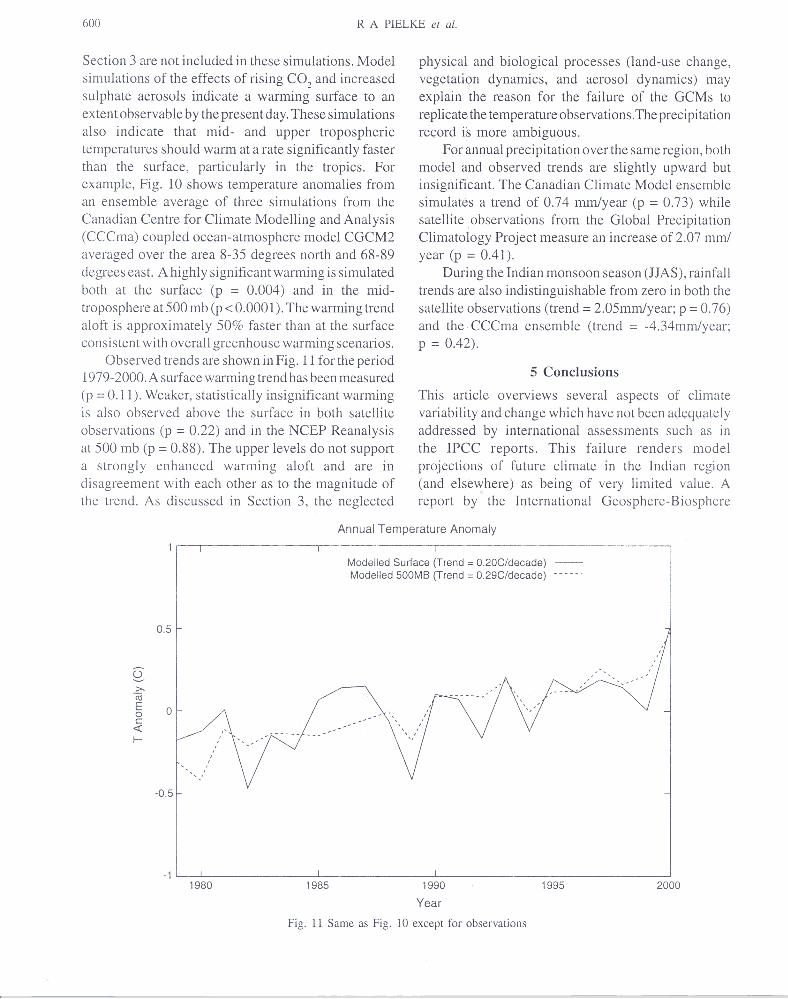
General circulation models of the effects of risingatmospheric CO2 are designed to simulate the broadfeatures of climate change, particularly the net energyimbalance at the top of the atmosphere discussed inSection 2. In this section, we compare the regionalpredictions of these simulations with observations over.India.
The regional influences on climate discussed in