a new reality: correspondence mail in the digital age ...... 3 introduction ......
TRANSCRIPT
Cover
Office of Inspector General | United States Postal Service
RARC Report
A New Reality: Correspondence Mail in the Digital AgeReport Number RARC-WP-18-004 | March 5, 2018
Table of Contents
Cover
Executive Summary ...................................................................................................................................... 1
Observations .................................................................................................................................................... 3
Introduction .................................................................................................................................................. 3
Overview of First-Class Mail Revenue and Volume Trends ....................................................4
Breakdown by First-Class Mail Segment .................................................................................. 5
History of Correspondence Mail..........................................................................................................8
Key Historic Factors That Have Affected Correspondence Volume ............................9
Some Future Scenarios for First-Class Correspondence Mail ................................................ 12
Keeping First-Class Correspondence Mail Relevant .................................................................. 15
Conclusion .................................................................................................................................................... 16
Management’s Comments ..................................................................................................................... 17
Evaluation of Management’s Comments ........................................................................................ 17
Appendices ...................................................................................................................................................... 18
Appendix A: Postal Service Household Diary Study .................................................................. 19
Appendix B: Management’s Comments .......................................................................................... 20
Contact Information ..................................................................................................................................... 23
A New Reality: Correspondence Mail in the Digital Age Report Number RARC-WP-18-004

Executive Summary
Highlights• First-Class Mail is the Postal Service’s biggest provider of revenue and
contribution. However, its portion of overall postal revenues has fallen from over 60 percent in the late 1970s to just 40 percent in 2016.
• This paper focuses on one segment of First-Class Mail, correspondence mail, which accounts for 25 percent of First-Class Mail volume.
• Depending on whether key historical trends continue, intensify, or weaken, the future of correspondence mail could vary greatly. We present five hypothetical scenarios for what correspondence mail volumes would be in 2026 should the scenarios occur.
• In the face of continued declines in correspondence mail volume, the Postal Service may need to continue to seek innovative ways to integrate digital features into physical pieces of correspondence mail to enhance the product’s relevance to the American public.
First-Class Mail is an important product of the U.S. Postal Service, generating approximately 40 percent of total revenue and more than 50 percent of total contribution in fiscal year (FY) 2016. Unfortunately, recent trends suggest that the Postal Service cannot expect First-Class Mail to maintain its leadership role among postal products. Total First-Class Mail volume has declined significantly from its peak volume in 2001. This continuing and persistent fall in volume has hurt the Postal Service’s bottom line — First-Class Mail revenue has declined by 28 percent since 2007.
Although the decline of First-Class Mail volume rightfully gets a lot of attention, it is important to understand the underlying trends affecting its key segments — specifically correspondence and transactional mail.
This paper focuses on correspondence mail, which consists of mail that is used solely or primarily to deliver communications, such as personal letters, greeting cards, and non-sales related communications sent and received between households and businesses and the government. There will be a follow-up paper focusing on transactional mail. This paper examines the following:
1. How key and interrelated factors like electronic diversion, demographic changes, the economy, pricing, and evolving security and privacy concerns have affected the growth and decline of correspondence mail during the past 15 years;
2. How these factors could affect First-Class Mail demand in the next 10 years, and;
3. What future strategies the Postal Service could pursue to engage with the digital market in a way that helps to defend correspondence mail volume.
Although the U.S. economy has historically affected all First-Class Mail volumes, this relationship began weakening in the late 1990s. Correspondence mail in particular experienced its large decline some 15 years ago with the pervasive availability of free electronic communication. Our analysis confirms that correspondence is waning as a channel of personal communication — with electronic diversion being the biggest culprit for the continuous volume decline of this segment.
We present five hypothetical scenarios of correspondence mail volume in 2026, based on whether historical trends continue, intensify, or weaken. Across these scenarios, correspondence mail volume, which measured 16 billion pieces in 2016, could range from 11.5 billion to 17.1 billion pieces in 2026.
The scenarios are intended to examine the potential risks and opportunities facing correspondence mail, and are not meant to be forecasts of actual future volumes. In addition, the scenarios are not mutually exclusive, as some elements of individual scenarios could occur simultaneously. Most importantly, the scenarios are not equally probable. For example, it is more likely that electronic diversion will accelerate, current trends will continue, or that differences between age cohorts will dominate than that mail use will increase due to privacy and security concerns.
A New Reality: Correspondence Mail in the Digital Age Report Number RARC-WP-18-004
1
In the face of continued declines in correspondence mail volume, the Postal Service may need to continue to seek innovative ways to enhance the product’s relevance to the American public. This paper highlights some of the Postal Service’s efforts to date to minimize the decline in correspondence
mail volume, such as integrating digital features into physical pieces of correspondence mail, and suggests additional strategies the Postal Service could pursue to shore up its highest contribution product, First-Class Mail.
A New Reality: Correspondence Mail in the Digital Age Report Number RARC-WP-18-004
2
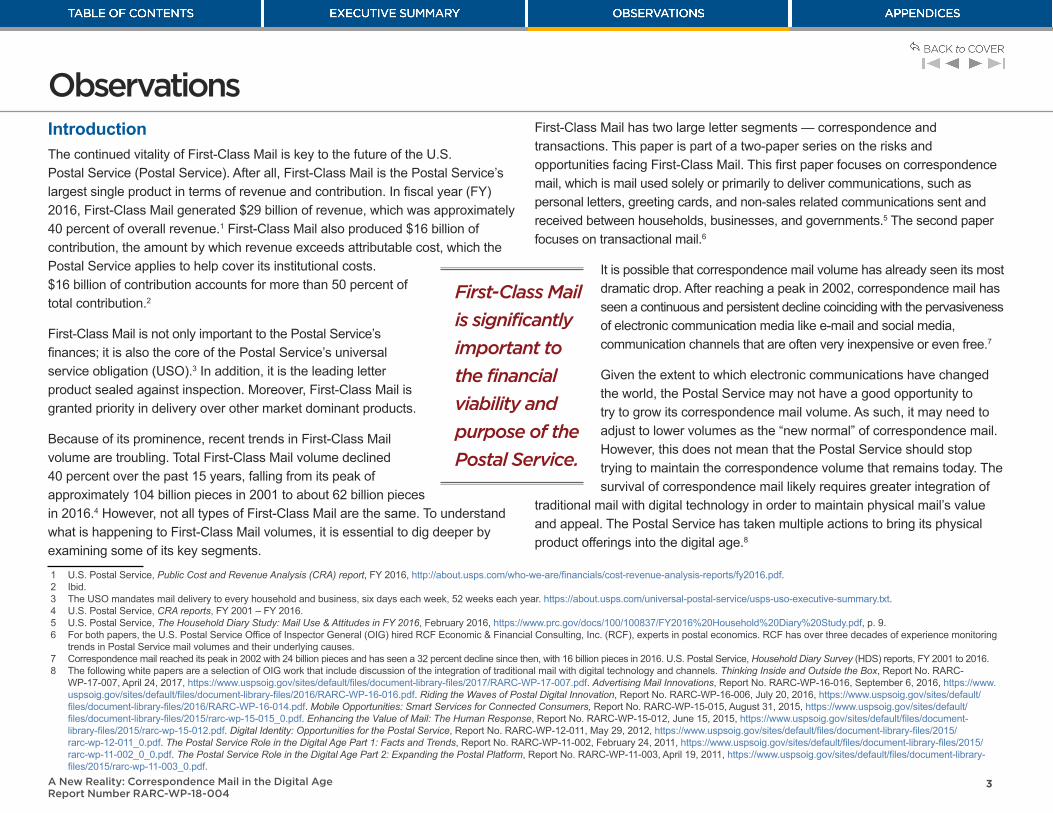
ObservationsIntroductionThe continued vitality of First-Class Mail is key to the future of the U.S. Postal Service (Postal Service). After all, First-Class Mail is the Postal Service’s largest single product in terms of revenue and contribution. In fiscal year (FY) 2016, First-Class Mail generated $29 billion of revenue, which was approximately 40 percent of overall revenue.1 First-Class Mail also produced $16 billion of contribution, the amount by which revenue exceeds attributable cost, which the Postal Service applies to help cover its institutional costs. $16 billion of contribution accounts for more than 50 percent of total contribution.2
First-Class Mail is not only important to the Postal Service’s finances; it is also the core of the Postal Service’s universal service obligation (USO).3 In addition, it is the leading letter product sealed against inspection. Moreover, First-Class Mail is granted priority in delivery over other market dominant products.
Because of its prominence, recent trends in First-Class Mail volume are troubling. Total First-Class Mail volume declined 40 percent over the past 15 years, falling from its peak of approximately 104 billion pieces in 2001 to about 62 billion pieces in 2016.4 However, not all types of First-Class Mail are the same. To understand what is happening to First-Class Mail volumes, it is essential to dig deeper by examining some of its key segments.
1 U.S. Postal Service, Public Cost and Revenue Analysis (CRA) report, FY 2016, http://about.usps.com/who-we-are/financials/cost-revenue-analysis-reports/fy2016.pdf.2 Ibid.3 The USO mandates mail delivery to every household and business, six days each week, 52 weeks each year. https://about.usps.com/universal-postal-service/usps-uso-executive-summary.txt.4 U.S. Postal Service, CRA reports, FY 2001 – FY 2016.5 U.S. Postal Service, The Household Diary Study: Mail Use & Attitudes in FY 2016, February 2016, https://www.prc.gov/docs/100/100837/FY2016%20Household%20Diary%20Study.pdf, p. 9.6 For both papers, the U.S. Postal Service Office of Inspector General (OIG) hired RCF Economic & Financial Consulting, Inc. (RCF), experts in postal economics. RCF has over three decades of experience monitoring
trends in Postal Service mail volumes and their underlying causes.7 Correspondence mail reached its peak in 2002 with 24 billion pieces and has seen a 32 percent decline since then, with 16 billion pieces in 2016. U.S. Postal Service, Household Diary Survey (HDS) reports, FY 2001 to 2016.8 The following white papers are a selection of OIG work that include discussion of the integration of traditional mail with digital technology and channels. Thinking Inside and Outside the Box, Report No. RARC-
WP-17-007, April 24, 2017, https://www.uspsoig.gov/sites/default/files/document-library-files/2017/RARC-WP-17-007.pdf. Advertising Mail Innovations, Report No. RARC-WP-16-016, September 6, 2016, https://www.uspsoig.gov/sites/default/files/document-library-files/2016/RARC-WP-16-016.pdf. Riding the Waves of Postal Digital Innovation, Report No. RARC-WP-16-006, July 20, 2016, https://www.uspsoig.gov/sites/default/files/document-library-files/2016/RARC-WP-16-014.pdf. Mobile Opportunities: Smart Services for Connected Consumers, Report No. RARC-WP-15-015, August 31, 2015, https://www.uspsoig.gov/sites/default/files/document-library-files/2015/rarc-wp-15-015_0.pdf. Enhancing the Value of Mail: The Human Response, Report No. RARC-WP-15-012, June 15, 2015, https://www.uspsoig.gov/sites/default/files/document-library-files/2015/rarc-wp-15-012.pdf. Digital Identity: Opportunities for the Postal Service, Report No. RARC-WP-12-011, May 29, 2012, https://www.uspsoig.gov/sites/default/files/document-library-files/2015/rarc-wp-12-011_0.pdf. The Postal Service Role in the Digital Age Part 1: Facts and Trends, Report No. RARC-WP-11-002, February 24, 2011, https://www.uspsoig.gov/sites/default/files/document-library-files/2015/rarc-wp-11-002_0_0.pdf. The Postal Service Role in the Digital Age Part 2: Expanding the Postal Platform, Report No. RARC-WP-11-003, April 19, 2011, https://www.uspsoig.gov/sites/default/files/document-library-files/2015/rarc-wp-11-003_0.pdf.
First-Class Mail has two large letter segments — correspondence and transactions. This paper is part of a two-paper series on the risks and opportunities facing First-Class Mail. This first paper focuses on correspondence mail, which is mail used solely or primarily to deliver communications, such as personal letters, greeting cards, and non-sales related communications sent and received between households, businesses, and governments.5 The second paper focuses on transactional mail.6
It is possible that correspondence mail volume has already seen its most dramatic drop. After reaching a peak in 2002, correspondence mail has seen a continuous and persistent decline coinciding with the pervasiveness of electronic communication media like e-mail and social media, communication channels that are often very inexpensive or even free.7
Given the extent to which electronic communications have changed the world, the Postal Service may not have a good opportunity to try to grow its correspondence mail volume. As such, it may need to adjust to lower volumes as the “new normal” of correspondence mail. However, this does not mean that the Postal Service should stop trying to maintain the correspondence volume that remains today. The survival of correspondence mail likely requires greater integration of
traditional mail with digital technology in order to maintain physical mail’s value and appeal. The Postal Service has taken multiple actions to bring its physical product offerings into the digital age.8
First-Class Mail
is significantly
important to
the financial
viability and
purpose of the
Postal Service.
A New Reality: Correspondence Mail in the Digital Age Report Number RARC-WP-18-004
3

Overview of First-Class Mail Revenue and Volume TrendsWhile the primary focus of this paper is correspondence mail, the trends of all First-Class Mail help provide context. Despite recent volume declines, First-Class Mail continues to be the Postal Service’s biggest source of revenue. Over the past few decades, First-Class Mail has represented a declining portion of overall postal revenues. It was the source of more than 60 percent of the Postal Service’s total revenue in the late 1970s, but brought in just 40 percent in 2016.9 However,
9 In absolute terms, First-Class Mail revenue peaked at about $38 billion in 2007 and has since fallen below $30 billion. U.S. Postal Service, Cost and Revenue Analysis report, FY 2007 and FY 2016.10 U.S. Postal Service, Form 10-K, FY 2007, http://about.usps.com/who-we-are/financials/10k-reports/fy2007.pdf, p. 10 and FY 2016, http://about.usps.com/who-we-are/financials/10k-reports/fy2016.pdf, p. 16.11 For comparison purposes, in FY 2016 Postal Service total revenue was about $72 billion. First-Class Mail provided almost $29 billion in revenue (40 percent of total). Standard Mail, the next biggest class in terms of
revenue, provided almost $18 billion (25 percent of total). Periodicals provided almost $2 billion (2 percent) and Package Services provided $0.8 billion (1 percent of total revenue). On the competitive side, competitive mail provided about 26 percent of total revenue. U.S. Postal Service, Cost and Revenue Analysis report, 2016, http://about.usps.com/who-we-are/financials/cost-revenue-analysis-reports/fy2016.pdf.
even at its diminished levels First-Class Mail still plays a critical role because it supports the entire postal network. In FY 2016, First-Class Mail provided more than 50 percent of total contribution towards the Postal Service’s institutional costs.10 It is not a stretch to say that the Postal Service’s unmatched, nationwide network is built on the back of First-Class Mail. Figure 1 depicts changes in First-Class Mail revenue between 1970 and 2016, in terms of both absolute revenue and percent of overall postal revenue.11
Figure 1: Annual First-Class Mail Revenue (1970 - 2016)
FIRST-CLASS MAIL IS USPS’S BIGGEST PROVIDER OF REVENUE DESPITE VOLUME DECLINESThe importance of First-Class Mail is clear. As the left side shows, it remains the largest mail class by revenue and represents an even larger portion of the contribution from mail toward USPS institutional costs. However, First-Class Mail has been a declining portion of overall postal revenues falling from over 60 percent of total revenues beginning in the late 1970s to just 40 percent in 2016 as the left side shows.
2007, 38.3 b
2016, 29.1 b
0
10
20
30
40
50
1970
1975
1980
1985
1990
1995
2000
2005
2010
2015
Reve
nue
(bill
ions
$)
FIRST-CLASS MAIL IS USPS'S BIGGEST PROVIDER OF REVENUE DESPITE VOLUME DECLINESThe importance of First-Class Mail is clear. As the left side shows, it remains the largest mail class by revenue and represents an even larger portion of the contribution from mail toward USPS institutional costs. However, First-Class Mail has been a declining portion of overall postal revenues falling from over 60 percent of total revenues beginning in the late 1970s to just 40 percent in 2016 as the left side shows.
1978, 63.5%
2016, 41.9%
0
15
30
45
60
75
1970
1975
1980
1985
1990
1995
2000
2005
2010
2015
% o
f Tot
al R
even
ue
Source: OIG analysis of RCF Economics and Financial Consulting, analysis of U.S. Postal Service, Household Diary Survey (HDS) reports, FY 2001 to 2016.
A New Reality: Correspondence Mail in the Digital Age Report Number RARC-WP-18-004
4
The vast majority of First-Class Mail has always consisted of letters. The remaining volume includes cards, flats, and parcels.12 Overall, the volume of all of these sub-products — letters, cards, flats, and parcels — has declined in the last 15 years. However, First-Class flats and parcels have had a higher rate of decline than letters and cards, largely because the products were reclassified as competitive. Much of this volume did not leave the Postal Service mailstream. For example, in April of 2011, the Postal Regulatory Commission (PRC) approved a request from the Postal Service to remove commercial First-Class Mail parcels from the list of market-dominant products and moving them to a newly created product, now called First-Class Package Service.13 In their request, the Postal Service estimated that 414 million commercial pieces would be reclassified under this change. In FY 2011, market-dominant First-Class parcel volume measured about 638 million pieces, and declined to about 293 million pieces in FY 2012. The difference, about 345 million pieces, did not leave the Postal Service mailstream, but was simply reclassified as competitive.14
The left side of Figure 2 shows annual volumes of First-Class Mail since 1970; the right side presents the quarterly volumes over the last three years.
12 In 2016, letters represented 92 percent of total volume — not significantly different from letters’ volume share of 86 percent in 1970. First-Class Cards comprised 5 percent of volume in 2016, typically running between 4 and 6 percent of total First-Class volume between 1970 and 2016. U.S. Postal Service, First-Class Mail Revenue, Pieces, and Weight reports, FY 1970 – FY 2016.
13 Postal Regulatory Commission, FY 2010 FCM Commercial Parcel Cost Model, Docket No. MC2011-12, https://www.prc.gov/dockets/doclist/MC2011-22/Request/, and Docket No. MC2011-29, https://www.prc.gov/docs/76/76589/order_no_903.pdf.
14 U.S. Postal Service, Cost and Revenue Analysis FY 2011, http://about.usps.com/who-we-are/financials/cost-revenue-analysis-reports/fy2011.pdf and http://about.usps.com/who-we-are/financials/cost-revenue-analysis-reports/fy2012.pdf.
15 Our analysis for correspondence mail will focus on the years from 2001 to 2016. While the HDS dates back to 1987, because of changes in the survey methodology over the years, information from earlier years is not always directly comparable to data since 2001.
16 The HDS is used extensively in our analysis because it is an excellent data source that provides information on mail volumes that is not available from any other source. For more information on HDS, see Appendix A.17 OIG, Advertising Mail: Past and Present, Report No. RARC-WP-16-006, March 28, 2016, https://www.uspsoig.gov/sites/default/files/document-library-files/2016/RARC-WP-16-006_0.pdf and Advertising Mail: Future
Prospects in Five Scenarios, Report No. RARC-WP-16-010, May 9, 2016, https://www.uspsoig.gov/sites/default/files/document-library-files/2016/RARC-WP-16-010.pdf.18 Between 2001 and 2016, transactions mail declined on average 3.1 percent annually; correspondence declined on average 2.3 percent annually; and advertising declined 6.9 percent annually on average. OIG —
Analysis of RCF Economics and Financial Consulting.
Understanding the trends in First-Class Mail requires a thorough examination of the correspondence segment. To do this, we use the Postal Service’s Household Diary Study (HDS).15 The HDS is an annual sample of approximately 5,000 households and provides information on the number of mail pieces that households send and receive.16 While the HDS provides valuable information on the different applications for mail use, it does not provide any information on revenue or costs and does not include mail volume sent between businesses and governemnt.
Breakdown by First-Class Mail SegmentAs mentioned above, First-Class Mail is comprised of several segments, and is used primarily for correspondence and transactions. Only a small portion of First-Class Mail is advertising mail and small packages (parcels). The use of First-Class Mail for advertising has been addressed in previous OIG work.17
Transactional mail makes up the largest segment of First-Class Mail. This segment consists of bills, statements, and payments. Businesses send bills and statements to their customers; households mail back payments. As mentioned above, transactional mail will be discussed in a follow-up paper.
Correspondence mail, the focus of this paper, is the next largest segment of First-Class Mail. As shown in Figure 3, the volumes of each segment of First-Class Mail have declined since 2001.18
A New Reality: Correspondence Mail in the Digital Age Report Number RARC-WP-18-004
5
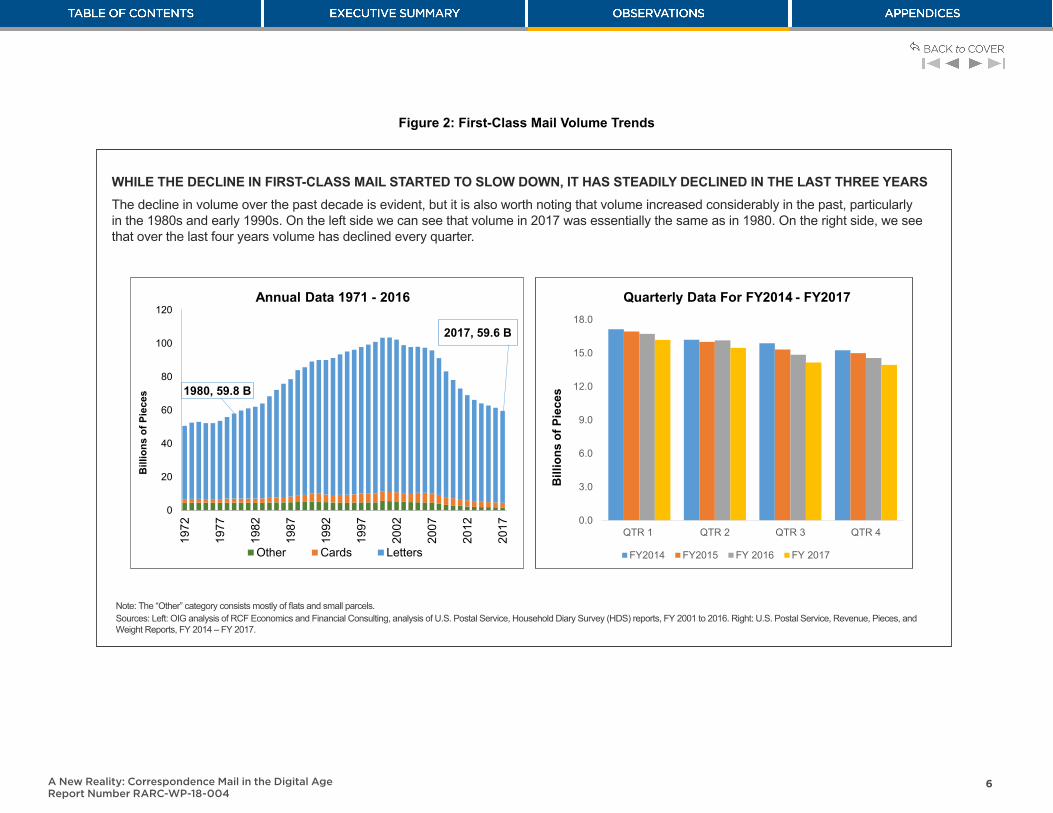
Figure 2: First-Class Mail Volume Trends
WHILE THE DECLINE IN FIRST-CLASS MAIL STARTED TO SLOW DOWN, IT HAS STEADILY DECLINED IN THE LAST THREE YEARSThe decline in volume over the past decade is evident, but it is also worth noting that volume increased considerably in the past, particularly in the 1980s and early 1990s. On the left side we can see that volume in 2017 was essentially the same as in 1980. On the right side, we see that over the last four years volume has declined every quarter.
1980, 59.8 B
2017, 59.6 B
0
20
40
60
80
100
120
1972
1977
1982
1987
1992
1997
2002
2007
2012
2017
Bill
ions
of P
iece
s
Other Cards Letters
0.0
3.0
6.0
9.0
12.0
15.0
18.0
QTR 1 QTR 2 QTR 3 QTR 4
FY2014 FY2015 FY 2016 FY 2017B
illio
ns o
f Pie
ces
Quarterly Data For FY2014- - FY2017Annual Data 1971 - 2016
WHILE THE DECLINE IN FIRST-CLASS MAIL STARTED TO SLOW DOWN, IT HAS STEADILY DECLINED IN THE LAST THREE YEARSThe decline in volume over the past decade is evident, but it is also worth nothing that volume increased considerably in the past, particularly in the 1980s and early 1990s. On the left side we can see that volume in 2017 was essentially the same as in 1980. On the right side, we see that over the last four years has declined every quarter.
Note: The “Other” category consists mostly of flats and small parcels.Sources: Left: OIG analysis of RCF Economics and Financial Consulting, analysis of U.S. Postal Service, Household Diary Survey (HDS) reports, FY 2001 to 2016. Right: U.S. Postal Service, Revenue, Pieces, and Weight Reports, FY 2014 – FY 2017.
A New Reality: Correspondence Mail in the Digital Age Report Number RARC-WP-18-004
6

Figure 3: First-Class Mail Volume by Segment (2001 - 2016)
FIRST-CLASS MAIL IS USED PRIMARILY FOR CORRESPONDENCE AND TRANSACTIONSThe volumes of each segment of First-Class Mail have declined each year from 2001 to 2016. In particular, correspondence mail has had an average annual decline of 2 percent. In 2016, correspondence mail accounted for approximately 25 percent of total First-Class Mail volume.
0
10
20
30
40
50
60
70
80
2001
2002
2003
2004
2005
2006
2007
2008
2009
2010
2011
2012
2013
2014
2015
2016
Bill
ions
of P
iece
s
Transactions Correspondence Advertising Other
Note: “Other” mail consists of packages and mail for which the HDS respondent did not indicate its content.Source: OIG analysis of RCF Economics and Financial Consulting, analysis of U.S. Postal Service, Household Diary Survey (HDS) reports, FY 2001 to 2016.
A New Reality: Correspondence Mail in the Digital Age Report Number RARC-WP-18-004
7
History of Correspondence Mail
19 Across all households in the United States, the volume of household-to-household mail sent is identical to the volume of household-to-household mail received. However, these two measures are not necessarily equal within the HDS. This is primarily due to sample variation — the households in the HDS sample are sending mail to, and receiving mail from, households outside the sample. This is the reason why Table 1 and Table 2 may appear to be inconsistent.
20 Business correspondence includes invitations, announcements, and holiday greetings. Other business and government correspondence includes tax, DMV, and Social Security related correspondence. U.S. Postal Service, Household Diary Survey (HDS) report, FY 2016, p. 25.
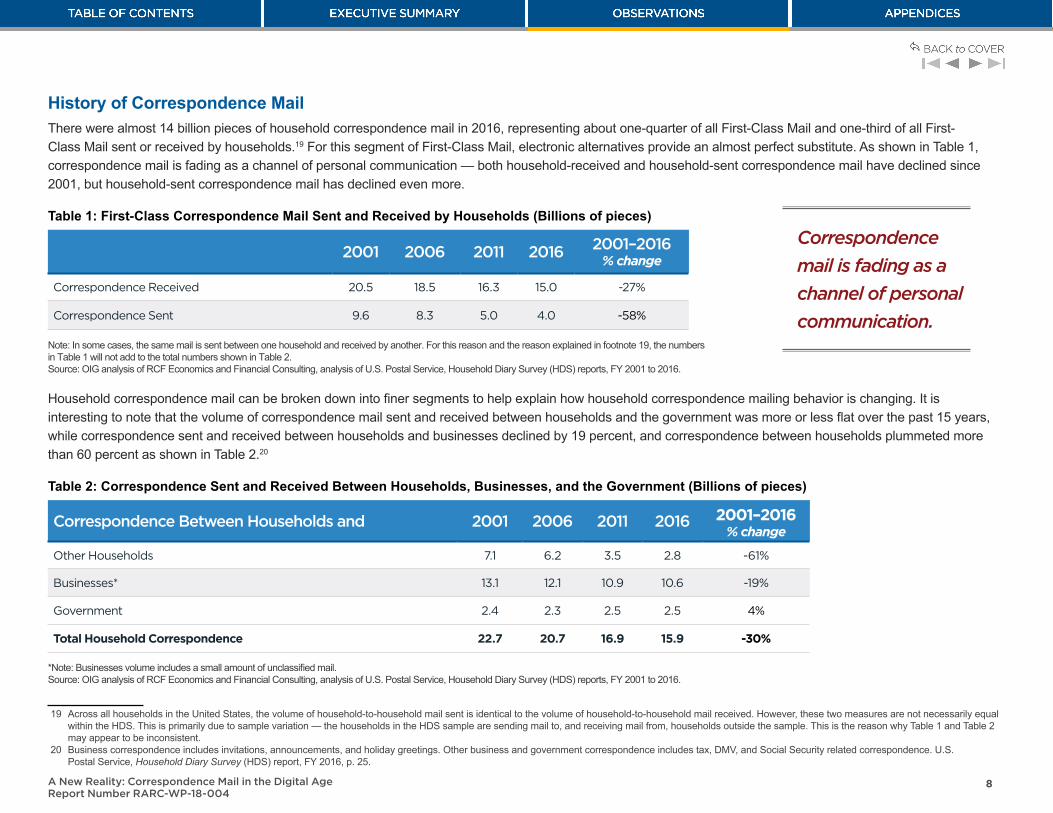
There were almost 14 billion pieces of household correspondence mail in 2016, representing about one-quarter of all First-Class Mail and one-third of all First-Class Mail sent or received by households.19 For this segment of First-Class Mail, electronic alternatives provide an almost perfect substitute. As shown in Table 1, correspondence mail is fading as a channel of personal communication — both household-received and household-sent correspondence mail have declined since 2001, but household-sent correspondence mail has declined even more.
Table 1: First-Class Correspondence Mail Sent and Received by Households (Billions of pieces)
2001 2006 2011 2016 2001–2016 % change
Correspondence Received 20.5 18.5 16.3 15.0 -27%
Correspondence Sent 9.6 8.3 5.0 4.0 -58%
Note: In some cases, the same mail is sent between one household and received by another. For this reason and the reason explained in footnote 19, the numbers in Table 1 will not add to the total numbers shown in Table 2.Source: OIG analysis of RCF Economics and Financial Consulting, analysis of U.S. Postal Service, Household Diary Survey (HDS) reports, FY 2001 to 2016.
Household correspondence mail can be broken down into finer segments to help explain how household correspondence mailing behavior is changing. It is interesting to note that the volume of correspondence mail sent and received between households and the government was more or less flat over the past 15 years, while correspondence sent and received between households and businesses declined by 19 percent, and correspondence between households plummeted more than 60 percent as shown in Table 2.20
Table 2: Correspondence Sent and Received Between Households, Businesses, and the Government (Billions of pieces)
Correspondence Between Households and 2001 2006 2011 2016 2001–2016 % change
Other Households 7.1 6.2 3.5 2.8 -61%
Businesses* 13.1 12.1 10.9 10.6 -19%
Government 2.4 2.3 2.5 2.5 4%
Total Household Correspondence 22.7 20.7 16.9 15.9 -30%
*Note: Businesses volume includes a small amount of unclassified mail.Source: OIG analysis of RCF Economics and Financial Consulting, analysis of U.S. Postal Service, Household Diary Survey (HDS) reports, FY 2001 to 2016.
Correspondence
mail is fading as a
channel of personal
communication.
A New Reality: Correspondence Mail in the Digital Age Report Number RARC-WP-18-004
8
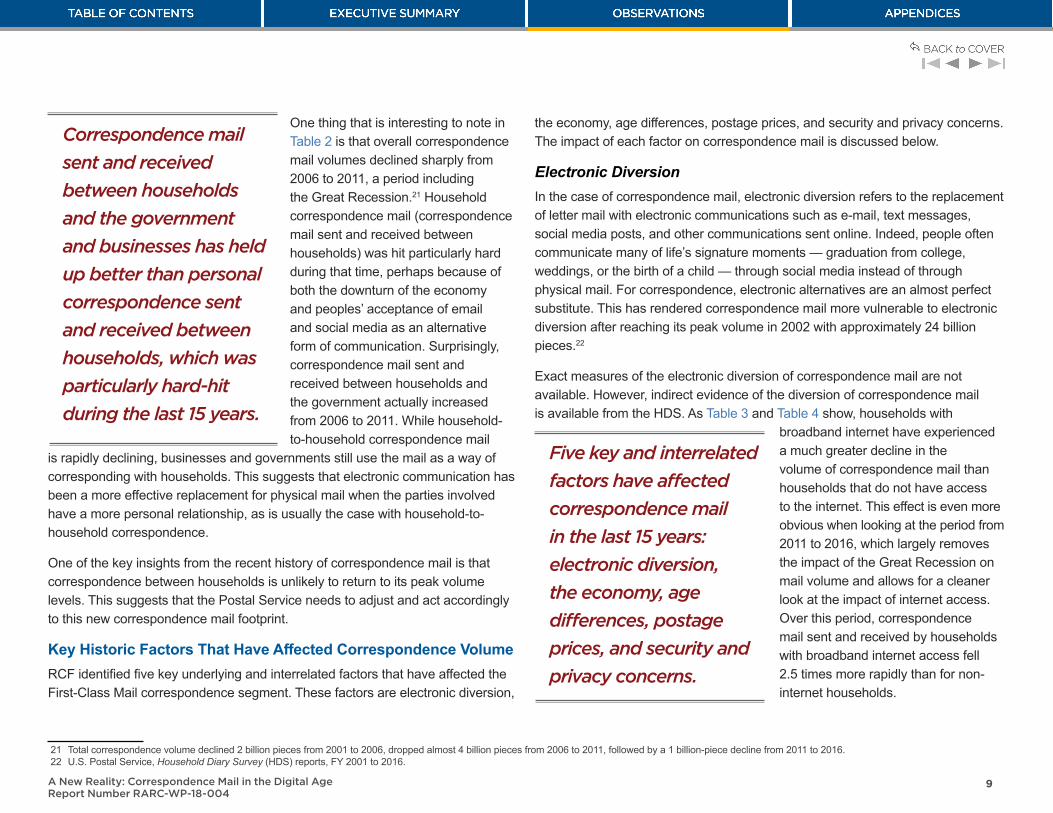
One thing that is interesting to note in Table 2 is that overall correspondence mail volumes declined sharply from 2006 to 2011, a period including the Great Recession.21 Household correspondence mail (correspondence mail sent and received between households) was hit particularly hard during that time, perhaps because of both the downturn of the economy and peoples’ acceptance of email and social media as an alternative form of communication. Surprisingly, correspondence mail sent and received between households and the government actually increased from 2006 to 2011. While household-to-household correspondence mail
is rapidly declining, businesses and governments still use the mail as a way of corresponding with households. This suggests that electronic communication has been a more effective replacement for physical mail when the parties involved have a more personal relationship, as is usually the case with household-to-household correspondence.
One of the key insights from the recent history of correspondence mail is that correspondence between households is unlikely to return to its peak volume levels. This suggests that the Postal Service needs to adjust and act accordingly to this new correspondence mail footprint.
Key Historic Factors That Have Affected Correspondence VolumeRCF identified five key underlying and interrelated factors that have affected the First-Class Mail correspondence segment. These factors are electronic diversion,
21 Total correspondence volume declined 2 billion pieces from 2001 to 2006, dropped almost 4 billion pieces from 2006 to 2011, followed by a 1 billion-piece decline from 2011 to 2016.22 U.S. Postal Service, Household Diary Survey (HDS) reports, FY 2001 to 2016.
the economy, age differences, postage prices, and security and privacy concerns. The impact of each factor on correspondence mail is discussed below.
Electronic DiversionIn the case of correspondence mail, electronic diversion refers to the replacement of letter mail with electronic communications such as e-mail, text messages, social media posts, and other communications sent online. Indeed, people often communicate many of life’s signature moments — graduation from college, weddings, or the birth of a child — through social media instead of through physical mail. For correspondence, electronic alternatives are an almost perfect substitute. This has rendered correspondence mail more vulnerable to electronic diversion after reaching its peak volume in 2002 with approximately 24 billion pieces.22
Exact measures of the electronic diversion of correspondence mail are not available. However, indirect evidence of the diversion of correspondence mail is available from the HDS. As Table 3 and Table 4 show, households with
broadband internet have experienced a much greater decline in the volume of correspondence mail than households that do not have access to the internet. This effect is even more obvious when looking at the period from 2011 to 2016, which largely removes the impact of the Great Recession on mail volume and allows for a cleaner look at the impact of internet access. Over this period, correspondence mail sent and received by households with broadband internet access fell 2.5 times more rapidly than for non-internet households.
Five key and interrelated
factors have affected
correspondence mail
in the last 15 years:
electronic diversion,
the economy, age
differences, postage
prices, and security and
privacy concerns.
Correspondence mail
sent and received
between households
and the government
and businesses has held
up better than personal
correspondence sent
and received between
households, which was
particularly hard-hit
during the last 15 years.
A New Reality: Correspondence Mail in the Digital Age Report Number RARC-WP-18-004
9
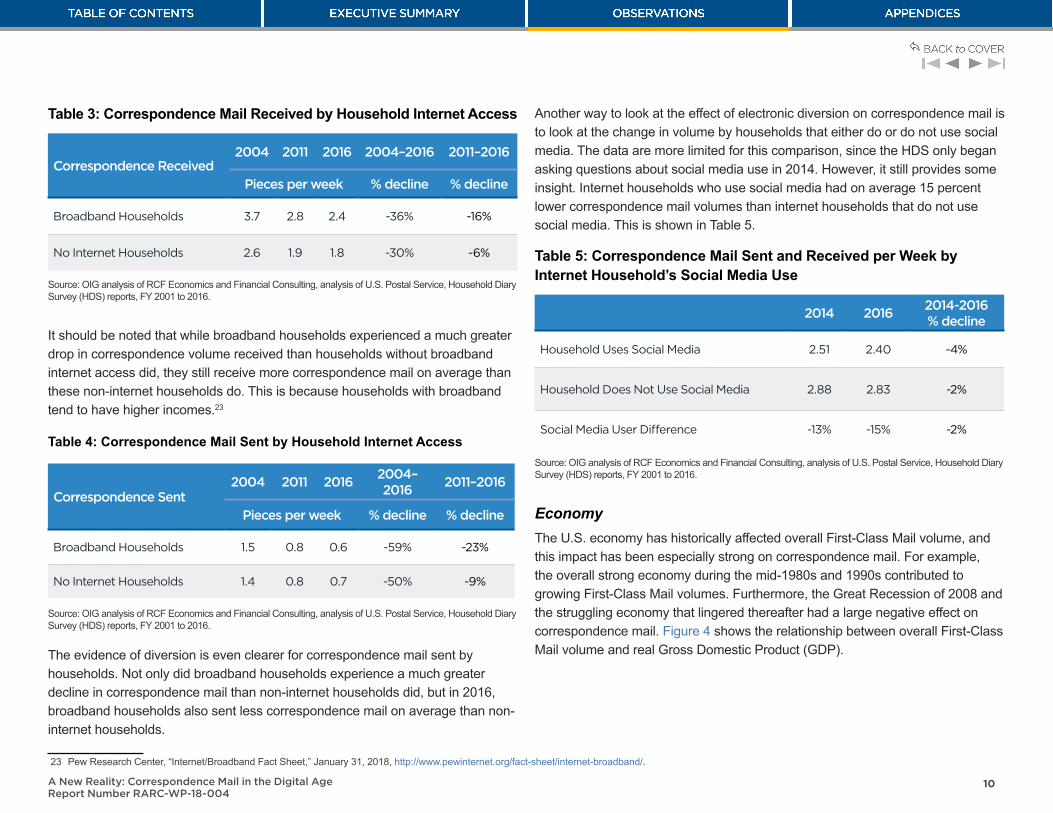
Table 3: Correspondence Mail Received by Household Internet Access
Correspondence Received2004 2011 2016 2004–2016 2011–2016
Pieces per week % decline % decline
Broadband Households 3.7 2.8 2.4 -36% -16%
No Internet Households 2.6 1.9 1.8 -30% -6%
Source: OIG analysis of RCF Economics and Financial Consulting, analysis of U.S. Postal Service, Household Diary Survey (HDS) reports, FY 2001 to 2016.
It should be noted that while broadband households experienced a much greater drop in correspondence volume received than households without broadband internet access did, they still receive more correspondence mail on average than these non-internet households do. This is because households with broadband tend to have higher incomes.23
Table 4: Correspondence Mail Sent by Household Internet Access
Correspondence Sent2004 2011 2016
2004–2016
2011–2016
Pieces per week % decline % decline
Broadband Households 1.5 0.8 0.6 -59% -23%
No Internet Households 1.4 0.8 0.7 -50% -9%
Source: OIG analysis of RCF Economics and Financial Consulting, analysis of U.S. Postal Service, Household Diary Survey (HDS) reports, FY 2001 to 2016.
The evidence of diversion is even clearer for correspondence mail sent by households. Not only did broadband households experience a much greater decline in correspondence mail than non-internet households did, but in 2016, broadband households also sent less correspondence mail on average than non-internet households.
23 Pew Research Center, “Internet/Broadband Fact Sheet,” January 31, 2018, http://www.pewinternet.org/fact-sheet/internet-broadband/.
Another way to look at the effect of electronic diversion on correspondence mail is to look at the change in volume by households that either do or do not use social media. The data are more limited for this comparison, since the HDS only began asking questions about social media use in 2014. However, it still provides some insight. Internet households who use social media had on average 15 percent lower correspondence mail volumes than internet households that do not use social media. This is shown in Table 5.
Table 5: Correspondence Mail Sent and Received per Week by Internet Household’s Social Media Use
2014 20162014-2016 % decline
Household Uses Social Media 2.51 2.40 -4%
Household Does Not Use Social Media 2.88 2.83 -2%
Social Media User Difference -13% -15% -2%
Source: OIG analysis of RCF Economics and Financial Consulting, analysis of U.S. Postal Service, Household Diary Survey (HDS) reports, FY 2001 to 2016.
EconomyThe U.S. economy has historically affected overall First-Class Mail volume, and this impact has been especially strong on correspondence mail. For example, the overall strong economy during the mid-1980s and 1990s contributed to growing First-Class Mail volumes. Furthermore, the Great Recession of 2008 and the struggling economy that lingered thereafter had a large negative effect on correspondence mail. Figure 4 shows the relationship between overall First-Class Mail volume and real Gross Domestic Product (GDP).
A New Reality: Correspondence Mail in the Digital Age Report Number RARC-WP-18-004
10

Figure 4: First-Class Mail Volume and Real GDP
A WEAKENING RELATIONSHIP BEGINNING IN THE LATE 1990sUntil the mid-1990s, First-Class Mail volume was almost in lockstep with real GDP. However, after the late 1990s, this relationship has weakened. First-Class Mail is now in decline even as real GDP grows.
0
50
100
150
200
250
300
350
1976 1981 1986 1991 1996 2001 2006 2011 2016
Inde
x (1
976
= 10
0)
Real GDP First-Class Mail
The Great RecessionRecession
Source: OIG analysis of RCF Economics and Financial Consulting, analysis of U.S. Postal Service,Household Diary Survey (HDS) reports, FY 2001 to 2016.
As Figure 4 shows, during the 1970s and 1980s, First-Class Mail volume moved almost in lockstep with changes in real GDP. During these two decades, both grew at an annual average rate of 3 percent per year.24 Beginning in the late 1990s, the relationship between First-Class Mail volume and GDP began to weaken. Though clearly still affected by the economy, First-Class Mail volume grew at a slower rate, or declined at a faster rate than real GDP.25
24 RCF analysis.25 The weakness of mail volumes relative to GDP appears to be primarily due to the replacement of letter mail with technological alternatives. OIG analysis of RCF Economics and Financial Consulting, analysis of U.S.
Postal Service, Household Diary Survey (HDS) reports, FY 2001 to 2016.
Age DifferencesAnother key factor that has historically affected correspondence mail usage is difference in the use of mail by age. The age of the head of a household is strongly correlated with its use of correspondence mail. For example, households headed by someone 25 to 34 years old sent and received an average of 1.6 pieces of correspondence mail per week in 2016. Households headed by someone age 65 or older sent nearly twice as many: 3.1 pieces of correspondence mail per week during this time.
Historically, younger people have used the mail less than older people have, but their mail use generally increased as they aged. However, it is unclear if this same behavior will continue in the future. Younger people have grown up using electronic alternatives like social media and texting their entire lives, and may never use mail for personal correspondence. Figure 5 shows that mail use for all ages has declined over time. An interesting question is how much of this decline is due to the overall decline in correspondence mail, and how much is driven by the fact that as the younger population ages, they do not adopt letter mail for the purpose of communication.
A New Reality: Correspondence Mail in the Digital Age Report Number RARC-WP-18-004
11

Figure 5: Correspondence Mail Sent and Received per Week by Age of Household Head
0
1
2
3
4
5
6
2001
2002
2003
2004
2005
2006
2007
2008
2009
2010
2011
2012
2013
2014
2015
2016
Piec
es p
er W
eek
65+ 55 - 64 45 - 54 35- 44 25 - 34
Source: OIG analysis of RCF Economics and Financial Consulting, analysis of U.S. Postal Service, Household Diary Survey (HDS) reports, FY 2001 to 2016.
Security and Privacy ConcernsThe development of digital communication has created concerns about the security and privacy of online activities, particularly in light of recent data security failures. Such breaches at corporations such as Equifax, Uber, and Yahoo demonstrate that digital information is vulnerable to tampering and theft.26 This leads some people to rely on the security of hard copy mail. Data from the HDS show that households that believe the internet is less secure than the mail tend to use the mail more than other households do. If digital security issues become more disruptive and more commonplace, it is possible that customers reluctant to use digital communication options could generate additional First-Class correspondence mail.
26 Equifax, one of the three credit reporting agencies in the United States, announced that it was hacked between mid-May and July 2017. The Equifax data breach was serious because the data breach could potentially affect 143 million U.S. consumers. Personal data including names, birth dates, social security numbers, addresses, and some drivers’ license numbers were obtained in this breach. The Equifax data breach is only the latest in a long line of security hacks, which include data breaches at Target, Home Depot, and others. Selena Larson, “The hacks that left us exposed in 2017,” CNN Tech, December 20, 2017, http://money.cnn.com/2017/12/18/technology/biggest-cyberattacks-of-the-year/index.html.
Evidence of the impact of technology on correspondence mail volumes comes from looking at households’ perceptions of the security of the internet versus the mail. However, while the number of households who believe the mail is more secure greatly outnumber those who believe the internet is more secure, most households believe that mail and the internet are equally secure. Additionally, these perceptions have not changed significantly over the last five years, making it unlikely that distrust of digital communication will result in growing mail volume.
Some Future Scenarios for First-Class Correspondence MailTo illustrate the potential impact of these historical factors on correspondence mail, the OIG asked RCF, a postal economics firm with over three decades of experience in monitoring trends in Postal Service mail volume and their underlying causes, to develop five hypothetical scenarios for future correspondence mail volume. The scenarios are intended to provide guidance on the potential effects of a variety of situations. They are not meant to provide actual volume forecasts. They are also not mutually exclusive; these scenarios may occur in combination, with correspondingly compounded impacts on volume. The scenarios make different assumptions about the speed of electronic diversion, the continuation of current trends, the impact of household age demographics, and changes in privacy and security concerns.
The five scenarios are:
1. Current Trends Continue
2. Age Differences Dominate
3. Electronic Diversion Accelerates
4. Electronic Diversion Slows
5. Privacy and Security Concerns Increase
A New Reality: Correspondence Mail in the Digital Age Report Number RARC-WP-18-004
12
Although RCF did not assess the probability of each scenario actually occurring, some of the scenarios are much more likely than others. For example, it is reasonable to assume that technological progress will continue and that the likelihood of electronic diversion accelerating is high. In contrast, it is not very likely that an event will occur that will significantly change consumers’ use of online communications in favor of physical mail due to privacy and security concerns.
Current Trends Continue assumes that household correspondence mail volumes continue to decline at the same rate as they have over the past five years. Focusing on the past five years is useful because it eliminates the large volume declines during the Great Recession, which were outliers compared to what might be expected over the course of a normal business cycle. This should not be viewed as a likely scenario, but instead as a baseline around which other scenarios can be compared.
Age Differences Dominate focuses on the growing discrepancy between the volumes of mail sent and received by younger and older households. During the past five years, a number of new technological applications have spread, many geared toward younger people. As such, younger people send and receive far less correspondence mail than older people do. A reasonable conjecture is that these innovations have fundamentally changed how young people use the mail, and that this change will persist as this cohort ages. In other words, in contrast to historical trends, mail use will not increase as people age.
Electronic Diversion Accelerates is based on the finding that as more and more people have access to broadband internet, their use of correspondence mail declines. This scenario assumes both an increase in the rate of broadband adoption and an increase in the decline of mail among those that have broadband access. This scenario assumes that by 2026 virtually all Americans have broadband internet access and use the internet as a ready substitute for correspondence mail.
Electronic Diversion Slows takes the opposite of the scenario above. It assumes that electronic diversion is approaching a ceiling, and that most of the correspondence mail that could be replaced by electronic alternatives has already been replaced. This scenario results in a relatively flat projection of correspondence mail, as the small projected decline in volume per household is offset by the projected increase in the number of households.
Privacy and Security Concerns Increase focuses on the possibility of a change in people’s perception of the security of the internet and how such a change in perception could increase the use of mail. This scenario assumes that the portion of the population that believes the mail is more secure than the internet, and subsequently uses more mail, doubles over the next decade. This scenario appears highly unlikely.
Figure 6 summarizes the scenarios.
A New Reality: Correspondence Mail in the Digital Age Report Number RARC-WP-18-004
13
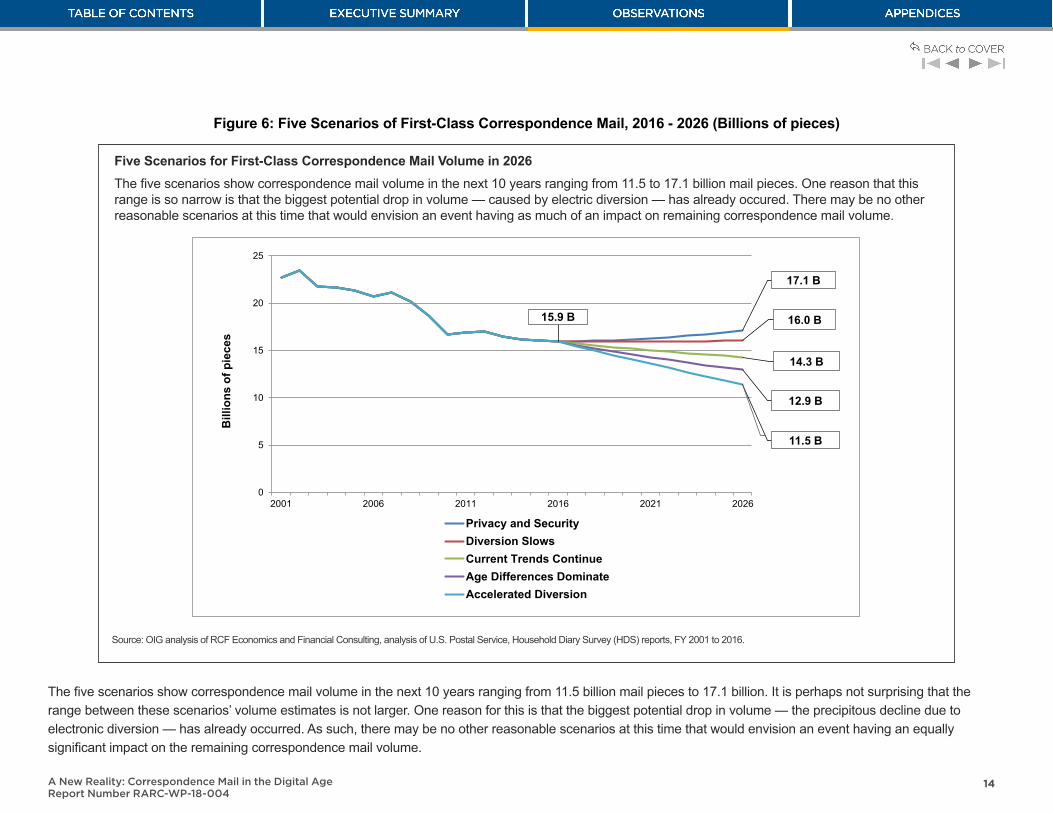
Figure 6: Five Scenarios of First-Class Correspondence Mail, 2016 - 2026 (Billions of pieces)
Five Scenarios for First-Class Correspondence Mail Volume in 2026The five scenarios show correspondence mail volume in the next 10 years ranging from 11.5 to 17.1 billion mail pieces. One reason that this range is so narrow is that the biggest potential drop in volume — caused by electric diversion — has already occured. There may be no other reasonable scenarios at this time that would envision an event having as much of an impact on remaining correspondence mail volume.
Five Scenarios for First-Class Correspondence Mail Volume in 2026The five scenarios show correspondence mail volume in the next 10 years ranging from 11.5 to 17.1 billion mail pieces. One reason that this range is so narrow is that the biggest potential drop in volume — caused by electronic diversion —has already occurred. There may be no other reasonable scenarios at this time that would envision an event having as much of an impact on remaining correspondence mail volume.
17.1 B
16.0 B
14.3 B
12.9 B
15.9 B
11.5 B
0
5
10
15
20
25
2001 2006 2011 2016 2021 2026
Bill
ions
of p
iece
s
Privacy and SecurityDiversion SlowsCurrent Trends ContinueAge Differences DominateAccelerated Diversion
Source: OIG analysis of RCF Economics and Financial Consulting, analysis of U.S. Postal Service, Household Diary Survey (HDS) reports, FY 2001 to 2016.
The five scenarios show correspondence mail volume in the next 10 years ranging from 11.5 billion mail pieces to 17.1 billion. It is perhaps not surprising that the range between these scenarios’ volume estimates is not larger. One reason for this is that the biggest potential drop in volume — the precipitous decline due to electronic diversion — has already occurred. As such, there may be no other reasonable scenarios at this time that would envision an event having an equally significant impact on the remaining correspondence mail volume.
A New Reality: Correspondence Mail in the Digital Age Report Number RARC-WP-18-004
14

These scenarios highlight the potential consequences of changes in the key factors that affect correspondence mail volumes. Although these scenarios are only hypothetical, the risk to the Postal Service is real and obvious. A significant decline in correspondence mail volume would have a major negative impact on revenue and contribution and, as such, have adverse consequences for the Postal Service’s bottom line, as well as its ability to support its physical network and meet its universal service obligation. The only scenario that could lead to some volume growth is the one in which the internet is considered so risky that people turn back to using physical mail — a theoretically possible, but highly improbable scenario.
There may be little the Postal Service can do to grow the volume of correspondence mail. The bottom line is that the correspondence segment of First-Class Mail is in a sustained decline, and a return to its annual peak of 24 billion pieces is impractical. However, that does not mean that the Postal Service is without options. The way forward likely means accepting and adjusting to a smaller correspondence mail footprint. In addition, the Postal Service could shore up correspondence mail by continuing to explore ways of increasing the value of the mail, most particularly innovative means of incorporating digital elements in physical mail pieces. The next section of this paper highlights some of the actions the Postal Service has already taken on this front, and suggests additional strategies that could help maintain the great value of correspondence mail.
Keeping First-Class Correspondence Mail RelevantShoring up correspondence mail may be challenging, as there are no quick fixes to the long-term volume decline in this segment. Although advances in technology have clearly chipped away at correspondence mail volumes, some may present
27 U.S. Postal Service, “Hallmark and Postal Service Launch Postage-Paid Greetings — Barcoded Envelopes and Scanning Technology Innovate Card-Sending”, March 24, 2011, http://about.usps.com/postal-bulletin/2011/pb22307/html/info_001.htm.
28 These promotions are often applied to First-Class transactions mail or to Marketing Mail. Examples of such promotions include the Personalized Color Transpromo Promotion, the Emerging and Advanced Technology Promotion, and a Tactile, Sensory, and Interactive Mailpiece Engagement promotion added in 2017. Interview with the Postal Service Marketing Department, November 3, 2017. Note that there is currently a hiatus in the promulgation of promotional discounts. According to some commentators, the Postal Service lacks the authority to offer promotions in the absence of a Board of Governors. According to its bylaws, the Postal Service may not lawfully complete matters that are reserved for decision by the Board. The bylaws of the Board list these matters in Sec. 3.4. If promotions fall under these matters, then the Postal Service will be unable to complete them lawfully in the absence of Governors being seated on the Board. Kathleen J. Siviter, “What Does the USPS Need to Succeed? A Board of Governors, for Starters…,” Mailing Systems Technology, November 21, 2017, http://mailingsystemstechnology.com/article-4271-What-Does-the-USPS-Need-to-Succeed-A-Board-of-Governors-for-Starters&hellip.html and OIG, Governance of the U.S. Postal Service, Report No. RARC-WP-17-002, November 10, 2016, https://www.uspsoig.gov/sites/default/files/document-library-files/2016/RARC-WP-17-002.pdf#page=2.
29 U.S. Postal Service, “2017 Personalized Color Transpromo Promotion”, October 31, 2017, https://ribbs.usps.gov/mailingpromotions/documents/tech_guides/2017PersonalizedColorTranspromoPromotionFAQs.pdf.30 US Postal Service, Product Innovation, “Programs Update,” December 8, 2017.
opportunities to enhance the value of physical mail. The key to this may be further development of products that bridge physical and digital communications.
The Postal Service has already taken some meaningful steps in this direction. For example, it has collaborated in the past with Hallmark to launch postage paid greeting cards. The 2011 collaboration between the Postal Service and Hallmark featured a USPS Intelligent Mail barcode (IMb) on the front of an envelope of a Hallmark greeting card. That IMb postage functions like a Forever Stamp, with a value equal to the price of a regular First-Class stamp.27
The Postal Service also has developed a number of promotions and incentives to encourage mailers to use mail in innovative ways, including some that enhance physical mail pieces by integrating them with digital technology.28 For example in 2017, the Postal Service ran the Personalized Color Transpromo Promotion. This promotion incorporated marketing messages highlighted using color, dynamic variable print and personalization. It was intended as a way to grow the value of First-Class Mail and to encourage mailers to invest in color print technology.29
The Postal Service is also providing mail recipients with a way of viewing images of their hardcopy mail through its Informed Delivery Service, and is partnering with Plug and Play, a private sector global innovation platform, to help generate innovative ideas and conduct pilot programs.30
A number of services exist that allow their customers to generate customized physical postcards and greeting cards based on digital messages, including photos. Through mobile and desktop applications, these services provide an easy way for customers to create and send physical correspondence mail through means already at their fingertips. By removing the steps of purchasing or printing physical stationary and postage in favor of familiar digital avenues, these services
A New Reality: Correspondence Mail in the Digital Age Report Number RARC-WP-18-004
15
merge the benefits of physical correspondence with the instant gratification and customization of digital services. The OIG interviewed representatives of two companies that provide such services. The representatives indicated that they developed the mobile apps and handled customer service, but used third-party printing companies to print and mail the postcards and greeting cards. They reported that their customers often use the service to send correspondence for occasions such as holidays and birthdays, as well as to send postcards while traveling. As of 2017, the companies charge around $2 to $3 to create and send a postcard and around $5 to create and send greeting cards, with international postage available for an additional dollar. Multiple copies of a card may be created and mailed at once, a use common for holidays and for travel correspondence.31
The extent to which companies such as these succeed will help indicate the value customers place in physical correspondence. It will also help indicate the extent to which they are willing to spend money on it. Sending a postcard or greeting card through mobile apps such as these provides recipients with a tangible, physical copy of the correspondence unavailable with digital correspondence. Furthermore, it allows digital-savvy senders to correspond with recipients who do not want or do not have ready access to digital correspondence. Making physical correspondence available through a mobile app provides the best of both worlds, with the customization and convenience to the sender of digital
31 OIG interviews with managers of Sincerely, Inc. and SnapShot Postcard, December 18, 2017.32 Australia Post, Postcards App, https://auspost.com.au/travel-essentials/postcards-app.33 Swiss Post, “Send free postcards from your mobile phone,” March 20, 2014, https://www.post.ch/en/about-us/company/media/press-releases/2014/send-free-postcards-from-your-mobile-phone and Swiss Post,
“PostCard Creator,” https://itunes.apple.com/ch/app/postcard-creator/id820354055?mt=8 (translated into English on Google Chrome).
correspondence and the simplicity and tangibility of physical correspondence. This may be the new reality for correspondence mail.
Some foreign posts have made similar digital services available. Australia Post offers its own postcard creation app, allowing customers to design and send custom postcards printed with their own photos, directly from their smartphones.32 Swiss Post offers a similar postcard app that allows customers to send custom postcards for a small cost, including one postcard per day anywhere in Switzerland or Liechtenstein for free. These free postcards bear short Swiss Post advertising messages.33 Promoting or creating similar digital services to make sending such communication more convenient may help the Postal Service to encourage the use of First-Class correspondence mail.
Given that customers have demonstrated the value that mobile postcard and greeting card services provide them, the Postal Service may consider similar promotions and incentives for innovations and digital services to encourage the use of First-Class correspondence mail. The goal of such programs would not necessarily be to restore the growth of First-Class correspondence mail. Merely slowing its decline would be a successful outcome. More importantly, encouraging the continued development of modern, convenient ways for customers to use its highest contribution product for their correspondence would help keep the Postal Service relevant to business customers and individual users alike.
ConclusionThe long-term decline in the volume of its flagship product, First-Class Mail, is one of the most critical problems facing the Postal Service. Specifically, correspondence mail faces substantial threats to its volume — a generation is growing up that has little experience sending mail. While even under the best of circumstances this mail segment will never return to its peak volume, opportunities exist that could keep correspondence mail relevant. Strategies designed to mitigate threats to volume and to engage with the newly dominant digital communications industry can help to protect First-Class correspondence mail and make it relevant once again for future generations.
The extent to which
mobile postcard and
greeting card apps
succeed will help indicate
the value customers
place in physical
correspondence — and
the extent to which they
are willing to spend
money on it.
A New Reality: Correspondence Mail in the Digital Age Report Number RARC-WP-18-004
16

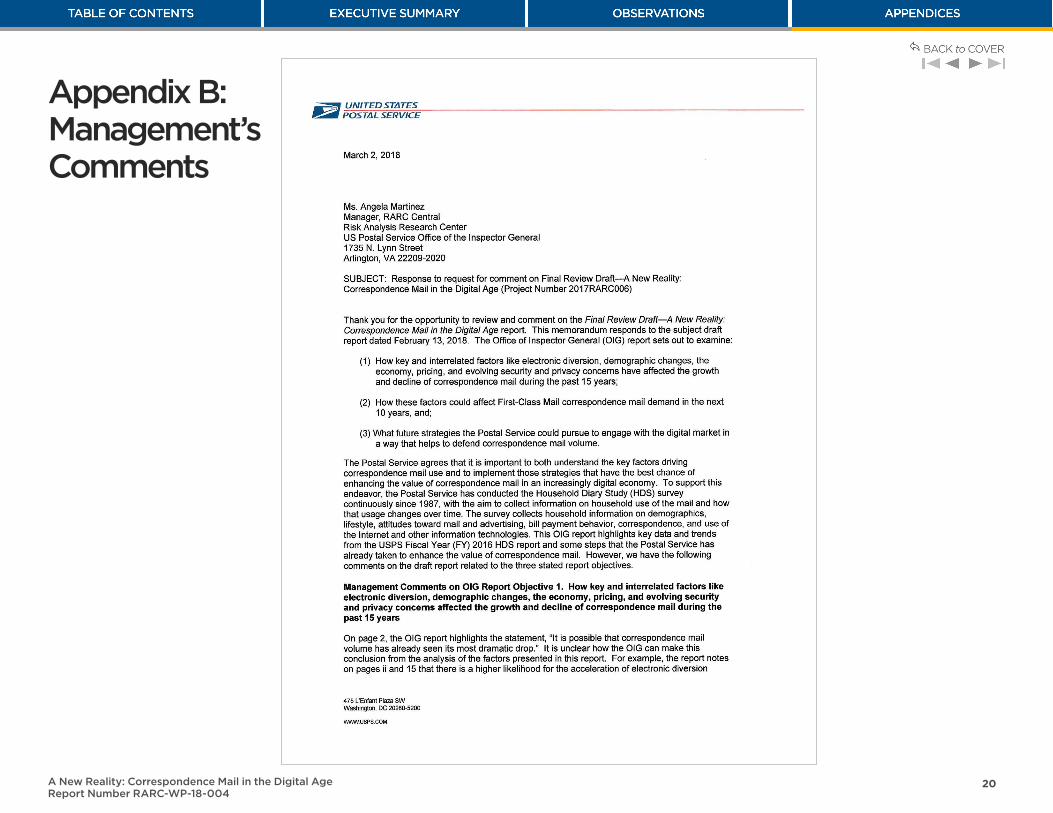
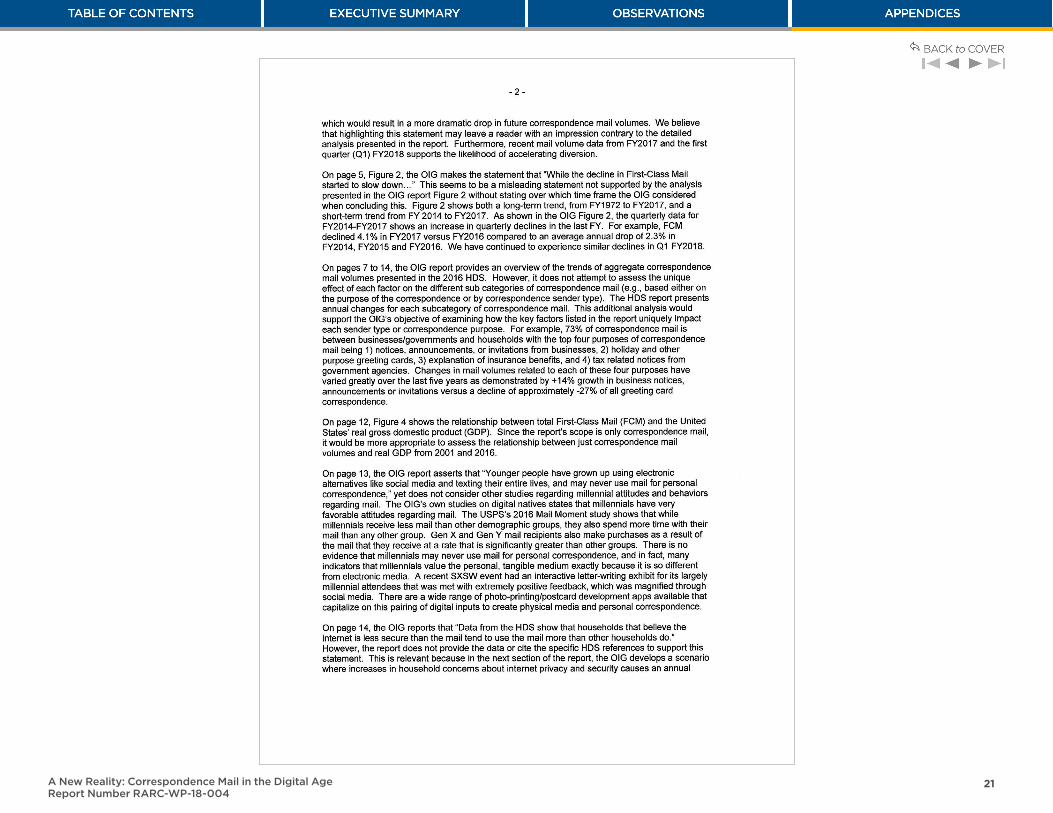
Management’s CommentsManagement acknowledges that it is important to both understand the key factors driving correspondence mail use and to implement those strategies that have the best chance of enhancing the value of correspondence mail in an increasingly digital economy. They also provide constructive and detailed comments, including the availability of subcategory data in the Postal Service’s Household Diary Study (HDS), the Postal Service’s 2016 Mail Moment Study, suggestions for detailed assessments of potential opportunities for defending correspondence mail volume, as well as other helpful context.
See Appendix B for management’s comments in their entirety.
Evaluation of Management’s CommentsRegarding the comments on the statement, “It is possible that correspondence mail volume has already seen its most dramatic drop,” the OIG does not draw this as a definitive conclusion. We acknowledge the possibility that a future decline could be more dramatic still, but suggest the alternative possibility that the rate of decline corresponding with the years of the Great Recession may be more dramatic than the rate of decline associated with continuing or accelerated electronic diversion in future years.
Regarding the comment on Figure 2, the OIG acknowledges that recently quarterly data show an increase in quarterly declines over the last fiscal year. The HDS data presented in the left-side graph do show a slower rate of volume decline from 2012 to 2017 than from 2006 to 2012.
The Postal Service is correct that the 2016 Mail Moment study, as well as OIG work on digital natives, shows that millennials have very favorable attitudes
toward the mail, spending more time with their mail and making more purchases as a result of the mail than other age groups do. However, while it may be an overstatement to say that “Younger people…may never use mail for personal correspondence,” neither the 2016 Mail Moment study nor the OIG’s work on digital natives indicate a strong affinity for correspondence mail in particular among younger age cohorts. First, the OIG work on digital natives focused exclusively on Marketing Mail. Second, favorable attitudes toward mail in general does not imply a propensity to send more correspondence mail. With that in mind, the photo-printing and postcard creation apps available do represent promising ways to encourage younger people to use correspondence mail, and the OIG is pleased that the Postal Service acknowledges the potential to “capitalize on this pairing of digital inputs to create physical media and personal correspondence.”
Regarding the statement, “Data from the HDS show that households that believe the internet is less secure than the mail tend to use the mail more than other households do,” it is supported by analysis of the responses to the question, “Do you feel more secure providing and/or receiving personal information through the Internet or through the U.S. Mail, or is it about the same?” See, for example, Question 70 [Q177F] of the 2016 HDS Recruitment Web Questionnaire. Regarding the “Privacy and Security Concerns Increase” scenario more generally, this scenario and the others, with the exception of the “Current Trends Continue” scenario, are hypotheticals based on the application of the corresponding historical factors and are not based on past trends in mail volume.
Finally, the OIG appreciates management’s suggestions of additional analysis on how historical factors could impact the different subcategories of correspondence mail as well as a closer look at potential opportunities to mitigate correspondence mail volume decline. Such analyses were beyond the scope of this report, but would be promising avenues for future work.
A New Reality: Correspondence Mail in the Digital Age Report Number RARC-WP-18-004
17

AppendicesClick on the appendix title below to navigate to the section content.
Appendix A: Postal Service Household Diary Study .................................................................. 19
Appendix B: Management’s Comments .......................................................................................... 20
A New Reality: Correspondence Mail in the Digital Age Report Number RARC-WP-18-004
1818A New Reality: Correspondence Mail in the Digital Age Report Number RARC-WP-18-004
Appendix A: Postal Service Household Diary StudyThe Postal Service Household Diary Study (HDS) is an excellent data source that provides information on mail volumes otherwise unavailable. The HDS is an annual sample of approximately 5,000 households, and reports on the mail these households send and receive over the course of a week. In addition to information about the mail, the HDS and its companion survey (known as the Recruitment Survey) provide data on household demographics, such as age of household head, education, income, home ownership, internet access, and other variables.
While the HDS is a key source of information about mail volumes sent and received by households, it contains no information about mail sent from non-households (business and governments) to other non-households. However, the vast majority of First-Class Mail is sent or received by households. Moreover, non-household-to-non-household mail has generally followed a similar trend
as household mail and both these mail segments have been similarly affected by the economy, technology, and demographic changes. Therefore, the information obtained from the HDS about household mail goes a long way toward understanding total First-Class Mail.
NuStats of Austin, Texas conducts the survey. Results are tabulated and analyzed by NuStats, RCF, and the Postal Service. The HDS results are weighted by key demographic factors so that they reflect the demographic characteristics of the entire U.S. population based on Census data.
The HDS dates back to 1987. However, due to changes in the survey processes over the years, information from earlier years is not always directly comparable to data since 2001. As discussed in the main text of the paper, our analysis focuses on First-Class household transactions and correspondence mail for the period of 2001 through 2016.
A New Reality: Correspondence Mail in the Digital Age Report Number RARC-WP-18-004
19
Appendix B: Management’s Comments
A New Reality: Correspondence Mail in the Digital Age Report Number RARC-WP-18-004
20
A New Reality: Correspondence Mail in the Digital Age Report Number RARC-WP-18-004
21

A New Reality: Correspondence Mail in the Digital Age Report Number RARC-WP-18-004
22
Contact Information
We conducted work for this white paper in accordance with the Council of the Inspectors General on Integrity and Efficiency’s Quality Standards for Inspection and Evaluation (January 2012).
Contact us via our Hotline and FOIA forms. Follow us on social networks.
Stay informed.
1735 North Lynn Street Arlington, VA 22209-2020
(703) 248-2100