(a) no magnetic field · which was obtained with a 2.3-tesla static magnetic field and a...
TRANSCRIPT
(a) No Magnetic Field
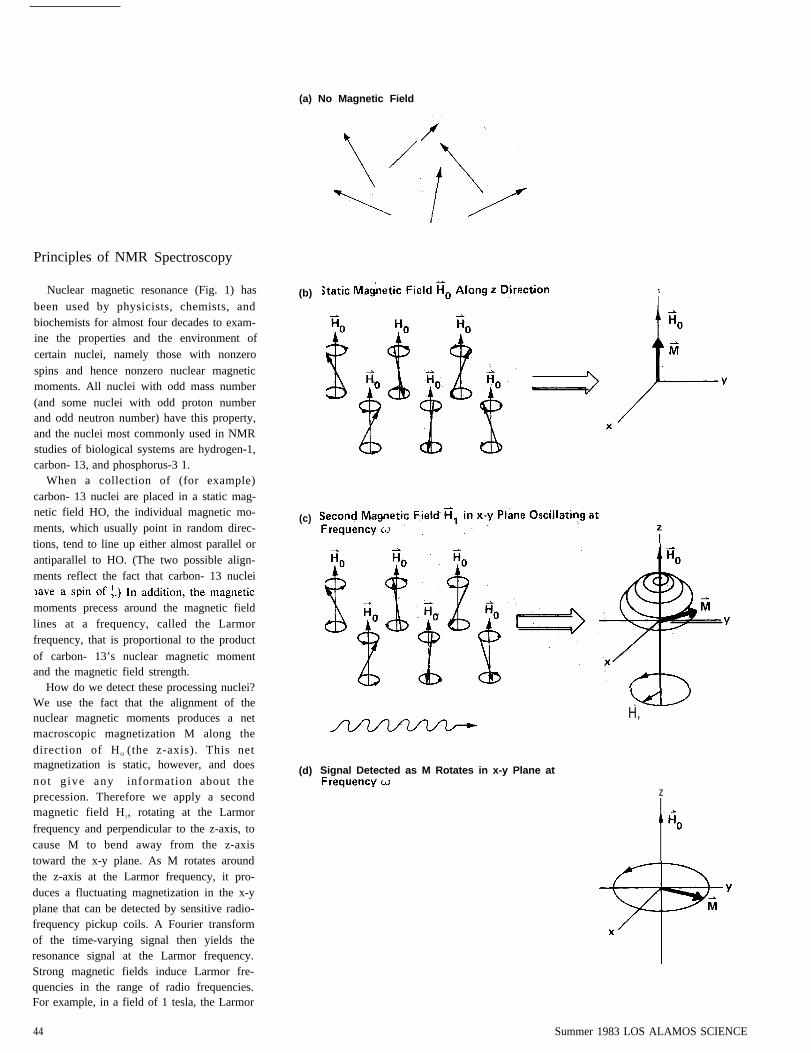
Principles of NMR Spectroscopy
Nuclear magnetic resonance (Fig. 1) has
been used by physicists, chemists, andbiochemists for almost four decades to exam-ine the properties and the environment ofcertain nuclei, namely those with nonzerospins and hence nonzero nuclear magneticmoments. All nuclei with odd mass number(and some nuclei with odd proton numberand odd neutron number) have this property,and the nuclei most commonly used in NMRstudies of biological systems are hydrogen-1,carbon- 13, and phosphorus-3 1.
When a collection of (for example)carbon- 13 nuclei are placed in a static mag-netic field HO, the individual magnetic mo-ments, which usually point in random direc-tions, tend to line up either almost parallel orantiparallel to HO. (The two possible align-ments reflect the fact that carbon- 13 nuclei
moments precess around the magnetic fieldlines at a frequency, called the Larmorfrequency, that is proportional to the product
of carbon- 13’s nuclear magnetic momentand the magnetic field strength.
How do we detect these processing nuclei?We use the fact that the alignment of thenuclear magnetic moments produces a netmacroscopic magnetization M along thedirection of HO (the z-axis). This netmagnetization is static, however, and does
not give any information about theprecession. Therefore we apply a secondmagnetic field H1, rotating at the Larmor
frequency and perpendicular to the z-axis, tocause M to bend away from the z-axistoward the x-y plane. As M rotates aroundthe z-axis at the Larmor frequency, it pro-duces a fluctuating magnetization in the x-yplane that can be detected by sensitive radio-frequency pickup coils. A Fourier transformof the time-varying signal then yields theresonance signal at the Larmor frequency.Strong magnetic fields induce Larmor fre-quencies in the range of radio frequencies.For example, in a field of 1 tesla, the Larmor
44
(b)
(c)
(d) Signal Detected as M Rotates in x-y Plane at
H,
z
Summer 1983 LOS ALAMOS SCIENCE
Metabolism as it happens
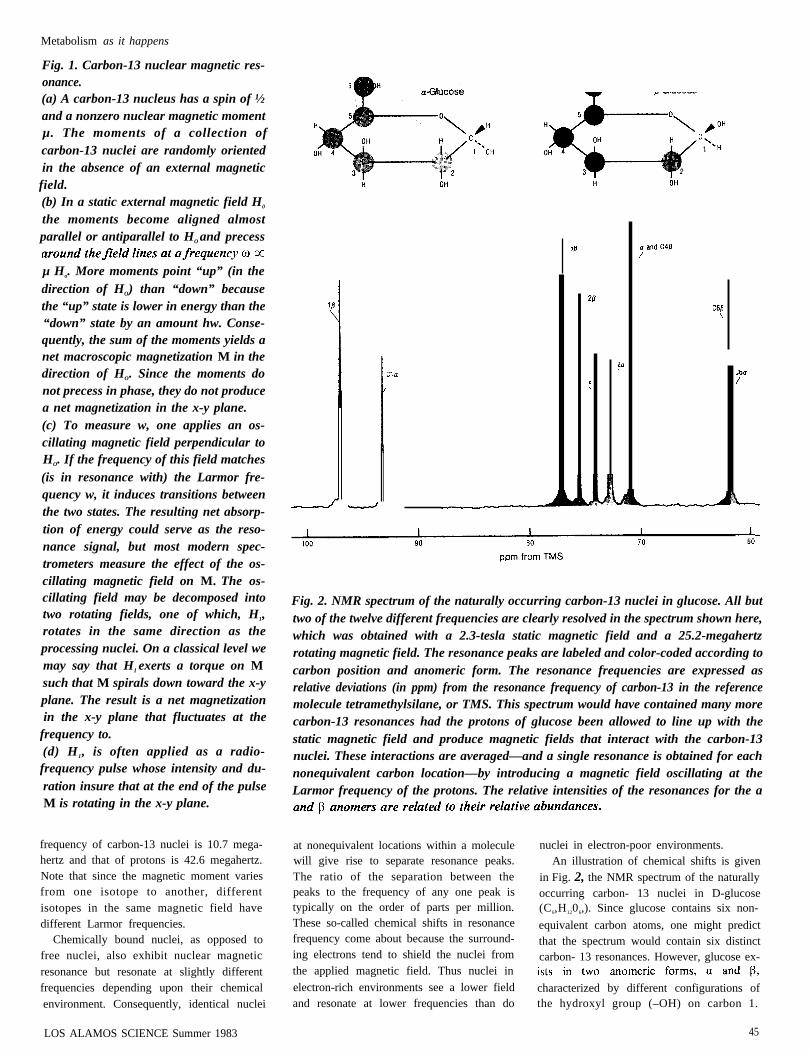
Fig. 1. Carbon-13 nuclear magnetic res-onance.(a) A carbon-13 nucleus has a spin of ½and a nonzero nuclear magnetic momentµ. The moments of a collection ofcarbon-13 nuclei are randomly orientedin the absence of an external magneticfield.(b) In a static external magnetic field H0
the moments become aligned almostparallel or antiparallel to HO and precess
µ Ho. More moments point “up” (in thedirection of HO) than “down” becausethe “up” state is lower in energy than the“down” state by an amount hw. Conse-quently, the sum of the moments yields anet macroscopic magnetization M in thedirection of HO. Since the moments donot precess in phase, they do not producea net magnetization in the x-y plane.(c) To measure w, one applies an os-cillating magnetic field perpendicular toHO. If the frequency of this field matches(is in resonance with) the Larmor fre-quency w, it induces transitions betweenthe two states. The resulting net absorp-tion of energy could serve as the reso-nance signal, but most modern spec-trometers measure the effect of the os-cillating magnetic field on M. The os-cillating field may be decomposed intotwo rotating fields, one of which, H1,rotates in the same direction as theprocessing nuclei. On a classical level wemay say that H1 exerts a torque on Msuch that M spirals down toward the x-yplane. The result is a net magnetizationin the x-y plane that fluctuates at the
frequency to.(d) H1, is often applied as a radio-frequency pulse whose intensity and du-ration insure that at the end of the pulseM is rotating in the x-y plane.
frequency of carbon-13 nuclei is 10.7 mega-hertz and that of protons is 42.6 megahertz.Note that since the magnetic moment variesfrom one isotope to another, differentisotopes in the same magnetic field havedifferent Larmor frequencies.
Chemically bound nuclei, as opposed tofree nuclei, also exhibit nuclear magneticresonance but resonate at slightly differentfrequencies depending upon their chemicalenvironment. Consequently, identical nuclei
LOS ALAMOS SCIENCE Summer 1983
Fig. 2. NMR spectrum of the naturally occurring carbon-13 nuclei in glucose. All buttwo of the twelve different frequencies are clearly resolved in the spectrum shown here,which was obtained with a 2.3-tesla static magnetic field and a 25.2-megahertzrotating magnetic field. The resonance peaks are labeled and color-coded according tocarbon position and anomeric form. The resonance frequencies are expressed asrelative deviations (in ppm) from the resonance frequency of carbon-13 in the referencemolecule tetramethylsilane, or TMS. This spectrum would have contained many morecarbon-13 resonances had the protons of glucose been allowed to line up with thestatic magnetic field and produce magnetic fields that interact with the carbon-13nuclei. These interactions are averaged—and a single resonance is obtained for eachnonequivalent carbon location—by introducing a magnetic field oscillating at theLarmor frequency of the protons. The relative intensities of the resonances for the a
at nonequivalent locations within a moleculewill give rise to separate resonance peaks.The ratio of the separation between thepeaks to the frequency of any one peak istypically on the order of parts per million.These so-called chemical shifts in resonancefrequency come about because the surround-ing electrons tend to shield the nuclei fromthe applied magnetic field. Thus nuclei in
electron-rich environments see a lower fieldand resonate at lower frequencies than do
nuclei in electron-poor environments.An illustration of chemical shifts is given
in Fig. 2, the NMR spectrum of the naturallyoccurring carbon- 13 nuclei in D-glucose(C6,H1206,). Since glucose contains six non-
equivalent carbon atoms, one might predictthat the spectrum would contain six distinctcarbon- 13 resonances. However, glucose ex-
characterized by different configurations ofthe hydroxyl group (–OH) on carbon 1.
45
Glucose ( C6H ,20 6)
Consequently, its spectrum contains not sixbut twelve resonances corresponding to sixcarbons in two anomeric forms. The separa-
a location relatively distant from theanomeric carbon atom, is testimony to theability of NM R spectroscopy to detect rathersubtle structural features. In addition, properselection of instrumental parameters makesit possible to determine the relative amountsof different substances directly from therelative intensities of the resonances. Forexample, from the relative intensities of the
dominates by a factor of 2,For our experiments with 13C-labeled
molecules, we use a pulsed NMR techniquein which the applied radio-frequency pulsehas a bandwidth that covers the spread incarbon- 13 resonance frequencies. A Fouriertransform of the time-varying signal inducedby the pulse then yields the frequencies of allthe carbon- 13 resonances.
Early NMR Studies of Metabolismin Vivo
About ten years ago one of us (Matwiyoff)began to explore the utility of applyingcarbon- 13 labeling and NMR spectroscopyto monitor metabolic processes in livingsystems. The Laboratory was already in-volved in separating carbon-13 fromcarbon- 12 and in finding methods to in-corpora te th is i so tope in to organicmolecules. Since carbon-1 3 is chemicallyidentical to carbon- 12, 13 C-labeled moleculescould be introduced into living systemswithout compromising their biochemical ac-tivity. Moreover, since carbon-1 3 is normallypresent in organic molecules at very lowlevels (1.1 percent), its introduction throughlabeling would greatly enhance the sensitivityof NMR tracer studies. Such studies requiresubjecting living systems to magnetic andradio-frequency fields. but these fields areessentially nondestructive.
46
2 Phosphoenol-
Net Production 2 Pyruvate
of ATP
2 Ethanol ( C2H 50H)
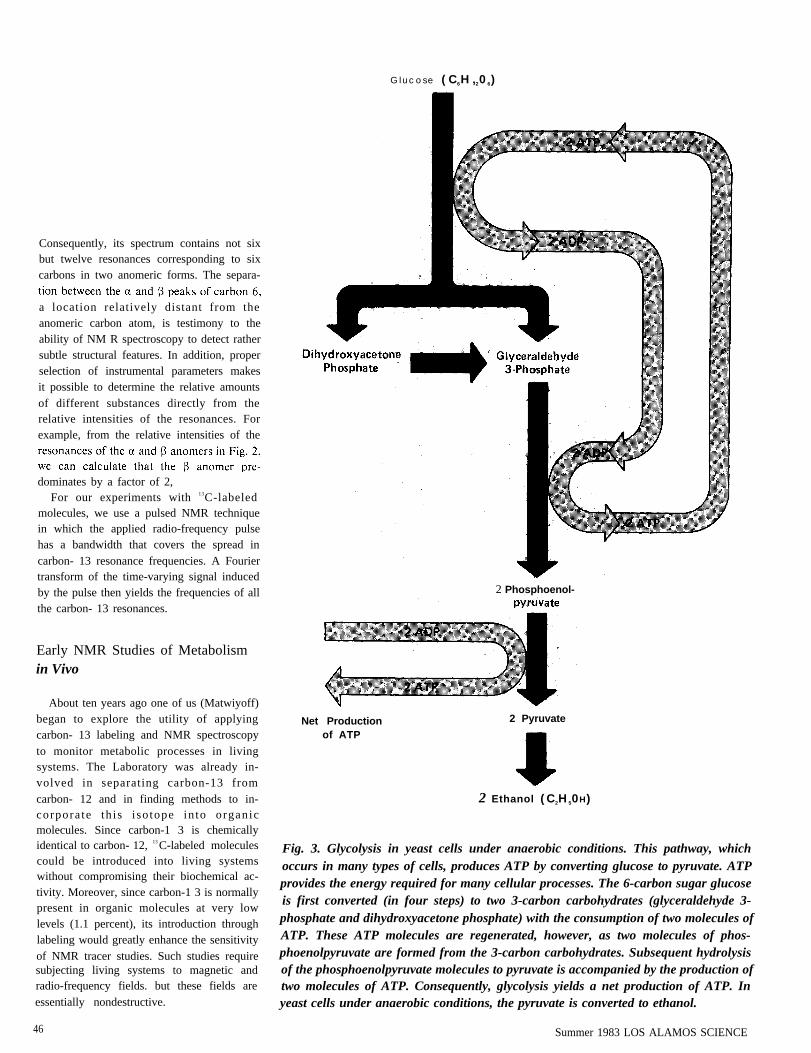
Fig. 3. Glycolysis in yeast cells under anaerobic conditions. This pathway, whichoccurs in many types of cells, produces ATP by converting glucose to pyruvate. ATPprovides the energy required for many cellular processes. The 6-carbon sugar glucoseis first converted (in four steps) to two 3-carbon carbohydrates (glyceraldehyde 3-phosphate and dihydroxyacetone phosphate) with the consumption of two molecules ofATP. These ATP molecules are regenerated, however, as two molecules of phos-phoenolpyruvate are formed from the 3-carbon carbohydrates. Subsequent hydrolysisof the phosphoenolpyruvate molecules to pyruvate is accompanied by the production oftwo molecules of ATP. Consequently, glycolysis yields a net production of ATP. Inyeast cells under anaerobic conditions, the pyruvate is converted to ethanol.
Summer 1983 LOS ALAMOS SCIENCE
Metabolism as it happens
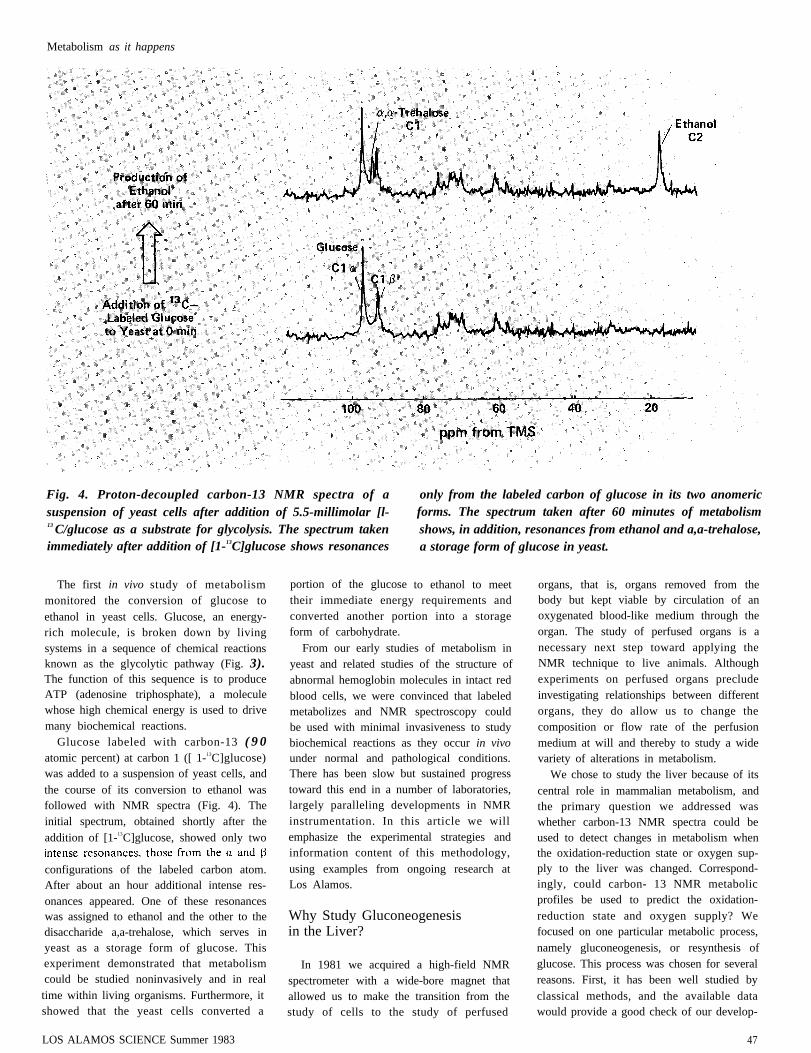
Fig. 4. Proton-decoupled carbon-13 NMR spectra of asuspension of yeast cells after addition of 5.5-millimolar [l-13 C/glucose as a substrate for glycolysis. The spectrum takenimmediately after addition of [1-13C]glucose shows resonances
The first in vivo study of metabolismmonitored the conversion of glucose toethanol in yeast cells. Glucose, an energy-rich molecule, is broken down by livingsystems in a sequence of chemical reactionsknown as the glycolytic pathway (Fig. 3).The function of this sequence is to produceATP (adenosine triphosphate), a moleculewhose high chemical energy is used to drivemany biochemical reactions.
Glucose labeled with carbon-13 ( 9 0atomic percent) at carbon 1 ([ 1-13C]glucose)was added to a suspension of yeast cells, andthe course of its conversion to ethanol wasfollowed with NMR spectra (Fig. 4). Theinitial spectrum, obtained shortly after theaddition of [1-13C]glucose, showed only two
configurations of the labeled carbon atom.After about an hour additional intense res-onances appeared. One of these resonanceswas assigned to ethanol and the other to thedisaccharide a,a-trehalose, which serves inyeast as a storage form of glucose. Thisexperiment demonstrated that metabolismcould be studied noninvasively and in realtime within living organisms. Furthermore, itshowed that the yeast cells converted a
LOS ALAMOS SCIENCE Summer 1983
portion of the glucose
only from the labeled carbon of glucose in its two anomericforms. The spectrum taken after 60 minutes of metabolismshows, in addition, resonances from ethanol and a,a-trehalose,a storage form of glucose in yeast.
to ethanol to meettheir immediate energy requirements andconverted another portion into a storageform of carbohydrate.
From our early studies of metabolism inyeast and related studies of the structure ofabnormal hemoglobin molecules in intact redblood cells, we were convinced that labeledmetabolizes and NMR spectroscopy couldbe used with minimal invasiveness to studybiochemical reactions as they occur in vivounder normal and pathological conditions.There has been slow but sustained progresstoward this end in a number of laboratories,largely paralleling developments in NMRinstrumentation. In this article we willemphasize the experimental strategies andinformation content of this methodology,using examples from ongoing research atLos Alamos.
Why Study Gluconeogenesisin the Liver?
In 1981 we acquired a high-field NMRspectrometer with a wide-bore magnet thatallowed us to make the transition from thestudy of cells to the study of perfused
organs, that is, organs removed from thebody but kept viable by circulation of anoxygenated blood-like medium through theorgan. The study of perfused organs is anecessary next step toward applying theNMR technique to live animals. Althoughexperiments on perfused organs precludeinvestigating relationships between differentorgans, they do allow us to change thecomposition or flow rate of the perfusionmedium at will and thereby to study a widevariety of alterations in metabolism.
We chose to study the liver because of itscentral role in mammalian metabolism, andthe primary question we addressed waswhether carbon-13 NMR spectra could beused to detect changes in metabolism whenthe oxidation-reduction state or oxygen sup-ply to the liver was changed. Correspond-ingly, could carbon- 13 NMR metabolicprofiles be used to predict the oxidation-reduction state and oxygen supply? Wefocused on one particular metabolic process,namely gluconeogenesis, or resynthesis ofglucose. This process was chosen for severalreasons. First, it has been well studied byclassical methods, and the available datawould provide a good check of our develop-
47
ing methodology. Second. the synthesizedglucose accumulates in the liver and couldtherefore be easily detected by carbon-13NMR. Finally, gluconeogenesis acts in com-petition with, parallel to, or synergisticallywith other metabolic pathways for the use ofglucose and products of glucose metabolism.The other pathways include synthesis ofglycogen, of fatty acids and other lipids, andof amino acids and glycoproteins. Thus adetailed understanding of gluconeogenesisunder normal and abnormal oxidation-re-duction states or oxygen supplies mightprovide insight into the regulation of manymetabolic processes.
The body normally stores only enoughglucose to provide fuel to the brain for twelvehours. and therefore the liver’s unique abilityto resynthesize glucose is extremely impor-tant for maintaining energy homeostasis.The glucose metabolized by the body sup-plies the precursors for gluconeogenesis. Forexample. muscle and brain cells oxidizeglucose to pyruvate and lactate. Frequently,the pyruvate combines with an amino group
which is delivered by the blood stream to theliver where it is converted to glucose throughgluconeogenesis.
This gluconeogenesis from alanine was thesubject of our study. Figure 5 depicts itsbasic features and its relationship to oxygensupply. The figure shows the two compo-nents of the liver cell that participate ingluconeogenesis: the cytosol, or soluble por-tion of the cell. and the mitochrondria,structures about the size of a bacteriumsurrounded by a double membrane. (Themitochondria use most of the oxygen sup-plied to the cell and are the sites of theprincipal energy-yielding reactions.)
The first step of gluconeogenesis takesplace in the cytosol. There alanine, a 3-carbon amino acid. loses its amino group.(How the liver disposes of this amino groupis an important question and will be con-sidered later. ) Alanine’s 3-carbon skeletonthen enters the mitochondria and undergoes
48
CYTOSOL
CELL PLASMA MEMBRANE
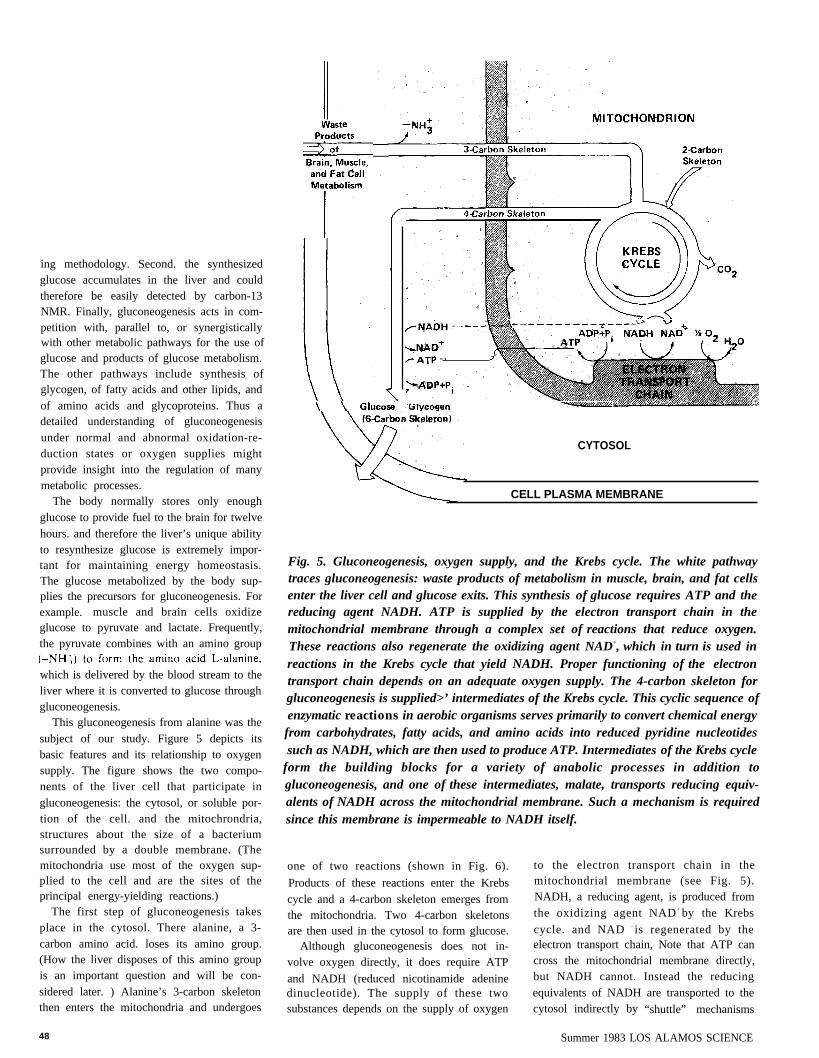
Fig. 5. Gluconeogenesis, oxygen supply, and the Krebs cycle. The white pathwaytraces gluconeogenesis: waste products of metabolism in muscle, brain, and fat cellsenter the liver cell and glucose exits. This synthesis of glucose requires ATP and thereducing agent NADH. ATP is supplied by the electron transport chain in themitochondrial membrane through a complex set of reactions that reduce oxygen.These reactions also regenerate the oxidizing agent NAD+, which in turn is used inreactions in the Krebs cycle that yield NADH. Proper functioning of the electrontransport chain depends on an adequate oxygen supply. The 4-carbon skeleton forgluconeogenesis is supplied>’ intermediates of the Krebs cycle. This cyclic sequence ofenzymatic reactions in aerobic organisms serves primarily to convert chemical energyfrom carbohydrates, fatty acids, and amino acids into reduced pyridine nucleotidessuch as NADH, which are then used to produce ATP. Intermediates of the Krebs cycle
form the building blocks for a variety of anabolic processes in addition togluconeogenesis, and one of these intermediates, malate, transports reducing equiv-alents of NADH across the mitochondrial membrane. Such a mechanism is requiredsince this membrane is impermeable to NADH itself.
one of two reactions (shown in Fig. 6).
Products of these reactions enter the Krebscycle and a 4-carbon skeleton emerges fromthe mitochondria. Two 4-carbon skeletonsare then used in the cytosol to form glucose.
Although gluconeogenesis does not in-volve oxygen directly, it does require ATP
and NADH (reduced nicotinamide adeninedinucleotide). The supply of these twosubstances depends on the supply of oxygen
to the electron transport chain in themitochondrial membrane (see Fig. 5).NADH, a reducing agent, is produced fromthe oxidizing agent NAD + by the Krebs
cycle. and NAD - is regenerated by theelectron transport chain, Note that ATP cancross the mitochondrial membrane directly,but NADH cannot. Instead the reducingequivalents of NADH are transported to thecytosol indirectly by “shuttle” mechanisms
Summer 1983 LOS ALAMOS SCIENCE
Metabolism as it happens
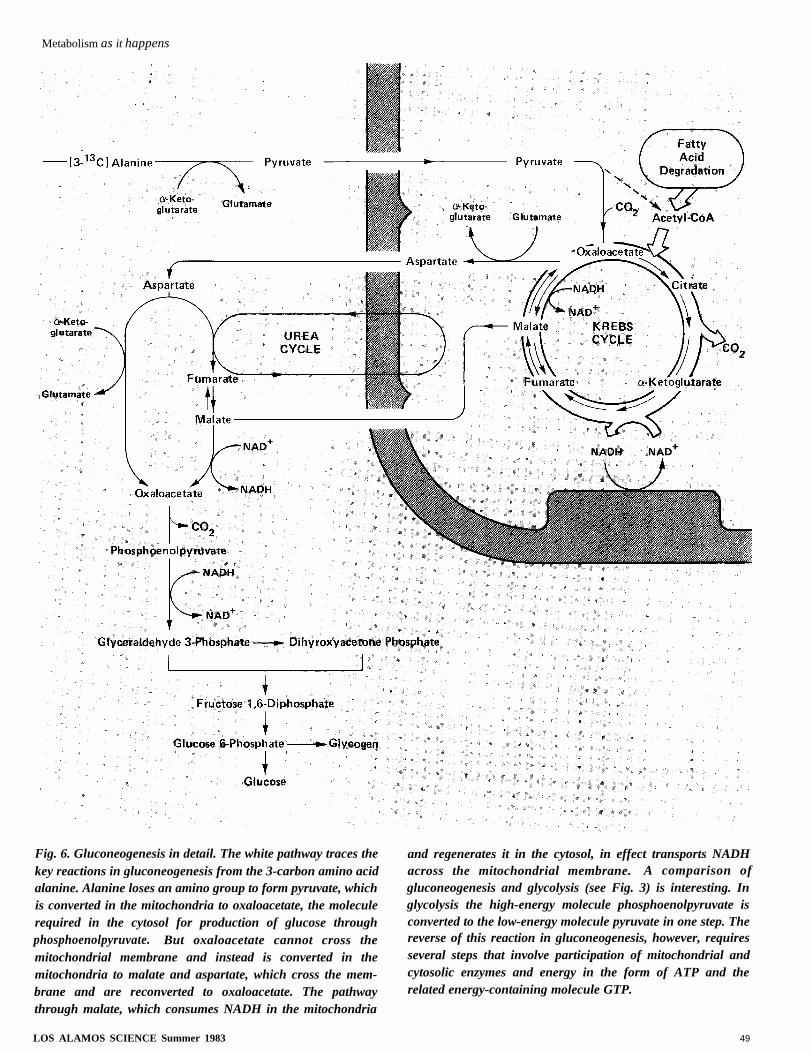
Fig. 6. Gluconeogenesis in detail. The white pathway traces thekey reactions in gluconeogenesis from the 3-carbon amino acidalanine. Alanine loses an amino group to form pyruvate, whichis converted in the mitochondria to oxaloacetate, the moleculerequired in the cytosol for production of glucose throughphosphoenolpyruvate. But oxaloacetate cannot cross themitochondrial membrane and instead is converted in themitochondria to malate and aspartate, which cross the mem-brane and are reconverted to oxaloacetate. The pathwaythrough malate, which consumes NADH in the mitochondria
and regenerates it in the cytosol, in effect transports NADHacross the mitochondrial membrane. A comparison ofgluconeogenesis and glycolysis (see Fig. 3) is interesting. Inglycolysis the high-energy molecule phosphoenolpyruvate isconverted to the low-energy molecule pyruvate in one step. Thereverse of this reaction in gluconeogenesis, however, requiresseveral steps that involve participation of mitochondrial andcytosolic enzymes and energy in the form of ATP and therelated energy-containing molecule GTP.
LOS ALAMOS SCIENCE Summer 1983 49
Radio-FrequeCoil
GasHumidifier
Superconductingn c yMagnet Reservoir
T
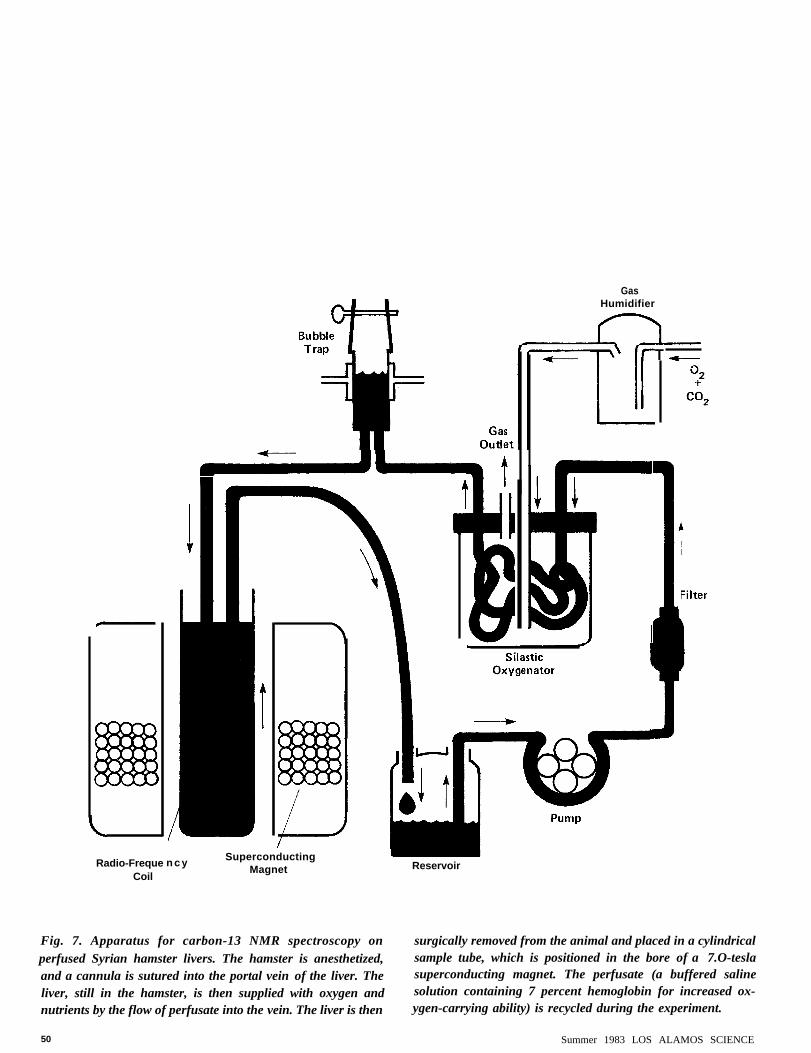
Fig. 7. Apparatus for carbon-13 NMR spectroscopy on surgically removed from the animal and placed in a cylindricalperfused Syrian hamster livers. The hamster is anesthetized, sample tube, which is positioned in the bore of a 7.O-teslaand a cannula is sutured into the portal vein of the liver. The superconducting magnet. The perfusate (a buffered saline
liver, still in the hamster, is then supplied with oxygen and solution containing 7 percent hemoglobin for increased ox-
nutrients by the flow of perfusate into the vein. The liver is then ygen-carrying ability) is recycled during the experiment.
50 Summer 1983 LOS ALAMOS SCIENCE
Metabolism as it happens
such as the malate shuttle shown in Fig. 6, amore detailed picture of gluconeogenesis.Figure 6 also shows that gluconeogenesisfrom alanine is coupled to the urea cycle(since the cell must dispose of amino groups)and as we shall see. to fatty acid degrada-tion. Variations in the functioning ofgluconeogenesis may thus provide a markerfor a wide variety of metabolic disorders.
What happens to gluconeogenesis whenthe oxygen supply is reduced? For drasticdecreases we know that the rate ofgluconeogenesis is suppressed. But withcarbon- 13 NMR as a diagnostic tool, we canalso detect subtle changes in metabolismcaused by subtle changes in oxygen supplyor in the oxidation-reduction state of the liveras defined by the NADH/NAD+ ratio.
There is much clinical interest in under-
LOS ALAMOS SCIENCE Summer 1983
s tand ing the regula tory ef fec ts ofN A D H / N A D + ratios because elevatedNADH/NAD + ratios seem to be associatedwith fatty and cirrhotic livers. Elevated ratioscan occur through the intake of alcohol or asa consequence of inadequate oxygen supply.If carbon-13 NMR studies of gluco-neogenesis could enable us to assess theoxidation-reduction state of the liver undernormal and stressful conditions, such asthose induced by a dose of alcohol, we wouldbe able to help identify those individuals atrisk even in “social” drinking.
The Baseline Studyof Gluconeogenesis
Before attempting to understand the regu-lation of gluconeogenesis by NADH/NAD+
ratios and to identify signs of disorder, weneeded to monitor and understand in detailhow gluconeogenesis proceeds under normalconditions. This in itself is a surprisinglyintricate story that illustrates well the powerof the carbon-13 NMR technique. We choseto study the liver from a small animal. theSyrian hamster, since it would easily fit intothe 3-inch-bore magnet of our NMR spec-trometer. Figure 7 is a diagram of theperfusion apparatus used to keep the liverviable and metabolically active after it hasbeen surgically removed. The hamster wasstarved for 24 hours before the experiment toactivate the enzymes involved in gluconeo-genesis.
We monitored gluconeogenesis in theperfused liver with NMR spectra takenbefore and after addition of L-[3-13C ]alanine
51
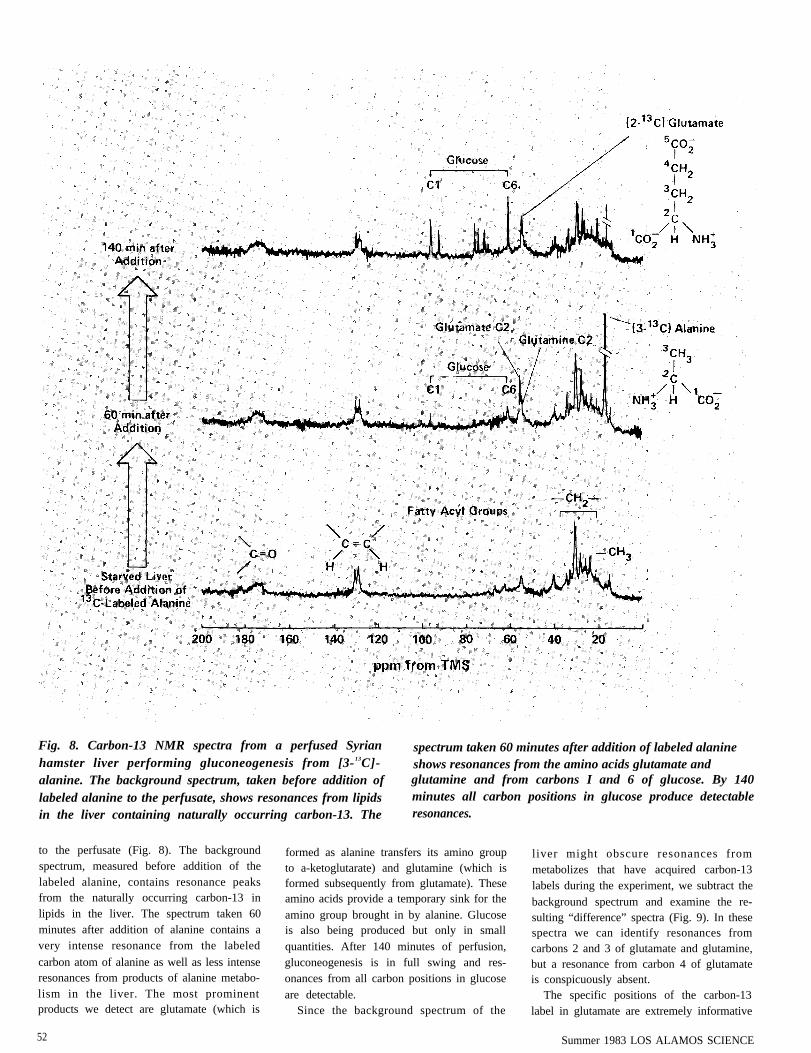
Fig. 8. Carbon-13 NMR spectra from a perfused Syrian spectrum taken 60 minutes after addition of labeled alaninehamster liver performing gluconeogenesis from [3-13C]- shows resonances from the amino acids glutamate andalanine. The background spectrum, taken before addition of glutamine and from carbons I and 6 of glucose. By 140labeled alanine to the perfusate, shows resonances from lipids minutes all carbon positions in glucose produce detectablein the liver containing naturally occurring carbon-13. The resonances.
to the perfusate (Fig. 8). The backgroundspectrum, measured before addition of thelabeled alanine, contains resonance peaksfrom the naturally occurring carbon-13 inlipids in the liver. The spectrum taken 60minutes after addition of alanine contains avery intense resonance from the labeled
carbon atom of alanine as well as less intenseresonances from products of alanine metabo-lism in the liver. The most prominentproducts we detect are glutamate (which is
52
formed as alanine transfers its amino groupto a-ketoglutarate) and glutamine (which isformed subsequently from glutamate). Theseamino acids provide a temporary sink for theamino group brought in by alanine. Glucoseis also being produced but only in smallquantities. After 140 minutes of perfusion,gluconeogenesis is in full swing and res-onances from all carbon positions in glucoseare detectable.
Since the background spectrum of the
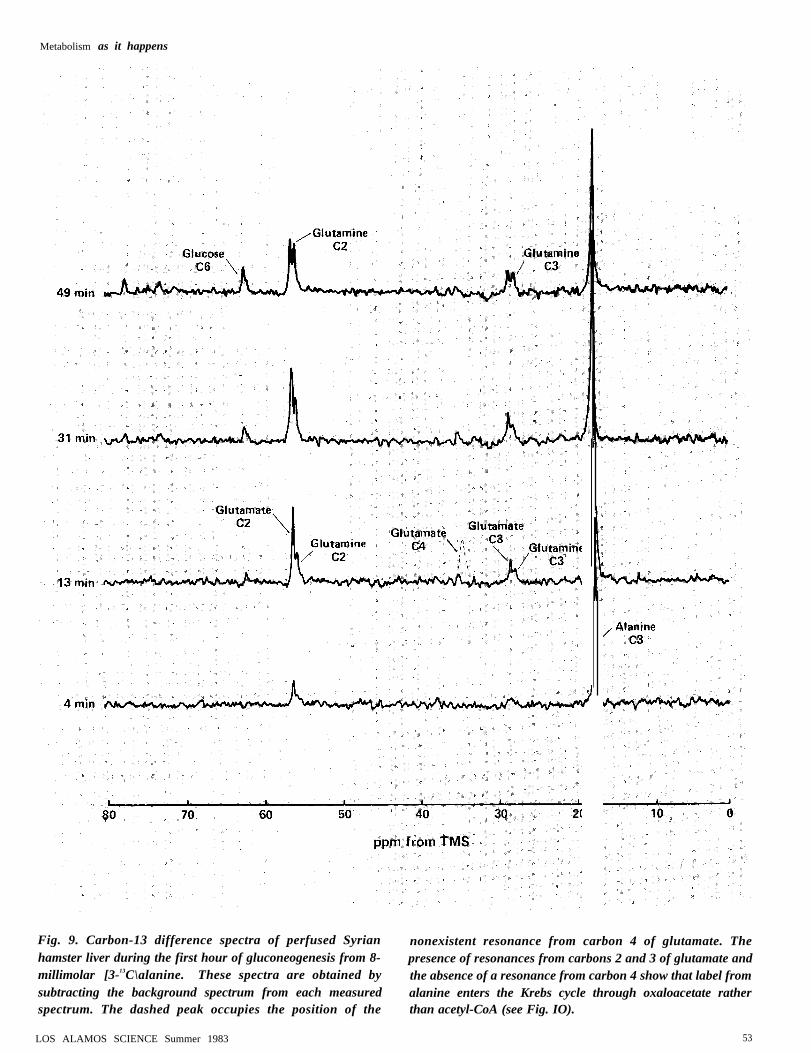
liver might obscure resonances frommetabolizes that have acquired carbon-13labels during the experiment, we subtract thebackground spectrum and examine the re-sulting “difference” spectra (Fig. 9). In thesespectra we can identify resonances fromcarbons 2 and 3 of glutamate and glutamine,but a resonance from carbon 4 of glutamateis conspicuously absent.
The specific positions of the carbon-13label in glutamate are extremely informative
Summer 1983 LOS ALAMOS SCIENCE
Metabolism as it happens
Fig. 9. Carbon-13 difference spectra of perfused Syrian nonexistent resonance from carbon 4 of glutamate. Thehamster liver during the first hour of gluconeogenesis from 8- presence of resonances from carbons 2 and 3 of glutamate andmillimolar [3-13C\alanine. These spectra are obtained by the absence of a resonance from carbon 4 show that label fromsubtracting the background spectrum from each measured alanine enters the Krebs cycle through oxaloacetate ratherspectrum. The dashed peak occupies the position of the than acetyl-CoA (see Fig. IO).
LOS ALAMOS SCIENCE Summer 1983 53
[ 3 -1 3C
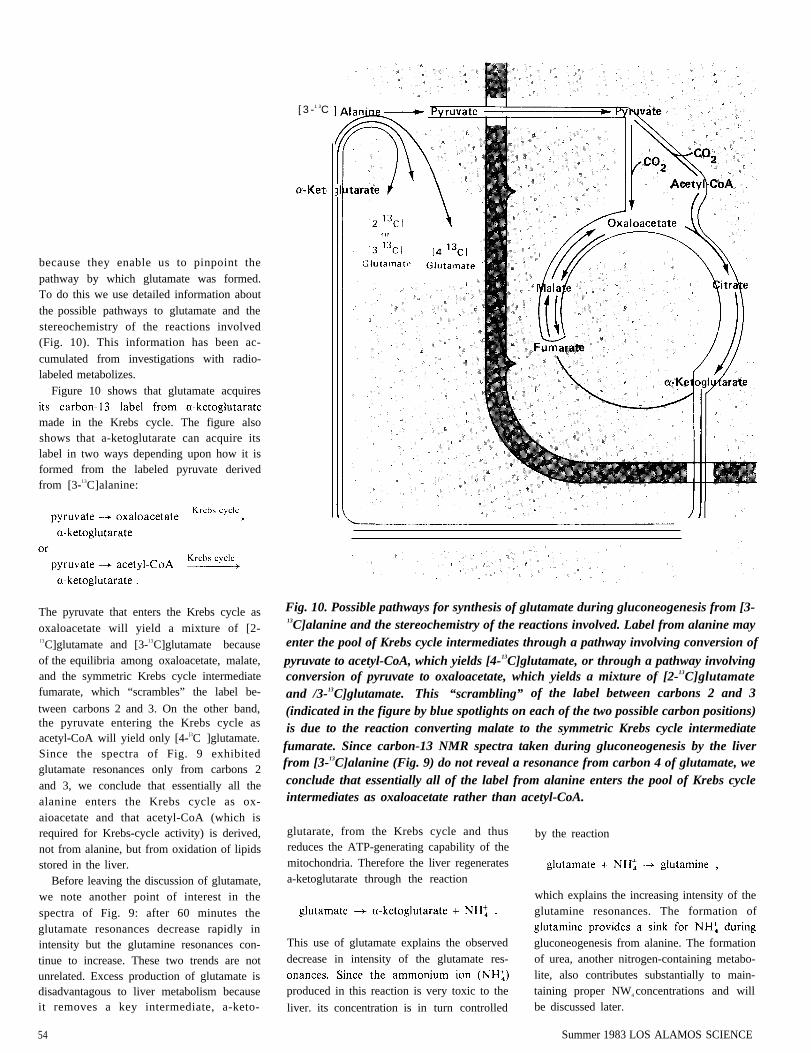
because they enable us to pinpoint thepathway by which glutamate was formed.To do this we use detailed information aboutthe possible pathways to glutamate and thestereochemistry of the reactions involved(Fig. 10). This information has been ac-
cumulated from investigations with radio-labeled metabolizes.
Figure 10 shows that glutamate acquires
made in the Krebs cycle. The figure alsoshows that a-ketoglutarate can acquire itslabel in two ways depending upon how it isformed from the labeled pyruvate derivedfrom [3-13C]alanine:
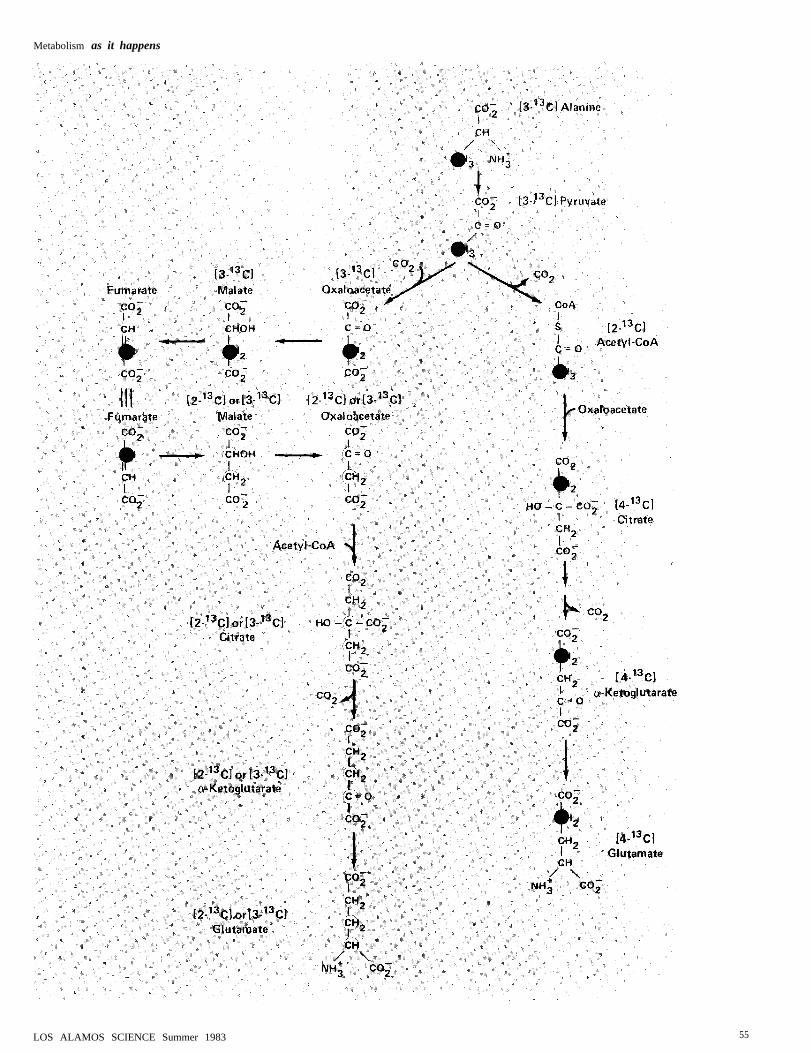
The pyruvate that enters the Krebs cycle asoxaloacetate will yield a mixture of [2-13C]glutamate and [3-13C]glutamate becauseof the equilibria among oxaloacetate, malate,and the symmetric Krebs cycle intermediatefumarate, which “scrambles” the label be-
tween carbons 2 and 3. On the other band,the pyruvate entering the Krebs cycle asacetyl-CoA will yield only [4-]3C ]glutamate.Since the spectra of Fig. 9 exhibitedglutamate resonances only from carbons 2and 3, we conclude that essentially all thealanine enters the Krebs cycle as ox-aioacetate and that acetyl-CoA (which isrequired for Krebs-cycle activity) is derived,not from alanine, but from oxidation of lipidsstored in the liver.
Before leaving the discussion of glutamate,we note another point of interest in thespectra of Fig. 9: after 60 minutes theglutamate resonances decrease rapidly inintensity but the glutamine resonances con-tinue to increase. These two trends are notunrelated. Excess production of glutamate isdisadvantagous to liver metabolism becauseit removes a key intermediate, a-keto-
Fig. 10. Possible pathways for synthesis of glutamate during gluconeogenesis from [3-13C]alanine and the stereochemistry of the reactions involved. Label from alanine mayenter the pool of Krebs cycle intermediates through a pathway involving conversion ofpyruvate to acetyl-CoA, which yields [4-13C]glutamate, or through a pathway involvingconversion of pyruvate to oxaloacetate, which yields a mixture of [2-13C]glutamateand /3-13C]glutamate. This “scrambling” of the label between carbons 2 and 3(indicated in the figure by blue spotlights on each of the two possible carbon positions)is due to the reaction converting malate to the symmetric Krebs cycle intermediatefumarate. Since carbon-13 NMR spectra taken during gluconeogenesis by the liverfrom [3-13C]alanine (Fig. 9) do not reveal a resonance from carbon 4 of glutamate, weconclude that essentially all of the label from alanine enters the pool of Krebs cycleintermediates as oxaloacetate rather than acetyl-CoA.
glutarate, from the Krebs cycle and thus by the reactionreduces the ATP-generating capability of themitochondria. Therefore the liver regeneratesa-ketoglutarate through the reaction
which explains the increasing intensity of theglutamine resonances. The formation of
This use of glutamate explains the observed gluconeogenesis from alanine. The formationdecrease in intensity of the glutamate res- of urea, another nitrogen-containing metabo-
lite, also contributes substantially to main-produced in this reaction is very toxic to the taining proper NW4 concentrations and will
liver. its concentration is in turn controlled be discussed later.
54 Summer 1983 LOS ALAMOS SCIENCE
Metabolism as it happens
LOS ALAMOS SCIENCE Summer 1983 55
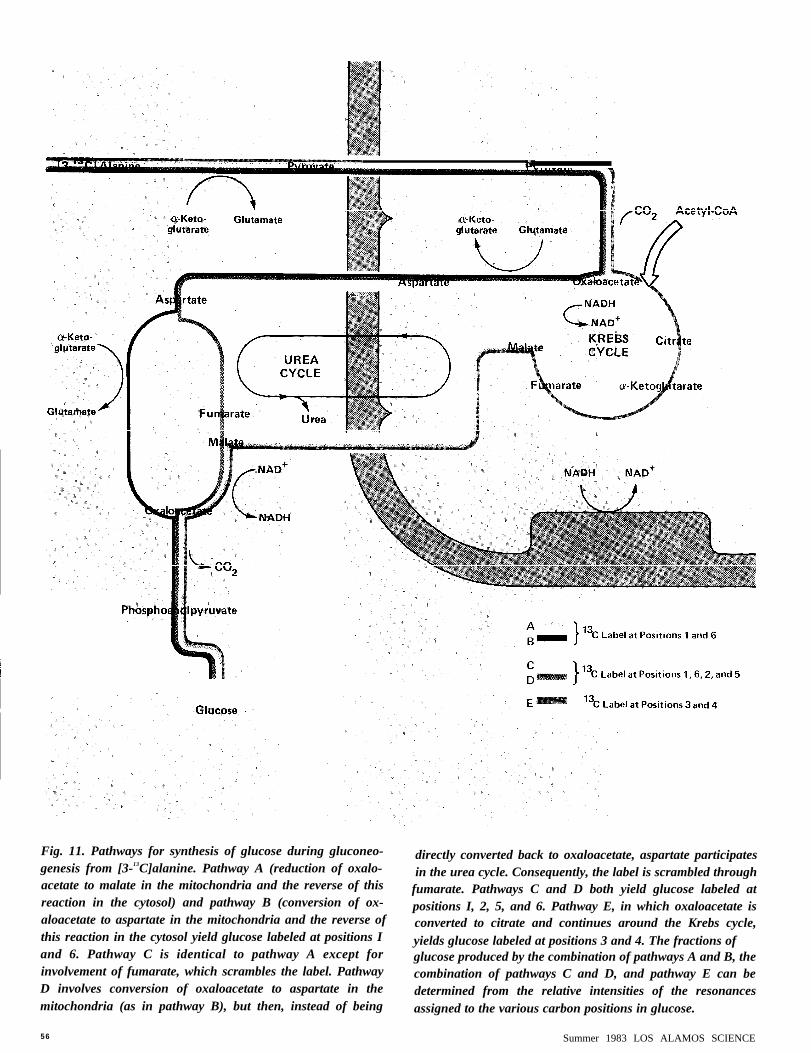
Fig. 11. Pathways for synthesis of glucose during gluconeo-genesis from [3-13C]alanine. Pathway A (reduction of oxalo-acetate to malate in the mitochondria and the reverse of thisreaction in the cytosol) and pathway B (conversion of ox-aloacetate to aspartate in the mitochondria and the reverse ofthis reaction in the cytosol yield glucose labeled at positions Iand 6. Pathway C is identical to pathway A except forinvolvement of fumarate, which scrambles the label. PathwayD involves conversion of oxaloacetate to aspartate in themitochondria (as in pathway B), but then, instead of being
directly converted back to oxaloacetate, aspartate participatesin the urea cycle. Consequently, the label is scrambled through
fumarate. Pathways C and D both yield glucose labeled atpositions I, 2, 5, and 6. Pathway E, in which oxaloacetate isconverted to citrate and continues around the Krebs cycle,yields glucose labeled at positions 3 and 4. The fractions ofglucose produced by the combination of pathways A and B, thecombination of pathways C and D, and pathway E can bedetermined from the relative intensities of the resonancesassigned to the various carbon positions in glucose.
56 Summer 1983 LOS ALAMOS SCIENCE
AlanineC3
ppm from TMS
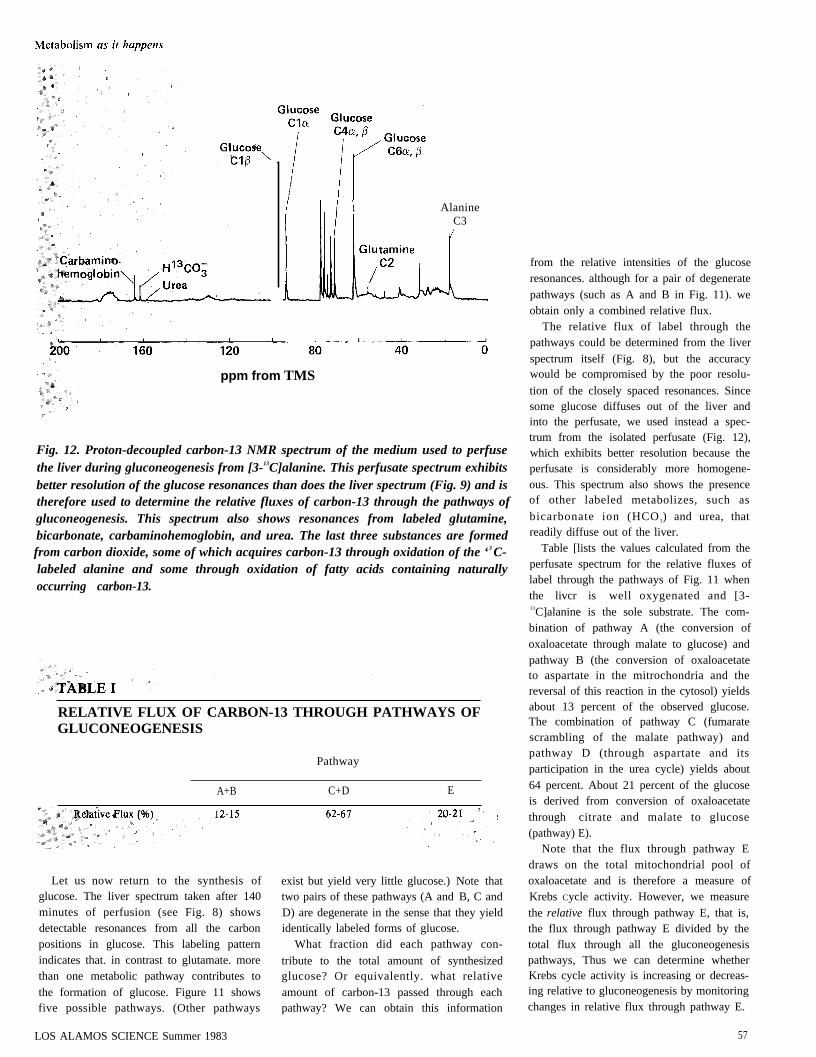
Fig. 12. Proton-decoupled carbon-13 NMR spectrum of the medium used to perfusethe liver during gluconeogenesis from [3-13C]alanine. This perfusate spectrum exhibitsbetter resolution of the glucose resonances than does the liver spectrum (Fig. 9) and istherefore used to determine the relative fluxes of carbon-13 through the pathways ofgluconeogenesis. This spectrum also shows resonances from labeled glutamine,bicarbonate, carbaminohemoglobin, and urea. The last three substances are formedfrom carbon dioxide, some of which acquires carbon-13 through oxidation of the ‘3 C-labeled alanine and some through oxidation of fatty acids containing naturallyoccurring carbon-13.
RELATIVE FLUX OF CARBON-13 THROUGH PATHWAYS OFGLUCONEOGENESIS
Pathway
A+B C+D E
Let us now return to the synthesis ofglucose. The liver spectrum taken after 140minutes of perfusion (see Fig. 8) showsdetectable resonances from all the carbonpositions in glucose. This labeling patternindicates that. in contrast to glutamate. morethan one metabolic pathway contributes tothe formation of glucose. Figure 11 showsfive possible pathways. (Other pathways
LOS ALAMOS SCIENCE Summer 1983
exist but yield very little glucose.) Note thattwo pairs of these pathways (A and B, C andD) are degenerate in the sense that they yieldidentically labeled forms of glucose.
What fraction did each pathway con-
tribute to the total amount of synthesizedglucose? Or equivalently. what relativeamount of carbon-13 passed through eachpathway? We can obtain this information
from the relative intensities of the glucoseresonances. although for a pair of degeneratepathways (such as A and B in Fig. 11). weobtain only a combined relative flux.
The relative flux of label through thepathways could be determined from the liverspectrum itself (Fig. 8), but the accuracywould be compromised by the poor resolu-
tion of the closely spaced resonances. Sincesome glucose diffuses out of the liver andinto the perfusate, we used instead a spec-trum from the isolated perfusate (Fig. 12),which exhibits better resolution because theperfusate is considerably more homogene-ous. This spectrum also shows the presenceof other labeled metabolizes, such as
bicarbonate ion (HCO 3) and urea, thatreadily diffuse out of the liver.
Table [lists the values calculated from theperfusate spectrum for the relative fluxes oflabel through the pathways of Fig. 11 whenthe livcr is well oxygenated and [3-13C]alanine is the sole substrate. The com-bination of pathway A (the conversion ofoxaloacetate through malate to glucose) andpathway B (the conversion of oxaloacetateto aspartate in the mitrochondria and thereversal of this reaction in the cytosol) yieldsabout 13 percent of the observed glucose.The combination of pathway C (fumaratescrambling of the malate pathway) andpathway D (through aspartate and itsparticipation in the urea cycle) yields about64 percent. About 21 percent of the glucoseis derived from conversion of oxaloacetatethrough citrate and malate to glucose(pathway) E).
Note that the flux through pathway Edraws on the total mitochondrial pool ofoxaloacetate and is therefore a measure ofKrebs Cycle activity. However, we measurethe relative flux through pathway E, that is,the flux through pathway E divided by thetotal flux through all the gluconeogenesispathways, Thus we can determine whetherKrebs cycle activity is increasing or decreas-ing relative to gluconeogenesis by monitoringchanges in relative flux through pathway E.
57
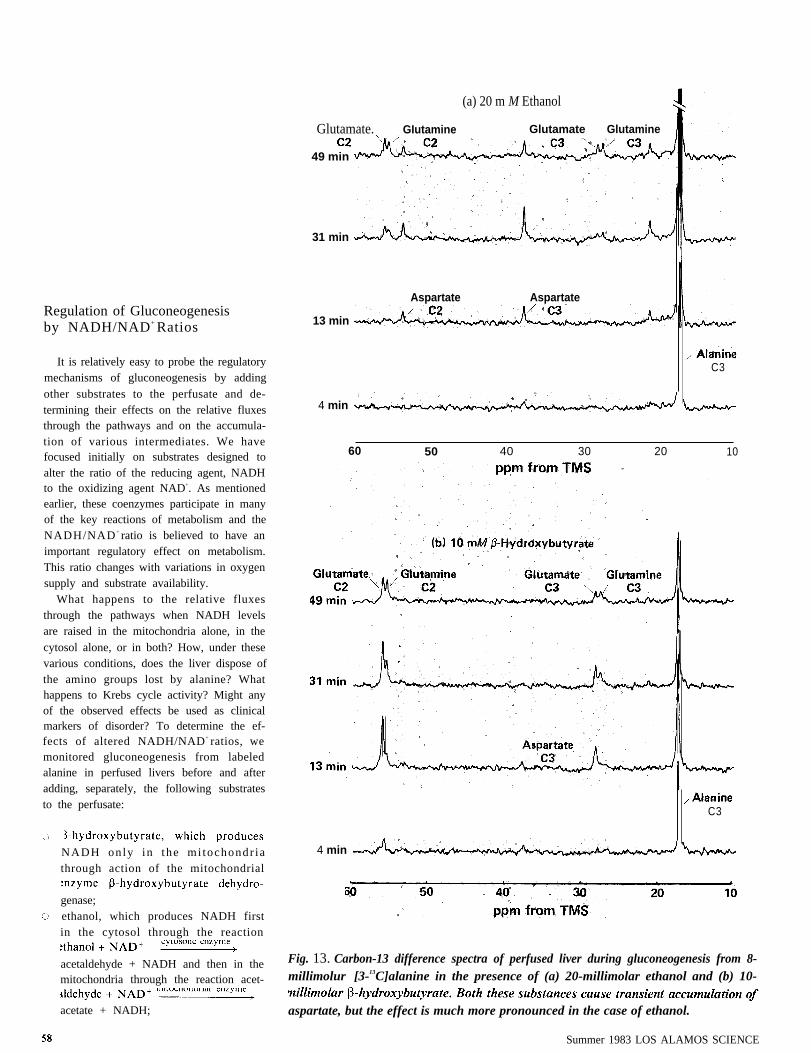
Regulation of Gluconeogenesisby NADH/NAD+ Ratios
It is relatively easy to probe the regulatorymechanisms of gluconeogenesis by addingother substrates to the perfusate and de-termining their effects on the relative fluxesthrough the pathways and on the accumula-tion of various intermediates. We havefocused initially on substrates designed toalter the ratio of the reducing agent, NADHto the oxidizing agent NAD+. As mentionedearlier, these coenzymes participate in manyof the key reactions of metabolism and theNADH/NAD + ratio is believed to have animportant regulatory effect on metabolism.This ratio changes with variations in oxygensupply and substrate availability.
What happens to the relative fluxesthrough the pathways when NADH levelsare raised in the mitochondria alone, in thecytosol alone, or in both? How, under thesevarious conditions, does the liver dispose ofthe amino groups lost by alanine? Whathappens to Krebs cycle activity? Might anyof the observed effects be used as clinicalmarkers of disorder? To determine the ef-fects of altered NADH/NAD+ ratios, wemonitored gluconeogenesis from labeledalanine in perfused livers before and afteradding, separately, the following substratesto the perfusate:
NADH only in the mi tochondr iathrough action of the mitochondrial
genase;ethanol, which produces NADH firstin the cytosol through the reaction
(a) 20 m M Ethanol
Glutamate. GIutamine Glutamate Glutamine
49 min
31 min
Aspartate Aspartate
13 min
C3
4 min
60 50 40 30 20 10
C3
4 min
acetaldehyde + NADH and then in the Fig. 13. Carbon-13 difference spectra of perfused liver during gluconeogenesis from 8-
mitochondria through the reaction acet- millimolur [3-13C]alanine in the presence of (a) 20-millimolar ethanol and (b) 10-
acetate + NADH; aspartate, but the effect is much more pronounced in the case of ethanol.
Summer 1983 LOS ALAMOS SCIENCE
Metabolism as it happens
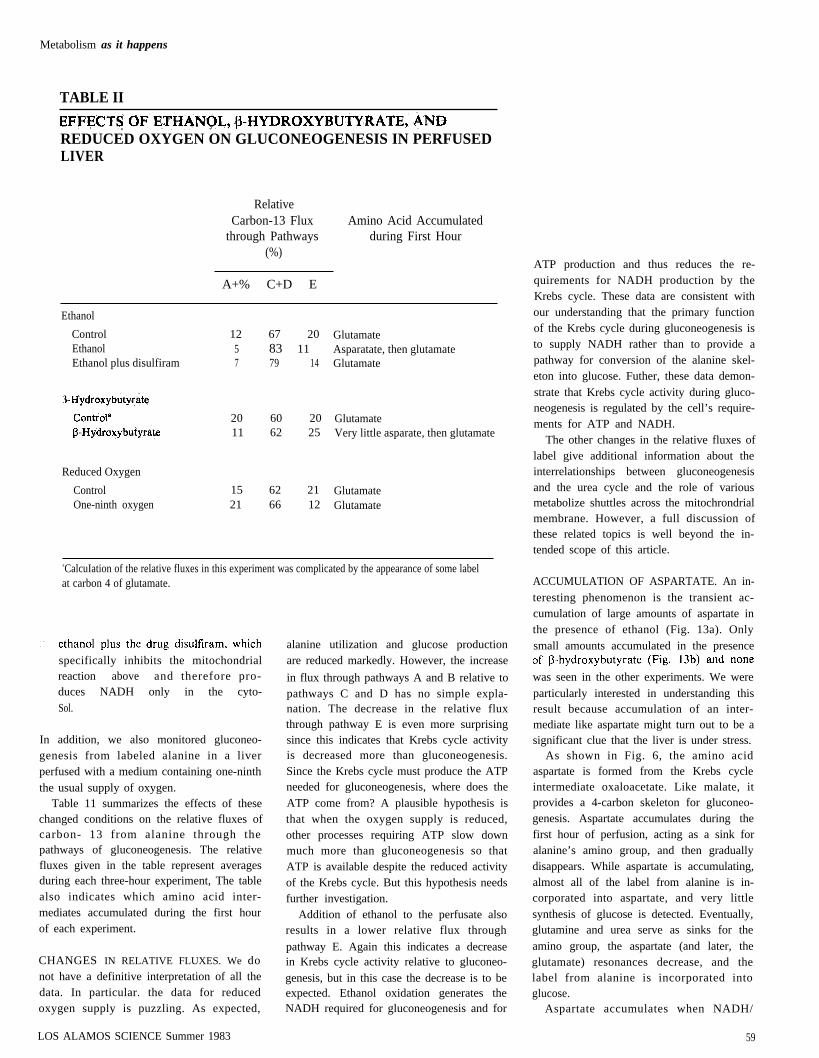
TABLE II
REDUCED OXYGEN ON GLUCONEOGENESIS IN PERFUSEDLIVER
RelativeCarbon-13 Flux Amino Acid Accumulated
through Pathways during First Hour(%)
A+% C+D E
Ethanol
Control 12 67 20Ethanol 5 83 11Ethanol plus disulfiram 7 79 14
20 60 2011 62 25
Reduced Oxygen
Control 15 62 21One-ninth oxygen 21 66 12
GlutamateAsparatate, then glutamateGlutamate
GlutamateVery little asparate, then glutamate
GlutamateGlutamate
aCalcuIation of the relative fluxes in this experiment was complicated by the appearance of some labelat carbon 4 of glutamate.
specifically inhibits the mitochondrialreaction above and therefore pro-duces NADH only in the cyto-Sol.
In addition, we also monitored gluconeo-genesis from labeled alanine in a liverperfused with a medium containing one-ninththe usual supply of oxygen.
Table 11 summarizes the effects of thesechanged conditions on the relative fluxes ofcarbon- 13 from alanine through thepathways of gluconeogenesis. The relativefluxes given in the table represent averagesduring each three-hour experiment, The tablealso indicates which amino acid inter-mediates accumulated during the first hourof each experiment.
CHANGES IN RELATIVE FLUXES. We donot have a definitive interpretation of all thedata. In particular. the data for reducedoxygen supply is puzzling. As expected,
LOS ALAMOS SCIENCE Summer 1983
alanine utilization and glucose productionare reduced markedly. However, the increase
in flux through pathways A and B relative topathways C and D has no simple expla-nation. The decrease in the relative fluxthrough pathway E is even more surprisingsince this indicates that Krebs cycle activityis decreased more than gluconeogenesis.Since the Krebs cycle must produce the ATPneeded for gluconeogenesis, where does theATP come from? A plausible hypothesis isthat when the oxygen supply is reduced,other processes requiring ATP slow downmuch more than gluconeogenesis so thatATP is available despite the reduced activityof the Krebs cycle. But this hypothesis needsfurther investigation.
Addition of ethanol to the perfusate alsoresults in a lower relative flux through
pathway E. Again this indicates a decreasein Krebs cycle activity relative to gluconeo-genesis, but in this case the decrease is to beexpected. Ethanol oxidation generates theNADH required for gluconeogenesis and for
ATP production and thus reduces the re-quirements for NADH production by theKrebs cycle. These data are consistent withour understanding that the primary functionof the Krebs cycle during gluconeogenesis isto supply NADH rather than to provide apathway for conversion of the alanine skel-eton into glucose. Futher, these data demon-strate that Krebs cycle activity during gluco-neogenesis is regulated by the cell’s require-ments for ATP and NADH.
The other changes in the relative fluxes oflabel give additional information about theinterrelationships between gluconeogenesisand the urea cycle and the role of variousmetabolize shuttles across the mitochrondrialmembrane. However, a full discussion ofthese related topics is well beyond the in-tended scope of this article.
ACCUMULATION OF ASPARTATE. An in-teresting phenomenon is the transient ac-cumulation of large amounts of aspartate inthe presence of ethanol (Fig. 13a). Onlysmall amounts accumulated in the presence
was seen in the other experiments. We wereparticularly interested in understanding thisresult because accumulation of an inter-mediate like aspartate might turn out to be asignificant clue that the liver is under stress.
As shown in Fig. 6, the amino acidaspartate is formed from the Krebs cycleintermediate oxaloacetate. Like malate, itprovides a 4-carbon skeleton for gluconeo-genesis. Aspartate accumulates during thefirst hour of perfusion, acting as a sink foralanine’s amino group, and then graduallydisappears. While aspartate is accumulating,almost all of the label from alanine is in-corporated into aspartate, and very littlesynthesis of glucose is detected. Eventually,glutamine and urea serve as sinks for theamino group, the aspartate (and later, theglutamate) resonances decrease, and thelabel from alanine is incorporated intoglucose.
Aspartate accumulates when NADH/
59
1
DECREASED ASPARTATECONSUMPTION
Oxaloacetate
I
INCREASED ASPARTATEPRODUCTION
IncreasedOxaloacetate Levels
Inhibited
Glutamate
NADH
a-Ketoglutarate
Phosphoenolpyruvate
Glucose
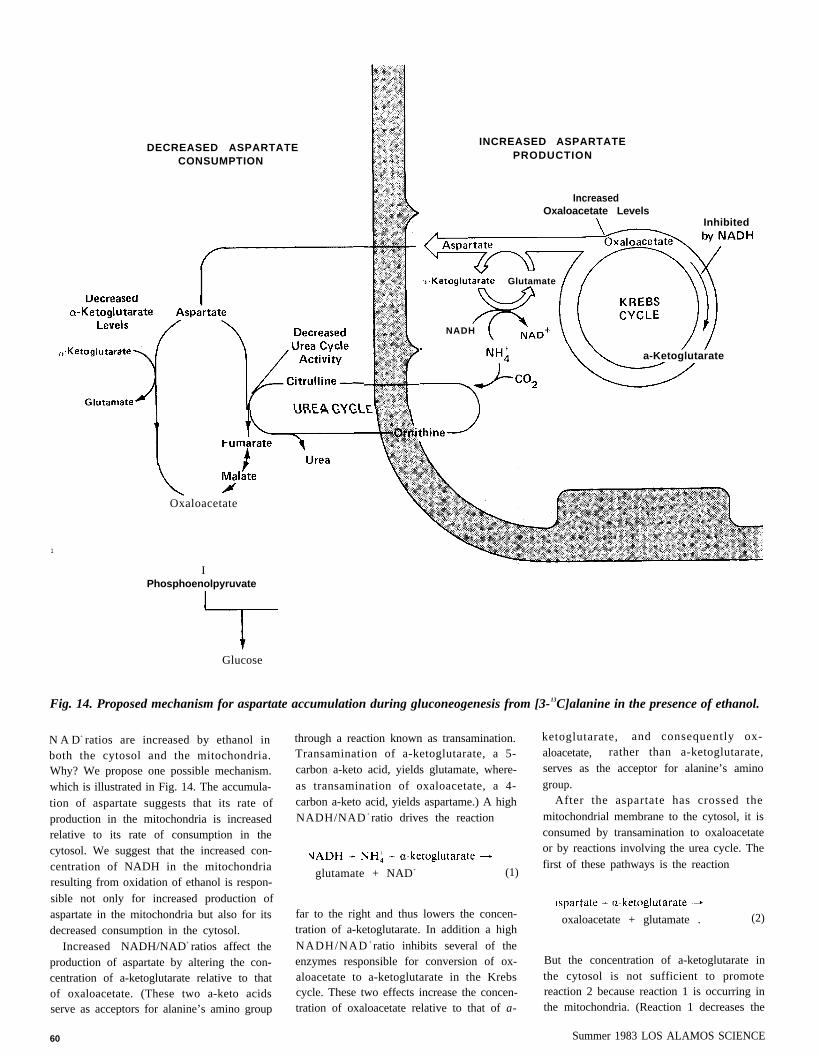
Fig. 14. Proposed mechanism for aspartate accumulation during gluconeogenesis from [3-13C]alanine in the presence of ethanol.
N A D+ ratios are increased by ethanol inboth the cytosol and the mitochondria.Why? We propose one possible mechanism.which is illustrated in Fig. 14. The accumula-tion of aspartate suggests that its rate ofproduction in the mitochondria is increasedrelative to its rate of consumption in thecytosol. We suggest that the increased con-centration of NADH in the mitochondriaresulting from oxidation of ethanol is respon-sible not only for increased production ofaspartate in the mitochondria but also for itsdecreased consumption in the cytosol.
Increased NADH/NAD+ ratios affect theproduction of aspartate by altering the con-centration of a-ketoglutarate relative to thatof oxaloacetate. (These two a-keto acidsserve as acceptors for alanine’s amino group
60
through a reaction known as transamination.Transamination of a-ketoglutarate, a 5-carbon a-keto acid, yields glutamate, where-as transamination of oxaloacetate, a 4-carbon a-keto acid, yields aspartame.) A highNADH/NAD + ratio drives the reaction
glutamate + NAD+ (1)
far to the right and thus lowers the concen-tration of a-ketoglutarate. In addition a highNADH/NAD + ratio inhibits several of theenzymes responsible for conversion of ox-aloacetate to a-ketoglutarate in the Krebscycle. These two effects increase the concen-tration of oxaloacetate relative to that of a-
ketoglutarate, and consequently ox-aloacetate, rather than a-ketoglutarate,serves as the acceptor for alanine’s aminogroup.
After the aspartate has crossed themitochondrial membrane to the cytosol, it isconsumed by transamination to oxaloacetateor by reactions involving the urea cycle. Thefirst of these pathways is the reaction
oxaloacetate + glutamate . (2)
But the concentration of a-ketoglutarate inthe cytosol is not sufficient to promotereaction 2 because reaction 1 is occurring inthe mitochondria. (Reaction 1 decreases the
Summer 1983 LOS ALAMOS SCIENCE
Metabolism as it happens
concentration ofmitochondria, and
a-ketoglutarate in thesince a-ketoglutarate can
cross the mitochondrial membrane, its con-centration in the cytosol is also decreased.)Thus increased NADH/NAD+ ratios in themitochondria inhibit the first pathway foraspartate consumption. We also suspect thatthe other pathway, which involves the ureacycle, may be inhibited by increasedNADH/NAD + ratios in the cytosol.
We emphasize that in arriving at thismechanism for aspartame accumulation in thepresence of ethanol we considered only afew of many interrelated processes and inparticular neglected charge balance acrossthe mitochondrial membrane. Charge bal-ance is maintained by countertransport of ananion when aspartate or malate is shuttledacross the membrane.
Is the proposed mechanism for aspartateaccumulation consistent with our results for
increases the NADH/NAD+ ratio only inthe mitochondria, caused only a small ac-cumulation of aspartate. We suggest thathigh NADH/NAD+ ratios in the mitochon-dria relative to the cytosol tend to activatethe transport of NADH from the mitochon-dria to the cytosol via the malate shuttle.This transport lowers the NADH/NAD+
ratio in the mitochondria, and little aspartateaccumulates. In this case the ammonium ionconcentration is controlled by glutamate andglutamine production as it is for gluconeo-genesis from alanine alone.
The data we have obtained are an insuffi-cient basis for firm conclusions about theregulation of metabolism. They do, however,suggest a number of interesting hypothesesand questions. For example, the transientincorporation of label from alanine into theamino acids glutamate, aspartate, and(somewhat later) glutamine rather than intoglucose indicates that the perfused liver,when first presented with alanine as asubstrate for gluconeogenesis, uses not theurea cycle but the Krebs cycle intermediatesa-ketoglutarate and (in the presence of
LOS ALAMOS SCIENCE Summer 1983
ethanol) oxaloacetate as acceptors for theamino group derived from alanine. The con-tinued depletion of Krebs cycle intermediatesis bothersome in light of continued energyproduction by the Krebs cycle. Oxaloacetatein particular occupies a central role in theKrebs cycle, and accumulation of aspartatein the presence of ethanol may markedlyalter already low (less than 0.2 millimolar)oxaloacetate concentrations.
Conventional bioanalytical techniqueshave revealed accumulation of glutamate,glutamine, and, in the presence of ethanol,aspartate in liver cells during gluconeo-genesis from alanine. These conventionalmeasurements were time-averaged, some-times over periods as long as 90 to 100minutes, and they suggested that the aminoacid accumulation is a steady-state phenom-enon. Our carbon- 13 NMR measurementson perfused hamster livers, and those ofother workers on rat liver cells and perfusedmouse livers, permit almost real-time ob-servation of changing metabolize concentra-tions and show that amino acid accumula-tion is transient. After an initial period theliver adapts to a new steady state in which itssupply of 4-carbon skeletons required in theKrebs cycle is brought under control andamino groups are disposed of in the ureacycle.
How does the liver accomplish this? Doesit depend on decreasing the NADH/NAD+
ratio to a critical level? Or on adjusting thelevels and activities of the appropriateenzymes to stimulate the urea cycle andmodulate gluconeogenesis and the Krebscycle? We don’t know. Will these adjust-ments be impaired in the case of liverdisease? Again, we don’t know but stronglysuspect that they will. To answer these andother questions about metabolism in theliver, baseline studies must be extended toother substrates for gluconeogenesis,especially pyruvate and lactate, in the pres-ence or absence of other substrates thataffect regulation, including ammonium ion,aspartate, glutamate, glutamine, fatty acids,
and ethanol.The role of oxygen uptake by the liver will
also have to be studied carefully under avariety of conditions. In the experiments wehave performed thus far, we drastically re-duced the supply of oxygen to the liver (one-ninth the normal amount) and, as expected,caused drastic reductions in the rates ofgluconeogenesis and glutamate andaspartate production. To completely unravelthe effect of oxygen, we must monitormetabolism as the oxygen supply is gradu-ally reduced.
Metabolism in the liver is especially com-plex because of the many interdependentmetabolic pathways. (Two important oneswe have partially neglected here are lipidsynthesis and degradation.) We have workunder way, in collaboration with David E.Hoekenga of the University of New MexicoSchool of Medicine and the AlbuquerqueVeterans Administration Medical Center, onanother vital but metabolically much simplerorgan—the heart. In this organ oxygen sup-ply to the tissue is of overriding importancebecause almost all (more than 90 percent) ofits energy requirements are met throughproduction of ATP by the electron transportchain, and the operation of this chain, inturn, is crucially dependent upon oxygensupply. Our work on the heart is currentlyfocused on substrates thought to be involvedin heart metabolism under anoxic conditions,such as glucose and amino acids. In addi-tion, we plan to study the role of carnitine inheart metabolism. This molecule is a centralcontrol point in heart metabolism since itmust link to fatty acids before they can enterthe mitochondria and be oxidized. Carnitinehas also been used to protect the heartagainst ischemic injury, but the mechanismthrough which this protection is conferred isuncertain. Clifford J. Unkefer of our grouphas recently devised a method for synthesiz-ing 13C]labeled carnitine, and we expect to
learn a great deal about its functions duringanoxia and ischemia from carbon-13 NMRstudies on perfused hearts.
61
Future Prospects
Baseline carbon-13 NMR studies of the
type described here are being carried out inseveral laboratories. Raymond L. Nunnallyof the University of Texas Health ScienceCenter in Dallas is studying metabolism inperfused hearts and in the hearts of liverabbits and dogs with the intent of usingNMR to define the extent and location ofmyocardial infarctions, to assess the tem-poral evolution of irreversible tissue damage,and to monitor the course of drug therapy.Similarly, Robert G. Shulman of Yale Uni-versity, Sheila M. Cohen of the MerckInstitute of Therapeutic Research, and JohnR. Williamson of the University of Penn-
sylvania are carrying out baseline meta-bolic studies on perfused livers and heartsand on livers, hearts, and brains of liveanimals. In another Los Alamos studyLaurel O. Sillerud is studying metabolism inadipose tissue as a prelude to studyinginsulin resistance in diabetes and fat-trappinglesions in chronic obesity. Concurrently, agreat deal of progress has been made inapplying phosphorus-3 1 NMR to studies ofATP production and utilization. (Since phos-phorus-31 is a naturally abundant isotope,these studies do not require labeling tech-niques.) Phosphorus-3 1 NMR is in factalready being used in clinical applications.
The ultimate objective of our research,
and that of others in the field, is the study,diagnosis, and treatment of disease. Realiz-ing this objective requires the pursuit of anumber of projects, including the following:
extend the baseline NMR studies onperfused organs and animals;
o develop efficient, large-scale processesfor synthesis of selectively labeled com-pounds;
o design and construct magnets and radio-frequency coils with improved sensitivityand volume resolution;
o assess more completely the biologicaleffects of magnetic fields;
62
° develop close cooperation among NMRspectroscopists, physiologists, bio-chemists, and physicians; and
° extend the studies to human controls andto patients with clinically well-defineddiseases.
As this article indicates, the first twoprojects are well under way. and we canexpect their acceleration soon as more in-vestigators enter the field. With regard to thethird, we point out that the most severelimitation of NMR spectroscopy in general,and carbon- 13 NMR spect roscopyespecially, is its relatively low sensitivity. Themagnet and radio-frequency technologyavailable at present limit real-time kineticstudies of metabolism in NMR to small,soluble metabolizes (like glucose and alanine)present at concentrations exceeding 0.5 milli-molar (500 micromolar). By way of com-parison, recently developed electrochemicalmethods based on microelectrodes insertedinto living cells can detect certain metabolizesat concentrations as low as about 0.1 micro-molar. The sensitivity of NMR experimentscan be increased to some degree by sacrific-ing time resolution, that is, by averaging thesignal over longer periods. However, formany metabolic studies the loss in timeresolution is unacceptable. Advances in thedesign of more sensitive radio-frequencycoils offer the most promise for increasingthe sensitivity of in vivo NMR measure-ments, perhaps by a ‘factor of ten. To thisend Eiichi Fukushima of Los Alamos andStephen B. W. Roeder of San Diego StateUniversity have designed and constructednovel radio-frequency coils. They have alsobegun to design magnets that provide thehigh, homogeneous magnetic fields requiredfor human studies but do not confine thesubject as do conventional magnets. Wewould welcome industry’s involvement inthis project, since the supply of NMR equip-ment—especially appropriate, reliable super-conducting magnets—will probably be themajor bottleneck in the development of a
national program for NMR in medicine.A key issue in the use of NMR in human
studies is whether static and oscillatingradio-frequency magnetic fields are safe.Many years of experience with particle ac-celerators and with NMR instruments haveproduced no firm evidence of any biologicalhazard from static magnetic fields. However,anecdotal evidence is not very satisfactory. Itcould, for example, unfairly implicate staticmagnetic fields as an amplifying factor in thehighly individualistic behavior of high-energyphysicists and NMR spectroscopists when,in fact, it might be a neutral or moderatingone! A review of the studies performed todate indicates that fields less than 2 tesla donot produce harmful cellular, biochemical. orgenetic effects in humans. Continued studyin this area is necessary because we will needstatic field strengths greater than 2 tesla toachieve higher sensitivity. At some fieldstrength we expect biological effects to beobservable, For example, a 20-tesla magneticfield should reduce the velocity at whichnerves conduct signals.
The hazards associated with radio-fre-quency magnetic fields are more complex,but the principal hazard is radio-frequencyheating of tissue. This should not be a majorconcern at the low frequencies we use,especially in light of the short duration of theradio-frequency pulses. Further, the newprobe designs of Fukushima and Roedermay reduce this hazard by minimizingdielectric and ohmic heating effects.
The last two projects are closely related.Until now the rate of development in thisfield has been controlled largely by NMRspectroscopists who either learned cell cul-ture and organ perfusion techniques them-selves or who developed associations withcell biologists and physiologists on an as-needed basis. As we move from cells andperfused organs to animals and humans, thequality and rate of development of NMRspectroscopy in medicine will be determinedby the strength of interdisciplinary teamsthat can not only obtain and interpret the
Summer 1983 LOS ALAMOS SCIENCE
Metabolism as it happens
NMR data but also provide clinical, bio- troscopists and biochemists from Los Ala-chemical, and physiological expertise. The mos are helping to develop, will be a uniqueNew Mexico state legislature recently national facility with respect to the breadthprovided funds for an NMR Center at the and depth of the interdisciplinary team thatUniversity of New Mexico School of will be applying NMR to animals and hu-Medicine. This center, which NMR spec- mans. ■
Further Reading
N. A. Matwiyoff, R. E. London, and J. Y. Hutson, “The Study of the Metabolism of 13C LabeledSubstrates by 13C NMR Spectroscopy of Intact Cells, Tissues, and Organs,” in NMR Spectroscopy: NewMethods and Applications, George C. Levy, editor (American Chemical Society, Washington, D. C.,1982), pp. 157-186.
R. G. Shulman, “NMR Spectroscopy of Living Cells,” Scientific American Vol. 248, No. 1,86-93 (1983).
R. E. Gordon, P. E. Hanley, and D. Shaw, “Topical Magnetic Resonance,” Progress in NMRSpectroscopy 15, 1-47 (1982).
Robert E. London, “Intramolecular Dynamics of Proteins and Peptides as Monitored by NuclearMagnetic Relaxation Measurements,“ in Magnetic Resonance in Biology, Jack S. Cohen, editor (JohnWiley & Sons, New York, 1980), pp. 1-69.
Eiichi Fukushima and Stephen B. W. Roeder, Experimental Pulse NMR: A Nuts and Bolts Approach(Addison-Wesley Publishing Company, Inc., Reading, Massachusetts, 1981).
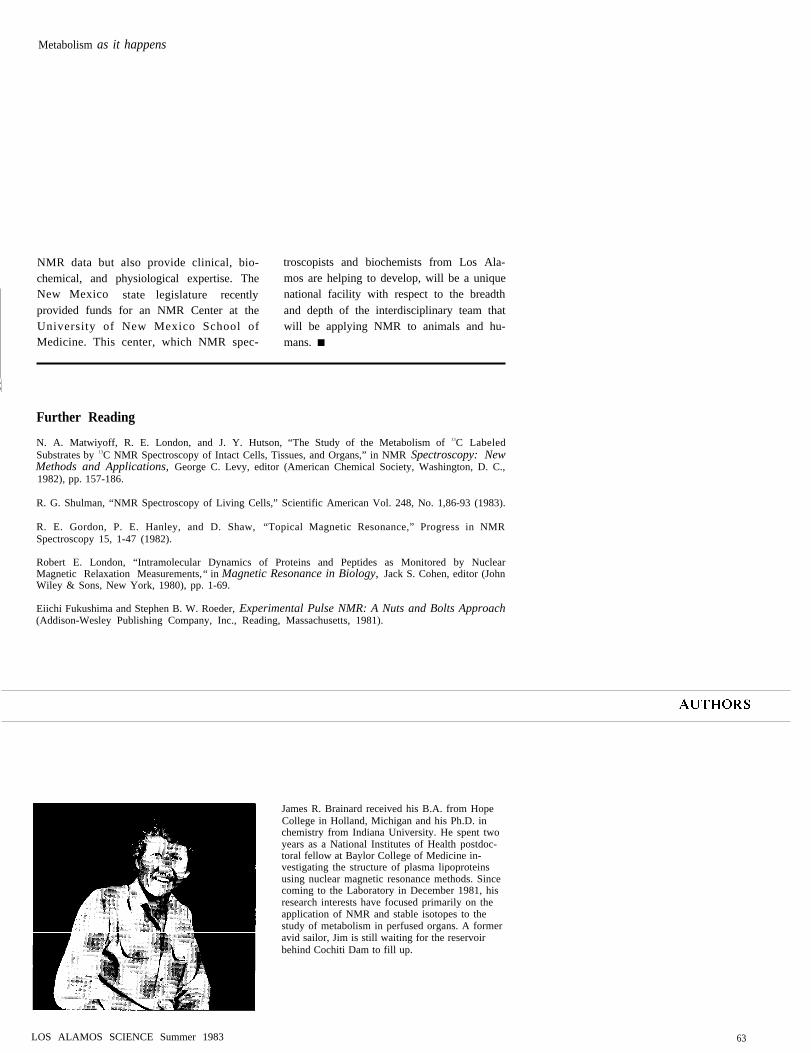
James R. Brainard received his B.A. from HopeCollege in Holland, Michigan and his Ph.D. inchemistry from Indiana University. He spent twoyears as a National Institutes of Health postdoc-toral fellow at Baylor College of Medicine in-vestigating the structure of plasma lipoproteinsusing nuclear magnetic resonance methods. Sincecoming to the Laboratory in December 1981, hisresearch interests have focused primarily on theapplication of NMR and stable isotopes to thestudy of metabolism in perfused organs. A formeravid sailor, Jim is still waiting for the reservoirbehind Cochiti Dam to fill up.
LOS ALAMOS SCIENCE Summer 1983 63
AUTHORS RELATED WORK
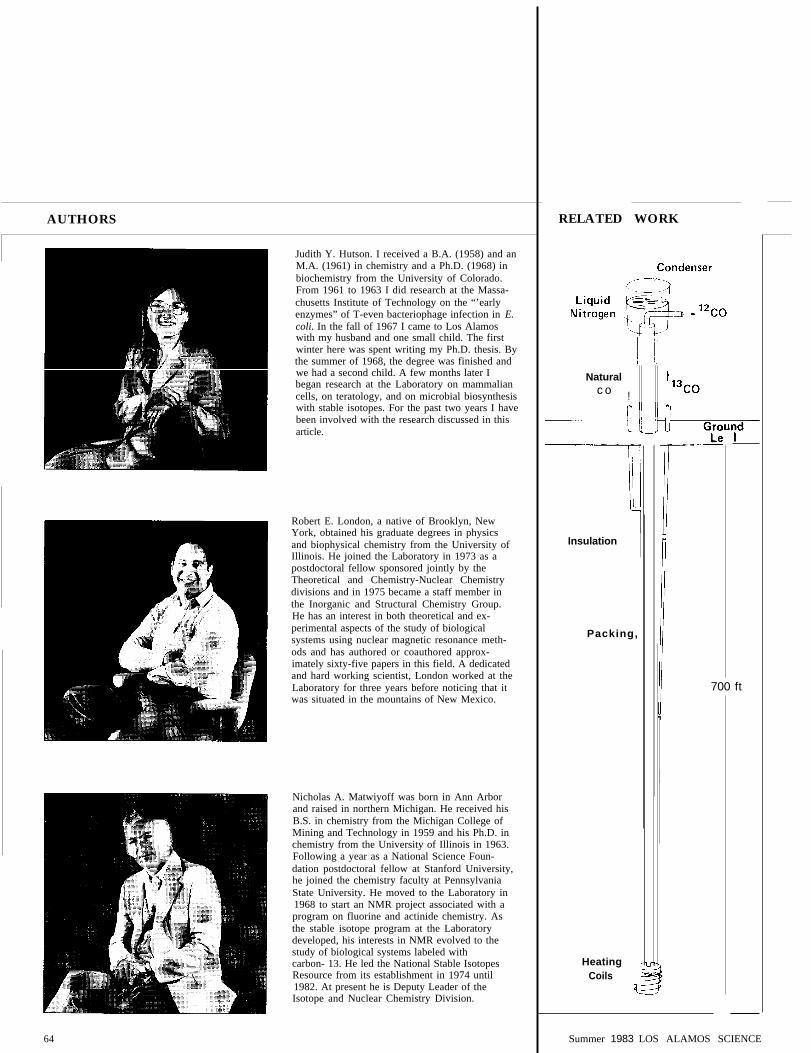
Judith Y. Hutson. I received a B.A. (1958) and anM.A. (1961) in chemistry and a Ph.D. (1968) inbiochemistry from the University of Colorado.From 1961 to 1963 I did research at the Massa-chusetts Institute of Technology on the “’earlyenzymes” of T-even bacteriophage infection in E.coli. In the fall of 1967 I came to Los Alamoswith my husband and one small child. The firstwinter here was spent writing my Ph.D. thesis. Bythe summer of 1968, the degree was finished andwe had a second child. A few months later Ibegan research at the Laboratory on mammaliancells, on teratology, and on microbial biosynthesiswith stable isotopes. For the past two years I havebeen involved with the research discussed in thisarticle.
Robert E. London, a native of Brooklyn, NewYork, obtained his graduate degrees in physicsand biophysical chemistry from the University ofIllinois. He joined the Laboratory in 1973 as apostdoctoral fellow sponsored jointly by theTheoretical and Chemistry-Nuclear Chemistrydivisions and in 1975 became a staff member inthe Inorganic and Structural Chemistry Group.He has an interest in both theoretical and ex-perimental aspects of the study of biologicalsystems using nuclear magnetic resonance meth-ods and has authored or coauthored approx-imately sixty-five papers in this field. A dedicatedand hard working scientist, London worked at theLaboratory for three years before noticing that itwas situated in the mountains of New Mexico.
Nicholas A. Matwiyoff was born in Ann Arborand raised in northern Michigan. He received hisB.S. in chemistry from the Michigan College ofMining and Technology in 1959 and his Ph.D. inchemistry from the University of Illinois in 1963.Following a year as a National Science Foun-dation postdoctoral fellow at Stanford University,he joined the chemistry faculty at PennsylvaniaState University. He moved to the Laboratory in1968 to start an NMR project associated with aprogram on fluorine and actinide chemistry. Asthe stable isotope program at the Laboratorydeveloped, his interests in NMR evolved to thestudy of biological systems labeled withcarbon- 13. He led the National Stable IsotopesResource from its establishment in 1974 until1982. At present he is Deputy Leader of theIsotope and Nuclear Chemistry Division.
Naturalco !
Insulation
Packing,
HeatingCoils
700 ft
I
64 Summer 1983 LOS ALAMOS SCIENCE
Metabolism as it happens
Stable Isotope Production
a distillation processby Nicholas A. Matwiyoff, Berthus B. McInteer, and Thomas R. Mills
A 70(-foot distillation column is farfrom ordinary, but the Laboratorywas forced to this length to separate
the rare but stable isotope carbon- 13 fromthe common isotope carbon- 12 by distilla-tion of carbon monoxide. In somewhatshorter distillation columns the Laboratoryalso enriches the even rarer stable isotopesnitrogen-15, oxygen-17, and oxygen-18.Produced in the western hemisphere only atLos Alamos, these enriched stable isotopesare used as tracers in many research areasranging from metabolism to agriculture toatmospheric circulation.
Distillation. one of the oldest and most
Schematic drawing of the Los Alamosdistillation column for separating thenaturally occurring mixture of 12C 0and 13C0. The 700-foot column is sup-ported over most of its length within ahole in the ground. The packing(spherical or saddle-shaped pieces ofceramic or metal provides surface area
for contact between liquid and vaporphases. The column is cooled initially toliquid nitrogen temperature as naturalcarbon monoxide enters, rises to thecondenser, and liquefies. The liquid
flows downward and cools the column asit vaporizes. When liquid carbon mon-oxide collects at the bottom, it is vapor-ized by carefully regulated heat. At equi-librium a downflow of liquid repeatedlycontacts upstreaming vapor, and themore volatile component accumulates atthe condenser.
LOS ALAMOS SCIENCE Summer 1983
effective methods for separating mixtures,exploits differences in the boiling points ofthe components. Two familiar examples ofits beneficial applications are the separationof hydrocarbons from crude oil and theproduction of a beverage with a high alcoholcontent and a distinctive flavor from sourmash.
Distillation is most often applied to mix-tures whose components have boiling pointsthat are above 50 degrees Celsius and thatdiffer from one another by more than 10degrees. Separation of such mixtures canthen be carried out in relatively short (10- to30-foot) columns. In contrast, the boilingpoints of the various isotopic forms ofcarbon monoxide or nitric oxide are very low[only slightly higher than the boiling point(-196 degrees Celsius) of liquid nitrogen]and, more important, differ by only tenths ofa degree. Small as these differences may be,they are larger than those exhibited by mostother compounds of carbon, oxygen, andnitrogen.
The boiling points of 12C0 and 13C 0differ by less than 0.1 degree Celsius (moreprecisely, their vapor pressures differ by lessthan 0.8 percent). To separate the two, theLaboratory built a 700-foot distillation col-umn—probably the longest in existence.This engineering marvel. developed by B. B.McInteer, T. R. Mills, and J. G. Montoya,produces 20 kilograms per year of 99+atomic percent carbon-13. The problem ofsupporting such a long column was solvedeconomically by lowering it into a cased, 15-inch-diameter hole in the ground, but thismethod of support prevents access for repair.Design and construction of the system there-
fore required the greatest care. The lengthchanges (about 2 feet) that occurred whenthe system was initially cooled to the temper-ature of liquid nitrogen for operation (or thatwill occur should shutdown be necessary)demanded particular accommodation. Thewelds joining the thirty-five 20-foot sectionswere thoroughly tested for soundness, andthe gas feed lines were fitted with expansionjoints, Proof that the system met the higheststandards of design and construction is itscontinuous operation without incident since1978.
Since the vapor pressures of the variousisotopic forms of nitric oxide differ morefrom each other (2.7 percent in the case of14 N 16 0 versus 15 N 16 O) than do those of
carbon monoxide, the two distillation col-umns at Los Alamos for separating them are“only” 150 and 270 feet long. These systemsare complicated, however, by the large num-ber of product streams (14N 16O, 14N 170 ,14N 180, 15N 160, 15N 17O, and 1SN 18C)) and by
the necessity, since liquid nitric oxide is ahigh explosive, for barricades and remotecontrols. Nonetheless the two columns havebeen operated routinely since 1975 with anannual production capacity of 18 to 20kilograms of nitrogen-15 at enrichments of
up to 98 percent and 1 kilogram of oxy-gen- 17 and 13 kilograms of oxygen-18 atenrichment of better than 40 and 95 atomicpercent, respectively.
Under the guidance of McInteer and Mills,research has been directed recently to devel-opment of distillation methods for separatingstable isotopes of heavier elements that areused as targets in the production of short-lived radioisotopes for nuclear medicine. ■
65
Synthesizing Labeled Compoundsby Robert E. London, Nicholas A. Matwiyoff, Clifford J. Unkefer, and Thomas E. Walker
RELATED WORK
A mong the applications for the Labo-ratory’s harvest of carbon monoxideenriched in carbon-13 are metabolic
studies based on NMR spectroscopy. Butfirst the isotope and its nuclear magneticmoment label must be incorporated atchosen sites in biochemical substances suchas sugars and amino acids. The Laboratoryhas pioneered in developing chemical andbiochemical methods for accomplishing thisoften intricate task.
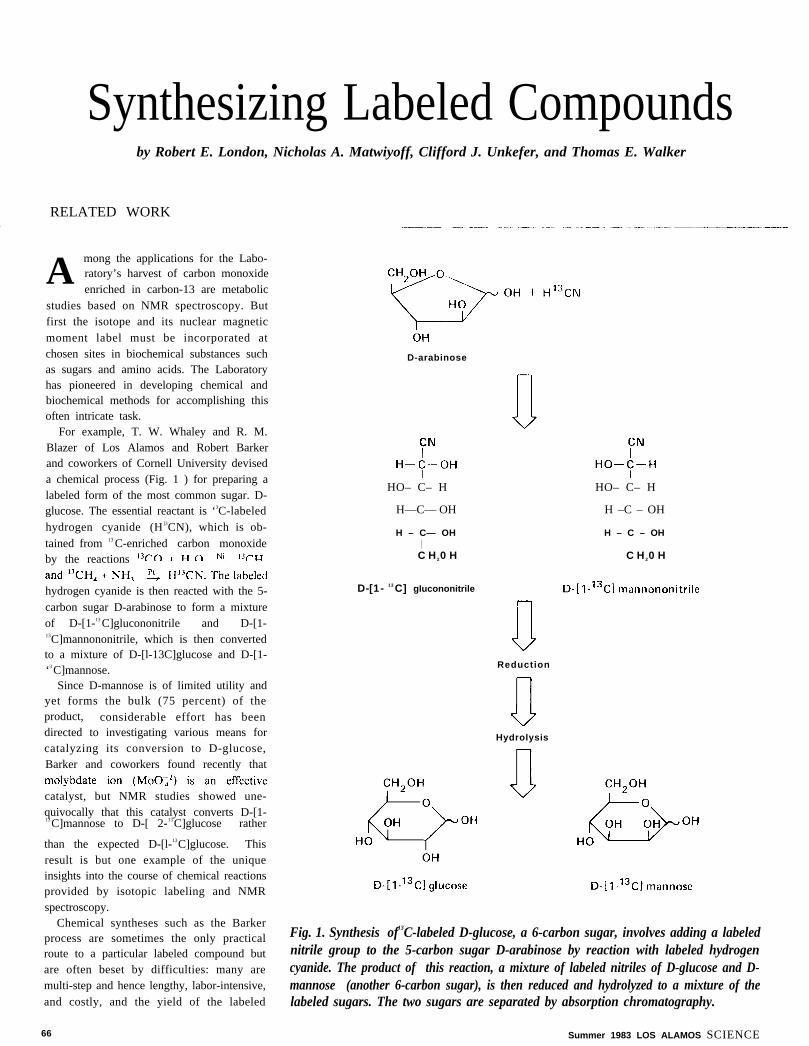
For example, T. W. Whaley and R. M.Blazer of Los Alamos and Robert Barkerand coworkers of Cornell University deviseda chemical process (Fig. 1 ) for preparing alabeled form of the most common sugar. D-glucose. The essential reactant is ‘3C-labeledhydrogen cyanide (H]3CN), which is ob-tained from 13 C-enriched carbon monoxideby the reactions
hydrogen cyanide is then reacted with the 5-carbon sugar D-arabinose to form a mixtureof D-[1-13 C]glucononitrile and D-[1-13C]mannononitrile, which is then convertedto a mixture of D-[l-13C]glucose and D-[1-‘3 C]mannose.
Since D-mannose is of limited utility andyet forms the bulk (75 percent) of theproduct, considerable effort has beendirected to investigating various means forcatalyzing its conversion to D-glucose,Barker and coworkers found recently that
catalyst, but NMR studies showed une-quivocally that this catalyst converts D-[1-13C]mannose to D-[ 2-13C]glucose rather
than the expected D-[l-13C]glucose. Thisresult is but one example of the uniqueinsights into the course of chemical reactionsprovided by isotopic labeling and NMRspectroscopy.
Chemical syntheses such as the Barkerprocess are sometimes the only practicalroute to a particular labeled compound butare often beset by difficulties: many aremulti-step and hence lengthy, labor-intensive,and costly, and the yield of the labeled
66
D-arabinose
HO– C– H HO– C– H
H—C— OH H –C – OH
H – C— OH H – C – OHIC H20 H C H20 H
D-[1- 13C] glucononitrile
Reduction
Hydrolysis
Fig. 1. Synthesis of13C-labeled D-glucose, a 6-carbon sugar, involves adding a labelednitrile group to the 5-carbon sugar D-arabinose by reaction with labeled hydrogencyanide. The product of this reaction, a mixture of labeled nitriles of D-glucose and D-mannose (another 6-carbon sugar), is then reduced and hydrolyzed to a mixture of thelabeled sugars. The two sugars are separated by absorption chromatography.
Summer 1983 LOS ALAMOS SCIENCE
Metabolism as it happens
CHEMICAL STEPS
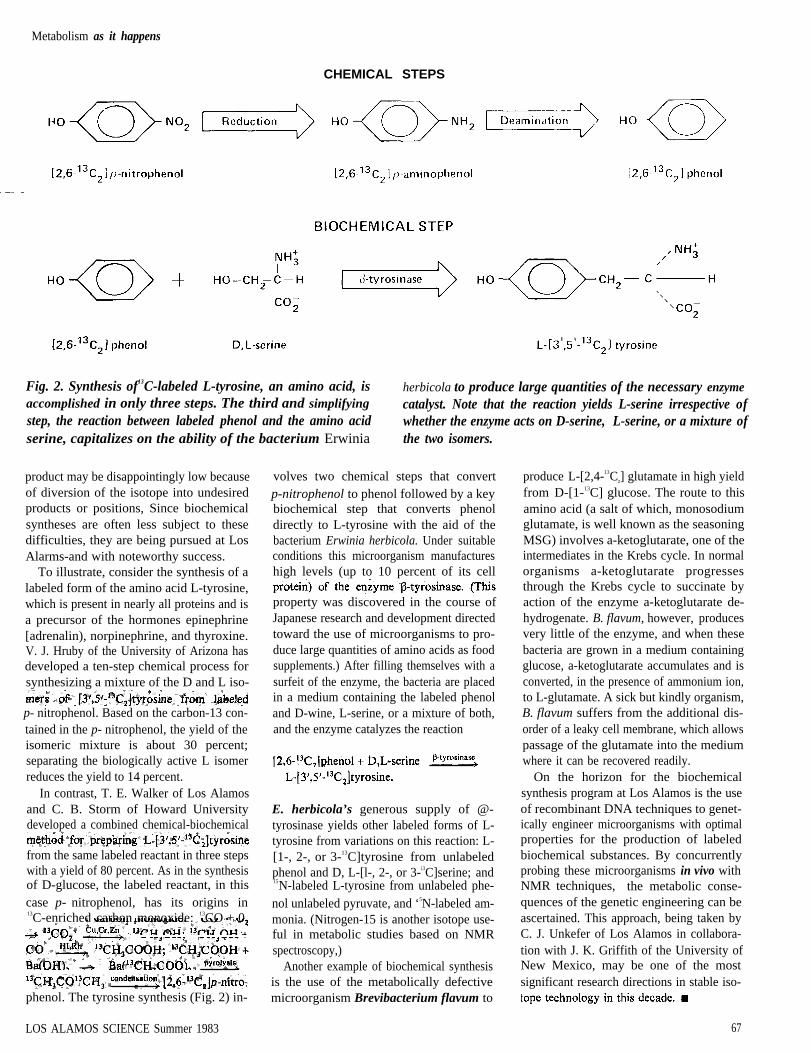
Fig. 2. Synthesis of13C-labeled L-tyrosine, an amino acid, is herbicola to produce large quantities of the necessary enzymeaccomplished in only three steps. The third and simplifying catalyst. Note that the reaction yields L-serine irrespective ofstep, the reaction between labeled phenol and the amino acid whether the enzyme acts on D-serine, L-serine, or a mixture ofserine, capitalizes on the ability of the bacterium Erwinia the two isomers.
product may be disappointingly low because volves two chemical steps that convertof diversion of the isotope into undesired p-nitrophenol to phenol followed by a keyproducts or positions, Since biochemical biochemical step that converts phenolsyntheses are often less subject to these directly to L-tyrosine with the aid of thedifficulties, they are being pursued at Los bacterium Erwinia herbicola. Under suitableAlarms-and with noteworthy success. conditions this microorganism manufactures
To illustrate, consider the synthesis of a high levels (up to 10 percent of its celllabeled form of the amino acid L-tyrosine,which is present in nearly all proteins and is property was discovered in the course ofa precursor of the hormones epinephrine Japanese research and development directed[adrenalin), norpinephrine, and thyroxine. toward the use of microorganisms to pro-V. J. Hruby of the University of Arizona has duce large quantities of amino acids as fooddeveloped a ten-step chemical process for supplements.) After filling themselves with asynthesizing a mixture of the D and L iso- surfeit of the enzyme, the bacteria are placed
in a medium containing the labeled phenolp- nitrophenol. Based on the carbon-13 con- and D-wine, L-serine, or a mixture of both,tained in the p- nitrophenol, the yield of the and the enzyme catalyzes the reactionisomeric mixture is about 30 percent;separating the biologically active L isomerreduces the yield to 14 percent.
In contrast, T. E. Walker of Los Alamosand C. B. Storm of Howard University E. herbicola’s generous supply of @-developed a combined chemical-biochemical tyrosinase yields other labeled forms of L-
tyrosine from variations on this reaction: L-from the same labeled reactant in three steps [1-, 2-, or 3-13C]tyrosine from unlabeledwith a yield of 80 percent. As in the synthesis phenol and D, L-[l-, 2-, or 3-i3C]serine; andof D-glucose, the labeled reactant, in this 15N-labeled L-tyrosine from unlabeled phe-case p- nitrophenol, has its origins in nol unlabeled pyruvate, and ‘5N-labeled am-13C-enriched carbon monoxide: 13CO + 02 monia. (Nitrogen-15 is another isotope use-
ful in metabolic studies based on NMRspectroscopy,)
Another example of biochemical synthesisis the use of the metabolically defective
phenol. The tyrosine synthesis (Fig. 2) in- microorganism Brevibacterium flavum to
LOS ALAMOS SCIENCE Summer 1983
produce L-[2,4-13Cz] glutamate in high yieldfrom D-[1-13C] glucose. The route to thisamino acid (a salt of which, monosodiumglutamate, is well known as the seasoningMSG) involves a-ketoglutarate, one of theintermediates in the Krebs cycle. In normalorganisms a-ketoglutarate progressesthrough the Krebs cycle to succinate byaction of the enzyme a-ketoglutarate de-hydrogenate. B. flavum, however, producesvery little of the enzyme, and when thesebacteria are grown in a medium containingglucose, a-ketoglutarate accumulates and isconverted, in the presence of ammonium ion,to L-glutamate. A sick but kindly organism,B. flavum suffers from the additional dis-order of a leaky cell membrane, which allowspassage of the glutamate into the mediumwhere it can be recovered readily.
On the horizon for the biochemicalsynthesis program at Los Alamos is the useof recombinant DNA techniques to genet-ically engineer microorganisms with optimalproperties for the production of labeledbiochemical substances. By concurrentlyprobing these microorganisms in vivo withNMR techniques, the metabolic conse-quences of the genetic engineering can beascertained. This approach, being taken byC. J. Unkefer of Los Alamos in collabora-tion with J. K. Griffith of the University ofNew Mexico, may be one of the mostsignificant research directions in stable iso-
67
Enzyme Structure andInteraction with Inhibitors
by Robert E. London
RELATED WORK
T he metabolic studies described in theprevious article represent a relativelystraightforward application of NMR
spectroscopy. The positions of the variousresonances and their heights allow one todetermine the presence and amount of met-abolic intermediates and products and, inturn, the specific metabolic pathways in-volved. These tracer studies with stable-isotope labels are thus directly analogous tostudies with radiolabels such as carbon- 14.
But NMR spectra contain a wealth ofadditional information, Changes in reso-nance position and shape under variousconditions can reveal important structuraland dynamic features of complex biologicalmacromolecules. Here we will review someresults of an extensive series of studies on the‘3 C-labeled enzyme dihydrofolate reductase,or DHFR. The idea was to explore howmuch we could learn about structure anddynamics using NMR techniques in com-bination with isotopic labeling.
Enzymes are particularly interesting tostudy from this point of view since both theirstructure and dynamics may be important totheir function of catalyzing biochemical re-actions, In the familiar “lock and key” modelof enzyme catalysis. a structurally rigid en-zyme “lock” can bind only the structurallycomplementary substrate “keys.” Extensivecrystallographic data have also fostered thispicture of enzymes as rigid structures. Butrecent evidence suggests that enzyme dy-namics is also at work in recognition andcatalysis.
We chose to study the enzyme D H F Rbecause of its clinical relevance. Its functionis to “activate” the vitamin folic acid bycatalyzing the oxidation-reduction reaction
where dihydrofolate is an inactive form offolic acid, and tetrahydrofolate is its ac-
Dihydrofolate
Methotrexate
c o2
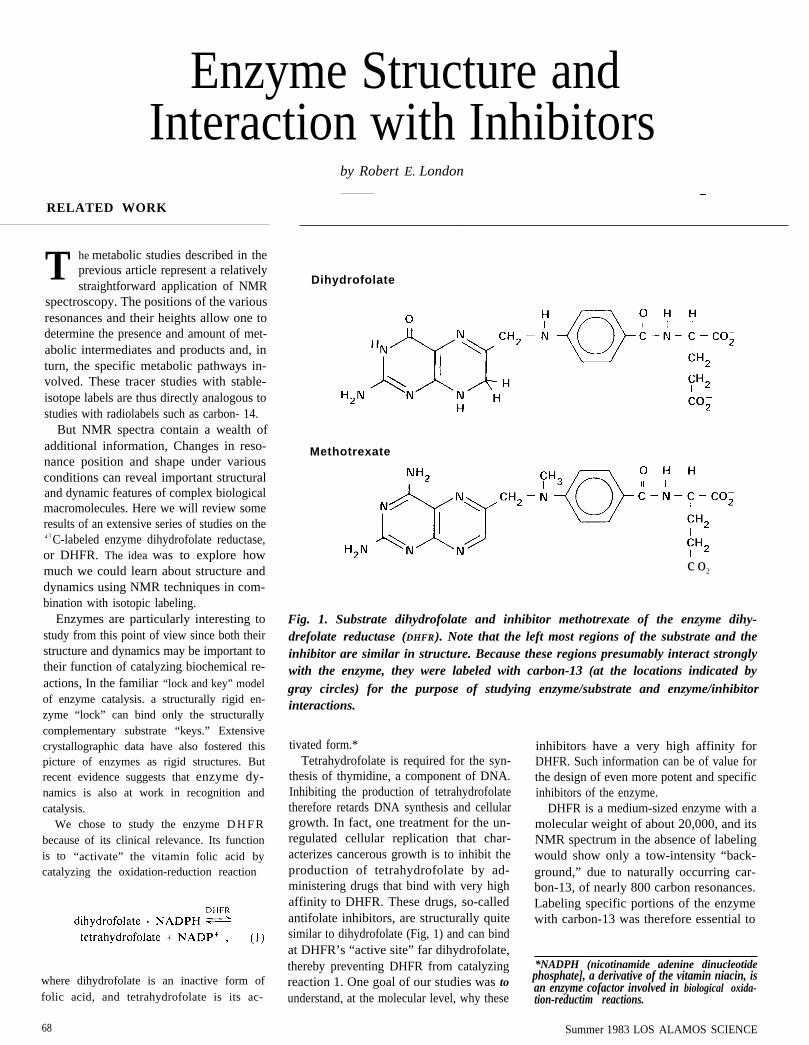
Fig. 1. Substrate dihydrofolate and inhibitor methotrexate of the enzyme dihy-drefolate reductase (DHFR). Note that the left most regions of the substrate and theinhibitor are similar in structure. Because these regions presumably interact stronglywith the enzyme, they were labeled with carbon-13 (at the locations indicated bygray circles) for the purpose of studying enzyme/substrate and enzyme/inhibitorinteractions.
tivated form.* inhibitors have a very high affinity forTetrahydrofolate is required for the syn- DHFR. Such information can be of value for
thesis of thymidine, a component of DNA. the design of even more potent and specificInhibiting the production of tetrahydrofolate inhibitors of the enzyme.therefore retards DNA synthesis and cellular DHFR is a medium-sized enzyme with agrowth. In fact, one treatment for the un- molecular weight of about 20,000, and itsregulated cellular replication that char- NMR spectrum in the absence of labelingacterizes cancerous growth is to inhibit the would show only a tow-intensity “back-production of tetrahydrofolate by ad- ground,” due to naturally occurring car-ministering drugs that bind with very high bon-13, of nearly 800 carbon resonances.affinity to DHFR. These drugs, so-called Labeling specific portions of the enzymeantifolate inhibitors, are structurally quite with carbon-13 was therefore essential tosimilar to dihydrofolate (Fig, 1) and can bindat DHFR’s “active site” far dihydrofolate,thereby preventing DHFR from catalyzing *NADPH (nicotinamide adenine dinucleotide
reaction 1. One goal of our studies was to phosphate], a derivative of the vitamin niacin, isan enzyme cofactor involved in biological oxida-
understand, at the molecular level, why these tion-reductim reactions.
68 Summer 1983 LOS ALAMOS SCIENCE
Metabolism as it happens
RELATED WORK
N / /
— M E T H O T R E X A T E
() TRYPTOPHAN RESIDUES
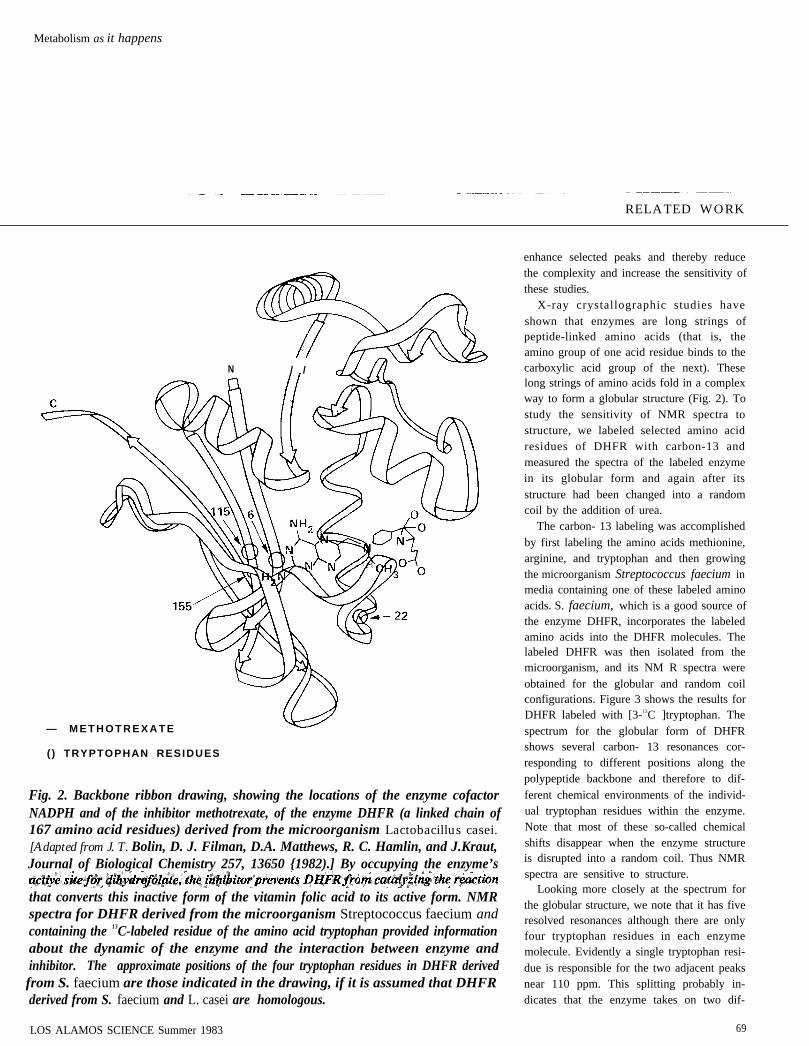
Fig. 2. Backbone ribbon drawing, showing the locations of the enzyme cofactorNADPH and of the inhibitor methotrexate, of the enzyme DHFR (a linked chain of167 amino acid residues) derived from the microorganism Lactobacillus casei.[Adapted from J. T. Bolin, D. J. Filman, D.A. Matthews, R. C. Hamlin, and J.Kraut,Journal of Biological Chemistry 257, 13650 {1982).] By occupying the enzyme’s
that converts this inactive form of the vitamin folic acid to its active form. NMRspectra for DHFR derived from the microorganism Streptococcus faecium andcontaining the 13C-labeled residue of the amino acid tryptophan provided informationabout the dynamic of the enzyme and the interaction between enzyme andinhibitor. The approximate positions of the four tryptophan residues in DHFR derivedfrom S. faecium are those indicated in the drawing, if it is assumed that DHFRderived from S. faecium and L. casei are homologous.
LOS ALAMOS SCIENCE Summer 1983
enhance selected peaks and thereby reducethe complexity and increase the sensitivity ofthese studies.
X-ray crystallographic studies haveshown that enzymes are long strings ofpeptide-linked amino acids (that is, theamino group of one acid residue binds to thecarboxylic acid group of the next). Theselong strings of amino acids fold in a complexway to form a globular structure (Fig. 2). Tostudy the sensitivity of NMR spectra tostructure, we labeled selected amino acidresidues of DHFR with carbon-13 andmeasured the spectra of the labeled enzymein its globular form and again after itsstructure had been changed into a randomcoil by the addition of urea.
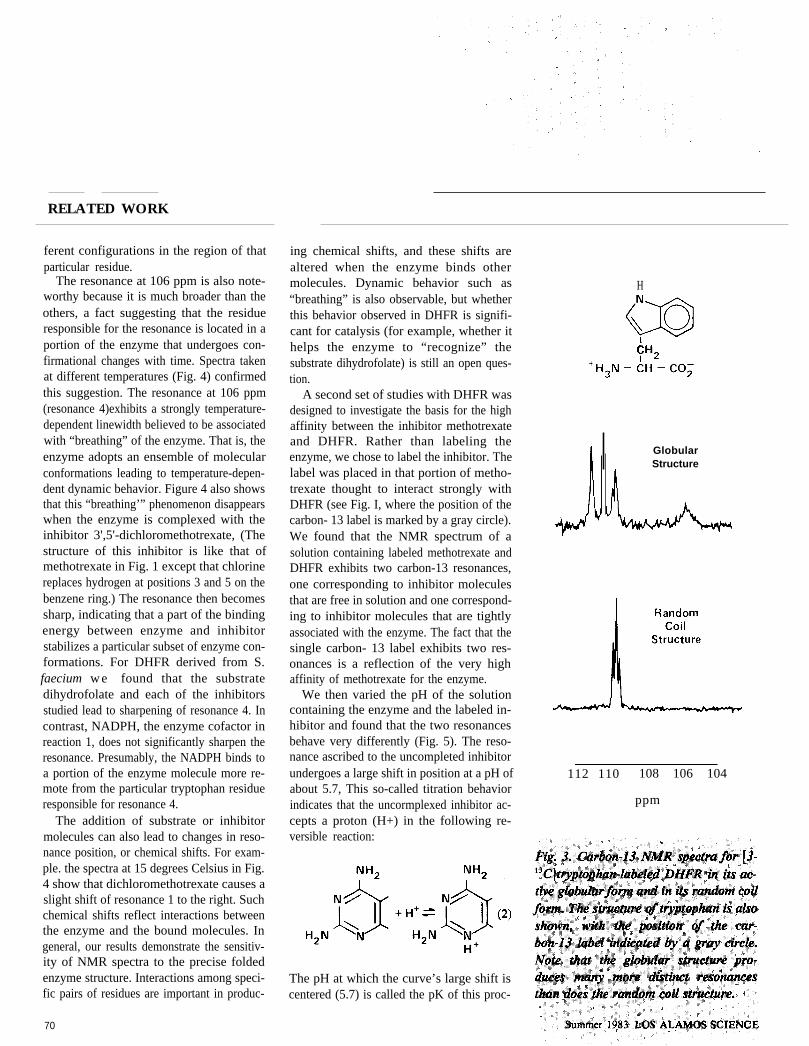
The carbon- 13 labeling was accomplishedby first labeling the amino acids methionine,arginine, and tryptophan and then growingthe microorganism Streptococcus faecium inmedia containing one of these labeled aminoacids. S. faecium, which is a good source ofthe enzyme DHFR, incorporates the labeledamino acids into the DHFR molecules. Thelabeled DHFR was then isolated from themicroorganism, and its NM R spectra wereobtained for the globular and random coilconfigurations. Figure 3 shows the results forDHFR labeled with [3-13C ]tryptophan. Thespectrum for the globular form of DHFRshows several carbon- 13 resonances cor-responding to different positions along thepolypeptide backbone and therefore to dif-ferent chemical environments of the individ-ual tryptophan residues within the enzyme.Note that most of these so-called chemicalshifts disappear when the enzyme structureis disrupted into a random coil. Thus NMRspectra are sensitive to structure.
Looking more closely at the spectrum forthe globular structure, we note that it has fiveresolved resonances although there are onlyfour tryptophan residues in each enzymemolecule. Evidently a single tryptophan resi-due is responsible for the two adjacent peaksnear 110 ppm. This splitting probably in-dicates that the enzyme takes on two dif-
69
RELATED WORK
ferent configurations in the region of thatparticular residue.
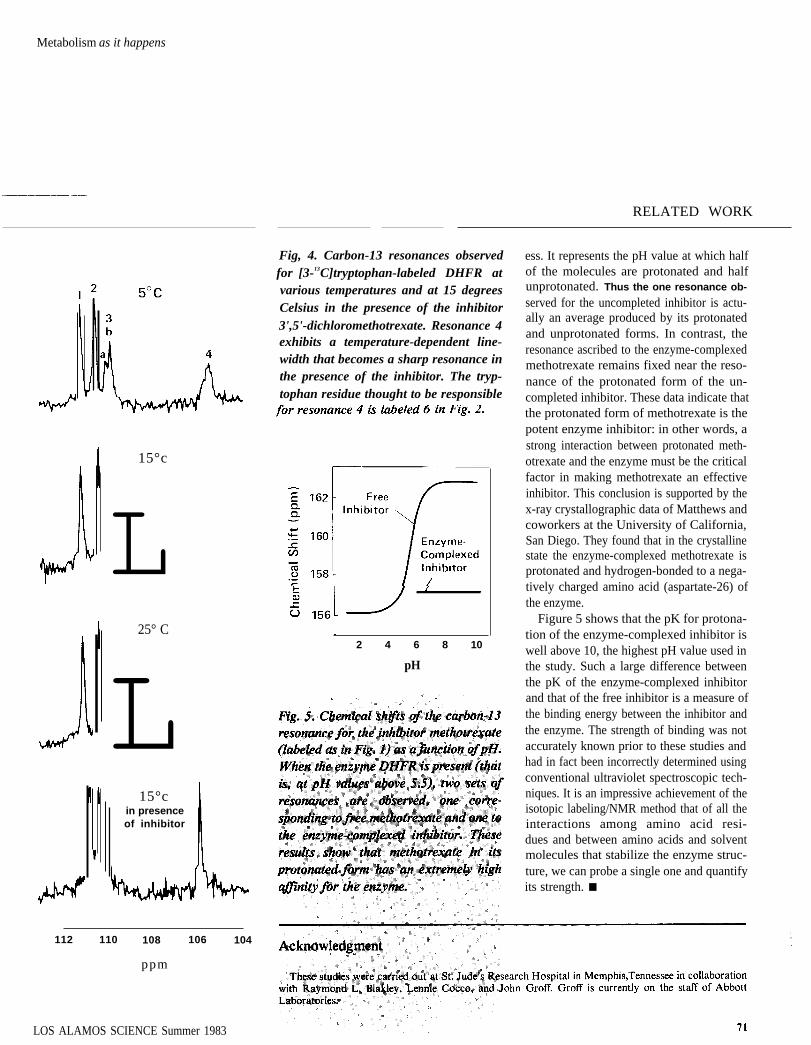
The resonance at 106 ppm is also note-worthy because it is much broader than theothers, a fact suggesting that the residueresponsible for the resonance is located in aportion of the enzyme that undergoes con-firmational changes with time. Spectra takenat different temperatures (Fig. 4) confirmedthis suggestion. The resonance at 106 ppm(resonance 4)exhibits a strongly temperature-dependent linewidth believed to be associatedwith “breathing” of the enzyme. That is, theenzyme adopts an ensemble of molecularconformations leading to temperature-depen-dent dynamic behavior. Figure 4 also showsthat this “breathing’” phenomenon disappearswhen the enzyme is complexed with theinhibitor 3',5'-dichloromethotrexate, (Thestructure of this inhibitor is like that ofmethotrexate in Fig. 1 except that chlorinereplaces hydrogen at positions 3 and 5 on thebenzene ring.) The resonance then becomessharp, indicating that a part of the bindingenergy between enzyme and inhibitorstabilizes a particular subset of enzyme con-formations. For DHFR derived from S.faecium w e found that the substratedihydrofolate and each of the inhibitorsstudied lead to sharpening of resonance 4. Incontrast, NADPH, the enzyme cofactor inreaction 1, does not significantly sharpen theresonance. Presumably, the NADPH binds toa portion of the enzyme molecule more re-mote from the particular tryptophan residueresponsible for resonance 4.
The addition of substrate or inhibitormolecules can also lead to changes in reso-nance position, or chemical shifts. For exam-ple. the spectra at 15 degrees Celsius in Fig.4 show that dichloromethotrexate causes aslight shift of resonance 1 to the right. Suchchemical shifts reflect interactions betweenthe enzyme and the bound molecules. Ingeneral, our results demonstrate the sensitiv-ity of NMR spectra to the precise foldedenzyme structure. Interactions among speci-fic pairs of residues are important in produc-
70
ing chemical shifts, and these shifts arealtered when the enzyme binds othermolecules. Dynamic behavior such as“breathing” is also observable, but whetherthis behavior observed in DHFR is signifi-cant for catalysis (for example, whether ithelps the enzyme to “recognize” thesubstrate dihydrofolate) is still an open ques-tion.
A second set of studies with DHFR wasdesigned to investigate the basis for the highaffinity between the inhibitor methotrexateand DHFR. Rather than labeling theenzyme, we chose to label the inhibitor. Thelabel was placed in that portion of metho-trexate thought to interact strongly withDHFR (see Fig. I, where the position of thecarbon- 13 label is marked by a gray circle).We found that the NMR spectrum of asolution containing labeled methotrexate andDHFR exhibits two carbon-13 resonances,one corresponding to inhibitor moleculesthat are free in solution and one correspond-ing to inhibitor molecules that are tightlyassociated with the enzyme. The fact that thesingle carbon- 13 label exhibits two res-onances is a reflection of the very highaffinity of methotrexate for the enzyme.
We then varied the pH of the solutioncontaining the enzyme and the labeled in-hibitor and found that the two resonancesbehave very differently (Fig. 5). The reso-nance ascribed to the uncompleted inhibitorundergoes a large shift in position at a pH ofabout 5.7, This so-called titration behaviorindicates that the uncormplexed inhibitor ac-cepts a proton (H+) in the following re-versible reaction:
The pH at which the curve’s large shift iscentered (5.7) is called the pK of this proc-
H
GlobularStructure
112 110 108 106 104
ppm
Metabolism as it happens
15°c
L25° C
L15°c
in presenceof inhibitor
112 110 108 106 104
ppm
LOS ALAMOS SCIENCE Summer 1983
Fig, 4. Carbon-13 resonances observedfor [3-13C]tryptophan-labeled DHFR atvarious temperatures and at 15 degreesCelsius in the presence of the inhibitor3',5'-dichloromethotrexate. Resonance 4exhibits a temperature-dependent line-width that becomes a sharp resonance inthe presence of the inhibitor. The tryp-tophan residue thought to be responsible
2 4 6 8 10
pH
RELATED WORK
ess. It represents the pH value at which halfof the molecules are protonated and halfunprotonated. Thus the one resonance ob-
served for the uncompleted inhibitor is actu-ally an average produced by its protonatedand unprotonated forms. In contrast, theresonance ascribed to the enzyme-complexedmethotrexate remains fixed near the reso-nance of the protonated form of the un-completed inhibitor. These data indicate thatthe protonated form of methotrexate is thepotent enzyme inhibitor: in other words, astrong interaction between protonated meth-otrexate and the enzyme must be the criticalfactor in making methotrexate an effectiveinhibitor. This conclusion is supported by thex-ray crystallographic data of Matthews andcoworkers at the University of California,San Diego. They found that in the crystallinestate the enzyme-complexed methotrexate isprotonated and hydrogen-bonded to a nega-tively charged amino acid (aspartate-26) ofthe enzyme.
Figure 5 shows that the pK for protona-tion of the enzyme-complexed inhibitor iswell above 10, the highest pH value used inthe study. Such a large difference betweenthe pK of the enzyme-complexed inhibitorand that of the free inhibitor is a measure ofthe binding energy between the inhibitor andthe enzyme. The strength of binding was notaccurately known prior to these studies andhad in fact been incorrectly determined usingconventional ultraviolet spectroscopic tech-niques. It is an impressive achievement of theisotopic labeling/NMR method that of all theinteractions among amino acid resi-dues and between amino acids and solventmolecules that stabilize the enzyme struc-ture, we can probe a single one and quantifyits strength. ■