a non-homogeneous qbd approach for the admission · pdf filea non-homogeneous qbd approach for...
TRANSCRIPT

HAL Id: inria-00070645https://hal.inria.fr/inria-00070645
Submitted on 19 May 2006
HAL is a multi-disciplinary open accessarchive for the deposit and dissemination of sci-entific research documents, whether they are pub-lished or not. The documents may come fromteaching and research institutions in France orabroad, or from public or private research centers.
L’archive ouverte pluridisciplinaire HAL, estdestinée au dépôt et à la diffusion de documentsscientifiques de niveau recherche, publiés ou non,émanant des établissements d’enseignement et derecherche français ou étrangers, des laboratoirespublics ou privés.
A non-homogeneous QBD approach for the admissionand GoS control in a multiservice WCDMA system
Ioannis Koukoutsidis, Eitan Altman, Jean Marc Kelif
To cite this version:Ioannis Koukoutsidis, Eitan Altman, Jean Marc Kelif. A non-homogeneous QBD approach for theadmission and GoS control in a multiservice WCDMA system. RR-5358, INRIA. 2004, pp.25. <inria-00070645>
ISS
N 0
249-
6399
ISR
N IN
RIA
/RR
--53
58--
FR
+E
NG
appor t de r ech er ch e
Thème COM
INSTITUT NATIONAL DE RECHERCHE EN INFORMATIQUE ET EN AUTOMATIQUE
A non-homogeneous QBD approach for theadmission and GoS control in a multiservice
WCDMA system
Ioannis Koukoutsidis — Eitan Altman — Jean Marc Kelif
N° 5358
Novembre 2004


Unité de recherche INRIA Sophia Antipolis2004, route des Lucioles, BP 93, 06902 Sophia Antipolis Cedex (France)
Téléphone : +33 4 92 38 77 77 — Télécopie : +33 4 92 38 77 65
A non-homogeneous QBD approach for the admission and GoS control in amultiservice WCDMA system
Ioannis Koukoutsidis∗, Eitan Altman∗, Jean Marc Kelif †
Thème COM — Systèmes communicantsProjet MAESTRO
Rapport de recherche n° 5358 — Novembre 2004 — 25 pages
Abstract: We consider a WCDMA system with two types of calls: real time (RT) calls that have dedicatedresources, and data non-real-time (NRT) calls that share system capacity. We consider reservation of someresources for the NRT traffic and assume that this traffic is further assigned the resources left over fromthe RT traffic. The grade of service (GoS) of RT traffic is also controlled in order to allow for handlingmore RT calls during congestion periods, at the cost of degraded transmission rates. We consider both thedownlink (with and without macrodiversity) as well as the uplink, and derive performance evaluation resultsregarding transmission rates, blocking of RT calls and sojourn time of NRT calls, under different trafficcharacteristics. On what concerns the bandwidth-sharing policy of NRT traffic, we compare WCDMAbehavior in the presence of high data rate schemes. Finally, we extend our results to cover NRT admissioncontrol schemes and examine blocking behavior and sojourn time of NRT traffic.
Key-words: CDMA, multiservice traffic, admission and GoS control, quasi-birth-death process
This work was supported by a CRE research contract with France Telecom R&D and by the EURO NGI network of excellence.
∗ [email protected]† [email protected], France Telecom R&D, Rue du Général Leclerc, 92794 Issy les Moulineaux Cedex 9

Une approche de QBD non-homogène pour le contrôle d’admission et duGoS dans un système multiservice WCDMA
Résumé : Nous considérons un système WCDMA (Wideband Code Division Multiple Access) avec deuxtypes de trafic: les appels en temps réel (TR), qui ont des ressources dédiées, et l’envoi des données nontemps-réel (NTR), qui partagent la capacité du système. Nous considérons la réservation de quelques res-sources pour le trafic NTR; de plus, les ressources laissées par le trafic TR lui sont également allouées.Le degré de service (GoS) est contrôlé afin de permettre le traitement d’un plus grand nombre d’appelsTR pendant les périodes de congestion, au détriment des débits de transmission qui se retrouvent dégradés.Nous analysons le sens descendant (avec ou sans macrodiversité) aussi bien que le sens montant du systèmeWCDMA et évaluons les performances des points de vue des débits de transmission, du blocage des appelsTR et du temps de séjour des appels NTR, en fonction des caractéristiques des différents trafics. En ce quiconcerne la politique de partage de la capacité allouée au trafic NTR, nous comparons le comportement duWCDMA en présence des protocoles de transmission des données à haut débit. Finalement, nous étendonsnotre analyse pour inclure le contrôle d’admission du trafic NTR et examinons le blocage et le temps deséjour des appels NTR.
Mots-clés : CDMA, trafic multiservice, contrôle d’admission et du degré de service, processus de quasinaissance et de mort

Admission and GoS control in multiservice WCDMA 3
Contents
1 Introduction 4
2 Background: Computing the transmission rates 42.1 Downlink . . . . . . . . . . . . . . . . . . . . . . . . . . . . . . . . . . . . . . . . . . . . 42.2 Downlink with macrodiversity . . . . . . . . . . . . . . . . . . . . . . . . . . . . . . . . . 62.3 Uplink . . . . . . . . . . . . . . . . . . . . . . . . . . . . . . . . . . . . . . . . . . . . . . 7
3 Admission and rate control 7
4 Traffic model and the LDQBD approach 8
5 Numerical Evaluation 95.1 Setting . . . . . . . . . . . . . . . . . . . . . . . . . . . . . . . . . . . . . . . . . . . . . . 95.2 Uplink and downlink performance . . . . . . . . . . . . . . . . . . . . . . . . . . . . . . . 105.3 Impact of the interference expansion factor . . . . . . . . . . . . . . . . . . . . . . . . . . 135.4 Macrodiversity behavior . . . . . . . . . . . . . . . . . . . . . . . . . . . . . . . . . . . . 145.5 Varying traffic characteristics . . . . . . . . . . . . . . . . . . . . . . . . . . . . . . . . . . 14
5.5.1 NRT traffic parameters . . . . . . . . . . . . . . . . . . . . . . . . . . . . . . . . . 155.5.2 RT traffic parameters . . . . . . . . . . . . . . . . . . . . . . . . . . . . . . . . . . 15
5.6 NRT call admission control . . . . . . . . . . . . . . . . . . . . . . . . . . . . . . . . . . . 16
6 Summary and conclusions 17
Appendix 19
A LDQBD algorithms 19
B Ergodicity theorem 20
References 23
RR n° 5358

4 I.Koukoutsidis, E.Altman & J.M.Kelif
1 Introduction
In this paper, we are interested in analyzing resource sharing between RT (real time) and NRT (non-realtime) calls in a cellular CDMA network, as well as the attained QoS (quality of service) and GoS (grade ofservice). A classical approach widely used in wireless networks is based on adaptively deciding how manychannels (or resources) to allocate to calls of a given service class, see e.g. [6],[15]. Then one can evaluatethe performance as a function of some parameters (thresholds) that characterize the admission policy usingMarkov chain analysis. This allows to optimize and to evaluate trade-offs between QoS parameters of thedifferent classes of mobiles. However, unlike TDMA or FDMA systems in which the notions of channelsand capacity are clear, the capacity of a CDMA system is rather a complex combination of cell parametersand channel conditions, being mostly interference-limited [8],[21]. This largely differentiates the analysisand complicates dimensioning and planning of network resources.
The QoS parameters of interest are primarily the blocking probabilities for RT calls and expected sojourntimes for NRT calls. We allow downgrading of transmission rates (which is viewed as the GoS) of RT calls1
during congestion epochs. The main factors influencing bandwidth sharing are then the call admission policyfor RT calls as well as their downgrading policy.
This paper is a follow-up of [9],[12] in which NRT traffic was scheduled using a time-sharing approach,as is the case in the High Speed Downlink Packet Access (HSDPA) [20],[11] system. This allowed to derivea tractable mathematical model based on a homogeneous QBD (Quasi Birth-Death) process [19],[14]. Thenetwork analyzed in the current paper cannot be evaluated anymore with a homogeneous QBD and wepresent a more involved analysis based on a non-homogeneous QBD.
In order to study the system’s performance we first model the downlink case which allows to obtainthe capacity required by a call of a given class with a given GoS. In particular we also consider the case ofmacrodiversity. We then introduce a corresponding uplink model. We propose a control policy that com-bines admission control together with the control of the transmission rate for RT traffic. Key performancemeasures are then computed.
2 Background: Computing the transmission rates
The analysis is based on radio models for the downlink and uplink introduced in [12],[9]. For completenesswe recall in this section the derivation of capacities and transmission rates.
2.1 Downlink
Let there be S base stations. The minimum power received at a mobile k from its base station l is determinedby a condition concerning the signal to interference ratio, which should be larger than some constant
(C/I)k =Es
No
Rs
WΓ, (1)
where Es is the energy per transmitted bit of type s, No is the thermal noise density, W is the WCDMAchip rate from which the modulation bandwidth is derived, Rs is the transmission rate of the type s call, andΓ is a constant that is related to shadow fading and imperfect power control, and is derived in the same wayas in the uplink case [9].
More precisely, let Pk,l be the power received at mobile k from the base station l. Assume that thereare M mobiles in a cell l; the base station of that cell transmits at a total power Ptot,l given by Ptot,l =
1UMTS uses the Adaptive Multi-Rate (AMR) codec that offers eight different transmission rates of voice that vary between 4.75Kbps to 12.2 Kbps, and that can be dynamically changed every 20 msec.
INRIA

Admission and GoS control in multiservice WCDMA 5
∑Mj=1 Pj,l+PSCH+PCCH where PSCH , PCCH correspond to the power transmitted for the non-orthogonal
synchronization channel (SCH) and the orthogonal common channels (CCH), respectively. Note that thesetwo terms are not power controlled and are assumed not to depend on l. Due to the multipath propagation, afraction a of the received own cell power is experienced as intracell interference. Let gk,l be the attenuationbetween base station l and mobile k. Denoting by Ik,inter and Ik,intra the intercell and intracell interferences,respectively, we have
C
I
∣
∣
∣
∣
k
=Pk,l/gk,l
Ik,inter + Ik,intra +N,
where N is the receiver noise floor (assumed not to depend on k), Ik,intra = α · (PSCH + PCCH +∑
j 6=k Pj,l)/gk,l and Ik,inter =∑S
j=1,j 6=l Ptot,j/gk,j . Define
Fk,l =
∑Sj=1,j 6=l Ptot,j/gk,j
Ptot,l/gk,l,
i.e. the ratio between the received intercell and intracell power. It then follows that
βk =Pk,l/gk,l
(Fk,l + α)Ptot,l/gk,l +N, (2)
where βk =(C/I)k
1 + α(C/I)k. (3)
We then consider two service classes, that will correspond to real time (RT) and non-real time (NRT) traffic.Let (C/I)s be the target SIR ratio for mobiles of service class s and βs be the corresponding value in (3).Let there be in a given cell Ms mobiles of class s. We shall use the following approximations. First wereplace Fk,l by a constant (e.g. its average value, as in [10]; this is a standard approximation, see [11]).Secondly, we approximate gk,l by their averages. More precisely we define Gs to be the average over allmobiles k belonging to class s, s = 1, 2. With these approximations (2) gives the following value for Ptot,l
(we omit the index l):
Ptot =PSCH + PCCH +N
∑
s βsMsGs
1 − (α+ F )∑
s βsMs. (4)
Further assuming that the system is designed so as to have PSCH + PCCH = ψPtot and defining thedownlink load as YDL =
∑
s βsMs, this gives
Ptot =N
∑
s βsMsGs
Z2, where Z2 = (1 − ψ) − (α+ F )YDL. (5)
In practice, to avoid instabilities and due to power limitation of the base stations, one wishes to avoid thatZ2 becomes too close to zero, thus one poses the constraint Z2 ≥ ε for some ε > 0. We can thus define thesystem’s capacity as Θε = 1 − ψ − ε, and the capacity required by a connection to be
∆(s) := (α+ F )βs. (6)
Combining this with (1) and with (3) we get
Rs =∆(s)
α+ F − α∆(s)×NoW
EsΓ. (7)
RR n° 5358
6 I.Koukoutsidis, E.Altman & J.M.Kelif
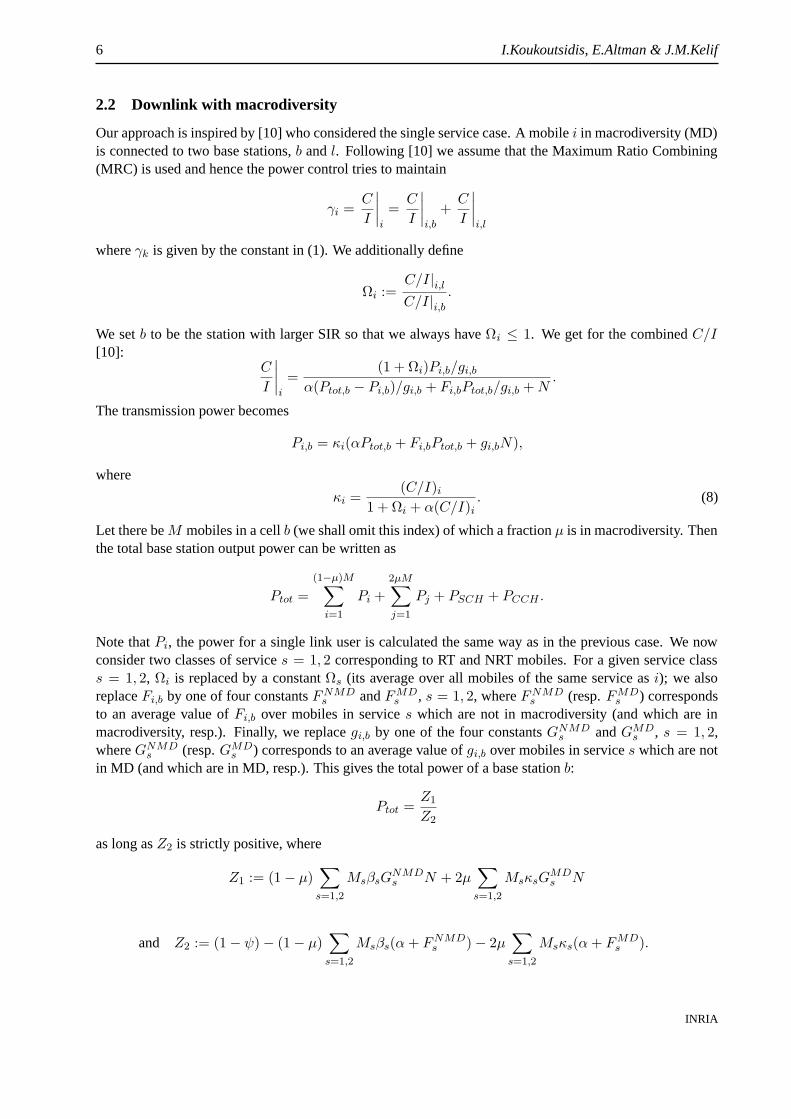
2.2 Downlink with macrodiversity
Our approach is inspired by [10] who considered the single service case. A mobile i in macrodiversity (MD)is connected to two base stations, b and l. Following [10] we assume that the Maximum Ratio Combining(MRC) is used and hence the power control tries to maintain
γi =C
I
∣
∣
∣
∣
i
=C
I
∣
∣
∣
∣
i,b
+C
I
∣
∣
∣
∣
i,l
where γk is given by the constant in (1). We additionally define
Ωi :=C/I|i,lC/I|i,b
.
We set b to be the station with larger SIR so that we always have Ωi ≤ 1. We get for the combined C/I[10]:
C
I
∣
∣
∣
∣
i
=(1 + Ωi)Pi,b/gi,b
α(Ptot,b − Pi,b)/gi,b + Fi,bPtot,b/gi,b +N.
The transmission power becomes
Pi,b = κi(αPtot,b + Fi,bPtot,b + gi,bN),
where
κi =(C/I)i
1 + Ωi + α(C/I)i. (8)
Let there beM mobiles in a cell b (we shall omit this index) of which a fraction µ is in macrodiversity. Thenthe total base station output power can be written as
Ptot =
(1−µ)M∑
i=1
Pi +
2µM∑
j=1
Pj + PSCH + PCCH .
Note that Pi, the power for a single link user is calculated the same way as in the previous case. We nowconsider two classes of service s = 1, 2 corresponding to RT and NRT mobiles. For a given service classs = 1, 2, Ωi is replaced by a constant Ωs (its average over all mobiles of the same service as i); we alsoreplace Fi,b by one of four constants FNMD
s and FMDs , s = 1, 2, where FNMD
s (resp. FMDs ) corresponds
to an average value of Fi,b over mobiles in service s which are not in macrodiversity (and which are inmacrodiversity, resp.). Finally, we replace gi,b by one of the four constants GNMD
s and GMDs , s = 1, 2,
where GNMDs (resp. GMD
s ) corresponds to an average value of gi,b over mobiles in service s which are notin MD (and which are in MD, resp.). This gives the total power of a base station b:
Ptot =Z1
Z2
as long as Z2 is strictly positive, where
Z1 := (1 − µ)∑
s=1,2
MsβsGNMDs N + 2µ
∑
s=1,2
MsκsGMDs N
and Z2 := (1 − ψ) − (1 − µ)∑
s=1,2
Msβs(α+ FNMDs ) − 2µ
∑
s=1,2
Msκs(α+ FMDs ).
INRIA
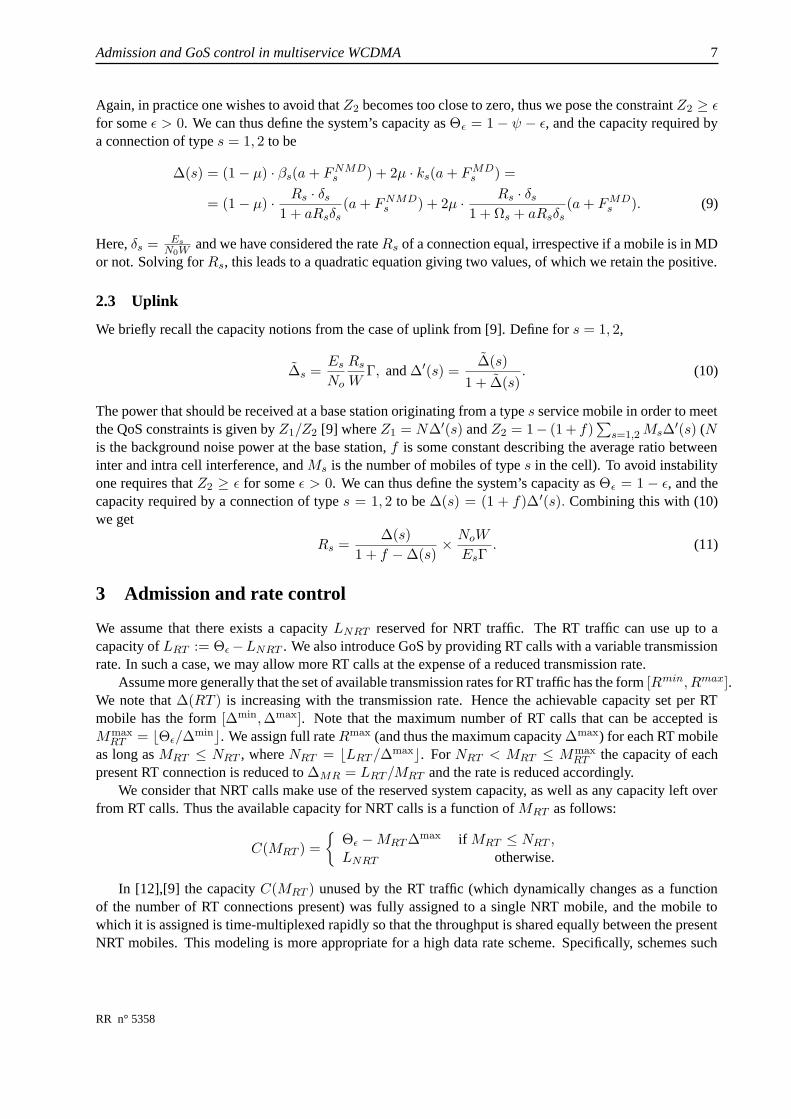
Admission and GoS control in multiservice WCDMA 7
Again, in practice one wishes to avoid that Z2 becomes too close to zero, thus we pose the constraint Z2 ≥ εfor some ε > 0. We can thus define the system’s capacity as Θε = 1 − ψ − ε, and the capacity required bya connection of type s = 1, 2 to be
∆(s) = (1 − µ) · βs(a+ FNMDs ) + 2µ · ks(a+ FMD
s ) =
= (1 − µ) ·Rs · δs
1 + aRsδs(a+ FNMD
s ) + 2µ ·Rs · δs
1 + Ωs + aRsδs(a+ FMD
s ). (9)
Here, δs = EsN0W and we have considered the rateRs of a connection equal, irrespective if a mobile is in MD
or not. Solving for Rs, this leads to a quadratic equation giving two values, of which we retain the positive.
2.3 Uplink
We briefly recall the capacity notions from the case of uplink from [9]. Define for s = 1, 2,
∆s =Es
No
Rs
WΓ, and ∆′(s) =
∆(s)
1 + ∆(s). (10)
The power that should be received at a base station originating from a type s service mobile in order to meetthe QoS constraints is given by Z1/Z2 [9] where Z1 = N∆′(s) and Z2 = 1− (1 + f)
∑
s=1,2Ms∆′(s) (N
is the background noise power at the base station, f is some constant describing the average ratio betweeninter and intra cell interference, and Ms is the number of mobiles of type s in the cell). To avoid instabilityone requires that Z2 ≥ ε for some ε > 0. We can thus define the system’s capacity as Θε = 1 − ε, and thecapacity required by a connection of type s = 1, 2 to be ∆(s) = (1 + f)∆′(s). Combining this with (10)we get
Rs =∆(s)
1 + f − ∆(s)×NoW
EsΓ. (11)
3 Admission and rate control
We assume that there exists a capacity LNRT reserved for NRT traffic. The RT traffic can use up to acapacity of LRT := Θε −LNRT . We also introduce GoS by providing RT calls with a variable transmissionrate. In such a case, we may allow more RT calls at the expense of a reduced transmission rate.
Assume more generally that the set of available transmission rates for RT traffic has the form [Rmin, Rmax].We note that ∆(RT ) is increasing with the transmission rate. Hence the achievable capacity set per RTmobile has the form [∆min,∆max]. Note that the maximum number of RT calls that can be accepted isMmax
RT = bΘε/∆minc. We assign full rateRmax (and thus the maximum capacity ∆max) for each RT mobile
as long as MRT ≤ NRT , where NRT = bLRT /∆maxc. For NRT < MRT ≤ Mmax
RT the capacity of eachpresent RT connection is reduced to ∆MR = LRT /MRT and the rate is reduced accordingly.
We consider that NRT calls make use of the reserved system capacity, as well as any capacity left overfrom RT calls. Thus the available capacity for NRT calls is a function of MRT as follows:
C(MRT ) =
Θε −MRT ∆max if MRT ≤ NRT ,LNRT otherwise.
In [12],[9] the capacity C(MRT ) unused by the RT traffic (which dynamically changes as a functionof the number of RT connections present) was fully assigned to a single NRT mobile, and the mobile towhich it is assigned is time-multiplexed rapidly so that the throughput is shared equally between the presentNRT mobiles. This modeling is more appropriate for a high data rate scheme. Specifically, schemes such
RR n° 5358

8 I.Koukoutsidis, E.Altman & J.M.Kelif
as HDR [1], corresponding to the CDMA 1xEV-DO standard, and its 3GPP counterpart HSDPA [20] havebeen proposed for the downlink in order to achieve higher asymmetric rates. These schemes implementa complex scheduler which evaluates channel conditions and pending transmissions for each connection,using additionally fast retransmission and multicoding to improve throughput. The scheduling decisionspermit the system to benefit from short-term variations and allow most of the cell capacity to be allocated toone user for a very short time, when conditions are favorable.
The modeling in this optimum scenario follows a homogeneous QBD approach, as the transmissionrate is independent of the number of on-going NRT sessions2. Here we consider the case where availablecapacity is split equally between the NRT calls, thus employing a fair rate sharing approach. According tothe previous analysis, if there are k NRT calls present the transmission rate of a single NRT call is given by:
d.l. : RNRT (MRT ) =C(MRT )/k
α+ F − αC(MRT )/k×NoW
EsΓ,
u.l. : RNRT (MRT ) =C(MRT )/k
1 + f − C(MRT )/k×NoW
EsΓ.
Then, in contrast to [12],[9] the total transmission rate RtotNRT of NRT traffic for the downlink and uplink
depends on the numberMRT of RT calls as well as the numberMNRT of NRT calls and is given respectivelyby
d.l. : RtotNRT (MRT ,MNRT ) =
MNRTC(MRT )
MNRT (α+ F ) − αC(MRT )×NoW
EsΓ,
u.l. : RtotNRT (MRT ,MNRT ) =
MNRTC(MRT )
MNRT (1 + f) − C(MRT )×NoW
EsΓ.
The expression for the downlink with macrodiversity is similarly derived, albeit being much more cumber-some.
4 Traffic model and the LDQBD approach
We assume that RT and NRT calls arrive according to independent Poisson processes with rates λRT andλNRT , respectively. The duration of an RT call is exponentially distributed with parameter µRT . The sizeof an NRT file is exponentially distributed with parameter µNRT . Interarrival times, RT call durations andNRT file sizes are all independent. Note that the departure rate of NRT calls depends on the current numberof RT and NRT calls:
ν(MRT ,MNRT ) = µNRTRtotNRT (MRT ,MNRT ).
Under these assumptions, the number of active sessions in all three models (downlink with and withoutmacrodiversity and uplink) can be described as a non-homogeneous or level-dependent (LD) QBD process,and we denote byQ its generator. Upon a stable system, the stationary distribution π is calculated by solving
πQ = 0, (12)
with the normalization condition πe = 1 where e is a vector of ones of proper dimension. The vector π rep-resents the steady-state probability of the two-dimensional process lexicographically. We may thus partition
2Note however that the mathematical modeling does not take into consideration the delay caused by the scheduling operationand the corresponding throughput decrease that can be induced. Further, the modeling is idealistic because it does not consider therandom fluctuations in signal conditions and assumes that all users are, at any moment, capable of transmitting at the peak rate. Formore details, interested readers are referred to the works in [3],[2].
INRIA
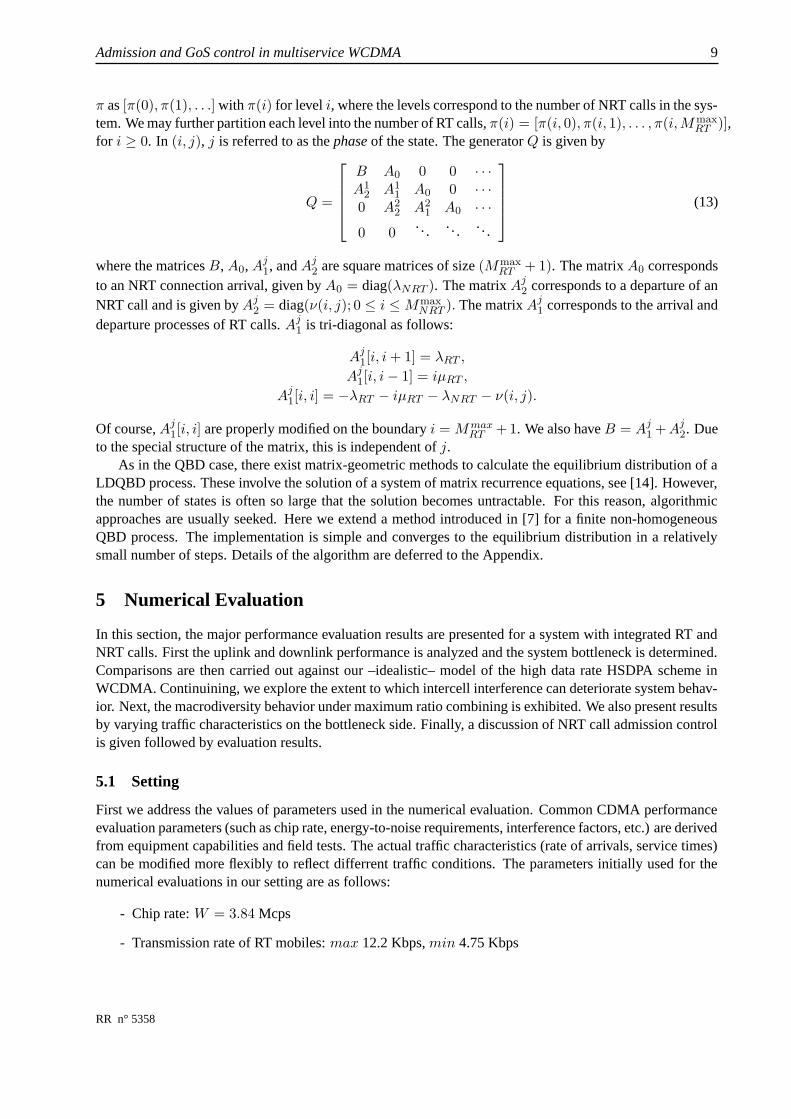
Admission and GoS control in multiservice WCDMA 9
π as [π(0), π(1), . . .] with π(i) for level i, where the levels correspond to the number of NRT calls in the sys-tem. We may further partition each level into the number of RT calls, π(i) = [π(i, 0), π(i, 1), . . . , π(i,Mmax
RT )],for i ≥ 0. In (i, j), j is referred to as the phase of the state. The generator Q is given by
Q =
B A0 0 0 · · ·A1
2 A11 A0 0 · · ·
0 A22 A2
1 A0 · · ·
0 0. . . . . . . . .
(13)
where the matrices B, A0, Aj1, and Aj
2 are square matrices of size (MmaxRT + 1). The matrix A0 corresponds
to an NRT connection arrival, given by A0 = diag(λNRT ). The matrix Aj2 corresponds to a departure of an
NRT call and is given by Aj2 = diag(ν(i, j); 0 ≤ i ≤Mmax
NRT ). The matrix Aj1 corresponds to the arrival and
departure processes of RT calls. Aj1 is tri-diagonal as follows:
Aj1[i, i+ 1] = λRT ,
Aj1[i, i− 1] = iµRT ,
Aj1[i, i] = −λRT − iµRT − λNRT − ν(i, j).
Of course, Aj1[i, i] are properly modified on the boundary i = Mmax
RT + 1. We also have B = Aj1 +Aj
2. Dueto the special structure of the matrix, this is independent of j.
As in the QBD case, there exist matrix-geometric methods to calculate the equilibrium distribution of aLDQBD process. These involve the solution of a system of matrix recurrence equations, see [14]. However,the number of states is often so large that the solution becomes untractable. For this reason, algorithmicapproaches are usually seeked. Here we extend a method introduced in [7] for a finite non-homogeneousQBD process. The implementation is simple and converges to the equilibrium distribution in a relativelysmall number of steps. Details of the algorithm are deferred to the Appendix.
5 Numerical Evaluation
In this section, the major performance evaluation results are presented for a system with integrated RT andNRT calls. First the uplink and downlink performance is analyzed and the system bottleneck is determined.Comparisons are then carried out against our –idealistic– model of the high data rate HSDPA scheme inWCDMA. Continuining, we explore the extent to which intercell interference can deteriorate system behav-ior. Next, the macrodiversity behavior under maximum ratio combining is exhibited. We also present resultsby varying traffic characteristics on the bottleneck side. Finally, a discussion of NRT call admission controlis given followed by evaluation results.
5.1 Setting
First we address the values of parameters used in the numerical evaluation. Common CDMA performanceevaluation parameters (such as chip rate, energy-to-noise requirements, interference factors, etc.) are derivedfrom equipment capabilities and field tests. The actual traffic characteristics (rate of arrivals, service times)can be modified more flexibly to reflect differrent traffic conditions. The parameters initially used for thenumerical evaluations in our setting are as follows:
- Chip rate: W = 3.84 Mcps
- Transmission rate of RT mobiles: max 12.2 Kbps, min 4.75 Kbps
RR n° 5358

10 I.Koukoutsidis, E.Altman & J.M.Kelif
- ERT /N0 (12.2 Kbps voice service): Uplink 4.2 dB, Downlink 7.0 dB
- ENRT /N0 (144 Kbps data service): Uplink 2.2 dB, Downlink 5.0 dB
- Average RT call duration: 125 s
- Arrival rate of RT calls: λRT = 0.4
- Mean NRT session size: 160 Kbits
- Arrival rate of NRT calls: λNRT = 0.4
- Interference factor: Uplink f = 0.73, Downlink f = 0.55, Downlink with macrodiversity f = 0.65
- Fraction of received own cell power experienced as intra-cell interference: a = 0.64
- Fraction of total power transmitted in the downlink for SCH and CCH channels: ψ = 0.2
- Safety margin for capacity: ε = 10−5
The traffic characteristics for RT and NRT calls are initially chosen to correspond to heavy traffic condi-tions, where by default performance evaluation is more challenging. In addition, we note that the evaluationof results is particularly sensitive to the Eb/N0 requirements; increased values lead to enhanced capacityrequirements and thus to an extreme load in the system. Here, the Eb/N0 targets are set according to §12.5of [11] (3GPP performance requirements for a slow moving user, Table 12.26). Values are greater in thedownlink, the reason being smaller receiver sensitivity and antenna gain in the mobile units. In addition,antenna diversity is not usually assumed in the downlink. We have also made the simplifying assumptionthat these values remain approximately constant for different transmission rates. This generally holds whenthe same type of modulation is used for all rates [13].
The parameter Γ, which accounts for shadow fading in the calculation of the system capacity has beenincorporated in the values ofEb/N0. Also, note the value chosen for interference in the case of the downlinkwith macrodiversity, f = 0.65; this is increased compared to the case without MD, as a mobile being in theedge between two base stations would experience more interference (although not as much as in the uplink).
5.2 Uplink and downlink performance
Here we study the behavior in the uplink (UL) and the downlink (DL) of the WCDMA system. Thisresponds to our first major concern, i.e. which side represents the bottleneck of the system. We have, onthe one hand, that the downlink enjoys less interference; however, this is largely eclipsed by the increasedEb/N0 ratios that require more capacity for a given transmission rate, and the expendited power for SCHand CCH channels. Hence, the downlink is expected to be the bottleneck of the system.
This is confirmed in both RT and NRT call behavior. For RT traffic, the major performance metric isthe blocking probability of a new call, since QoS bounds are otherwise guaranteed. This is calculated andshown graphically in Fig. 1, for different values of the LNRT threshold, ranging from 0 to (0.8 − 10−5)in the downlink (due to SCH and CCH channels) and 0 to (1.0 − 10−5) in the uplink. As anticipated,the probability of rejection increases as more capacity is reserved for NRT calls. However, as a distinctivedifference we append that a blocking probability PB > 10−2 can be induced by LNRT = 0.44 in the uplink,while in the downlink the NRT reserved capacity may be as low as LNRT = 0.16.
In the case of NRT traffic, performance evaluation results are portrayed in Fig. 2. Here, quality of serviceis manifested essentially by the time it takes to complete the document transfer, i.e. the mean sojourn timein the system. In addition, the mean transmission rate of a single NRT call is of equal interest, since no
INRIA

Admission and GoS control in multiservice WCDMA 11
0 0.2 0.4 0.6 0.8 10
0.1
0.2
0.3
0.4
0.5
0.6
0.7
0.8
0.9
1
LNRT
threshold
Blo
ckin
g pr
obab
ility
of R
T c
alls
ULDL
Figure 1: Blocking probability of RT calls vs. LNRT reserved capacity, in the UL and DL cases.
0 0.2 0.4 0.6 0.8 10
1
2
3
4
5
6
7
8
9
10
LNRT
threshold
NR
T s
ojou
rn ti
me
ULUL−HSUPADLDL−HSDPA
(a)
0 0.2 0.4 0.6 0.8 10
500
1000
1500
2000
2500
LNRT
threshold
NR
T tr
ansm
issi
on r
ate
(Kbp
s)
ULUL−HSUPADLDL−HSDPA
(b)
Figure 2: Mean NRT sojourn time (a) and transmission rate (b) vs. LNRT reserved capacity, in the UL andDL cases. Comparison with high data rate services.
RR n° 5358

12 I.Koukoutsidis, E.Altman & J.M.Kelif
constraints are imposed. Again we ascertain the performance deterioration in the downlink. It should alsobe noted at this point that differences between the uplink and downlink are much higher if we take exampleswith large asymmetries in transmitted traffic in each direction, which is commonly the case.
The behavior of NRT traffic deserves to be explained, since it reflects the general admission and ratecontrol modeled previously: given the same NRT file size distribution and in availability of a lot of re-sources, the NRT calls that “come into” the system transmit at a higher rate and then leave. Therefore, thecorresponding sojourn time can be smaller. On the other hand, if there are only few resources, the NRT callsthat join in transmit at a very low rate and stay in the system longer. It follows that the mean number of NRTcalls decreases in the first case, while it increases in the latter.
An ergodicity condition is essential for stability in the theoretical case of an unbounded number of NRTcalls. As shown in Fig. 2(a), below a certain value of the LNRT threshold (approximately3 LNRT ≈ 0.1 inthe DL case), the sojourn time tends to infinity and the system becomes unstable. That is, below a certaincapacity the NRT transmission rate becomes too small, which leads to a very high number of such calls inthe system. In the system under consideration, the stability condition is:
µNRT · ERtotNRT > λNRT . (14)
Here, the calculation of ERtotNRT is problematic, since it also depends on the number of NRT calls which is
unbounded. However, we observe that as MNRT → ∞, the total transmission rate reaches a limit in all ULand DL cases. For example, in the UL case we have
limMNRT→∞
RtotNRT =
C(MRT )
1 + f·N0W
EsΓ.
Therefore, the non-homogeneous LDQBD process asymptotically converges to a homogeneous QBD pro-cess. Moreover, the departure rates of NRT calls in the LDQBD process are greater for smaller levels, andalways greater than those of the limiting process4. It can be formally shown that stability conditions are thesame for both processes, i.e. it suffices to check the ergodicity of the limiting homogeneous process. Theproof is deferred to the Appendix, as its applicability is more general and its scope can be extended beyondthe main theme of the paper.
The divergent performance of the uplink and downlink is revisited in Fig. 2(b), in terms of the mean NRTtransmission rate. For small NRT allocated capacity, the transmission rate is in any case small. However,the difference becomes more pronounced as the LNRT threshold increases. For LNRT ≈ 0.8, the differenceamounts to 595.2 Kbps. The uplink transmission rate can attain even larger values as more capacity is beingallocated, reaching 2.34 Mbps for LNRT ≈ 1 (UL).
In addition, Fig. 2 presents a comparison of the standard WCDMA behavior with that of the HSDPAscheme. We also consider the corresponding scheme in the uplink –analogously named HSUPA– whichhas recently been added in 3GPP Release 6 [11]. The numerical results underlying Fig. 2(b) reveal thatthe high data rate scheme can increase the cell throughput in case of small NRT reserved capacity, theobserved increase becoming proportionately smaller for higher values. Comparing the normal WCDMAand HSDPA cases, we note an increase of 162% for LNRT = 0.12, and 4.97% when LNRT = 0.8. Theattainable performance improvement is then apparent under system congestion conditions, namely very highload or very small allocated capacity. Indeed, in terms of the mean sojourn time, Fig. 2(a) shows that theoutperformance of the time-scheduling approach is non-negligible for small NRT reserved capacity (approx.regions LNRT < 0.14 in the uplink, LNRT < 0.2 in the downlink). In the numerical results obtained, thedifference reached up to 80 sec in the uplink, for LNRT = 0.06.
3A granularity of 10−2 is taken in the numerical results.4NRT arrival rates are the same; refer to Q
(k)2 inequality relations in the Appendix.
INRIA

Admission and GoS control in multiservice WCDMA 13
5.3 Impact of the interference expansion factor
As CDMA system capacity is primarily limited by interference, we would like to know to what extentthis affects system behavior. Here numerical results are taken by varying the ratio of intercell-to-intracellinterference, F in the downlink5. A more perceptive term for this is the interference expansion factor.Increasing values of F can then be seen as increased intercell interference.
0 0.2 0.4 0.6 0.80
0.1
0.2
0.3
0.4
0.5
0.6
0.7
0.8
0.9
1
LNRT
threshold
Blo
ckin
g pr
obab
ility
of R
T c
alls
F=0.1F=0.4F=0.7F=1
(a)
0 0.2 0.4 0.6 0.80
5
10
15
LNRT
thresholdN
RT
soj
ourn
tim
e
F=0.1F=0.4F=0.7F=1
(b)
Figure 3: Blocking probability of RT calls (a) and mean NRT sojourn time (b) vs. LNRT reserved capacity,for different values of the interference ratio, F , in the downlink.
Numerical results are portrayed in Fig. 3. The value of the interference expansion factor depends onthe traffic distribution of interfering cells and may well assume values greater than unity [22]; however wetake selected values until F = 1 for our test results here. We may deduce that intercell interference has asignificant impact on performance. Concerning the blocking probability of RT calls in Fig. 3(a), for smallervalues of F an initially good performance is observed; for the smallest value F = 0.1, the loss rate remainsinsignificant until LNRT < 0.4. However, blocking severely increases for higher interference ratio; forF = 1, a blocking probability of PB = 5 · 10−2 occurs even for no allocated NRT capacity and is almostlinearly increased to the value of 1 as the LNRT threshold increases.
The NRT behavior is similarly affected. We observe in Fig. 3(b) that the mean transfer time is greateras interference increases, as well as that the instability region is larger. We are able to make an illustrativecomparison for the value of LNRT = 0.14 where all systems are stable. We have, in that case, that Tsoj(F =0.1) = 1.67 s, Tsoj(F = 0.4) = 3.71 s, Tsoj(F = 0.7) = 9.19 s, and Tsoj(F = 1) = 96.86 s. In a realisticsetting, the first three values may be tolerable, however the last value certainly isn’t, especially in view ofthe mean size of the document in transfer (160 Kbits).
Similar tests conducted in the uplink as well as the high data rate scheme lead to the same conclusions.The deteriotation of system behavior in all cases is due to the fact that more power, and hence more capacityis requested by users to overcome interference. This means less bandwidth available –even for the lowestquality RT calls– and smaller transfer rates for NRT sessions. Finally, the same situation –due to powercontrol– occurs in the uplink, in case of increased intracell interference, and we expect the same observationsto carry over to this case.
5Note that in the downlink this is mitigated by the effect of multipath loss, as Fk,l = a ·Ik,inter
Ik,intra. However this does not affect
the generality of results.
RR n° 5358

14 I.Koukoutsidis, E.Altman & J.M.Kelif
5.4 Macrodiversity behavior
Macrodiversity in the downlink refers to the maintainance of an on-going connection between the mobileterminal and the network by more than one base stations, through maximum ratio combining. It is employedin soft and softer handover techniques, in order to combat fading and improve signal quality; specifically, asthe propagation conditions are different at the same instance of time, a combination of the received signalsis always better or equal than the received signal. The study of macrodiversity has an added significance inour performance evaluation here since it has not yet been contemplated for packet data services.
We draw attention to the trade-off that arises in the downlink analysis presented in § 2.2: for thosemobiles in MD the transmitted power can be smaller, since MRC is used (this being the macrodiversity gain).However, the base station generally expends more power to maintain additional links to those mobiles.
0 0.2 0.4 0.6 0.8 140
50
60
70
80
90
100
110
Fraction of mobiles in MD, µ
NR
T tr
ansm
issi
on r
ate
(Kbp
s)
Ωs=0.9
Ωs=0.7
Ωs=0.5
(a)
0 0.2 0.4 0.6 0.8 15.5
6
6.5
7
7.5
8
Fraction of mobiles in MD, µ
RT
tran
smis
sion
rat
e (K
bps)
Ωs=0.9
Ωs=0.7
Ωs=0.5
(b)
Figure 4: Downlink with macrodiversity. Mean NRT (a) and RT (b) transmission rates vs. the fraction ofmobiles in MD, for different received C/I ratios, Ωs. Results are taken for LNRT = 0.2 (a) and LNRT = 0(b).
Numerical results are displayed in Fig. 4, where both NRT and RT throughput are shown to deterioratefrom the non-MD case (µ = 0,Ωs = 0). Note that the throughput decreases in a sublinear fashion asµ increases. However, we may achieve better performance as the reception ratio Ωs between the two basestations is improved. In Fig. 4(a), NRT transmission rate is reduced by more than half (53.6%, Ωs = 0.5) forfairly poor relevant reception conditions, while for comparable reception (Ωs = 0.9) the relevant decreaseis 25.05%.
Analogous remarks can be made for the RT throughput (Fig. 4(b)). Observe that due to the imposedconstraints, the transmission rate is always kept within 4.75 ≤ RRT ≤ 12.2. The mean rate is closer to thelower bound because of heavy RT call arrival rate. It is added that, were there no transmission constraintson RT traffic, the maximum transmission rate can reach up to Rmax
RT = 997.4 Kbps with full bandwidthallocation.
5.5 Varying traffic characteristics
Traffic parameters are primarily related to the arrival rate and file size for NRT calls, and the arrival rateand mean session time for RT calls. We vary each of these and show that they may influence to a greater or
INRIA
Admission and GoS control in multiservice WCDMA 15
lesser extent the overall performance of the system. The RT call behavior can be studied independently as anM/M/c/c system, and the impact of traffic parameters is reduced to studying the load λRT /µRT . Hence wewill be concerned with the NRT behavior, which may be affected by all parameters in the complex system.Note that because of the interaction of NRT and RT calls and their competition for system resources, thenotion of system load is not straightforward. Hence we study parameters separately and refer to ‘very highload’ as those sets of values that drive the system in a region towards instability. Hereafter results refer alsoto the downlink (without macrodiversity), since it has been identified as the bottleneck of the system.
5.5.1 NRT traffic parameters
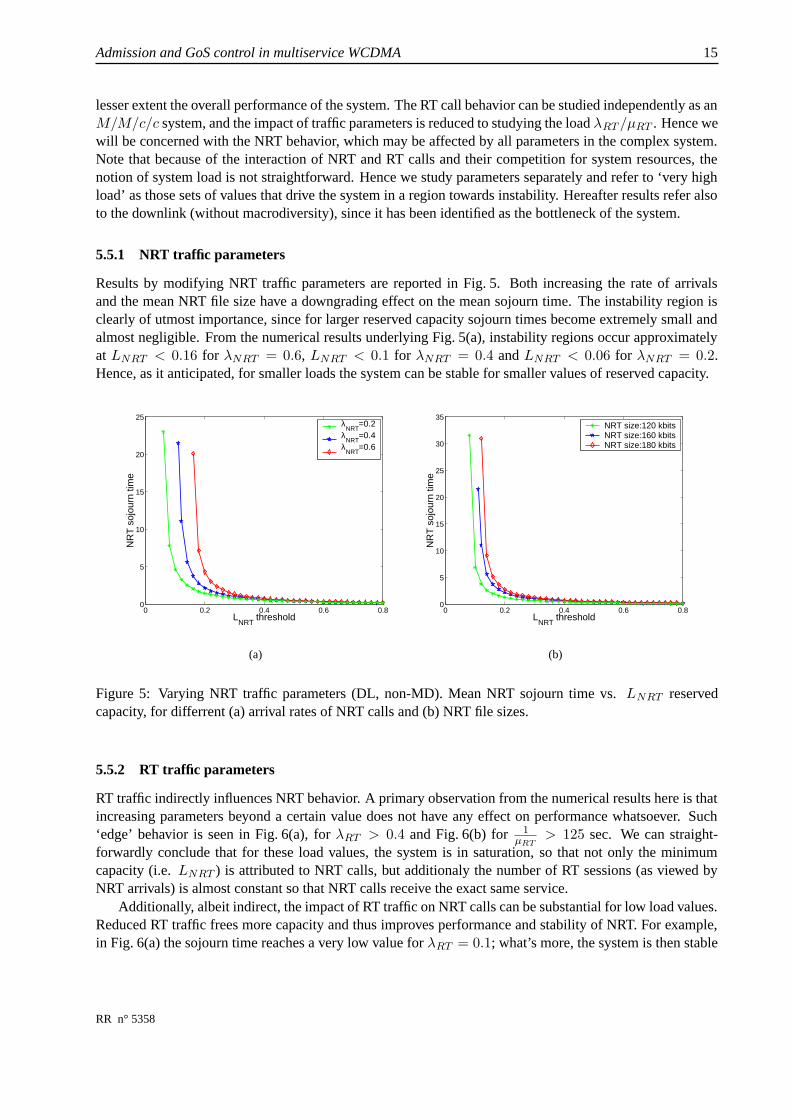
Results by modifying NRT traffic parameters are reported in Fig. 5. Both increasing the rate of arrivalsand the mean NRT file size have a downgrading effect on the mean sojourn time. The instability region isclearly of utmost importance, since for larger reserved capacity sojourn times become extremely small andalmost negligible. From the numerical results underlying Fig. 5(a), instability regions occur approximatelyat LNRT < 0.16 for λNRT = 0.6, LNRT < 0.1 for λNRT = 0.4 and LNRT < 0.06 for λNRT = 0.2.Hence, as it anticipated, for smaller loads the system can be stable for smaller values of reserved capacity.
0 0.2 0.4 0.6 0.80
5
10
15
20
25
LNRT
threshold
NR
T s
ojou
rn ti
me
λNRT
=0.2λ
NRT=0.4
λNRT
=0.6
(a)
0 0.2 0.4 0.6 0.80
5
10
15
20
25
30
35
LNRT
threshold
NR
T s
ojou
rn ti
me
NRT size:120 kbitsNRT size:160 kbitsNRT size:180 kbits
(b)
Figure 5: Varying NRT traffic parameters (DL, non-MD). Mean NRT sojourn time vs. LNRT reservedcapacity, for differrent (a) arrival rates of NRT calls and (b) NRT file sizes.
5.5.2 RT traffic parameters
RT traffic indirectly influences NRT behavior. A primary observation from the numerical results here is thatincreasing parameters beyond a certain value does not have any effect on performance whatsoever. Such‘edge’ behavior is seen in Fig. 6(a), for λRT > 0.4 and Fig. 6(b) for 1
µRT> 125 sec. We can straight-
forwardly conclude that for these load values, the system is in saturation, so that not only the minimumcapacity (i.e. LNRT ) is attributed to NRT calls, but additionaly the number of RT sessions (as viewed byNRT arrivals) is almost constant so that NRT calls receive the exact same service.
Additionally, albeit indirect, the impact of RT traffic on NRT calls can be substantial for low load values.Reduced RT traffic frees more capacity and thus improves performance and stability of NRT. For example,in Fig. 6(a) the sojourn time reaches a very low value for λRT = 0.1; what’s more, the system is then stable
RR n° 5358

16 I.Koukoutsidis, E.Altman & J.M.Kelif
0 0.2 0.4 0.6 0.80
5
10
15
20
25
LNRT
threshold
NR
T s
ojou
rn ti
me
λRT
=0.1λ
RT=0.2
λRT
>0.4
(a)
0 0.2 0.4 0.6 0.80
5
10
15
20
25
LNRT
threshold
NR
T s
ojou
rn ti
me
RT duration:50 sRT duration:80 sRT duration>125 s
(b)
Figure 6: Varying RT traffic parameters (DL, non-MD). Mean NRT sojourn time vs. LNRT reserved capac-ity, for differrent (a) arrival rates of RT calls and (b) RT session durations.
even for no LNRT reserved capacity. The same behavior is shown in Fig. 6(b), where for very small RTduration the system exhibits good NRT performance and stability even for LNRT = 0. It is trivially addedthat the same overall stability can be observed for sufficiently low NRT loads.
5.6 NRT call admission control
So far we have only considered bounds on the number of RT applications, leaving NRT traffic unconstrainedto make use of the available bandwidth. Nevertheless, even though best-effort applications are considered tobe elastic, we have seen that under a small reserved capacity and high loads, available rate calls can suffersevere performance degradation. Hence some form of call admission control (CAC) might be required toensure some minimal quality of service in these cases.
It is more difficult to define a policy that immediately corresponds to a QoS criterion, since the notionof capacity is more implicit in CDMA and large variances in transmission rates can occur because of thedynamic resource allocation scheme6. Roughly, we can base an NRT admission control policy on a mini-mum allowed, or desirable rate for the transmission of these calls. For instance, the minimal capacity thatcorresponds to a given rate Rmin
NRT for a single NRT call is (downlink, no macrodiversity):
∆minNRT =
(a+ f)RminNRT
aRminNRT + wN0
EsΓ
. (15)
Then, we have that the maximum number of allowed NRT calls when only the reserved LNRT capacity isleft over (worst case) is:
MmaxNRT = b
LNRT
∆minNRT
c.
Table 1 represents indicative values of the minimum transmission rate and the corresponding maximumnumber of allowed NRT calls, given various values of the LNRT threshold. The number of allowed NRT
6It is worth noting that, in contrast with FDMA or TDMA systems and provided that MNRT (t) > 0, resource utilization is notaffected by CAC in this scheme. It is the GoS that is affected.
INRIA

Admission and GoS control in multiservice WCDMA 17
calls for a given RminNRT rate grows with reserved capacity; equivalently, for the same Mmax
NRT the minimumguaranteed NRT rate increases. Clearly, Rmin
NRT values represent worst case bounds here, as more availablecapacity may be allocated to NRT traffic. Moreover, the mean transmission rate is generally much higher.
RNRTmin
MNRTmax LNRT = 0.02 LNRT = 0.2 LNRT = 0.4
2000 6.45 · 10−3 6.45 · 10−2 0.129
1000 1.29 · 10−2 0.129 0.258
200 6.45 · 10−2 0.646 1.29
100 0.129 1.29 2.58
50 0.258 2.59 5.19
25 0.517 5.19 10.42
Table 1: Minimum NRT transmission rate (Kbps) for a given maximum number of NRT calls, under differentLNRT reserved capacity (DL, non-MD).
The setting of an upper bound introduces call blocking for NRT traffic. The blocking probability willbe the main parameter under examination here. Since we have assumed Poisson arrivals, the blockingprobability of an incoming NRT call is
PB = PrMNRT = (MmaxNRT ) =
MmaxRT
∑
i=0
π(MmaxNRT , i).
Then the average sojourn time of an NRT session can be calculated using Little’s law, considering the portionof NRT calls that are admitted into the system:
T sojNRT =
E[MNRT ]
λNRT (1 − PB). (16)
The direct impact of the number of allowed NRT calls is considered in the numerical evaluation of Fig. 7.Algorithm Finite LDQBD (Appendix A) is used to calculate the stationary distribution. As anticipated, rais-ing the number of NRT calls decreases blocking (Fig. 7(a)). However, this effect must be largely mitigateddue to the fact that NRT calls then spend more time in the system. For small values of the reserved capacity(LNRT ≈ 0.1), the blocking probability reaches values where the loss in performance becomes apparent.Further, for smaller reservations blocking is dominant even for fairly large MNRT
max values. On the contrary,we may observe the drastic drop in blocking for small increases after LNRT > 0.1, which once again pointsout the significance of the role of capacity reservation on CAC.
Fig. 7(b) also depicts the impact of the number of allowed NRT calls on the individual mean sojourntimes. Increasing Mmax
NRT logically increases the time spent in the system. Remark here that the sojourntime will assume extremely high values under congestion conditions, or equivalently in regions where theunconstrained system would be unstable (approx. LNRT < 0.1 in the graph). Therefore, the gain obtainedfrom less blocking reflects the loss of performance of those served, and this constitutes the trade-off weshould consider in the design of the admission control scheme.
6 Summary and conclusions
We end by recapitulating the major conclusions drawn from this research. The performance of an integratedCDMA system with RT and NRT traffic is determined by the actual traffic load, Eb/N0 requirements for
RR n° 5358

18 I.Koukoutsidis, E.Altman & J.M.Kelif
0 0.1 0.210
−10
10−8
10−6
10−4
10−2
100
LNRT
threshold
NR
T b
lock
ing
prob
abili
ty
MNRT,max
=25M
NRT,max=50
MNRT,max
=100M
NRT,max=200
(a)
0 0.2 0.4 0.6 0.8
100
101
102
103
104
105
LNRT
threshold
NR
T s
ojou
rn ti
me
MNRT,max
=50M
NRT,max=100
MNRT,max
=200M
NRT,max=1000
MNRT,max
=infinite
(b)
Figure 7: NRT admission control scheme (DL, non-MD). NRT call blocking probability (a) and meansojourn time (b) vs. LNRT reserved capacity, for different allowed maximum number of NRT calls.
each class, as well as interference and the amount of available capacity. Besides that, the actual systembehavior is mirrored through the call admission and GoS control scheme applied. Here, we have studieda system with adaptive-rate RT calls and elastic NRT traffic. The general CAC scheme allows NRT callsto benefit from low or intermittent RT traffic to attain an improved performance. Both for the uplink anddownlink, it has been shown that bandwidth reservation can offer significant performance improvement toNRT calls, at the expense of increased blocking of RT sessions. However, the amount of reservation neednot be very high; for the test cases considered, a reservation smaller than 20% of the total capacity vastlyimproves the NRT performance, while leaving RT behavior intact.
In case of overload conditions, the behavior of the system can severely degrade. High data rate methodssuch as HSDPA, which employ a complex scheduling of the different user transmissions each making useof the whole available bandwidth, can then reduce congestion symptoms and improve performance.
In addition, the use of macrodiversity techniques deteriorates transmission capacity in the downlinkbecause of the requirement for a base station to maintain additional links to mobile units. This performancedegradation is mitigated in the case of better reception conditions from the two base stations.
Finally, stricter admission control policies might be imperative to reduce the service time of NRT calls,especially under high load conditions. In this scope, we have demonstrated how the setting of an admissioncontrol policy on NRT traffic is a trade-off between the number of calls allowed and the GoS offered to thoseserved.
INRIA

Admission and GoS control in multiservice WCDMA 19
Appendix
A LDQBD algorithms
Consider the transition probability matrix for a LDQBD process with a finite number of levels, K.
Q =
B A0 0 · · · · · ·A1
2 A11 A0 0 · · ·
0 A22 A2
1 A0 · · ·...
......
. . ....
0 · · · · · · AK2 AK
1
where again B = Aj1 + Aj
2 and AK1 [i, i] = −λRT − i · µRT − ν(i,K). We use the following algorithm
from [7] to calculate the steady state distribution. The algorithm is similar to later introduced stochasticcomplementation methods [18] and consists of the following steps:
Algorithm Finite LDQBD :
1) Compute the stochastic Si matrices using the following recursion:
S0 =B,
Sn =An1 +An
2 (−S−1n−1)A0, 1 ≤ n ≤ K.
2) Find the stationary distribution of the SK stochastic matrix by solving
πK · SK = 0,
πK · e = 1.
3) Recursively compute the remaining stationary distributions
πn = πn+1 ·An+12 · (−S−1
n ), for 0 ≤ n ≤ K.
4) Renormalize to obtain the steady-state distribution
π =π
π · e.
In order to solve the infinite system, the objective is to find a value for the number of level K ∗ such thatπ(k) ≈ 0 ∀ k > K∗. Thus we may extend the previous algorithm as follows:
set K∗ = Kinit
while π(K∗) · e > ε
K∗ = K∗ + h,run algorithm Finite LDQBD
endThe values of ε, h define the tolerance and step size, respectively and determine the accuracy and rate ofconvergence of the algorithm. An appropriate value of Kinit can be readily available from runs in the finitecase, which give an indice on how big the number of levels should be. Provided the system is stable, thealgorithm will converge to the steady-state distribution.
RR n° 5358
20 I.Koukoutsidis, E.Altman & J.M.Kelif
B Ergodicity theorem
Theorem 1 Consider a stochastic irreducible LDQBD process X(t) whose submatrices Q(k)0 , Q(k)
1 , Q(k)2
converge to level independent submatrices, Q′0, Q′
1, Q′2 of a homogeneous QBD process X ′(t) as the level
number k → ∞, i.e. limk→∞Q(k)s = Q′
s, s = 0, 1, 2. The number of phases at each level is finite,denoted by m. The LDQBD is, in matrix-block form:
Q =
Q(0)1 Q
(0)0 0 0 · · ·
Q(1)2 Q
(1)1 Q
(1)0 0 · · ·
0 Q(2)2 Q
(2)1 Q
(2)0 · · ·
0 0. . . . . . . . .
The matricesQ(k)0 ,Q(k)
2 determine transitions up and down one level, respectively, and it holds that7 Q(0)0 <
Q(1)0 < · · · < Q′
0, and Q(1)2 > Q
(2)2 > · · · > Q′
2, for every defined k ∈ Z+. Further, we assume that
transitions are skip-free in each direction8, and that transition rates in matrices Q(k)1 , Q′
1 are identicalwithin the same level. Then, if the homogeneous QBD process X ′(t) is ergodic, the non-homogeneousLDQBD process X(t) also is. Conversely, if process X ′(t) is not ergodic with a positive expected drift, i.e.d = πQ′
0e− πQ′2e > 0, process X(t) is also not ergodic. For these cases, both processes satisfy the same
ergodicity condition.
Proof Denote byX(t),X ′(t) the stochastic processes determined byQ, and its counterpartQ′, respectively.It is reminded that the ergodicity condition for the homogeneous QBD is [14]
πQ′2e > πQ′
0e. (17)
In the first part of the proof, we proceed to show thatX(t) ≤st X′(t), i.e. thatX ′(t) stochastically dominates
X(t). For this we need the following Lemma, initially reported in [17] and later explored in [4],[16].
Lemma 1 Define (E,≤) to be a countable partially ordered set, and a set F ⊆ E which is ≤-increasing.Let X(t), X ′(t) be Markovian skip-free processes on E with transition intensities q(i, j), q ′(i, j), respec-tively, s.t.
∑
j 6=i qij < ∞ and∑
j 6=i q′ij < ∞ for every i ∈ E. Then X ′(t) stochastically dominates X(t) if
and only if the following conditions hold, for all x ≤ y in E and all increasing sets, F :
(i) if x, y ∈ F ,∑
z /∈F
q(x, z) ≥∑
z /∈F
q′(y, z)
and
(ii) if x, y /∈ F ,∑
z∈F
q(x, z) ≤∑
z∈F
q′(y, z).
7Notice that, in our paradigm, we have level-independent matrices Q0. However, it is trivial to modify the proof in that case.8A skip-free process is one that cannot skip adjacent states. This refers to departures and arrivals of NRT and RT calls in our
system.
INRIA

Admission and GoS control in multiservice WCDMA 21
It is obvious that the first condition refers to the case where the sum of transition rates towards ‘smaller’states is always less or equal for the dominating process, while the second one states that the sum of transitionrates towards ‘larger’ states is always greater or equal for the dominating process.
In order to prove the theorem we need to show that conditions (i), (ii) hold for the stochastic processesgiven by the matrices Q(k)
0 , Q(k)1 , Q
(k)2 and Q′
0, Q′1, Q
′2. The proof follows similar steps with those of Bright
and Taylor [5].First we define the partial order relation (<) by (i, j) < (k, l) if:
((i < k) ∧ (j ≤ l)) ∨ ((i ≤ k) ∧ (j < l))
Since transitions are skip-free in each direction and matrices Q, Q′ have the exact same structure, it sufficesto prove stochastic dominance for this order.
We start by examining condition (i) of the Lemma and consider increasing sets F on the state space E,according to the partial order. We only consider non-trivial states9, i.e. x, y ∈ F s.t.
∑
z /∈F q(x, z) 6= 0 ∧∑
z /∈F q′(y, z) 6= 0. With great generality10, there exists a set of boundary states B = x :
∑
z /∈F q(x, z) 6=0, i.e. states for which there exists at least one transition to the complementary set, F c. It follows thatnon-trivial states are boundary states.
We examine different cases for condition (i) to hold. Consider any boundary element x = (i, k) ∈ F ; inthe general case, there may exist transitions to:
(a) (i− 1, k) and (i, k − 1) /∈ F , or(b) (i− 1, k) /∈ F , or(c) (i, k − 1) /∈ F .
We treat the cases x = y ∈ F and x < y ∈ F separately.
x = y ∈ F . Assume first that (a) holds. We have for X(t)
∑
z /∈F
q(x, z) = (Q(i)1 )k,k−1 + (Q
(i)2 )k,k
and for X ′(t)
∑
z /∈F
q′(x, z) = (Q′1)k,k−1 + (Q′
2)k,k.
Transition rates within the same level are identical, so that (Q′1)k,k−1 = (Q
(i)1 )k,k−1. Also by definition
(Q′2)k,k < (Q
(i)2 )k,k. Therefore, condition (i) is satisfied.
If case (b) holds, i.e. there is only one transition to (i− 1, k) /∈ F , we have
∑
z /∈F
q(x, z) = (Q(i)2 )k,k
and∑
z /∈F
q′(x, z) = (Q′2)k,k
where (Q′2)k,k < (Q
(i)2 )k,k and (i) is satisfied.
9Summations equal zero in any other case. Also, since x ≤ y ∈ F and transitions are skip-free in each direction we cannothave the case
∑
z /∈F q(x, z) = 0 ∧∑
z /∈F q′(y, z) 6= 0.10if F = E, then B = ∅ and
∑
z /∈F q(x, z) =∑
z /∈F q′(y, z) = 0, i.e. again condition (i) is satisfied.
RR n° 5358

22 I.Koukoutsidis, E.Altman & J.M.Kelif
Finally, in (c) if there exists only a transition to (i, k − 1) /∈ F , we get
∑
z /∈F
q(x, z) = (Q(i)1 )k,k−1 = (Q′
1)k,k−1 =∑
z /∈F
q′(x, z)
so that (i) again holds.
x < y ∈ F . Consider again a boundary state x = (i, k) where cases (a), (b), or (c) may hold. Thenthe only non-trivial y > x can be either y = (i+ 1, k) or (y = i, k + 1). If y = (i+ 1, k) either case (a) or(c) will exist for x and we have
∑
z /∈F
q′(y, z) = (Q′1)k,k−1
and∑
z /∈F
q(x, z) = (Q(i)1 )k,k−1 + (Q
(i)2 )k,k, in case (a)
or∑
z /∈F
q(x, z) = (Q(i)1 )k,k−1, in case (c).
In any case, it holds that∑
z /∈F q(x, z) ≥∑
z /∈F q′(y, z) so that condition (i) is fulfilled.
Similarly, for y = (i, k + 1) we have
∑
z /∈F
q′(y, z) = (Q′2)k,k+1
and either (a) or (b) will hold for x. We then get
∑
z /∈F
q(x, z) = (Q(i)1 )k,k−1 + (Q
(i)2 )k,k, in case (a)
and∑
z /∈F
q(x, z) = (Q(i)2 )k,k, in case (b).
where again we always have∑
z /∈F q(x, z) ≥∑
z /∈F q′(y, z).
The proof that condition (ii) of the Lemma is fulfilled is derived in a similar manner, consideringtransitions to larger states based on the matrices Q(k)
0 , Q(k)1 and the set of boundary elements B = y :
∑
z∈F q′(y, z) 6= 0 for x ≤ y /∈ F .
Thus we arrive at X(t) ≤st X′(t). We shall use this to establish the stability of the non-homogeneous
process X(t). To this end, we consider the mean recurrence time to the smallest11 state ` = (0, 0), definedby
σ` = inft > 0 : X(t) = `|t > ρ`,
where ρ` is the first exit time from `. Then for the stochastic processes Xt,X ′t it must hold that σ` ≤st σ
′`.
We prove this by contradiction; assume that σ` >st σ′`. Then it must hold that E[σ`] > E[σ′`], from
which Pr[X = `] < Pr[X ′ = `]. Since ` is the smallest state, we conclude that Pr[X > `] > Pr[X ′ > `].But this contravenes the stochastic order relation.
Therefore, we deduce thatσ` ≤st σ
′`
11Note that due to the partial order here, the ‘smallest’ state is defined as ` = x ∈ E : @ x′ 6= x with x′ > x.
INRIA
Admission and GoS control in multiservice WCDMA 23
from whichE[σ`] ≤ E[σ′`].
Hence, if the homogeneous process X ′(t) is ergodic, the mean recurrence time of process X(t) to state` is finite and thus ` is positive recurrent. SinceX(t) is irreducible, it follows that all other states are positiverecurrent and the process is ergodic.
We also proceed to show that if X ′(t) is not ergodic with a positive12 expected drift, i.e. πQ′2e < πQ′
0e,then X(t) is also not ergodic. We may then say that condition (17) is close to being necessary for theergodicity of the LDQBD process.
Since elements of matricesQ′2,Q′
0 are real, there exist appropriate values such that the resulting modifiedQBD process, X ′′(t) has Q′′
2 > Q′2 and Q′′
0 < Q′0, and it still holds that13 πQ′′
2e ≤ πQ′′0e, i.e. the process is
not ergodic.Next we define the L-embedded chain of the LDQBD process, consisting of all levels i ≥ L. This is the
truncated LDQBD process obtained by rerouting transitions from level L to L − 1 back to the same level,i.e. Q(L)
2 = 0 and Q(L)1 +Q
(L)0 = 0. It is straightforward to show that if the L-embedded process XL(t) is
not ergodic, then the original LDQBD process X(t) is also not ergodic. Consider a state x in the state spaceof the L-embedded process, S. Since transitions of the two processes are identical beyond level L, we have
E[ScTx→x] = ∞
for the mean recurrence time of process X(t) to state x, avoiding states in the complementary set S c. Sincethe L-embedded process is also irreducible14, there exists a probability 0 <ScPx→x < 1 that X(t) does notpass through Sc during its first recurrence15 to x. Hence the following inequality holds:
E[Tx→x] ≥ E[ScTx→x] ·ScPx→x,
from which we conclude that E[Tx→x] = ∞ and thus LDQBD is not ergodic.Consider now the sequence of L-embedded submatrices, L = 0, 1, . . . . As L increases, the matrices
Q(L)2 (Q(L)
0 ) become smaller (larger). Therefore, there exists a level L after which Q(L)2 < Q′′
2 , Q(L)0 > Q′′
0 .Then we can follow a similar procedure as in the first part of the proof to show that for processes X ′′(t),XL(t) defined on the same state space S, it holds
X ′′t ≤st X
Lt .
Then, we conclude for the mean recurrence time to the smallest state ` ∈ EL, that
σL` ≥ σ′′`
⇒ E[σL` ] ≥ E[σ′′` ].
Since X ′′(t) is not ergodic, E[σ′′` ] = ∞ and thus XL(t) is also not ergodic. Then from the precedingargument we can conclude that the LDQBD process is not ergodic, which completes the proof.
12We do not treat the case πQ′2e = πQ′
0e here; for this, the QBD process is also not ergodic (since (17) is a necessary andsufficient condition, cf. [14]), but we cannot examine the behavior of LDQBD by the analogous argument used in the reverse partof the proof.
13The stationary probability vector π of transitions within the same level is invariant to changes in Q2,Q0.14This follows immediately from the structure of transition probabilities.15Since the whole process is irreducible, there exists a positive probability to return to x in finite time. Moreover, the probability
ScPx→x cannot be equal to 1.
RR n° 5358

24 I.Koukoutsidis, E.Altman & J.M.Kelif
References
[1] P. Bender, P. Black, M. Grob, R. Padovani, N. Sindhushayana and A. Viterbi, “CDMA/HDR: Abandwidth-efficient high-speed wireless data service for nomadic users”, IEEE Communications Mag-azine, 70–77, July 2000.
[2] T. Bonald and A. Proutière, “Wireless downlink data channels: User performance and cell dimension-ing”, Proc. ACM Mobicom, San Diego, USA, September 2003.
[3] S. Borst, “User-level performance of channel-aware scheduling algorithms in wireless data networks”,Proc. IEEE Infocom, San Fransisco, USA, March/April 2003.
[4] A. Brandt, G. Last, “On the pathwise comparison of jump processes driven by stochastic intensities”,Mathematische Nachrichten, 167, 21–42.
[5] L. Bright, P. Taylor, “Calculating the equilibrium distribution in level dependent quasi-birth-and-deathprocesses”, Commun. Statist.-Stochastic Models, 11(3), 497–525, 1995.
[6] Y. Fang, Y. Zhang, “Call admission control schemes and performance analysis in wireless mobilenetworks”, IEEE Transactions on Vehicular Technology, 51(2), 371–382, March 2002.
[7] D.P. Gaver, P.A. Jacobs, G. Latouche, “Finite birth-and-death models in randomly changing environ-ments”, Advances in Applied Probability, 16, 715–731, 1984.
[8] K.S. Gilhousen, I.M. Jacobs, R. Padovani, A.J. Viterbi, A. Weaver, Jr., C.E. Wheatley , “On the capac-ity of a cellular CDMA system”, IEEE Transactions on Vehicular Technology, 40(2), 303–312, May1991.
[9] N. Hegde, E. Altman, “Capacity of multiservice WCDMA Networks with variable GoS”, Proc. ofIEEE WCNC, New Orleans, Louisiana, USA, March, 2003.
[10] K. Hiltunen, R. De Brarnardi, “WCDMA downlink capacity estimation”, Proc. IEEE VTC-Spring,992–996, Tokyo, Japan, 2000.
[11] H. Holma and A. Toskala, Eds.,WCDMA for UMTS: Radio access for third generation mobile commu-nications, John Wiley & Sons, 3rd Edition, 2004.
[12] J.M. Kelif, E. Altman, “Admission and Gos control in multiservice WCDMA system”, Proc. ECUMN’04, Porto, Portugal, October 2004.
[13] S.-L. Kim, Z. Rosberg, J. Zander, “Combined power control and transmission rate selection in cellularnetworks”, Proc. IEEE VTC-Fall, 1653–1657, Amsterdam, The Netherlands, 1999.
[14] G. Latouche, V. Ramaswami, Introduction to matrix analytic methods in stochastic modeling, ASA-SIAM, 1999.
[15] C.W. Leong, W. Zhuang, “Call admission control for voice and data traffic in wireless communica-tions”, Computer Communications, 25(10), 972–979, 2002.
[16] J.F. López, S. Martínez, G. Sanz, “Stochastic domination and Markovian couplings”, Advances inApplied Probability, 23, 1064–1076, 2000.
INRIA
Admission and GoS control in multiservice WCDMA 25
[17] W.A. Massey, “Stochastic orderings for Markov processes on partially ordered spaces”, Mathematicsof Operations Research, 12(2), 350–367, 1987.
[18] C.D. Meyer, “Stochastic complementation, uncoupling Markov chains, and the theory of nearly re-ducible systems”, SIAM Review, 31(2), 240–272, 1989.
[19] M.F. Neuts, Matrix-geometric solutions in stochastic models: an algorithmic approach, The JohnHopkins University Press, 1981.
[20] S. Parkvall, E. Dahlman, P. Frenger, P. Beming and M. Persson, “The high speed packet data evolutionof WCDMA”, Proc. 12th IEEE PIMRC, San Diego, USA, 2001.
[21] A.M. Viterbi, A.J. Viterbi, “Erlang capacity of a power-controlled CDMA system”, IEEE J. SelectedAreas in Communications, 11(6), 892–900, August 1993.
[22] A.J. Viterbi, A.M. Viterbi and E. Zehavi, “Other-cell interference in cellular power-controlled CDMA”,IEEE Transactions on Communications, 42(2/3/4), 1501-1504, Feb./March./April 1994.
RR n° 5358

Unité de recherche INRIA Sophia Antipolis2004, route des Lucioles - BP 93 - 06902 Sophia Antipolis Cedex (France)
Unité de recherche INRIA Futurs : Parc Club Orsay Université - ZAC des Vignes4, rue Jacques Monod - 91893 ORSAY Cedex (France)
Unité de recherche INRIA Lorraine : LORIA, Technopôle de Nancy-Brabois - Campus scientifique615, rue du Jardin Botanique - BP 101 - 54602 Villers-lès-Nancy Cedex (France)
Unité de recherche INRIA Rennes : IRISA, Campus universitaire de Beaulieu - 35042 Rennes Cedex (France)Unité de recherche INRIA Rhône-Alpes : 655, avenue de l’Europe - 38334 Montbonnot Saint-Ismier (France)
Unité de recherche INRIA Rocquencourt : Domaine de Voluceau - Rocquencourt - BP 105 - 78153 Le Chesnay Cedex (France)
ÉditeurINRIA - Domaine de Voluceau - Rocquencourt, BP 105 - 78153 Le Chesnay Cedex (France)
http://www.inria.frISSN 0249-6399