a nonparametric statistical approach in noisy chaos identification
TRANSCRIPT

This article was downloaded by: [Umeå University Library]On: 15 November 2014, At: 17:17Publisher: Taylor & FrancisInforma Ltd Registered in England and Wales Registered Number: 1072954 Registered office: MortimerHouse, 37-41 Mortimer Street, London W1T 3JH, UK
Communications in Statistics - Simulation andComputationPublication details, including instructions for authors and subscription information:http://www.tandfonline.com/loi/lssp20
A nonparametric statistical approach in noisy chaosidentificationDejian Lai a & Ronald B. Harrist aa Program in Biometry School of Public Health , University of Texas at Houston , Houston,TX, 77030Published online: 27 Jun 2007.
To cite this article: Dejian Lai & Ronald B. Harrist (1997) A nonparametric statistical approach in noisychaos identification, Communications in Statistics - Simulation and Computation, 26:1, 291-300, DOI:10.1080/03610919708813380
To link to this article: http://dx.doi.org/10.1080/03610919708813380
PLEASE SCROLL DOWN FOR ARTICLE
Taylor & Francis makes every effort to ensure the accuracy of all the information (the “Content”) containedin the publications on our platform. However, Taylor & Francis, our agents, and our licensors make norepresentations or warranties whatsoever as to the accuracy, completeness, or suitability for any purpose ofthe Content. Any opinions and views expressed in this publication are the opinions and views of the authors,and are not the views of or endorsed by Taylor & Francis. The accuracy of the Content should not be reliedupon and should be independently verified with primary sources of information. Taylor and Francis shallnot be liable for any losses, actions, claims, proceedings, demands, costs, expenses, damages, and otherliabilities whatsoever or howsoever caused arising directly or indirectly in connection with, in relation to orarising out of the use of the Content.
This article may be used for research, teaching, and private study purposes. Any substantial or systematicreproduction, redistribution, reselling, loan, sub-licensing, systematic supply, or distribution in anyform to anyone is expressly forbidden. Terms & Conditions of access and use can be found at http://www.tandfonline.com/page/terms-and-conditions
COMMUN. STATIST.-SIMULA., 26(1), 291-300 (1997)
A NONPARAMETRIC STATISTICAL APPROACH IN NOISY CHAOS
IDENTIFICATION
Dejian Lai and Ronald B . Harrist
Program in Biometry
&hool of Public Health
[Jniversity of Texas a t Houston
Houston. TX 77030
Key Words and Phrases: chaos, randomness, runs, turns, Kendall's 7
ABSTRACT
Data resulting from some deterministic dynamic systems may appear to
be random. To distinguish these kinds of data from random data is a new
challenge for statisticians. This paper develops a nonparametric statistical
test procedure for distinguishing noisy chaos from i. i. d. random processes.
The procedure can be easily-implemented by computer and is very effective in
identifying low dimensional chaos in certain instances.
Data resulting from some simple nonlinear deterministic dynamic systems
rney appear t,o bc ~.antlonl. These data are said to exhil~it chaotic behavior,
whir11 has been studietl 1)y statisticians recently (see. for example. J o i ~ r n a l
o j the Royal Statistical Socrety, Ser. B , Vol. 54, No. 2 1992, Berliner 1992,
Cliatterjee and Yilmaz l!)92a)
Copyr igh t C 1997 hy M x r c c l Dekkrr. I I IC
Dow
nloa
ded
by [
Um
eå U
nive
rsity
Lib
rary
] at
17:
17 1
5 N
ovem
ber
2014
292 LA1 AND HARRIST
According to Schuster, the English word "chaos7' is derived from the Greek
" X C Y O ~ " and originally meant the infinite empty space which existed before all
things (Schuster 1988). Later, chaos was interpreted in Roman conception
as the original crude, shapeless mass into which the Architect of the world
introduces order and harmony. In modern usage, chaos denotes a state of
disorder and irregularity. This is the meaning adopted in this paper.
Chaos has been studied extensively in nonlinear dynamics for the last three
decades since Lorenz's paper (1963 ), even though the original study on chaos
could be dated back to Poincare (1899). Unfortunately, however, there is
no unique, widely accepted mathematical definition of chaos. In various dis-
ciplines, chaos may mean any or all of the following: sensitive dependence
on initial conditions; broadband power spectra; decaying correlations; unpre-
dictability of the system.
In this article, we define the irregular data generated from a dynamic sys-
tem as chaotic and we define the observations resulting from uncertain out-
comes as random. Chaotic data combined with random measurement errors
are called noisy chaotic data. To distinguish chaotic data from random data is
a new challenge for statisticians. We propose a simple computational method
as an initial step in this direction.
Two popular methods of quantifying the chaoticity of a dynamical system
are estimating fractal dimensions (Chatterjee and Yilmaz 1992b) and estimat-
ing Lyapunov exponents (Tong 1990, Lai and Chen 1995) from the observed
time series. In order to have good estimates of fractal dimensions and Lya-
punov exponents, thousands or more accurate observations are required. This
kind of data may be available in physical science, but in other disciplines,
especially biology, epidemiology and economics, the sequence of observatiui~s
may nut be long and accurate enough to produce good estimates of fractal
dirr~c~isions and Lyapunov exponents. Further, t,hese data often contain l>ot,11
chaot,ic a ~ ~ t l randorn components. Must of the attention for analyzing this
kind of noisy, chaotic da ta is still concentrated on improving and better u n -
derstanding the behavior of the methods for estimating fractal dimensions and
Lyapunov exponents in the noisy environment. (Chan and Tong 1994, Yao and
7'011g 1994, 1,clc 1994).
The purpose of this art,icle is to show the applicability of n nonparamet-
ric statistical testing procedure in distinguishing low dimensional chaos from
randomness. Some examples of noisy chaotic systems are in t rod~~ccd in Sec-
Dow
nloa
ded
by [
Um
eå U
nive
rsity
Lib
rary
] at
17:
17 1
5 N
ovem
ber
2014

NOISY CHAOS IDENTIFICATION 293
tion 2. The test statistics are presented in Section 3. The nonparametric test
procedure, which involves a transformation technique, is provided in Section
4. Discussion of the method is in Section 5.
2. NOISY CHAOTIC SYSTEMS
Suppose the dynamic system has form:
where Xt = (st , x,-~,. . . , x ~ - ~ + ~ ) , t = 1, 2 , . . . is an index of time and d is an
integer indicating the lag dimension of the dynamic system. In some instance,
such dynamic systems may. generate observations which appears to be ran- - dom, but in fact contain a chaotic component. In many instance, the classic
statistical tests of randomness can not distinguish these da ta from a random
series.
The most commonly studied example is the logistic map (Tong 1990):
Example 1
where t = 0, 1 , . . ., xo E [O, 11, and a E [O, 41. For a 2 3.56994, xt will be
random i n appearance.
In the following simulation studies, we let a=4 and let xo be a random value
taken from the uniform[O,l) distribution. This and other simple dynamic sys-
tems have been widely used in analyzing biological, epidemiological and eco-
logical data (May 1987).
The exponential map is used in modeling the abundance of a single species
in a high-density population regulated by an epidemic disease:
Example 2
zt+, = xte r ( 1 - z t ) (3)
tihere i -- 0 , 1, 2 , . . . , :I:" E 10, m) and. 7. E [O, 41. W h e n r > 2 6924, th,e
obser~ia t ior~s become chaotic.
111 our simulation studies, we Ict rz3.73 and zo be randomly chosen from
uliiforn1[0,2].
In practice, what one usually observes from the system is a noisy series
{ ~ t = x t + t t ) (with additive errors) or { y t = z t t t ) (with multiplicat,ive errors),
Dow
nloa
ded
by [
Um
eå U
nive
rsity
Lib
rary
] at
17:
17 1
5 N
ovem
ber
2014
294 LA1 AND HARRlST
where t t denotes the measurement error. There are, of course, other types of
errors. For simplicity, we study only these two types of errors. The results are
given in Section 4.
3. T E S T STATISTICS
Tests of randomness have a long history. Many statistics have been sug-
gested for identifying randomness. Three of them are used in our study.
Runs t e s t
For an ordered dichotomous sequence, a run is defined as a succession of
one or more identical symbels which are preceded and followed by t h e other
symbol or no symbol a t all. For example, the ordered series of ten symbols, + + - -t - - + - - - has three runs of +'s and three runs of -'s. We can calculate
the runs of a specified type for a time series by the following method.
Suppose we have observed a time series {yt) , and denote the median of t h e
series as y d z a n . Then, a dichotomous sequence of + and - can be formed by
considering sequence using
and omitting sign(yt - y d z a n ) if yt - y,dian = 0. Let m be number of runs
of +'s, n be number of runs of -'s and R = m + 12. It can be shown t h a t the
null distribution of
is al)proxirnat,ely standard normal under t.he hypothesis of randomness of the
scrios (Kotz i t l~d .lollnson 1986). This hypothesis may be rejectled a t level (Y
by comparison of the observed Z to a standard ~iorrnal distribution.
T u r n s t e s t
Another popular test of randomness is the turns t,est. From an observed
time scries, wc gencrittc an ordered sequence of -t anti - using
Dow
nloa
ded
by [
Um
eå U
nive
rsity
Lib
rary
] at
17:
17 1
5 N
ovem
ber
2014

NOISY CHAOS IDENTIFICATION 295
omitting (yt-* - yt)(yt - yt,l) = 0. The number of runs of the ordered sequence
is the number of "turning points" of the time series. Let V denote the number
of "turning points" and let N be the number of signs in the sequence. One
can show that the nu11 distribution of
is approximately standard normal (Kotz and Johnson 1986). The hypothesis
of randomness of the series can be tested by referring the observed Z to a
standard normal distribution.
Kendall's T
For the observed time series { y t ) , we consider yt - y, for all s < t . If
y, - y, > 0, we have a concordant pair, if yt - y, < 0, we have a discordant pair.
M'e omit the pairs such that yt - y, = 0. Let c be the number of concordant
pairs, d be the number of discordant pairs and N = c + d . Kendall's T is
defined as T = c - d. It can be shown that the null distribution of
is approximately standard normal (Kotz and Johnson 1983). Again, the hy-
pothesis of randomness of the series can be tested by referring the observed Z to a standard normal distribution.
4 PROCEDURE FOR DISTINGUISHING RANDOMNESS AND CHAOS
Unfortunately none of the three test statistics defined in Section 3 will
distinguish the chaotic series generated from either the Iogistic or exponential
map from random series. This IS demonstrated by a simulatiou experiment
with the following results. For 100 simulated logistic maps with 100 observa-
t hus in each series, 92% of the observed runs, 90% of the observed turns and
96% of the observed r ' s are in the 95%) confidence int,erval of the standardized
FINS, turns and 7's respectively. Similar results are observed for the exponen-
tial map. For 100 simulated exponential maps with 100 observations in each
series. 8.5% of t,he ol~served runs. 97% of the observed turns and 9.5% of the
observed T'S are in the 95% confidence interval of the stanclardizeil runs, turns
a d .i's respectively.
Dow
nloa
ded
by [
Um
eå U
nive
rsity
Lib
rary
] at
17:
17 1
5 N
ovem
ber
2014
296 LA1 AND HARRIST
These simulations imply t h a t the runs test, the turns test and the Kendall's
T are not useful for distinguishing determini~t~ic chaos from randomness. In
order to make these statistics useful, we propose the following simple trans-
formation on the observed series.
Let y l , . . , yn denote any observed time series. We seek to test the null
hypothesis that the series arose from an i. i. d . random process. Form an
array displaying the lags of order one:
Now rearrange the columns in (7) according the magnitude of the element
in the first row. IJsing y(,),to denote the i th smallest observation and yj, to
indicate t h a t the j t h element in t h e second row of (7) has been moved to the
i th position, we have expression (8). Expression (8) denotes the "lag of order
one" transformation.
I t is conjecturetl tha t when the observations y1, yp, . . . , yn are realizations
of i . i . d . rantlorn variables a n d n is large, then the observations yi,, . . . , yirL , (the second row of (8)) are realizations of approximately i . i . d . randorn
variables. 'I'liis c:oujectuse is supported by the sinlulation studies teportccl ill
Table I . Therek)re, in order to tkst the hypothesis of randomness of the series,
we can apply t h ~ three test, statistics previously described t o the second row
of (8).
To test this proccclure, 100 i . i . d. uniform[O,l] and 100 i. i. d. standard
nornlal scrics wit,li lt:11gt11 100 were jieneratctl. T l ie~ i , t,he three tcst s ta t i~ t~ ics
were applicd tan thc original series and also thc t,ransformed series (the second
row of (8)). 'I'l~t: l~c~.cent ;~j ies of t,he tcst st;tt,ist,ics f;~lling in the 95% confitlcrice
interval of t l ~ c os1)wtc~tl v:~lucs of t,he t,est st;ttist,ic.s ~intler t,he i . i . d . hypothrsis
are give11 i ~ i 'l';d)lc 1.
'I'ablc I i~itl~c,;itcs ~ i u l ~ c ~ of tlic tost, statistirs tlist,i~lgulshcs the t,~.;tilsfol.rrltrtl
series fr-or11 all i. i t l scries. T h e n t,he test,s were applied t,o d a t a g e n e r a t d
by the logist,ic i t ~ i t l 1)). t.lic: tr:tnsforrned logist,ic trial) with different magnitutlcs
of i . i , ( I . X ( O , i i s ) r~ i txsu~cr i ie~ l t orrors.
Dow
nloa
ded
by [
Um
eå U
nive
rsity
Lib
rary
] at
17:
17 1
5 N
ovem
ber
2014
NOISY CHAOS IDENTIFICATION 297
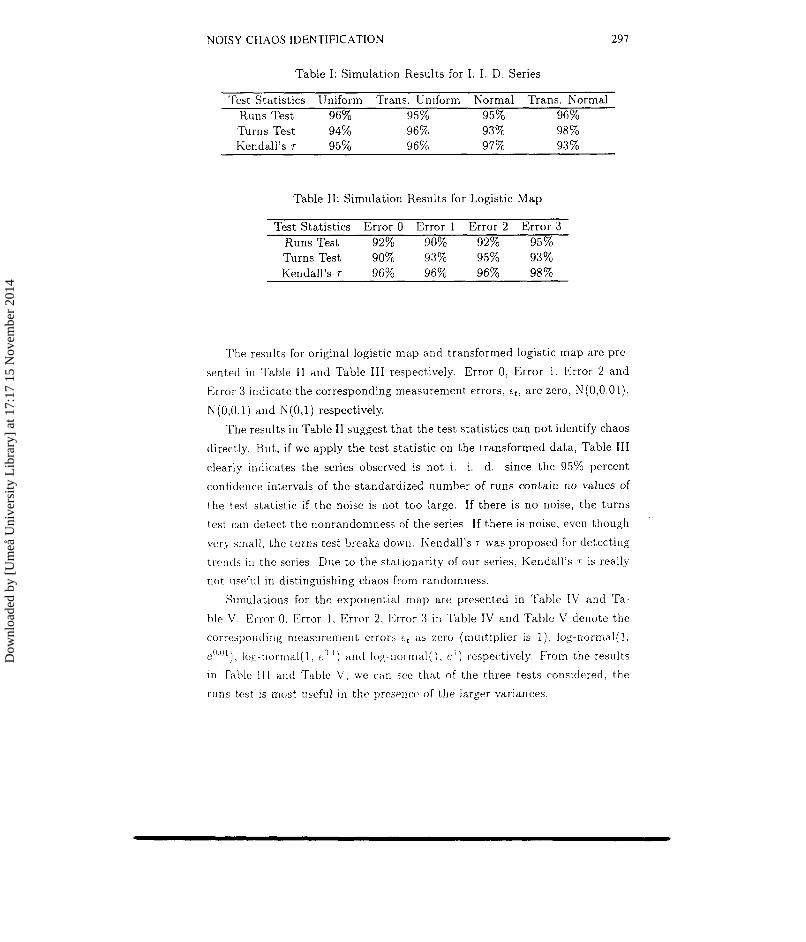
Table I: Simulation Results for I. I. D. Series
Test Statistics Uniform Trans. Uniform Normal Trans. Normal Runs Test 96% 95% 95% 96% Turns Test 94% 96% 93% 98% Kendall's T 95% 96% 97% 93 %
Table 11: Simulation Results for Logistic M a p
Test Statistics Error 0 Error 1 Error 2 Error 3 Runs Test 92% 90% 92% 95% Turns Test 90% 93% 95% 93% Kendall's T 96% 96% 96% 98%
The results for original logistic map and transformed logistic map are pre-
sented il l Table I1 and Table 111 respectively. Error 0, Error 1, Error 2 and
Error 3 indicate the corresponding measurement errors, t t , are zero, N(0,0.01),
N(0,O.l) and N(0,l) respectively.
The results in Table I1 suggest that the test statistics can not identify chaos
directly. But , i f we apply t h e test statistic on the transformed data , Table 111
clearly indicates the series observed is not i . i . d . since the 95% percent
confidence intervals of the standardized number of runs contain no values of
the t,est statistic if the noise is not too large. If there is n o noise, the turns
test can detect the nonrandomness of the series. If there is noise, even though
verj small, the turns test breaks dow~i . Kendall's 7 was proposed for detecting
trends in the series. Due to the stationarity of our series, Kendall's T is really
riot useful in distinguishing chaos from randomness.
Simulations for thc exponential map are presented in Table IV and Ta-
ble V. Error 0, Error 1 , Error 2 , Error 3 in Tahle IV and Table V denote the
correspouding nleasurenlent errors 6 , as zero (multiplier is 1). log-l~ormal( l , e ~ ) . ~ ~ ) , log-riorrnal(1, e0- ' ) ttlitl log-~iornial(l , e ' ) respectively. From the results
in Table 111 and Table V, we r a n see that of t h e three tests considered, the
runs t a t is most uscful i l l the presenc,o of the larger variances,
Dow
nloa
ded
by [
Um
eå U
nive
rsity
Lib
rary
] at
17:
17 1
5 N
ovem
ber
2014

298 LA1 AND HARRIST
Table 111: Simulation Results for Transformed Logistic Map
Test Statistics Error 0 Error 1 Error 2 Error 3 Runs Test 0% 0% 0% 95% Turns Test 0% 16% 92% 93% Kendall's,r 75% 83% 92% 95%
Table IV: Simulation Results for Exponential Map
Test Statistics Error 0 Error 1 Error 2 Error 3 RunsTest 95% 100% 92% 91% Turns Test 97% 100% 99% 95 % Kendall's T 95% 100% 100% 100%
Table V: Simulation Results for Transformed Exponential Map
Test Statistics Error 0 Error 1 Error 2 Error 3 Runs Test 0 % 0% 0% 1 % Turns Test 0% 0% 13% 96% Kendall's T 94% 88% 91% 100%
5. DISCUSSION
The procedure described in Section 4 can be easily extended for higher
order of lags. The series may be arranged as
arid t,he procedures of Section 4 can be applied to the second row of (9) to Lest
t h hypot.hesis of randornucss.
This approach can also he applied in residual analysis after model fitting
to tlcterrnine if the residi~als are really i . i . tl. noise. I f t h r : tlata series is long
c11011gh. these k s t statistics, especially tlie Kendall's r , may be calculated on
several segments of the transfo~-med tlata. In this way, tlie patterns may be
identified more easily, but sinre the partition of l l ~ e serics is very subjective
Dow
nloa
ded
by [
Um
eå U
nive
rsity
Lib
rary
] at
17:
17 1
5 N
ovem
ber
2014

NOISY CHAOS IDENTIFICATION 299
and not well defined, this option will not be pursued in this paper. If an
ordering technique is provided, the identification procedure proposed in this
article can readily be extended to multivariate time series case. Our procedure
is a quantification of the popular delay plots used in data analysis.
These simulation studies used a random number generator from S-Plus.
It is worth noting that the observations from this or any random number
generator are not exactly random, but in fact are chaotic of high dimension.
The transformation procedure described in this paper is intended to iden-
tify low dimensional chaos, thus leading to a more parsimonious model for the
data. The procedure may also be used to test the performance of a "random"
number generator. If the data generated from the random number generator
could not pass our procedure, this indicates the random number generator is
of poor quality.
The simulation studies were performed using S-Plus. The source code is
available upon request.
ACKNOWLEDGEMENT
We would like to thank Drs. John Wiorkowski, Xiaobao Wang, Bartholomew
Hsi and Guanrong Chen for their comments and suggestions.
BIBLIOGRAPHY
Berliner, L. M . (1992). "Statistics, probability and chaos," Statis t ical Sczence,
7(1), 69-90.
Chan, K . S. and Tong, H. (1994). "A note on noisy chaos," Journal of the
Royal Statzstzcal Soc ie ty , S e r . B, 56(2), 301-31 1.
Cliatterjee, S . and Yilmaz, M. (1992a). "Cliaos, fractals and statistics,"
S t a l i ~ t z c a l Sc tances , 7(1), 49-68.
C:hatterjee. S. and Yilinaz, bI. (1992b). "(Jse of estimated fractal dimensio~l in
model ide~itification for time series," Journal of Stat is t ical C o m p ~ u t a t i o i ~
a ? d S t r n ~ ~ l a t r o n , 11, 129- 14 1 .
Kotz, S. and Johnson, N. L. (1983). Encyclopedia of Stntistzcal Sc iences . Vol.
4, 90'7 -30'9. LViley, New York.
Dow
nloa
ded
by [
Um
eå U
nive
rsity
Lib
rary
] at
17:
17 1
5 N
ovem
ber
2014
300 LA1 A N D HARRIST
K o t z , S. a l ~ t l ,lo1111son, N . 1,. (1086). fihcyc:lopedic~ oJ Sbnli .~tical Sciences. Vol.
7, 555-562 . Wiley, N c w York
I,ai, D. a ~ ~ d C:hen, (;, ( I C M ) . " ( : o r l l p u t i ~ l ~ t l ~ c tlist,riljution of the 1,yapluiov
I,ele, S. (1994). "Es t i rna t i~~g furlctio~is i l l cllaotic systems," Journal of the
A711erican Statistical Associatio~c, 89(42f ) , 5 12 -51 6.
Lorenz, E. N . (1963). "L)eterministic nonperiodic flows," Jour7~al of Atino-
s p h w i c S c i e r ~ c : ~ , 20, 282 293
May, R. M, (1987). "Ch;tos ar~t l the dynamics of biological populations,"
P~.o~eedz i~q.c of t h ~ Ro! j (~l Socrety, L O ~ ~ O I L , .4, 41:j. 27-44.
Rece i ved March, 1995; R e v i s e d May, 1996.
Dow
nloa
ded
by [
Um
eå U
nive
rsity
Lib
rary
] at
17:
17 1
5 N
ovem
ber
2014