a novel approach for classifying native chinese and malay
TRANSCRIPT
J Int Adv Otol 2019; 15(1): 87-93 • DOI: 10.5152/iao.2019.4553
Original Article
INTRODUCTIONThe classification of the cortical auditory-evoked potentials (CAEP) signal is difficult due to the small CAEP response amplitudes. However, research on the classification of brain electroencephalography (EEG) signals for different types of EEG signal cases has been reported in the past few years. The researches by Acharya U.R. or Guo L. or Kumar Y. or Siuly S [1-5] discussed various entropies used for an automated diagnosis of epilepsy using multiple classifiers of EEG signals. Other examples include the sleep EEG activity during hypopnoea episodes [6], the Early Detection and Classification of Dementia [7], and many other EEG signal applications [8-12]. Moreover, many systems used the auditory-evoked potentials (AEP) signal classifications process in their applications. The AEP sig-nal classifications are used in brain–computer interface (BCI) applications [13], diagnosis of hearing loss [14], etc. [15].
Furthermore, the AEP signal classifications are regarded as a clear indicator in the BCI application. However, in BCI systems, the AEP signal classification serves as an alternative to visual-evoked potentials signal classification, where the extraction of suitable features from the AEP signals combined with a classification process leads to the stimulus and non-stimulus activities being identi-
87
A Novel Approach for Classifying Native Chinese and Malay Speaking Persons According to Cortical Auditory Evoked Responses
OBJECTIVES: This study uses a new approach for classifying the human ethnicity according to the auditory brain responses (electroencephalogra-phy [EEG] signals) with a high level of accuracy. Moreover, the study presents three different algorithms used to classify the human ethnicity using auditory brain responses. The algorithms were tested on Malays and Chinese as a case study.
MATERIALS AND METHODS: The EEG signal was used as a brain response signal, which was evoked by two auditory stimuli (Tones and Conso-nant Vowels stimulus). The study was carried out on Malaysians (Malay and Chinese) with normal hearing and with hearing loss. A ranking process for the subjects’ EEG data and the nonlinear features was used to obtain the maximum classification accuracy.
RESULTS: The study formulated the classification of Normal Hearing Ethnicity Index and Sensorineural Hearing Loss Ethnicity Index. These indices classified the human ethnicity according to brain auditory responses by using numerical values of response signal features. Three classification algorithms were used to verify the human ethnicity. Support Vector Machine (SVM) classified the human ethnicity with an accuracy of 90% in the cases of normal hearing and sensorineural hearing loss (SNHL); the SVM classified with an accuracy of 84%.
CONCLUSION: The classification indices categorized or separated the human ethnicity in both hearing cases of normal hearing and SNHL with high accuracy. The SVM classifier provided a good accuracy in the classification of the auditory brain responses. The proposed indices might con-stitute valuable tools for the classification of the brain responses according to the human ethnicity.
KEYWORDS: Cortical Auditory Evoked Potentials (CAEPs), regression, support vector machine, sensorineural hearing loss, electroencephalography
Ibrahim Amer Ibrahim , Hua-Nong Ting , Mahmoud Moghavvemi Department of Electrical Engineering, University of Malaya School of Engineering, Kuala Lumpur, Malaysia (IAI, MM)Department of Biomedical Engineering, University of Malaya School of Engineering, Kuala Lumpur, Malaysia (IAI, HNT)Department of Biomedical Engineering, University of Baghdad Al-Khwarizmi School of Engineering, Baghdad, Iraq (IAI)Center of Research in Applied Electronics (CRAE), University of Malaya School of Engineering, Kuala Lumpur, Malaysia (IAI, MM)University of Science and Culture, Tehran, Iran (MM)
Corresponding Author: Mahmoud Moghavvemi E-mail: [email protected]
Submitted: 12.09.2017 • Revision Received: 27.08.2018 • Accepted: 28.09.2018 • Available Online Date: 06.03.2019Available online at www.advancedotology.org
ORCID IDs of the authors: I.A.I. 0000-0002-8011-5005; H.N.T. 0000-0001-6295-1651; M.M. 0000-0001-6447-4203.
Cite this article as: Ibrahim AI, Ting HN, Moghavvemi M. A Novel Approach for Classifying Native Chinese and Malay Speaking Persons According to Cortical Auditory Evoked Responses. J Int Adv Otol 2019; 15(1): 87-93.
This study was presented at the University of Malaya, 01.09.2017, Kuala Lumpur, Malaysia.
Content of this journal is licensed under aCreative Commons Attribution-NonCommercial
4.0 International License.

fied alongside other hearing control activities [13, 16, 17]. Shangkai [13] re-viewed the challenges in AEP signals processing of BCI systems. The classification of biomedical signals using an index is rarely reported in previous studies, particularly in cases using EEG signals. To date, some studies formulated biomedical indices in different biomedi-cal issues that exclude the EEG signals. Dhanjoo in 2009 developed a new concept of a non-dimensional physiological index (NDPI) [18]. It is made up of several parameters characterizing organ function/dysfunction, a physiological system function and disorder, and an an-atomical structure’s property and pathology in the format of a med-ical assessment test; the NDPI combines these parameters into one non-dimensional number.
This study aimed to identify the human ethnicity based on the EEG (CAEP) signals that were recorded from Malay and Chinese subjects. For verification of this aim, we used two separated CAEP signals that were recorded from subjects with different hearing abilities. The af-finity to one of two native language groups was investigated for nor-mal hearing subjects and sensorineural hearing loss (SNHL) patients. This case study separated the EEG (CAEP) signals according to two human ethnicity groups, the Malay and Chinese. The study formulat-ed classification indices (Normal Hearing Ethnicity Index [NHEI] and Sensorineural Hearing Loss Ethnicity Index [SNHLEI]) for separating the CAEP signals recorded from Malay and Chinese subjects with and without normal hearing abilities. These classification indices catego-rize affiliation to a native language group based on features derived from CAEP.
The CAEP classifications may be useful in hearing and language re-habilitation for patients on whom the normal hearing test pure tone audiometry (PTA) cannot be performed reliably (e.g., infants, chil-dren, and difficult-to-test patients). The lack of hearing screening tests at an early age will impede speech, language, and cognitive development [14]. Moreover, the existing ethnic disparities in audito-
ry health care represent critical areas for research and intervention. Studies have indicated unique factors in hearing loss across ethnici-ties. Therefore, this type of ethnicity classification may help develop or design better hearing aids by detecting the original ethnicity of the patients [14, 19], similar to its use in BCI systems [13], and distinguish the age of infants [15]. The present article is organized in the follow-ing order. Section 1 introduces the subject. Section 2 will explain the methodology involved in this work. Section 3 will describe the EEG data analysis for the experiment, while Sections 4 and 5 will detail and discuss the results. Section 6 concludes the entire work.
MATERIALS AND METHODSIn this study, we collected, cleaned, decomposed, and extracted fea-tures and classified the EEG AEP signals. The proposed methodology is shown in Figure 1.
Participants/SubjectsThe study was conducted on two ethnicity groups (Malays and Chi-nese). An ethnicity group is a category of people who identify with each other based on a certain common ancestral, language, society, culture, or nation. All participants involved in this study were tested by the Otorhinolaryngology (ENT) department using the routine PTA measurement. The groups are described as follows:
1- Ten adult right-handed Malay males (mean age=23.5 years, stan-dard deviation [SD]=2.52) and 10 adult righthanded Chinese males (mean age=22.5 years, SD=1.55). The ENT department confirmed that all the subjects had a normal range of PTA response.
2- Seven adult right-handed Malay male patients suffering hearing loss (HL; fluent Malay speakers) who were 3550 years old and had bi-lateral SNHL for more than 6 months with no history of using hearing aids (mean age=41.7 years, SD=4.643) and seven adult right-handed Chinese male patients with HL (fluent Chinese speakers) aged 35-50 years and having bilateral SNHL for more than 6 months with no his-tory of hearing aids usage (mean age=43.1 years, SD=2.63). The ENT department confirmed that all patients had SNHL in the moderate range according to their pure tone audiogram.
The experimental protocols were approved by the Medical Ethics Committee (IRB Reference Number: 1045.22). Each participant pro-vided written consent prior to the experiments. The normal hearing and the SNHL patients were recruited from the local population. The subjects participating in this study were healthy normal hear-ing persons with no history of otological, psychological, or neuro-logical complications (fluent Malay speakers) according to the ENT hospital department reports. All SNHL patients who participated in this work had no history of hearing aids usage. The study examined participant’s EEG recordings. However, not all data could be used in the analysis because of several reasons. Certain subjects’ recordings had artifacts, noise, recording calibration, and device setting prob-lems. The study selected the recorded signals of the subjects that had clean recordings and free of artifacts. Table (1) shows the PTA results for all the subjects participating in this work. The values listed were the average reading for 1 kHz, 2 kHz, and 4 kHz presented in decibels. Most of the SNHL patients had HL for a long time, since their child-hood. Moreover, most of them specified the reasons for their HL as illness.
88
J Int Adv Otol 2019; 15(1): 87-93
Figure 1. Proposed analysis.
DECOMPOSITIONMETHODS
FEATURE EXTRACTION
SAMPLE, APPROXI-MATE, &
KOLMOGOROV ENTROPY
RANKING
CLASSIFICATION METHODS
FEATURE EXTRACTIONSAMPLE, APPROXIMATE, &KOLMOGOROV ENTROPY
RANKING
CLASIFFICATION INDICES
EEG recorded ElectrodesFz, Cz, Pz, &
C3
Cleaning byEMD
StimuliThe study consisted of two disparate types of auditory stimuli: pure tone frequency bursts (1 kHz versus 4 kHz) and speech conso-nant-vowel (CV) transitions (/ba/ versus /da/), presented at ~85-90 dB sound pressure level (SPL). The tone stimulus lasted for 200 ms and was generated by a software program in MATLAB R2013b (www.
mathworks.com), with a fall time of 10 ms and a plateau time of 190 ms and represented at two different frequencies of 1000 Hz and 4000 Hz tone stimuli [20].
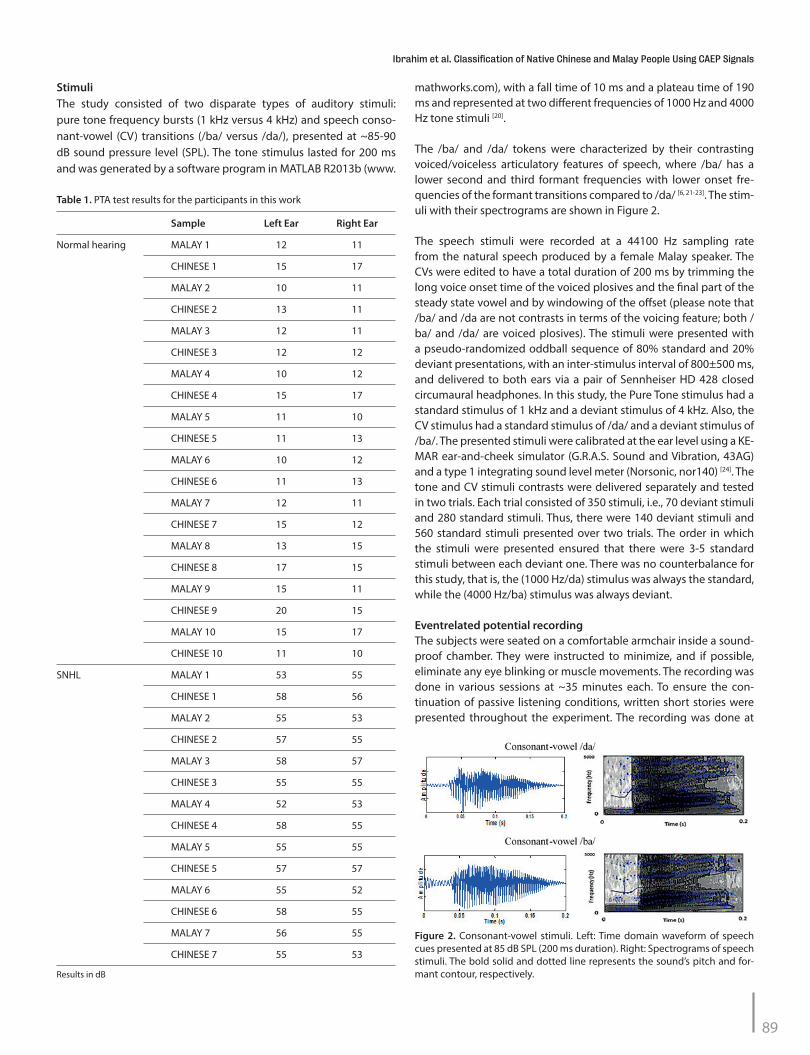
The /ba/ and /da/ tokens were characterized by their contrasting voiced/voiceless articulatory features of speech, where /ba/ has a lower second and third formant frequencies with lower onset fre-quencies of the formant transitions compared to /da/ [6, 21-23]. The stim-uli with their spectrograms are shown in Figure 2.
The speech stimuli were recorded at a 44100 Hz sampling rate from the natural speech produced by a female Malay speaker. The CVs were edited to have a total duration of 200 ms by trimming the long voice onset time of the voiced plosives and the final part of the steady state vowel and by windowing of the offset (please note that /ba/ and /da are not contrasts in terms of the voicing feature; both /ba/ and /da/ are voiced plosives). The stimuli were presented with a pseudo-randomized oddball sequence of 80% standard and 20% deviant presentations, with an inter-stimulus interval of 800±500 ms, and delivered to both ears via a pair of Sennheiser HD 428 closed circumaural headphones. In this study, the Pure Tone stimulus had a standard stimulus of 1 kHz and a deviant stimulus of 4 kHz. Also, the CV stimulus had a standard stimulus of /da/ and a deviant stimulus of /ba/. The presented stimuli were calibrated at the ear level using a KE-MAR ear-and-cheek simulator (G.R.A.S. Sound and Vibration, 43AG) and a type 1 integrating sound level meter (Norsonic, nor140) [24]. The tone and CV stimuli contrasts were delivered separately and tested in two trials. Each trial consisted of 350 stimuli, i.e., 70 deviant stimuli and 280 standard stimuli. Thus, there were 140 deviant stimuli and 560 standard stimuli presented over two trials. The order in which the stimuli were presented ensured that there were 3-5 standard stimuli between each deviant one. There was no counterbalance for this study, that is, the (1000 Hz/da) stimulus was always the standard, while the (4000 Hz/ba) stimulus was always deviant.
Eventrelated potential recording The subjects were seated on a comfortable armchair inside a sound-proof chamber. They were instructed to minimize, and if possible, eliminate any eye blinking or muscle movements. The recording was done in various sessions at ~35 minutes each. To ensure the con-tinuation of passive listening conditions, written short stories were presented throughout the experiment. The recording was done at
89
Ibrahim et al. Classification of Native Chinese and Malay People Using CAEP Signals
Table 1. PTA test results for the participants in this work
Sample Left Ear Right Ear
Normal hearing MALAY 1 12 11
CHINESE 1 15 17
MALAY 2 10 11
CHINESE 2 13 11
MALAY 3 12 11
CHINESE 3 12 12
MALAY 4 10 12
CHINESE 4 15 17
MALAY 5 11 10
CHINESE 5 11 13
MALAY 6 10 12
CHINESE 6 11 13
MALAY 7 12 11
CHINESE 7 15 12
MALAY 8 13 15
CHINESE 8 17 15
MALAY 9 15 11
CHINESE 9 20 15
MALAY 10 15 17
CHINESE 10 11 10
SNHL MALAY 1 53 55
CHINESE 1 58 56
MALAY 2 55 53
CHINESE 2 57 55
MALAY 3 58 57
CHINESE 3 55 55
MALAY 4 52 53
CHINESE 4 58 55
MALAY 5 55 55
CHINESE 5 57 57
MALAY 6 55 52
CHINESE 6 58 55
MALAY 7 56 55
CHINESE 7 55 53
Results in dB
Figure 2. Consonant-vowel stimuli. Left: Time domain waveform of speech cues presented at 85 dB SPL (200 ms duration). Right: Spectrograms of speech stimuli. The bold solid and dotted line represents the sound’s pitch and for-mant contour, respectively.
500 Hz sampling rate using the wireless Enobio EEG/eventrelated potential (ERP) acquisition system Enobio NE [25]. Data were recorded from four silver (Ag)/silver chloride (AgCl) electrodes mounted on a Neoprene EEG cap and located over the following scalp sites: three electrodes were located on the midline of the head: Fz, Cz, and Pz, and a fourth electrode was located on left-hand side of the scalp, C3 (according to the modified International 10-20 system). The record-ing device Enobio EEG/ERP provided an online filter, consisting of a band pass filter, with pass band (2 Hz-40 Hz) second order Butter-worth Finite Impulse Response (FIR).
Component Analysis After ERP data collection, the responses went through pre-process-ing to correlate the baseline drift and were filtered offline at 2-30 Hz using second order the Butterworth FIR band pass filter. The av-eraged trials were taken from successful runs that were free from artifacts, noises, and clearly evoked the auditory ERP signals. This averaging process was separately done for each used electrode. However, the standard average responses excluded responses to the stimulus occurring immediately after the deviant stimulus and vice versa for the deviant average response. The raw averaged EEG AEP signals were de-noised by the empirical mode decompo-sition (EMD) technique [26]. The EMD technique provided a simple, fast, and efficient artifact cleaning tool [27]. EMD de-noising could eliminate noises even if combined with the original data. The crite-ria used to determine ERP response presence or absence were (1) using visual inspection where the ERP is present if individual ERP peaks were larger than the level of the pre-stimulus baseline and (2) using ERP analysis included baseline-to-peak amplitude and la-tency comparison with a typical standard ERP waveform described elsewhere [28-30].
Segmentation of CAEP signals The averaged CAEP signals were segmented individually into time segments per the CAEP latencies components, with P1 (latency win-dow 20-100 ms), N1 (latency window 60-160 ms), P2 (latency win-dow 140-240 ms), N2 (latency window 160-300 ms), and P3 (latency window 240-420 ms) [21]. The latencies were visually obtained using automated latency detection algorithms. This was done separately for each stimulus responses.
Feature extractionTo extract the features from the averaged CAEP data, non-linear fea-ture extraction methods were used in this work, such as Kolmogor-ov–Sinai entropy (KolmogEnt.), Sample Entropy (SampleEnt.), and Approximate Entropy (ApproxEnt.). This was because brain neurons are controlled by nonlinear phenomena, such as the threshold and saturation processes.
ClassificationThe learning classifier is an algorithm that combines features and classes. The Support Vector Machine (SVM), Knearest neighbor (KNN), and Linear Discriminate Analysis (LDA) were the classifiers used in this work [31-33]. A feature extraction method, including Sample Entro-py, Approximate Entropy, and Kolmogorov Entropy, was applied to the EEG signals in the time domain. These features were non-linear [1]. The classifier’s performance was determined using the performance parameter (accuracy), defined as:
𝐴𝐴𝐴𝐴𝐴𝐴𝐴𝐴𝐴𝐴𝐴𝐴𝐴𝐴𝐴𝐴 =𝑁𝑁𝐴𝐴𝑁𝑁𝑁𝑁𝑁𝑁𝐴𝐴 𝑜𝑜𝑜𝑜 𝐴𝐴𝑜𝑜𝐴𝐴𝐴𝐴𝑁𝑁𝐴𝐴𝑟𝑟𝑟𝑟𝐴𝐴 𝐴𝐴𝑟𝑟𝐴𝐴𝑐𝑐𝑐𝑐𝑐𝑐𝑜𝑜𝑐𝑐𝑁𝑁𝑐𝑐 𝑜𝑜𝑁𝑁𝑐𝑐𝑁𝑁𝐴𝐴𝑜𝑜𝐴𝐴𝑟𝑟𝑐𝑐𝑜𝑜𝑜𝑜
𝑁𝑁𝐴𝐴𝑁𝑁𝑁𝑁𝑁𝑁𝐴𝐴 𝑜𝑜𝑜𝑜 𝑟𝑟𝑜𝑜𝑟𝑟𝐴𝐴𝑟𝑟 𝑜𝑜𝑁𝑁𝑐𝑐𝑁𝑁𝐴𝐴𝑜𝑜𝐴𝐴𝑟𝑟𝑐𝑐𝑜𝑜𝑜𝑜 (1)
Formulation of classification indices for classifying the human ethnicity To accurately decide on a system that uses classification in its pro-cess, a very accurate classifier is needed. However, it is not as straight-forward as it seems. It is more convenient for researchers to use a sin-gle integrated index that is significantly different in the two classes (accuracy 100%). This concept of the integrated index was conceived and advanced by Acharya [34].
Based on that fact, we formulated integrated indices, which could be defined as the NHEI and SNHL Ethnicity Index (SNHLEI). The NHEI was formulated using non-linear features constructed from the auditory brain responses evoked by the Pure Tone and CV stimulus. Similarly, the (SNHLEI) index was formulated using the non-linear features con-structed from the auditory brain responses evoked by Pure Tone and CV stimulus. This consolidated index was formulated to produce val-ues that are significantly different in different ethnicity SNHL patients.
RESULTSIn this study, the experiments were conducted and the results col-lected. Only the Cz electrode data were selected for further process and analysis, as it was most significant toward CAEP waveform in re-sponse to auditory stimuli. Furthermore, this electrode demonstrates the highest signal-to-noise ratio as opposed to other electrodes [35].
A cross validation method was used to determine the trained and tested sets. The cross-validation process could be done via multiple approaches (i.e. K-fold cross validation, Holdout validation, etc.). This study used K-fold cross validation, with k=4. This will use 75% of the data in the classification matrix to develop an automated system and obtain features used to train the classifier, while 25% were used to test the classifier performances. Training and testing were conducted four times, and the classification accuracy was averaged over 4 trials.
Cross-validation was used to define a dataset to “test” the model in the training phase (i.e., the validation dataset) for limiting problems of over fitting. The fitting process optimizes the model parameters to make the model fit the training data as well as possible [36].
Classification of the Human Ethnicity
Classification of normal hearing subjects ethnicityThe feature matrix formed and generated by the successful features extracted from the non-linear feature methods was (240 samples×5 intervals) elements. This matrix contains four types of stimuli (1 kHz, 4 kHz, da, and ba) and three features (KolmogEnt., SampleEnt., and Ap-proxEnt.) with the number of participated subjects (normal hearing sub-jects group contains 10 for Malay and 10 for Chinese subjects) multiplied by five-fold of CAEP responses intervals of the P1, N1, P2, N2, and P3. Therefore, the classification matrix consists of 240 samples×5 intervals elements using the four-fold cross validation. The training matrix was 180×5, while the test matrix was 60×5. This will be used to evaluate clas-sification performance. The sets of segmented EEG CAEP signals with its features were classified using SVM with Radial Basis Function (RBF) ker-nel and LDA, KNN with k=1 classifiers for both cross-validation methods.
90
J Int Adv Otol 2019; 15(1): 87-93

Thus, we used Eq. (1) to obtain the classification performance parameter (accuracy) for all used classifiers. Table 2 lists the performance parame-ters for classification of the (NH Malay and Chinese subjects) groups due to their auditory brain responses evoked by the auditory stimulus.
Classification of SNHL patients’ ethnicityAs per the explanations in previous section, the feature matrix formed and generated by the successful features extracted from the non-linear feature methods was 168 samples×5 intervals elements. This matrix contains four types of stimuli (1 kHz, 4 kHz, da, and ba) and three fea-tures (KolmogEnt., SampleEnt., and ApproxEnt.), with the number of participating subjects (SNHL patients group contains 7 for Malay and 7 for Chinese patients) multiplied by five-fold of CAEP responses intervals. The classification matrix consists of 168 samples×5 intervals elements using the four-fold cross validation. The training matrix was 126×5, while the test matrix was 42×5. This was used to evaluate classification perfor-mance. Table 3 lists the performance parameters for classification of the (SNHL Malay and Chinese patients) groups due to their auditory brain responses evoked by the auditory stimulus.
Formulation of the human ethnicity classification indices
NHEIThe NHEI is developed by ranking the non-linear features extracted from the auditory brain responses evoked by the auditory stimulus. These features were then used to develop an optimally distinguish-ing index. Therefore, the mathematical formulation of this integrated NHEI is mentioned below:
NHEI=47.918-124.430×SampleEnt.-327.347×ApproxEnt.+264.306×KolmogEnt. (2)
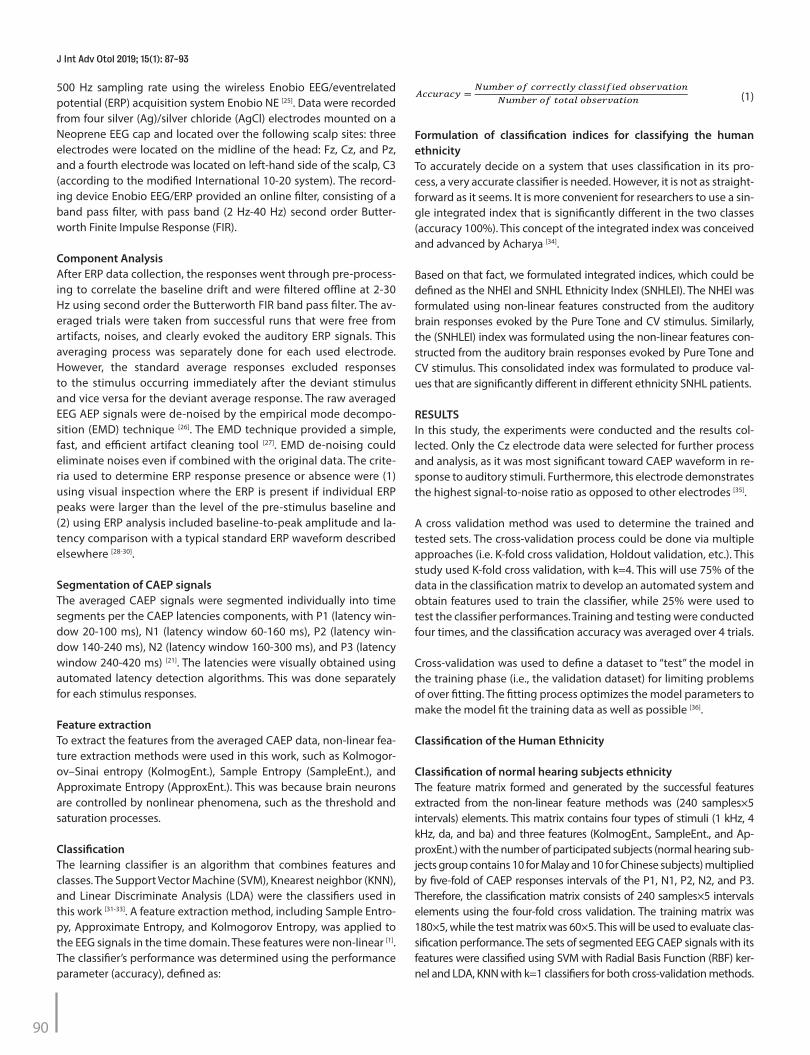
Eq. (2) is derived using linear regression analysis through the “least squares” method to fit a linear equation to a set of classified data for maximizing the discrimination between the two classes, wherein the nonlinear features were first ranked from the least significant, which is the SampleEnt., as the first variable in the equation fol-lowed by ApproxEnt. And KolmogEnt as the second and highest significant variables, respectively. All feature values were sorted in a descending order (from largest to smallest) for each stimulus (1 kHz, 4 kHz, da, and ba) individually. The range of the NHEI is shown in Table 4. Figure 3 shows the plot of NHEI for the two classes of the human ethnicity.
SNHLEILike the approach reported in previous section, the SNHLEI is devel-oped by ranking the non-linear features extracted from the audito-ry brain responses evoked by the auditory stimulus. These features were then used to develop an optimally distinguishing index. There-fore, the mathematical formulation of this integrated SNHLEI is:
SNHLEI=36.280-372.516×SampleEnt.+197.703×ApproxEnt.+22.648×KolmogEnt. (3)
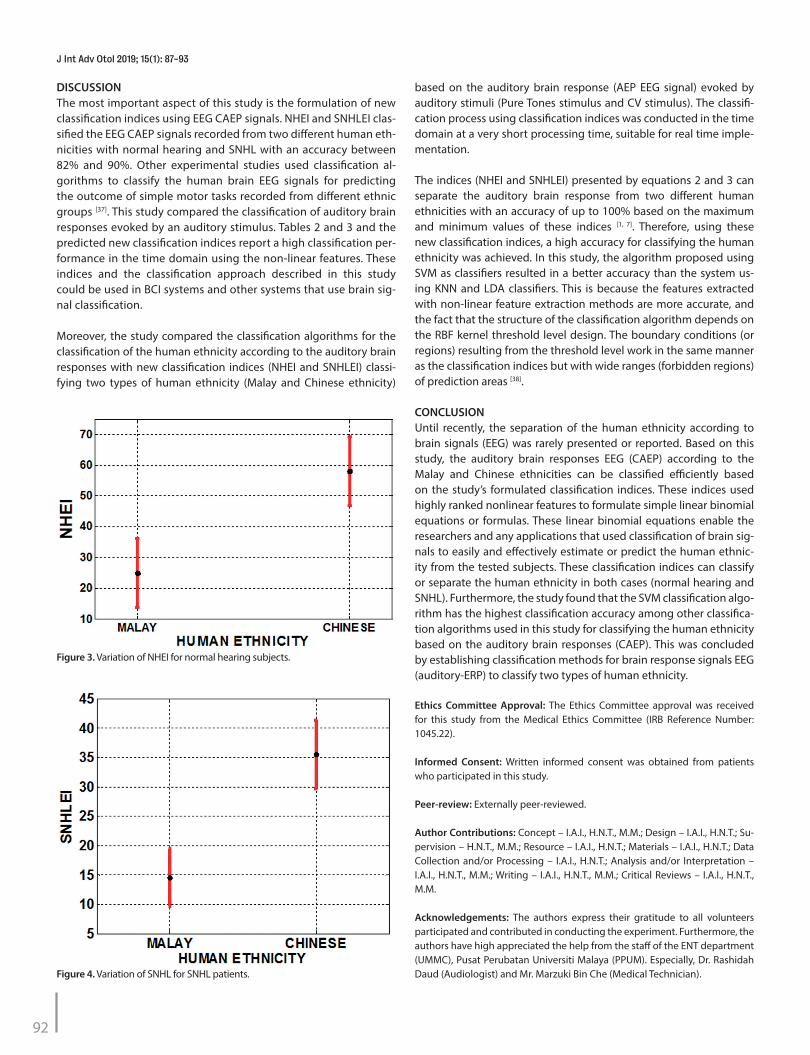
Eq. (3) is derived using linear regression analysis through the same procedure as in previous section. The range of the NHEI is shown in Table 5. Figure 4 shows the plot of SNHLEI for the two classes of the human ethnicity.
91
Ibrahim et al. Classification of Native Chinese and Malay People Using CAEP Signals
Table 3. Performance parameter of classifiers for SNHL patients
Performance
Classified as
Classifier Parameters Sample Malay Chinese
KNN Malay 70 14
Chinese 16 68
Accuracy 138/168=0.8214
SVM Malay 72 12
Chinese 14 70
Accuracy 142/168=0.8452
LDA Malay 70 14
Chinese 15 69
Accuracy 139/168=0.82738
KNN: K-Nearest Neighbor; SVM: Support Vector Machine; LDA: Linear Discriminate Analysis
Table 2. The performance parameter of classifiers for normal hearing subjects
Performance
Classified as
Classifier Parameters Sample Malay Chinese
KNN Malay 106 14
Chinese 15 105
Accuracy 211/240=0.8791
SVM Malay 109 11
Chinese 13 107
Accuracy 216/240=0.9000
LDA Malay 104 16
Chinese 16 104
Accuracy 208/240=0.8666
KNN: K-Nearest Neighbor; SVM: Support Vector Machine; LDA: Linear Discriminate Analysis
Table 4. Range of NHEI for normal hearing subjects
Brain response to Malay Chinese
Average* 24.9386 58.0614
SD 11.1357 11.2408
Max. 38.85 75.52
Min. 9.15 42.46
SD: Standard Deviation *Data set=10 subjects×4 stimulus for each ethnicity
Table 5. Range of SNHLEI for SNHL patients
Brain response to Malay Chinese
Average* 14.5177 35.5164
SD 4.8503 5.8415
Max. 21.13 46.75
Min. 11.82 27.68
SD: standard deviation *Data set=7 subjects×4 stimulus for each ethnicity
DISCUSSIONThe most important aspect of this study is the formulation of new classification indices using EEG CAEP signals. NHEI and SNHLEI clas-sified the EEG CAEP signals recorded from two different human eth-nicities with normal hearing and SNHL with an accuracy between 82% and 90%. Other experimental studies used classification al-gorithms to classify the human brain EEG signals for predicting the outcome of simple motor tasks recorded from different ethnic groups [37]. This study compared the classification of auditory brain responses evoked by an auditory stimulus. Tables 2 and 3 and the predicted new classification indices report a high classification per-formance in the time domain using the non-linear features. These indices and the classification approach described in this study could be used in BCI systems and other systems that use brain sig-nal classification.
Moreover, the study compared the classification algorithms for the classification of the human ethnicity according to the auditory brain responses with new classification indices (NHEI and SNHLEI) classi-fying two types of human ethnicity (Malay and Chinese ethnicity)
based on the auditory brain response (AEP EEG signal) evoked by auditory stimuli (Pure Tones stimulus and CV stimulus). The classifi-cation process using classification indices was conducted in the time domain at a very short processing time, suitable for real time imple-mentation.
The indices (NHEI and SNHLEI) presented by equations 2 and 3 can separate the auditory brain response from two different human ethnicities with an accuracy of up to 100% based on the maximum and minimum values of these indices [1, 7]. Therefore, using these new classification indices, a high accuracy for classifying the human ethnicity was achieved. In this study, the algorithm proposed using SVM as classifiers resulted in a better accuracy than the system us-ing KNN and LDA classifiers. This is because the features extracted with non-linear feature extraction methods are more accurate, and the fact that the structure of the classification algorithm depends on the RBF kernel threshold level design. The boundary conditions (or regions) resulting from the threshold level work in the same manner as the classification indices but with wide ranges (forbidden regions) of prediction areas [38].
CONCLUSIONUntil recently, the separation of the human ethnicity according to brain signals (EEG) was rarely presented or reported. Based on this study, the auditory brain responses EEG (CAEP) according to the Malay and Chinese ethnicities can be classified efficiently based on the study’s formulated classification indices. These indices used highly ranked nonlinear features to formulate simple linear binomial equations or formulas. These linear binomial equations enable the researchers and any applications that used classification of brain sig-nals to easily and effectively estimate or predict the human ethnic-ity from the tested subjects. These classification indices can classify or separate the human ethnicity in both cases (normal hearing and SNHL). Furthermore, the study found that the SVM classification algo-rithm has the highest classification accuracy among other classifica-tion algorithms used in this study for classifying the human ethnicity based on the auditory brain responses (CAEP). This was concluded by establishing classification methods for brain response signals EEG (auditory-ERP) to classify two types of human ethnicity.
Ethics Committee Approval: The Ethics Committee approval was received for this study from the Medical Ethics Committee (IRB Reference Number: 1045.22).
Informed Consent: Written informed consent was obtained from patients who participated in this study.
Peer-review: Externally peer-reviewed.
Author Contributions: Concept – I.A.I., H.N.T., M.M.; Design – I.A.I., H.N.T.; Su-pervision – H.N.T., M.M.; Resource – I.A.I., H.N.T.; Materials – I.A.I., H.N.T.; Data Collection and/or Processing – I.A.I., H.N.T.; Analysis and/or Interpretation – I.A.I., H.N.T., M.M.; Writing – I.A.I., H.N.T., M.M.; Critical Reviews – I.A.I., H.N.T., M.M.
Acknowledgements: The authors express their gratitude to all volunteers participated and contributed in conducting the experiment. Furthermore, the authors have high appreciated the help from the staff of the ENT department (UMMC), Pusat Perubatan Universiti Malaya (PPUM). Especially, Dr. Rashidah Daud (Audiologist) and Mr. Marzuki Bin Che (Medical Technician).
92
J Int Adv Otol 2019; 15(1): 87-93
Figure 4. Variation of SNHL for SNHL patients.
Figure 3. Variation of NHEI for normal hearing subjects.
Conflict of Interest: The authors have no conflicts of interest to declare.
Financial Disclosure: This research was funded by the University Malaya Re-search center with Grant No. UMRG RP016D-13AET.
REFERENCES1. Acharya UR, Fujita H, Sudarshan VK, Bhat S, Koh JE. Application of en-
tropies for automated diagnosis of epilepsy using EEG signals: A review. Knowl-Based Syst 2015; 88: 85-96. [CrossRef ]
2. Acharya UR, Molinari F, Sree SV, Chattopadhyay S, Ng KH, Suri JS. Auto-mated diagnosis of epileptic EEG using entropies. Biomed Signal Process Control 2012; 7: 401-8. [CrossRef ]
3. Guo L, Rivero D, Dorado J, Munteanu CR, Pazos A. Automatic feature extraction using genetic programming: An application to epileptic EEG classification. Expert Syst Appl 2011; 38: 10425-36. [CrossRef ]
4. Kumar Y, Dewal M, Anand R. Epileptic seizures detection in EEG using DWT-based ApEn and artificial neural network. Signal Image Video P 2014; 8: 1323-34. [CrossRef ]
5. Siuly S, Li Y. Designing a robust feature extraction method based on opti-mum allocation and principal component analysis for epileptic EEG sig-nal classification. Comput Methods Programs Biomed 2015; 119: 29-42. [CrossRef ]
6. Zoubek L, Charbonnier S, Lesecq S, Buguet A, Chapotot F. Feature se-lection for sleep/wake stages classification using data driven methods. Biomed Signal Process Control 2007; 2: 171-9. [CrossRef ]
7. Al-Qazzaz NK, Ali SHB, Ahmad SA, Chellappan K, Islam MS, Escudero J. Role of EEG as biomarker in the early detection and classification of de-mentia. ScientificWorldJournal 2014; 2014: 906038 [CrossRef ]
8. Amin HU, Malik AS, Ahmad RF, Badruddin N, Kamel N, Hussain M, et al. Feature extraction and classification for EEG signals using wavelet trans-form and machine learning techniques. Australas Phys Eng Sci Med 2015; 38: 139-49. [CrossRef ]
9. Li Y, Wen PP. Clustering technique-based least square support vector ma-chine for EEG signal classification. Comput Methods Programs Biomed 2011; 104: 358-72. [CrossRef ]
10. Lin YP, Wang CH, Wu TL, Jeng SK, Chen JH, editors. EEG-based emotion recognition in music listening: A comparison of schemes for multiclass support vector machine. Acoustics, Speech and Signal Processing, 2009 ICASSP 2009 IEEE International Conference on; 2009: IEEE.
11. Zhang Y, Zhang Y, Wang J, Zheng X. Comparison of classification meth-ods on EEG signals based on wavelet packet decomposition. Neural Comput Appl 2015: 26: 1217-25. [CrossRef ]
12. Zhiwei L, Minfen S, editors. Classification of mental task EEG signals us-ing wavelet packet entropy and SVM. Electronic Measurement and In-struments, 2007 ICEMI’07 8th International Conference on; 2007: IEEE. [CrossRef ]
13. Gao S, Wang Y, Gao X, Hong B. Visual and auditory brain–computer inter-faces. IEEE Trans Biomed Eng 2014; 61: 1436-47. [CrossRef ]
14. Sriraam N. EEG based automated detection of auditory loss: A pilot study. Expert Syst Appl 2012; 39: 723-31. [CrossRef ]
15. Ravan M, Reilly JP, Trainor LJ, Khodayari-Rostamabad A. A machine learn-ing approach for distinguishing age of infants using auditory evoked potentials. Clin Neurophysiol 2011; 122: 2139-50. [CrossRef ]
16. Higashi H, Rutkowski TM, Washizawa Y, Cichocki A, Tanaka T, editors. EEG auditory steady state responses classification for the novel BCI. 2011 An-nual International Conference of the IEEE Engineering in Medicine and Biology Society; 2011: IEEE.
17. Kim DW, Hwang HJ, Lim JH, Lee YH, Jung KY, Im CH. Classification of se-lective attention to auditory stimuli: toward vision-free brain–computer interfacing. J Neurosci Methods 2011; 197: 180-5. [CrossRef ]
18. Ghista DN. Nondimensional physiological indices for medical assess-ment. J Mech Med Biol 2009; 9: 643-69. [CrossRef ]
19. Nieman CL, Marrone N, Szanton SL, Thorpe Jr RJ, Lin FR. Racial/ethnic and socioeconomic disparities in hearing health care among older Americans. J Aging Health 2016; 28: 68-94. [CrossRef ]
20. Alain C, Roye A, Arnott SR. Middle-and long-latency auditory evoked potentials: what are they telling us on central auditory disorders. Disor-ders of Peripheral and Central Auditory Processing: Handbook of Clinical Neurophysiology, Edition: vol 10, Publisher: Elsevier, Editors: G.G. Celesia, 2013; pp.177-99.
21. Oates PA, Kurtzberg D, Stapells DR. Effects of sensorineural hearing loss on cortical event-related potential and behavioral measures of speech-sound processing. Ear Hear 2002; 23: 399-415. [CrossRef ]
22. Klatt DH. Software for a cascade/parallel formant synthesizer. J Acoust Soc Am 1980; 67: 971-95. [CrossRef ]
23. Raz I, Noffsinger D. Identification of synthetic, voiced stop-consonants by hearing-impaired listeners. Audiology 1985; 24: 437-48. [CrossRef ]
24. Sulaiman AH, Husain R, Seluakumaran K. Hearing Risk among Young Per-sonal Listening Device Users: Effects at High-Frequency and Extended High-Frequency Audiogram Thresholds. J Int Adv Otol 2015; 11: 104-9. [CrossRef ]
25. Barcelona N. Neuroelectric’s Wiki. 2015. Available from: http://wiki.neu-roelectrics.com/index.php/Neuroelectric%27s_Wiki.
26. Blanco-Velasco M, Weng B, Barner KE. ECG signal denoising and baseline wander correction based on the empirical mode decomposition. Com-put Biol Med. 2008; 38: 1-13. [CrossRef ]
27. Ibrahim IA, Santhosh J, Moghavvemi M, editors. A New Approach for an Effective Eye Movement Artifact Elimination from EEG Signal. IEEE Inter-national Conference on Signal and Image Processing Applications (ICSI-PA) 2015; 2015; Malaysia: IEEE [CrossRef ]
28. Näätänen R. Attention and brain function: Psychology Press; 1992.29. McPherson DL, Ballachanda B, Kaf W. Middle and long latency auditory
evoked potentials. Audiology Diagnosis New York: Ed Thieme. 2000: 471-501.
30. Davies PL, Chang WP, Gavin WJ. Middle and late latency ERP components discriminate between adults, typical children, and children with sensory processing disorders. Front Integr Neurosci 2010; 4: 16. [CrossRef ]
31. Lotte F, Congedo M, Lécuyer A, Lamarche F. A review of classification al-gorithms for EEG-based brain–computer interfaces. J Neural Eng 2007; 4: R1-R13. [CrossRef ]
32. Polat K, Güneş S. Classification of epileptiform EEG using a hybrid system based on decision tree classifier and fast Fourier transform. Appl Math Comput 2007; 187: 1017-26. [CrossRef ]
33. Chen J, Huang H, Tian S, Qu Y. Feature selection for text classification with Naïve Bayes. Expert Syst Appl 2009; 36: 5432-5. [CrossRef ]
34. Acharya UR, Fujita H, Sudarshan VK, Sree VS, Eugene LMJ, Ghista DN, et al. An integrated index for detection of sudden cardiac death using dis-crete wavelet transform and nonlinear features. Knowl Based Syst 2015; 83: 149-58. [CrossRef ]
35. Schröder A, van Diepen R, Mazaheri A, Petropoulos-Petalas D, Soto de Amesti V, Vulink N, et al. Diminished n1 auditory evoked potentials to oddball stimuli in misophonia patients. Front Behav Neurosci 2014; 8: 123.
36. Moore AW. Cross-validation for detecting and preventing overfitting. School of Computer Science Carneigie Mellon University. 2001.
37. Koldovsky Z, Phan AH, Tichavsky P, Cichocki A, editors. A treatment of EEG data by underdetermined blind source separation for motor imag-ery classification. Signal Processing Conference (EUSIPCO), 2012 Pro-ceedings of the 20th European; 2012: IEEE.
38. Scholkopf B, Smola AJ. Learning with kernels: support vector machines, regularization, optimization, and beyond: MIT press; 2001.
93
Ibrahim et al. Classification of Native Chinese and Malay People Using CAEP Signals