a novel method for quantification of lactose in different
TRANSCRIPT

A novel method for quantification of lactose in different
mammalian milk through HPTLC & determination by Mass Spectrometric technique
Journal: Analytical Methods
Manuscript ID: AY-ART-03-2014-000625.R2
Article Type: Paper
Date Submitted by the Author: 09-Jun-2014
Complete List of Authors: Srivastava, Amit; National Botanical Research Institute, Pharmacognosy&
ethnopharmacology division; University of Lucknow, Chemistry Department Tripathi, Rama; Sanjay Gandhi Post Graduate Institute of Medical Sciences, Nephrology Department Verma, Shikhar; CSIR-National Botanical Research Institute, Pharmacognosy and Ethnopharmacology Division Srivastava, Nishi; CSIR-National Botanical Research Institute, Pharmacognosy and Ethnopharmacology Division Rawat, A.K.S.; National Botanical Research Institute, Pharmacognosy and Ethnopharmacology Division Deepak, Desh; Lucknow University, Chemistry Department
Analytical Methods

A novel method for quantification of lactose in different mammalian milk through HPTLC
& determination by Mass Spectrometric technique
Amit Srivastava1,3
*, Rama Tripathi 2
, Shikhar Verma 3, Nishi Srivastava
3, A.K.S.Rawat
3, Desh
Deepak1*
1Chemistry Department, Lucknow University, Lucknow 226003, India
2Department of Nephrology, Sanjay Gandhi Post Graduate Institute of Medical Sciences,
Lucknow, India-226016 3Pharmacognosy and Ethnopharmacology Division,
CSIR-National Botanical Research Institute, Lucknow-226001, India
*Corresponding authors:
Dr. Amit Srivastava
Chemistry Department,
Lucknow University, Lucknow, India
Ph-+919454702060, *E- mail: [email protected]
Dr. Desh Deepak
Chemistry Department,
Lucknow University, Lucknow, India
*E-mail: [email protected]@gmail.com
Page 1 of 23 Analytical Methods
123456789101112131415161718192021222324252627282930313233343536373839404142434445464748495051525354555657585960

Abstract
Lactose molecules are chemically disaccharide and basic core unit of sugars (oligosaccharides)
which is enrich in mammalian milk. Lactose plays multiple roles in the health of the neonates,
by stimulating growth of selected beneficial bacteria in the gut, participating in development and
growth of new born. All mammalians produces lactose with oligosaccharides (LOS) in different
concentration during their lactation period. In this study we presenting a novel high-performance
thin-layer chromatography (HPTLC) method for estimation of lactose concentration present in
milk of different mammalian viz: Indian mare (Equus caballus), Cow (Bos primigenius indicus),
Buffalo (Bubalus bubalis), Camel (Camelus dromedarius) and Donkey (Equss asinus).
Separation and quantification were achieved by using ternary mobile phase of n-butanol: glacial
acetic acid: water (75:10:15 v/v/v) on precoated silica gel 60F254 aluminium plates; lactose
standard in milk samples were also confirmed by mass spectrometric determination and
densitometric determination of HPTLC plate were carried out after derivatization with methanol-
sulphuric acid reagent. After HPTLC densitometric scanning, it was analyzed that concentration
of free lactose in milk of Mare, Cow, Camel, Buffalo & Donkey were 2.16 %, 5.70 %, 6.70%,
7.17 % & 6.38 % respectively.
Keywords: Mammalian Milk, Lactose with oligosaccharides (LOS), Lactose, HPTLC,
Quantification
Page 2 of 23Analytical Methods
123456789101112131415161718192021222324252627282930313233343536373839404142434445464748495051525354555657585960
1. Introduction
Lactose is most abundant solid components in mammalian milk. The relatively high
concentration of lactose in milk obscured until recently the presence of the oligosaccharide
fraction, which was initially described with the name “gynolactose” and was later analysed and
characterised by Grimmonprez and Montreuil1. In the same account researchers hypothesised
that lactose induces the biosynthesis of oligosaccharides and act as a basic key molecule. We
know that milk of different mammals containing variable concentrations of lactose but contain a
limited repertoire of oligosaccharides2,3
.
Lactose is disaccharide molecule (Fig.1) catabolised into glucose and galactose by enzyme
lactase. Lactose-intolerant individuals have a lactase deficiency; therefore, lactose is not
completely catabolised in its monomers. While lactose intolerance is not a dangerous condition,
its global prevalence has created a large market for lactose-free products. Commercially
available lactose free products are produced by breaking down lactose into glucose and galactose
by enzymatic hydrolysis4-7
. However, the milk of mammalian species and its products containing
varying amounts of residual lactose which is unknown. So this has created the need for simple,
reliable, and accurate analytical method to quantify lactose concentration in milk and milk made
products of different mammalians. This type of study may helpful for population specially
suffering from lactose intolerance to choose the milk and its products having less quantity of
lactose compound.
Currently available analytical methods for the detection of lactose include mid-infrared
detection, fluorometry8, online dialysis
9, polarimetry, colorimetric method, spectroscopic,
gravimetric detection, spectrophotometry 10-12
, amperometric biosensor13
, HPLC14
, differential
pH techniques and enzymatic assays15-19
. These methods are time-consuming because of
extensive sample preparation and cannot differentiate individual carbohydrates.
To resolve these problems for accurate quantification of lactose, we develop the cost
effective, rapid and reliable high performance thin layer chromatographic (HPTLC) method. To
the authors’ best knowledge, this is the first report on the simultaneous quantification of lactose
in milk samples of different mammals by HPTLC and EI-MS technique.
Page 3 of 23 Analytical Methods
123456789101112131415161718192021222324252627282930313233343536373839404142434445464748495051525354555657585960
2. Experimental
2.1 Chemicals and Materials
All chemicals were laboratory grade and solvents were analytical grade, lactose was purchased
from Central Drug House, HPTLC plates Silica higlachrosep Nano UV 60 F254 [20 cm x 10 cm]
were procured from S D fine-chem Limited, Mumbai, India.
2.2 Milk collection
Milk samples were collected from Indian mare (Equus caballus) body weight 430 kg & age
about 41 months, Cow (Bos primigenius indicus) body weight 393 kg & age about 24 months,
Camel (Camelus dromedarius) body weight 771 kg & age about 38 months, Buffalo (Bubalus
bubalis) body weight 450 kg & age about 26 months and Donkey (Equss asinus) body weight
238 kg & age about 32 months mammalians 20, 21
at Badshahbagh Animal Hospital, Lucknow.
All animals were kept in a controlled room temperature at 25+ 20C, humidity was 50-70 % and
12:12 hrs light / dark cycle, light from 06:00 to 18:00, under hygienic conditions; animals were
acclimatized for one week before starting the experiment. The animals had free access to normal
diet and water. The study was approved by the Animal Ethics Committee of Directorate,
Department of Animal Husbandry, Badshahbagh, Lucknow, Uttar Pradesh (India).
2.2.1 Isolation of Lactose with oligosaccharide (LOS) from milk
For quantification of lactose in milk samples of different mammalian species, 100 mL milk
samples were collected from each mammal at Animal house, Directorate of Animal Husbandry,
Lucknow, U.P. (India). Diet and atmospheric condition of mammals was normal, milking
process was hand made from each teat of animals and collected milk samples were kept at -20 °C
temperature. To isolate LOS from milk sample, all samples to keep at normal temp and add 20 %
ethanol and centrifuged at 1500 g for 20 min at -40C. The upper solidified lipid layer was
removed by filtration through glass wool column in cold atmospheric condition and proteins
were removed by centrifugation of remaining filtrate at 6500 x g, proteins are settle down in
bottom of centrifuge tube and filtrate was lyophilized to get crude LOS mixture which was
further purified over Sephadex G-25 column.
Page 4 of 23Analytical Methods
123456789101112131415161718192021222324252627282930313233343536373839404142434445464748495051525354555657585960

2.2.2 Sephadex G-25 gel filtration of Lactose with oligosaccharides (LOS)
This lyophilized material LOS was further purified on Sephadex G-25 chromatography 22
for
separation of micro and macro molecules from LOS fraction. Glass triple distilled water (TDW)
was used as mobile phase, LOS mixture was packed in column (1.6 ×40 cm) (void volume =25
mL) and the flow rate of mobile phase was 1 mL in 3 minute. A substantial amount of remaining
proteins; glycoproteins and casein were eluted in very small amount in some fractions, was
confirmed by positive colouration with p-dimethylaminobenzaldehyde and phenol-sulphuric acid
reagent. LOS fractions gave a positive phenol-sulphuric acid test showed the presence of lactose
and oligosaccharides (Table 1). These fractions were polled & lyophilized together and used for
HPTLC analysis.
2.3 Preparation of crude extract
Accurately weighed 1.0 mg of the coarse powder of LOS samples was dissolve in HPLC grade
water to prepare 1 mg / mL solution for HPTLC analysis.
2.4 Preparation of standard and working solutions
Stock solution of lactose standard was prepared separately by dissolving 1 mg lactose in 1 mL
HPLC grade water. A stock solution of 1000 µg /1000 µL of standard were further diluted with
same solvent to obtain working solutions of concentration of 100µg/ mL for further analysis.
2.5 Chromatographic Instrumentation
HPTLC was performed on 20 cm × 10 cm TLC aluminum plates pre-coated with 200 µm layer
thickness of silica gel 60F 254 (sd. Fine chem. Ltd, Mumbai, India). Camag 100 µL sample
syringe (Hamilton, Switzerland) with a Linomat 5 applicator (Camag, Switzerland) was used for
sample and standards application on HPTLC plate. TLC developing chamber was a twin-trough
made up from Camag (Muttenz, Switzerland), detection was achieved by a Camag TLC Scanner
3 densitometer (Muttenz, Switzerland) with user-friendly winCATS Software (Version 3.2.1)
installed on a computer. The statistical was achieved by using Microsoft Excel Windows
software.
2.6 High Performance Thin Layer Chromatographic Procedure
Lactose with oligosaccharides samples (LOS) of all five mammalian species and six analytical
standards of lactose was applied on HPTLC glass plates with 6 mm band width using Camag 100
Page 5 of 23 Analytical Methods
123456789101112131415161718192021222324252627282930313233343536373839404142434445464748495051525354555657585960

microlitre sample syringe (Hamilton, Switzerland) with a Linomat 5 applicator (Camag,
Switzerland) under a flow of N2 gas. The Linear ascending development was carried out with n-
butanol: glacial acetic acid: water (75:10:15 v/v/v) as a mobile phase in two Camag glass twin
trough chamber (20 x 10 cm). Both chambers were previously saturated with mobile phase
vapour for 30 minutes and total run time were about 45 minutes for both TLC plates at room
temperature (27 ± 2°C) relative humidity was 50 % + 2 %. After run, plate no. (I) was dried
through hair drier and derivatized with phenol sulphuric acid reagent and stand until plate was
dried and kept it on hot plate to revel the bands of all tracks of standards & samples. After this,
scanning of HPTLC plate were performed by using Camag TLC Scanner 3 at λ600 nm in visible
absorbance mode for all tracks, TLC plate were developed at distance of approximately 80 mm
from the point of application and slit dimensions were 5 mm × 0.45 mm and the scanning speed
was100 mm/s and winCATS Software [Version 3.2.1] was used for scanning of HPTLC.
Another plate (II) was used for mass spectrometric studies of marker compound Lactose in milk
samples.
2.8 Confirmation of markers compounds by Mass Spectrometric analysis
After scanning of derivatized plate (HPTLC plate no. I) and underivatized preparative glass plate
(HPTLC plate no. II) put together on equal surface and the exact positions of Lactose compound
as appear in plate (I) were marked with a pencil on preparative plate (II) in all tracks of milk
samples and after this, scratch out the marked area of lactose standard from plate no (II) with the
help of spatula and needle further it were dissolve in 50% ethanol in water and allow to stand for
60 minutes and supernatant was purified with 0.22 microne filter paper. Mass spectrometric
measurements for standard lactose and lactose obtained from TLC plate were recorded on JEOL
JMS-D-300 spectrometer with the ionization potential of 70 eV, Electron ionization (EI) mass
spectra on Quantro-II mass at 800 amu / sec scanning in positive ion mode. After analysis of
Mass spectra of compounds, it was observed that lactose standard present with molecular mass
of m/z 343 (M+H), m/z 360 (M+ H2O) in all milk samples.
Page 6 of 23Analytical Methods
123456789101112131415161718192021222324252627282930313233343536373839404142434445464748495051525354555657585960
2.9 Quantification of lactose in milk oligosaccharide samples
10 µL samples of each LOS samples were applied through Linomat 5 applicator on a TLC plate,
developed & scanned at λ600 visible mode. Peak area was recorded in each sample & standard
tracks and the amount of lactose in all samples were calculated by using the calibration plot.
3. Results
3.1 Method optimization
For quantification of Lactose standard in milk samples, one binary and two ternary mobile phase
were tried; n-butanol: acetic acid: water (11:4.5: 4.5 v/v/v), n-butanol: glacial acetic acid: water
(75:10:15 v/v/v), v/v) and chloroform: methanol: water (85:10:05, v/v/v) to avoid interference
from the other constituents. The best chromatogram of lactose standard was obtained with
second mobile phase system i.e. n-butanol: glacial acetic acid: water (75:10:15 v/v/v) after
derivatization H2So4-methanol reagent. In preliminary examination, it appeared that an
immersion in the dipping solution for more than 3 seconds led to diffusion of spots. As no better
derivatization was obtained by increasing the dipping time, a shorter dipping time i.e. 2 seconds
was selected. Coloring reaction was checked by scanning the plate after 12, 24, 36 and 48 hrs to
see the stability of the standard. In comparison with the measured values at 0 h, no significant
variation was observed in the area which indicates the standard compound is stable for at least
for two days (results are described in intra-day & inter-day study)23
.
3.2 Method validation of HPTLC method
On the basis of SFSTP protocol and regulatory guidelines and the ICH documents 24,25
some
suggestions about experimental design and data evaluation are proposed by the SFSTP
Commission, which has tried to elaborate a rational, practical and statistically reliable strategy in
order to guarantee the quality of analytical results generated. However, a minimum of three
series and three replicates at each concentration level using at least three concentration levels: a
level close to the lowest range value, a medium level and a level close to the highest range value
must always be envisaged for the validation phase. Some examples of possible experimental
designs giving the number of calibration and validation standards to be prepared in the validation
phase are presented in references 23
.
Page 7 of 23 Analytical Methods
123456789101112131415161718192021222324252627282930313233343536373839404142434445464748495051525354555657585960

In this study, HPTLC method for lactose was validated in terms of precision, accuracy,
recovery, robustness; LOD and LOQ were checked as per ICH guidelines. Intra & inter-day
precision results were expressed as % RSD, Accuracy of the method was tested by performing
the recovery studies of the pre-analyzed sample with standard at five different levels in each
samples and result were expressed as % recovery and % RSD 23, 26, 27
.
3.3 Validation for lactose standard solutions
Two micro liters of six calibration solutions: 50, 100, 200, 400, 600 & 800 ng (m = 6) of lactose
standard were applied on the HPTLC plates. Peak area data and peak height of corresponding
amounts were considered for regression analysis. Five independent series (n = 5) of validation
standards were prepared daily and this operation was repeated on three different days (k = 3).
Peak area data and the corresponding amounts were treated by linear least square regression
analysis. In accordance with ICH Q2B norms for the assay of a finished product, validation
solutions were prepared in a concentration range covering a minimum 80–120 % of the expected
content 23
.
3.4 Response function
The response function of an analytical method is, within the range selected, the existing
relationship between the response (signal) and the amount (quantity) of the analyte in the sample
system.
3.5 Calibration for Lactose
A stock solution of 1000 µg/ mL of lactose were prepared in water and dilution was done to
obtain a solution of 100 µg/ mL which was used for further analysis. Different volumes of
diluted solution [0.5,1.0, 2.0, 4.0, 6.0 and 8.0 µL] were applied on TLC plate to furnish 50-800
ng / spot of lactose standard as shown in Fig. 2a and simultaneous presences of lactose in
samples were assessed by 3 D plot as shown in Fig. 2b. Peak area data of corresponding amounts
of standard were treated by linear least square regression analysis (Table 2).
3.6 Linearity and Detection Limit
Linearity was checked by applying standard solutions of lactose at six different concentrations.
The calibration curve was drawn in the concentration range of 50–800 ng / spot. The equation for
the calibration curve of lactose was Y= 726.20+5.49x and correlation coefficient of the
Page 8 of 23Analytical Methods
123456789101112131415161718192021222324252627282930313233343536373839404142434445464748495051525354555657585960

calibration plot was 0.995 (Fig 3). Results of regression analysis on the calibration curve and
quantification range are described in Table 2.
3.7 Precision Studies
Instrumental precision were checked by repeated scanning of the same spots (100, 400 and 800
ng / spot) of lactose standards five times and the RSD values were found 0.6895, 0.9725, and
0.9391 respectively. To determine the precision of the developed assay; 200, 400 and 800 ng /
spot of the standards were applied on TLC plate and analyzed five times within the same day to
determine the intra-day variability and the % RSD values for standards were 1.0332, 1.3035,
1.1328. Similarly the inter-day precision was tested on the same concentration levels on
consecutive days and the % RSD values were 2.1564, 2.0253, 2.8007 (Table 3). Peak area data
and peak height of both standards biomarkers amounts were considered for regression analysis
(Table 4).
3.8 Quantification of lactose in milk samples & recovery studies
HPTLC method was subsequently applied for the analysis and quantification of lactose in milk
samples bands of lactose was observed at Rf 0.51 in standard track (Fig. 4a) as well as at same Rf
in all sample tracks of lactose as shown in Fig. 4b,c,d,e &f. It was analyzed that free lactose
content in Indian Mare, Cow, Camel, Buffalo & Donkey milk samples are 2.16 %, 5.70 %,
6.70%, 7.17 % & 6.38 % respectively (Fig. 5). The recovery ranges for lactose was obtained
98.04 % to 102.84 % were obtained in all milk samples (Table 5).
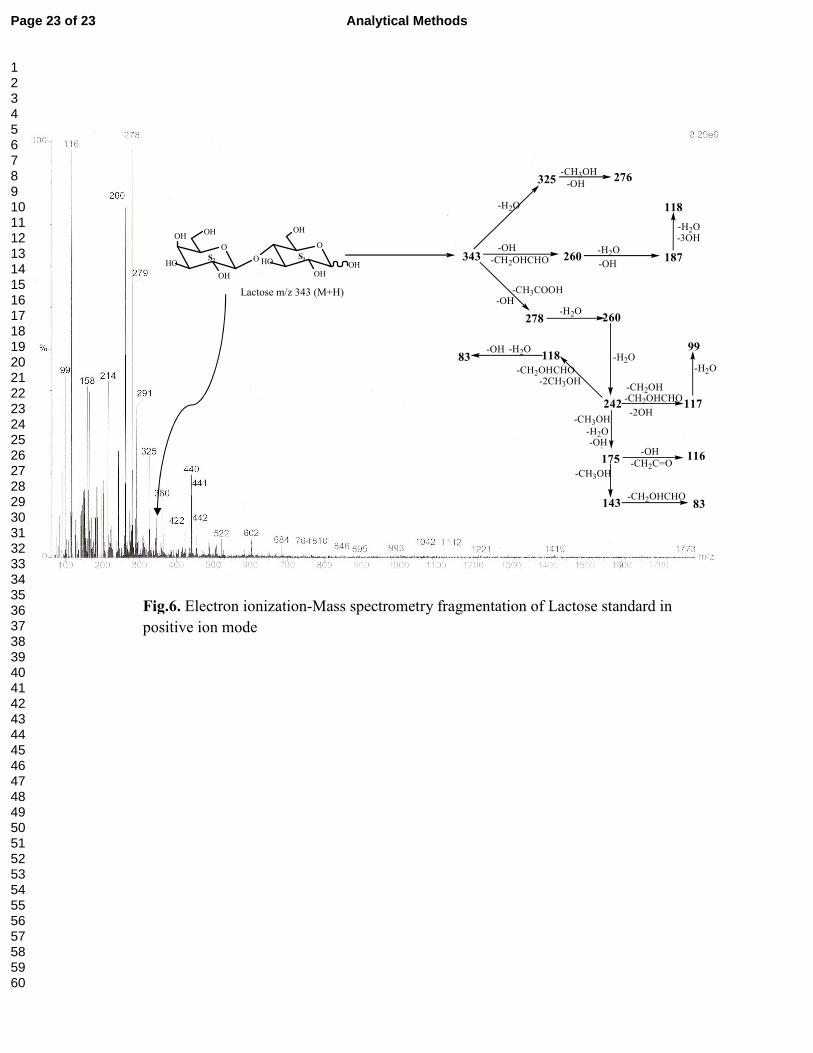
3.9 Mass spectrometric analysis confirmation
In present studies, the qualitative studies of lactose standard milk samples were done with mass
spectrometric determination and it were observed that the m/z 343 (M+H), m/z 360 (M+ H2O) in
all milk samples and it further fragmented to give mass ion peak at m/z 325[343-H2O], 276
[325-CH3OH, OH]. Further fragmentation of m/z 343 from another way it gives m/z at 278[343-
CH3COOH, OH], 260[278-H2O], 242[260-H2O], 175[242-CH3OH,H2O,OH], 116[175-CH2CO,
OH], 143[175- CH3OH], 117[242-CH2OH, CH3COOH,2OH], 99[117-H2O], and in other
fragmentation path 187[260-OH, H2O],118[187-H2O,3OH] fragment obtained as shown in Fig 6.
In this study, a simple, an original, cost-effective and easily adaptable HPTLC method is
developed and validated for the quantitative determination of lactose concentration in milk
sample of five mammalian species. After HPTLC densitometric scanning and mass spectrometric
Page 9 of 23 Analytical Methods
123456789101112131415161718192021222324252627282930313233343536373839404142434445464748495051525354555657585960

confirmation, it was observed that lowest concentration of lactose found in mare milk (2.16 %)
and highest concentration of lactose found in buffalo milk (7.17 %) sample.
4. Conclusions
In conclusion, the proposed HPTLC method would also be helpful those infants suffering from
early lactose intolerance and depending upon infant milk formulations. The developed HPTLC
method may be utilized by researcher those are working in sugar chemistry and this method will
be helpful in quantification of isolated different types of sugar molecules from milk, honey,
blood, fruits and other natural products / combinations / formulations where lactose sugars are
used as an ingredient.
Acknowledgements
Authors are thankful to veterinary physician Dr. R.B. Srivastava for arrangement of milk of
different mammalians and observation of mammals in animal house during experimental period.
Authors are also thankful to the Director, National Botanical Research Institute (CSIR),
Lucknow, India to provide all the facilities to conduct the research work.
Dedications
First Author Dr. Amit Srivastava dedicated this article to his father Late Dr. R.B. Srivastava,
M.V.Sc, Lucknow (India).
Page 10 of 23Analytical Methods
123456789101112131415161718192021222324252627282930313233343536373839404142434445464748495051525354555657585960

Reference
1. R. M. Espinosa, M. Tame´z and P. Prieto, British J Nutr., 2007, 98, S74–S79.
2. T. Urashima, M. Kobayashi, S. Asakuma and Y. Uemura, Comp Biochem Phys B.,
2007,146, 153–159.
3. Y. Uemura, S. Asakumna and L Yon, Mol Integr Physiol, 2006,145, 468–478.
4. J.G. Zadow. Lactose Properties and Uses. J. Dairy Science, 1984, 67, 2654-2679.
5. R.K. Bahl, Analyst, 1972, 97, 559-561.
6. I. Eshkenazi, E. Maltz, B. Zion and J. Rishpon. J. Daily Science, 2000, 83, 1939-1945.
7. E. Marconi, C. M. Messia, A. Amine, D. Mascone, F. Vernazza, F. Stocchi, and G.
Palleschi, Food Chem., 2004, 84, 447–450.
8. R. Guan, D. Liu, X. Ye, K. Yang, J Zhejiang Univ Sci B, 2005, 6 (11), 1101–1106.
9. R. Puchades, A. Maquieira, L. Torró, Analyst, 1993, 118, 855-859.
10. Thermo Fisher Scientific. Application Note AN 248, Determination of Lactose in
Lactose-Free Milk Products by High-Performance Anion-Exchange Chromatography
with Pulsed Amperometric Detection, AN70236_E 10/12S, Sunnyvale, CA, 2012.
11. V.V. Mistry, H.N. Hassan and R.J. Baer. J.Assoc. Off Anal. Chem., 1989, 72(6), 877-880.
12. A.B. Karasz, W.M. Gautenbei, L. Bokns. J. Assoc. Off. Anal. Chem. 1971, 54, 1436-
1438.
13. D. Moscone, R.A. Bernado, E. Marconi, A. Amine, and G. Palleschi, Analyst,1999, 124,
325–329.
14. R. J. M. Lourenço, M. L. M. Serralheiro and M. J. F. Rebelo. Port Electro Acta, 2003,
21, 171-177.
15. M. Luzzana, D. Agnellini, P. Cremonesi, G. Caramenti, and S. D. Vita, Lait, 2003, 83,
409–416.
16. R. Puchades, A. Maquieira, L. Torró. Analyst, 1993, 118, 855-859.
17. R. Pilloton, M. Mascini, L.G. Casella, M.R. Festa and E. Mottari. Anal. Lett., 1987, 20,
1803.
18. A. Jäger and U. Bilitewski. Analyst, 1994, 119, 1251-1255.
19. J.A. Hamid, G.J. Moody and J.D.R. Thomas. Analyst, 1989, 114, 1587-1592.
Page 11 of 23 Analytical Methods
123456789101112131415161718192021222324252627282930313233343536373839404142434445464748495051525354555657585960

20. J. O. Kriegs, G. Churakov, M. Kiefmann, U. Jordan, J. Brosius and J. Schmitz, PLoS
Biology, 2006, 4 (4), e91.
21. D. E. Wilson and M. R. Deeann (eds). 1993. Mammal Species of the World. Smithsonian
Institution Press, 1206 pp. ISBN 1-56098-217-9.
22. R. Saksena, D. Deepak, A. Khare R. Sahai, L. M. Tripathi, V. M. L. Srivastava. Biochem
et Biophy Acta 1999, 1428, 433-45.
23. A. Srivastava, S.S. Tiwari, S.Srivastava and A.K.S Rawat, J. Liq Chrom & Ret Techn.,
2010, 33, 1679–1688.
24. Guidance for industry. Q2B validation of analytical procedures: methodology, US
Department of Health and Human Services, Food and Drug Administration, International
Conference on Harmonisation of Technical Requirements for Registration of
Pharmaceuticals for Human Use (ICH) (1996).
25. S.S. Tiwari, A. Srivastava, S. Srivastava and A.K.S. Rawat, J. Liq Chrom & Reltd
Techn, 2012, 35, 2396–2407.
26. P. Hubert, J.J. N’guyen-Huu, B. Boulanger, E. Chapuzet, and P. Chiap, STP Pharma
Pratiques, 2003, 13(3), 101-138.
27. M. Feinberg, B. Boulanger and W. D. Hubert, Anal & Bioanal Chem, 2004, 380, 502.
Page 12 of 23Analytical Methods
123456789101112131415161718192021222324252627282930313233343536373839404142434445464748495051525354555657585960

Tables
Table 1. Sephadex G-25 (1.6 x 40 cm) chromatography of mare milk sugar fraction
Fraction
No.
Mobile Phase Compound
(in grams)
Phenol-H2SO4
test
For sugar
Milk oligosaccharide
obtained (in grams)
1-20 Glass T D H2O 0.10 -ve [I]
21-35 " 0.20 +ve [II] 0.90 (Mare MOS)
36-57 " 0.61 ++ve [III]
58-64 " 0.09 +ve [IV]
1-27 Glass T D H2O 0.09 -ve [I]
28-51 " 0.05 -ve [II]
52-57 " 0.76 +ve [III] 0.86 (Cow MOS)
58-87 " 0.10 +ve [IV]
1-19 Glass T D H2O 0.20 -ve [I]
20-30 " 0.15 +ve [II]
31-63 " 0.30 +ve [III] 0.65 (Camel MOS)
64-91 " 0.35 +ve[IV]
1-23 Glass T D H2O 0.10 -ve [I]
24-59 " 0.20 +ve [II]
60-87 " 0.24 ++ve [III] 0.90 (Buffalo MOS)
88-114 " 0.46 +ve [IV]
1-47 Glass T D H2O 0.25 -ve [I]
48-91 " 0.32 +ve [II]
92-157 " 0.35 +ve [III] 0.75 (DonkeyMOS)
158-224 " 0.08 -ve [IV]
Page 13 of 23 Analytical Methods
123456789101112131415161718192021222324252627282930313233343536373839404142434445464748495051525354555657585960
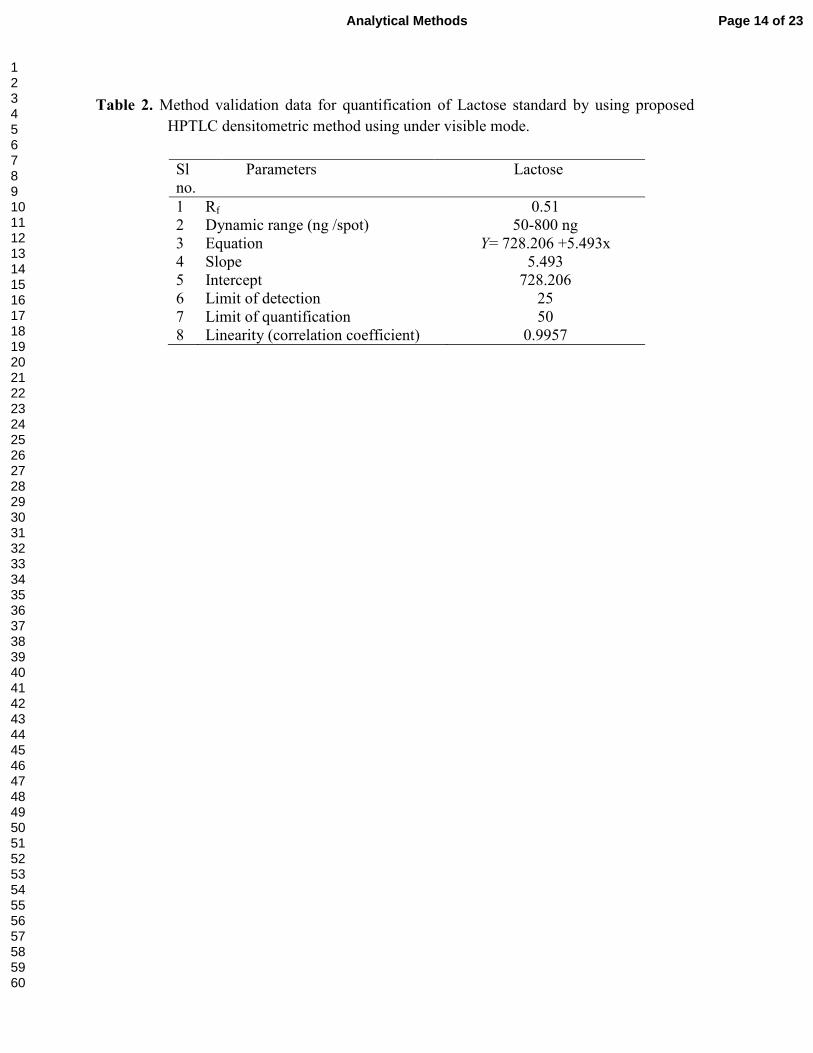
Table 2. Method validation data for quantification of Lactose standard by using proposed
HPTLC densitometric method using under visible mode.
Sl
no.
Parameters Lactose
1 Rf 0.51
2 Dynamic range (ng /spot) 50-800 ng
3 Equation Y= 728.206 +5.493x
4 Slope 5.493
5 Intercept 728.206
6 Limit of detection 25
7 Limit of quantification 50
8 Linearity (correlation coefficient) 0.9957
Page 14 of 23Analytical Methods
123456789101112131415161718192021222324252627282930313233343536373839404142434445464748495051525354555657585960
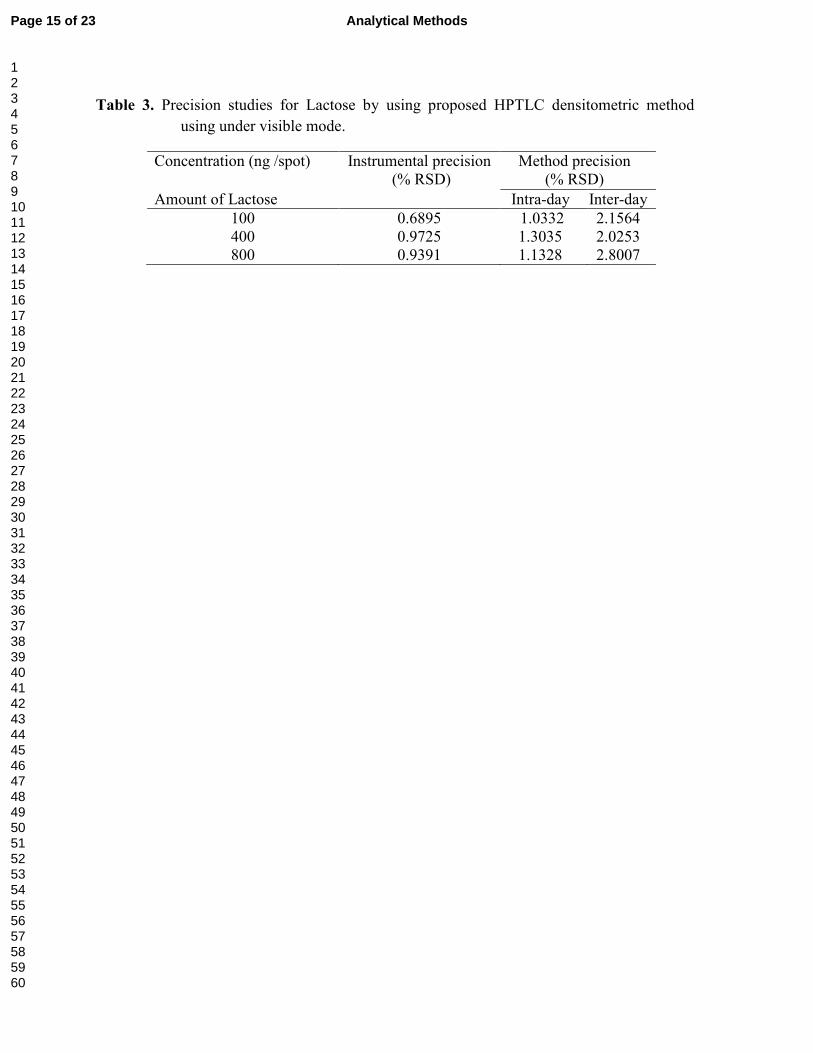
Table 3. Precision studies for Lactose by using proposed HPTLC densitometric method
using under visible mode.
Concentration (ng /spot) Instrumental precision
(% RSD)
Method precision
(% RSD)
Amount of Lactose Intra-day Inter-day
100 0.6895 1.0332 2.1564
400 0.9725 1.3035 2.0253
800 0.9391 1.1328 2.8007
Page 15 of 23 Analytical Methods
123456789101112131415161718192021222324252627282930313233343536373839404142434445464748495051525354555657585960
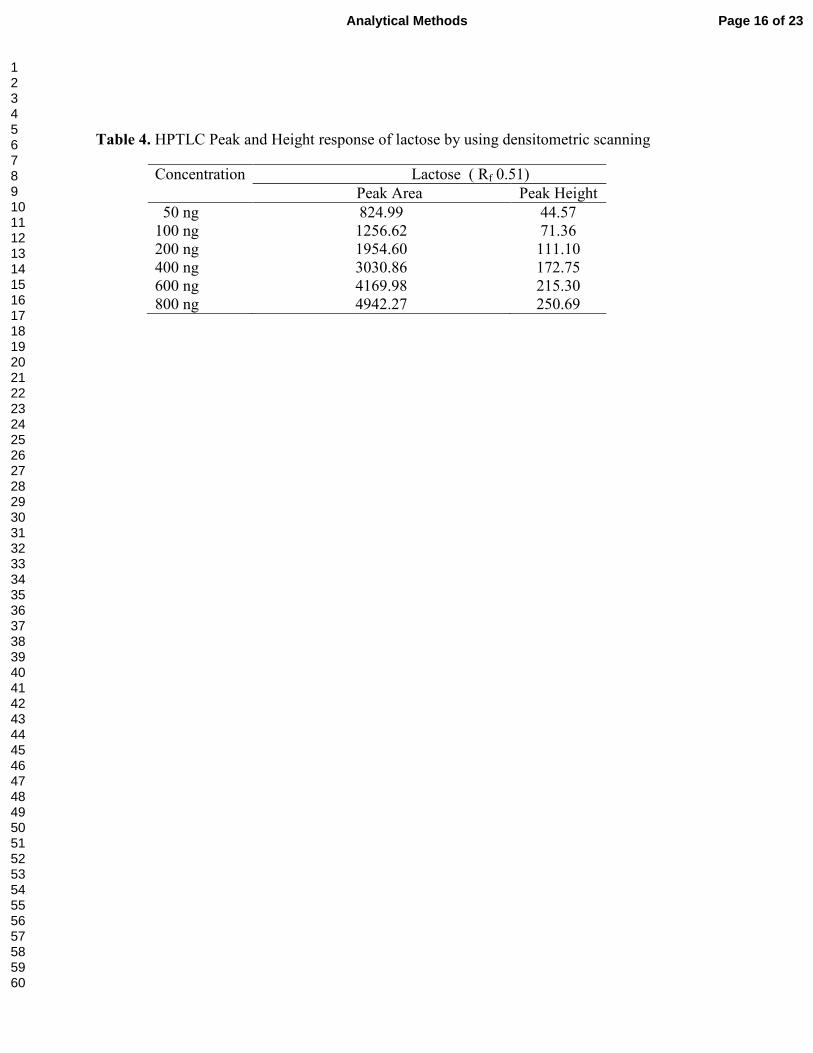
Table 4. HPTLC Peak and Height response of lactose by using densitometric scanning
Concentration Lactose ( Rf 0.51)
Peak Area Peak Height
50 ng 824.99 44.57
100 ng 1256.62 71.36
200 ng 1954.60 111.10
400 ng 3030.86 172.75
600 ng 4169.98 215.30
800 ng 4942.27 250.69
Page 16 of 23Analytical Methods
123456789101112131415161718192021222324252627282930313233343536373839404142434445464748495051525354555657585960

Table 5. Result and statistical data for recovery studies for Lactose in oligosaccharide fraction of
different mammalian species
Sl.
no.
Lactose present
in Mare milk
(ng)
Lactose
added
(ng)
Calculated
amount of Lactose
(ng)
Analyzed amount
of Lactose
(ng)
Recovery
(%)
% RSD
1 216 100 316 325 102.84
2 216 150 366 370 101.09
3 216 200 416 408 98.07 2.367
4 216 300 516 509 98.04
5 216 350 566 580 98.64
Lactose present
in Cow milk (ng)
Lactose
added (ng)
Calculated
amount of Lactose
(ng)
Analyzed amount
of Lactose
(ng)
Recovery
(%)
% RSD
1 570 300 870 884 102.60
2 570 400 970 980 100.92
3 570 500 1070 1086 101.49 1.735
4 570 600 1170 1152 98.46
5 570 800 1370 1367 99.78
Lactose present
inCamel milk
(ng)
Lactose
added
(ng)
Calculated
amount of Lactose
(ng)
Analyzed amount
of Lactose
(ng)
Recovery
(%)
% RSD
1 670 400 1070 1089 101.77
2 670 450 1120 1121 100.08
3 670 500 1170 1163 99.40 1.090
4 670 600 1270 1264 99.52
5 670 800 1470 1462 99.45
Lactose present
in Buffalo milk
(ng)
Lactose
added (ng)
Calculated
amount of Lactose
(ng)
Analyzed amount
of Lactose
(ng)
Recovery
(%)
% RSD
1 717 500 1217 1221 100.32
2 717 600 1317 1328 100.83
3 717 700 1417 1409 99.43 0.689
4 717 800 1517 1529 100.79
5 717 1000 1717 1709 99.53
Lactose present
in
Donkey milk (ng)
Amount of
Lactose
added (ng)
Calculated
amount of Lactose
(ng)
Analyzed amount
of Lactose
(ng)
Recovery
(%)
% RSD
1 638 200 838 827 98.68
2 638 400 1038 1031 99.32
3 638 600 1238 1243 100.40 0.648
4 638 800 1438 1449 100.76
5 638 1000 1638 1627 99.32
Page 17 of 23 Analytical Methods
123456789101112131415161718192021222324252627282930313233343536373839404142434445464748495051525354555657585960

Figures
O
HO
OH
OH
OH
S2
OH
HO
O
HO
OH
OH
OHS1
O
HO
OH
O
OHO
HO
OH
OH
OHS1S2
OH
+Lactase enzyme
Lactose GlucoseGalactose
Fig.1. Lactose molecule and its enzymatic hydrolysis
Page 18 of 23Analytical Methods
123456789101112131415161718192021222324252627282930313233343536373839404142434445464748495051525354555657585960
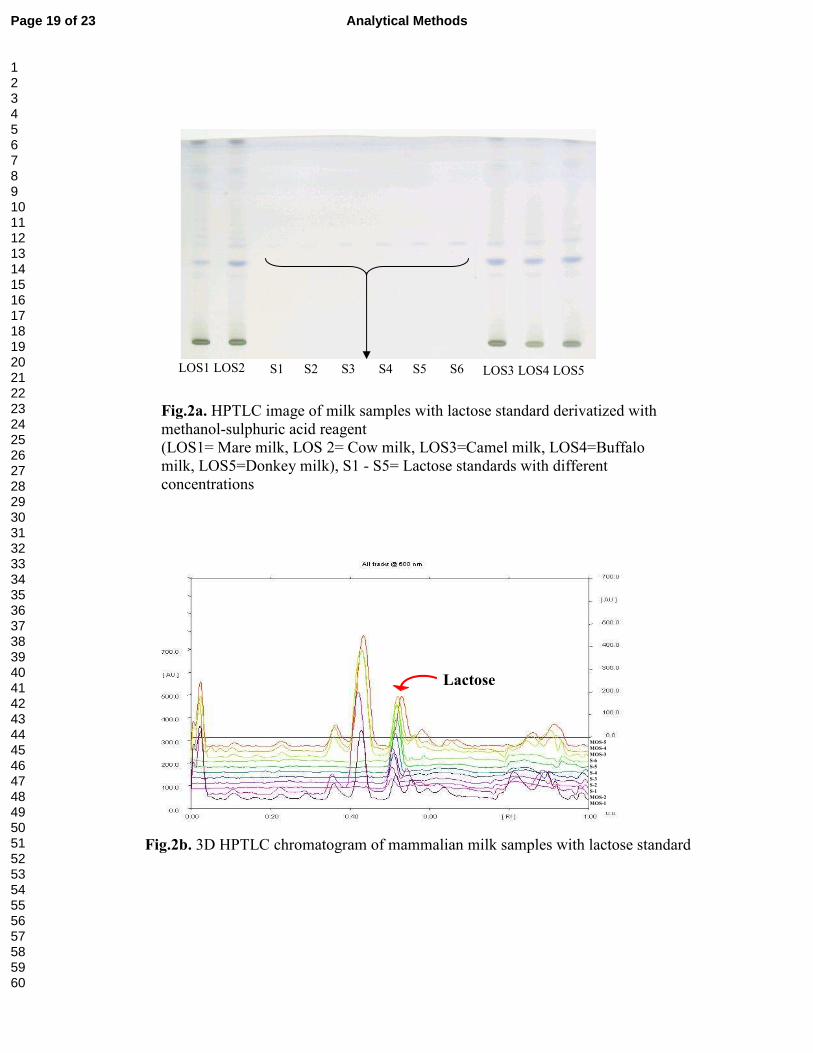
LOS1 LOS2 LOS3 LOS4 LOS5 S1 S2 S3 S4 S5 S6
Fig.2a. HPTLC image of milk samples with lactose standard derivatized with
methanol-sulphuric acid reagent
(LOS1= Mare milk, LOS 2= Cow milk, LOS3=Camel milk, LOS4=Buffalo
milk, LOS5=Donkey milk), S1 - S5= Lactose standards with different
concentrations
Fig.2b. 3D HPTLC chromatogram of mammalian milk samples with lactose standard
MOS-5
MOS-4
MOS-3
S-6
S-5
S-4
S-3
S-2
S-1
MOS-2
MOS-1
Lactose
Page 19 of 23 Analytical Methods
123456789101112131415161718192021222324252627282930313233343536373839404142434445464748495051525354555657585960

Fig.3. Correlation coefficient and HPTLC chromatogram of lactose standard
Page 20 of 23Analytical Methods
123456789101112131415161718192021222324252627282930313233343536373839404142434445464748495051525354555657585960

Fig.4a. HPTLC chromatogram of lactose standard Fig.4b. HPTLC chromatogram of Mare milk LOS
Fig.4c. HPTLC chromatogram of Cow milk LOS Fig.4d. HPTLC chromatogram of Camel milk LOS
Fig.4e. HPTLC chromatogram of Buffalo milk LOS Fig.4f. HPTLC chromatogram of Donkey milk LOS
Page 21 of 23 Analytical Methods
123456789101112131415161718192021222324252627282930313233343536373839404142434445464748495051525354555657585960

Fig.5. Lactose percentage in milk samples of different mammals
Page 22 of 23Analytical Methods
123456789101112131415161718192021222324252627282930313233343536373839404142434445464748495051525354555657585960
O
HO
OH
O
OHO
HO
OH
OH
OHS1S2
OH
Lactose m/z 343 (M+H)
-CH3OH
-H2O
-CH3OH
-CH2OH
-CH2OHCHO
-H2O
-CH2C=O
-CH2OHCHO
242
175
143 83
117
116
99
260
343
325 276
278
260 187
118
-OH
-2OH
-H2O-H2O
-H2O
-H2O
-OH
-OH
-CH3OH
-CH3COOH
-OH
-3OH
-OH
-OH
-CH2OHCHO
118
-CH2OHCHO-2CH3OH
83-H2O
-OH
-H2O
Fig.6. Electron ionization-Mass spectrometry fragmentation of Lactose standard in
positive ion mode
Page 23 of 23 Analytical Methods
123456789101112131415161718192021222324252627282930313233343536373839404142434445464748495051525354555657585960