a novel method for testing automatic systems for ... research paper a novel method for testing...
TRANSCRIPT

ww.sciencedirect.com
b i o s y s t em s e ng i n e e r i n g 1 7 4 ( 2 0 1 8 ) 1 1 5e1 2 5
Available online at w
ScienceDirect
journal homepage: www.elsevier .com/ locate/ issn/15375110
Research Paper
A novel method for testing automatic systems forcontrolling the spray boom height
Andreas Herbst a,*, Hans-Jurgen Osteroth a, Hartje Stendel b
a Julius-Kuhn-Institut, Institute for Application Techniques in Plant Protection, Messeweg 11/12, 38104
Braunschweig, Germanyb Ing. Buro CheckTec Dipl.-Ing. Hartje Stendel, Wilhelmstraße 87, 38100 Braunschweig, Germany
a r t i c l e i n f o
Article history:
Received 24 January 2018
Received in revised form
27 March 2018
Accepted 10 June 2018
Keywords:
Boom sprayer
Spray boom
Automatic control
Boom height
Testing
* Corresponding author.E-mail address: andreas.herbst@julius-ku
https://doi.org/10.1016/j.biosystemseng.20181537-5110/© 2018 The Authors. Published bycreativecommons.org/licenses/by/4.0/).
Automatic boom height control (BHC) systems for sprayers have become more common in
recent years. The accuracy of the BHC is dependent on the quality of the height mea-
surement as well as on the control algorithm that should be tailored to the dynamic
behaviour of the spray boom and its suspension. There is a need for evaluating BHC per-
formance but there is no objective test method available. A protocol was developed for
assessing the control accuracy of BHC systems based on a stationary test bench consisting
of target area units placed below the height sensors of the sprayer simulating a ground or
canopy surface profile. This study should prove the suitability of this test method, of the
target area profiles used and of different statistical parameters describing the test results.
The test bench and the protocol developed have proved appropriate for evaluating the
performance of BHC systems in a stationary test under defined conditions. Test replica-
tions gave consistent results. Several statistical parameters were found suitable to char-
acterise the BHC performance but the standard deviation from set point provided the best
selectivity. A smooth and a rough field profile were used for the test in comparison to a
synthetic profile consisting of different low frequency harmonics. The rough field and the
synthetic profile gave similar results. Opposite to the smooth field, tests using these pro-
files appear sufficiently selective. It turned out that in some cases the profiles could alter
comparative test results. This needs further examination.
The test bench developed for this study can be considered a potential basis of a
standardised protocol for BHC assessment as well as for the definition of performance
limits.
© 2018 The Authors. Published by Elsevier Ltd on behalf of IAgrE. This is an open access
article under the CC BY license (http://creativecommons.org/licenses/by/4.0/).
1. Introduction
Automatic boom height control (BHC) systems are optionally
offered by many manufacturers of boom sprayers. These
ehn.de (A. Herbst)..06.003Elsevier Ltd on behalf of IA
systems are designed for maintaining a constant distance of
the spray nozzle tips from the target area (soil or canopy) in-
dependent from long-wave variations of terrain surface, crop
canopy height or roll angle of the sprayer. It is known that an
grE. This is an open access article under the CC BY license (http://

Symbols and abbreviations
a Number of variants (number of BHC systems to
be compared), e
dl Boom height deviation at left side, mm
dr Boom height deviation at right side, mm
fxx Percentage of measuring values with a
deviation of �xx cm from set value, %
hi Boom height at instant i, mm
hl Height of the boom above the surface at left
side, mm
hr Height of the boom above the surface at right
side, mm
hs Set value of boom height, mm
HI Hockley-Index, %
k Sample size (number of replications for each
BHC test), e
LSD Least significant difference, various
LSDn Least significant difference, normalised with
the average, %
LSDt Least significant difference of multiple t-test,
various
MQR Mean square of residues, various
n Number of measuring values, e
s Standard deviation, various
SD Standard deviation from set value, mm
ta;g Quantile of the t distribution for a significance
level a and g� of freedom, e
BHC Boom height control
FFT Fast Fourier Transformation
US Ultrasonic
b i o s y s t em s e n g i n e e r i n g 1 7 4 ( 2 0 1 8 ) 1 1 5e1 2 5116
optimumboomheight is essential for achieving an even spray
distribution (Jeon, Womac, & Gunn, 2004; Wolf, 2002) as well
as for sufficient spray drift control (Miller, Lane, O'Sullivan,Tuck, & Ellis, 2008; Nuyttens et al., 2007; ). BHC also helps to
disburden the operator especially when spraying at high for-
ward speeds as manual boom height control would require a
considerable part of the operator's attention. Figure 1 shows
the principle of a basic BHC system with one height sensor at
each side of the boom.
All known control systems work with ultrasonic (US) sen-
sors for detecting the distance of the boom either from the soil
or the canopy. Those sensors may be directed vertically
downwards or angled slightly forward in order to avoid dis-
turbances by the spray fan. It can be assumed that US sensors
are sensitive to reflections from a cone-shaped region with an
angle of approximately 20�e30�. Hence, the shape of the
contact area with the target is a circle or an oval.
The measuring values obtained from the height sensors at
both sides of the boom are compared to a set value by a
computer. This nominal height is chosen by the operator ac-
cording to the characteristics of the nozzles mounted on the
boom, i.e. spray angle and nozzle spacing. For the most
common nozzles, flat-fan nozzles with a spray angle of 110�
and a nozzle spacing of 0.5 m, the nominal boom height is
0.5 m. It is also possible to select a maximum deviation value
tolerated by the control algorithm without any intervention.
In case of exceeding this value on either side of the boom,
hydraulic or electrical actuators for lifting or tilting the boom
are activated in order to minimise the deviation of boom
height from the set value.
The performance of the BHC is dependent on the accuracy
of the heightmeasurement as well as on the control algorithm
that should be tailored to the dynamic behaviour of the spray
boom and its suspension.
As BHC systems have been becoming standard equipment
for boom sprayers in Europe, testing the performance of those
systems should be an inherent part of sprayer examination
protocols. This requires a reliable procedure providing repro-
ducible test results obtained under defined conditions.
Currently there is no standardmethod available worldwide
for objective testing the accuracy of these systems.When they
are tested, the sprayers are usually operated on real fields and
the system's boom height values are recorded. For the evalu-
ation of such data Griffith, Strelioff, and Schnaider (2012)
developed a statistical parameter describing the degree of
matching the boom height set point, the Hockley-Index.
It is also possible to use artificial obstacles or earthwork for
assessing BHC. The German Agricultural Society (DLG) have
been using this approach for sprayer demonstrations on the
DLG-Feldtage, a biennial agricultural exhibition and show
(DLG, 2014). Sprayers have to pass a track with an artificial
earth bank on one side of the boom that represents a short
slope of the terrain. This is used for visual evaluation of the
system performance only.
At Julius-Kuhn-Institut (JKI), the German authority for
testing of plant protection equipment, a test protocol for boom
height control systems was developed on the basis of a test
bench in co-operation with CheckTec, a manufacturer of
testing equipment. This paper describes the test method and
some preliminary studies necessary for its development. One
part of the study should prove the suitability of the test
equipment and of different statistical parameters describing
the test results. Another part was to examine different profiles
applied to the test bench and their potential influence on the
test results.
2. Method
2.1. Test bench
As a basic principle, the official testing of sprayers shall be as
reliable and reproducible as possible. Field tests seem to be
inappropriate as they are difficult to reproduce. A controlled
laboratory based test system was therefore developed.
The concept of the test protocol for evaluating the perfor-
mance of BHCwas based on a stationary test bench consisting
of two target area units (Fig. 2) placed below the height sensors
of the sprayer. Each of them consists of an artificial spray
target area that can be moved in vertical direction with the
help of linear guide units driven by an electric stepper motor.
Themaster target area unit is equippedwith a terminal which
allows basic inputs as well as the transfer of the desired target
area positions with a time increment of 0.02 s from a flash
drive to the programmable controller activating the stepper

Fig. 1 e Principle of a BHC system.
b i o s y s t em s e ng i n e e r i n g 1 7 4 ( 2 0 1 8 ) 1 1 5e1 2 5 117
motors of both target area units. The target areas can perform
arbitrary vertical movements within the following nominal
limits:
� maximum displacement: 1000 mm
� maximum velocity: 2 m s�1
� maximum acceleration: 10 m s�2
These parameters should be sufficient to give a dynamic
behaviour of the target area appropriate for the low fre-
quencies of a practical relief. A short test was performed to
prove this. A sine wave with a frequency of 0.1 Hz and an
amplitude of 200 mm was applied to the target area and the
movement wasmeasured using a laser sensor mounted on its
frame. It can be seen from Fig. 3 that the target area followed
exactly, only with a delay of 0.1 s. As only the desired profile
was recorded during the BHC tests, the time delay was
considered for the evaluation of the results.
Fig. 2 e Target area unit of the BHC test bench.
The size of the target area was designed according to the
characteristics of the height sensors. Assuming a cone angle
of 30� and a maximum height of the sensor from the target of
1.5m, the footprint is a circle of 0.8m diameter. If the sensor is
directed forward by 30�, the longitudinal extension of the
footprint would increase. The length of the target area should
also accommodate a change of the longitudinal footprint po-
sition from an angled sensor with boom height. Figure 4 il-
lustrates the geometric proportions of a sensor's footprint for
a maximum height of 1.5 m and a minimum height of 0.5 m
above the target area. A minimum length of 1.35 m would be
required. So a target area of 1 m width and 1.5 m length was
considered to be wide enough to accommodate the footprint
dimensions and positions of a common ultrasonic sensor in a
wide range of conditions.
The material of the target area should give a similar
response to the sensor signals as a crop canopy or a soil sur-
face. At the same time it should be lightweight and porous in
order to limit thepowernecessary tomove it. Severalmaterials
were tested with a common US sensor, some of them from
different heights, in order to evaluate the signal levels. The
output of the sensor is a voltage depending on the reflecting
material and its distance below the sensor. It gave amaximum
voltage of 18 V. As Fig. 5 shows, an increase of the distance
between surface and sensor would lower the voltage level.
Hard surfaces at a low distance give signals close to the
maximum level. With this material, changes in distance
would not have a big influence on the signal. Light and porous
material like foam plastics gives low signal levels in general. A
wiremeshwith a gauge of 0.5mmand ameshwidth of 10mm
was found to give signal levels close to the level obtained from
a beet crop canopy. On the other hand, themesh is sufficiently
transmissible so that the sensors are able to detect the surface
below, too. So it is possible for some sensors to detect “can-
opy” and “ground” surface at the same time. These reasons
supported the decision to use the metal mesh for the target
area in the first instance.

-250
-200
-150
-100
-50
0
50
100
150
200
250
10 11 12 13 14 15 16 17 18 19 20
ver�
cal p
osi�
on /
mm
t / s
setpoints
measured
Fig. 3 e Desired andmeasured position of the target area with a sine wave input of a frequency of 0.1 Hz and an amplitude of
200 mm.
b i o s y s t em s e n g i n e e r i n g 1 7 4 ( 2 0 1 8 ) 1 1 5e1 2 5118
2.2. Test profiles
In principle the target area units of the test bench can perform
any movements within the above mentioned limits. This
1.5
m
0.5
m
Fig. 4 e Footprint geometry of a c
allows several test approaches. For instance, it would be
possible to determine the frequency response function of a
BHC system. This is the reaction of the system on harmonics
of different frequencies. This could be interesting for
1.35 m
ommon boom height sensor.

PVC wood foam plas�cs beet canopy soil metal mesh0
2
4
6
8
10
12
14
16
18
20
sign
al le
vel /
V
500 mm
750 mm
Fig. 5 e Response of a commercial US sensor on several reflector materials from different distances.
b i o s y s t em s e ng i n e e r i n g 1 7 4 ( 2 0 1 8 ) 1 1 5e1 2 5 119
companies producing and adopting BHC systems for sprayers
in order to optimise their design. However, within sprayer
testing schemes themain attention is put on the evaluation of
the performance “as it is” using test criteria easy to interpret
by the costumers. This is why this study is focussed on
assessing BHC systems in the time domain simulating target
area profiles.
A synthetic test profile was initially generated for the very
first tests with the test bench. It consists of a few ramps with
constant speed movements of 0.05 m s�1 in the first part. The
second part is a superposition of harmonics in a frequency
range of 0.01 Hze0.15 Hz with a random phase.
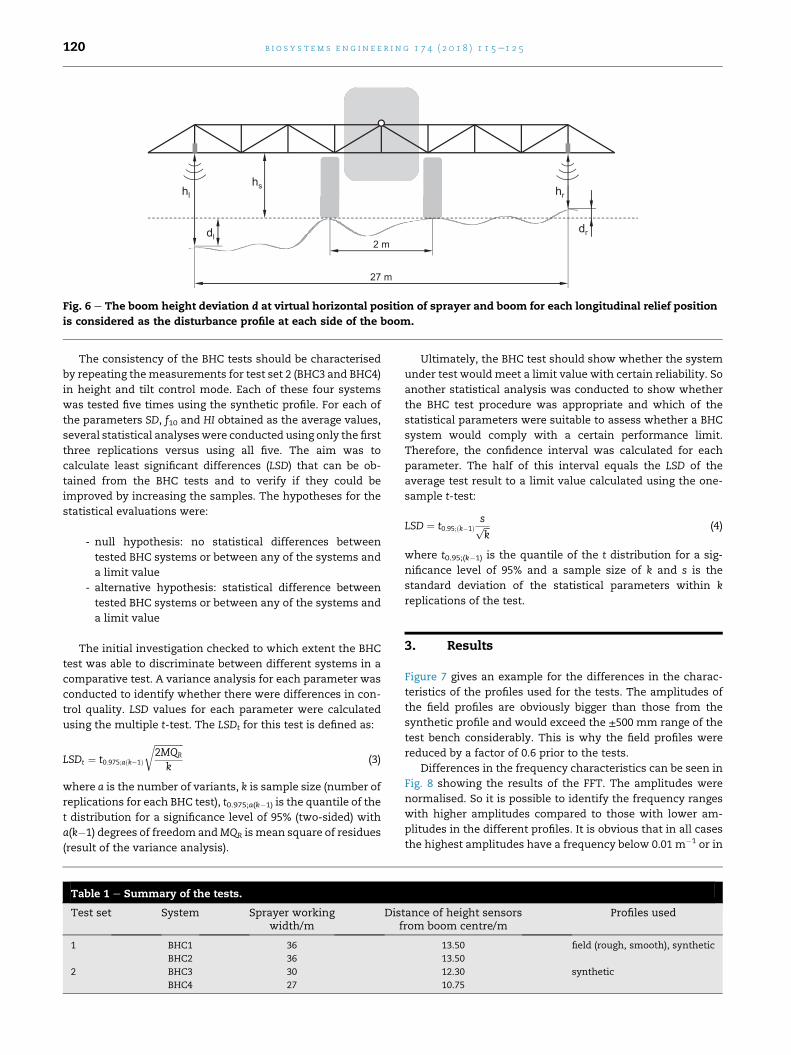
A number of real field relief data sets with a resolution of
1 m was used to describe practical conditions. From each of
these relief data four corresponding profiles were selected
representing the soil surface in thewheel tracks and below the
boom height sensors. Assuming a hard surface, a wheel gauge
of 2 m and an estimated position of height sensors at 13.5 m
from the centre of a 30 m boom, the height of the boom above
the surface at left side (hl) and right side (hr) was calculated for
a virtual horizontal position of sprayer and boom (Fig. 6). The
deviations from the set value hs at each relief point below the
sensors are considered the profile that should be reproduced
by the target area units of the BHC test bench.
A Fast Fourier Transformation (FFT) of the profiles below
the height sensors was performed for the different field
reliefs. Normally, an FFT is done in the time domain but here it
was more useful to stay in the length domain with the fre-
quency expressed in m�1 in order to describe the profile.
Afterwards the profiles were transferred into the time
domain, applying the maximum recommended travel speed
in Germany of 8 km h�1. The two extreme profiles (rough and
smooth) were used for BHC tests.
2.3. Tests and sprayers
A first set of tests was conducted with one trailed sprayer with
two different control systems (BHC1 and BHC2, Table 1). The
aim of this test was to compare the influence of the target area
unit drive signals (synthetic, field profiles) on the test results
and to identify potential interactions with the statistical pa-
rameters describing the BHC performance (see Section 2.4).
Only the synthetic profile was used to study the perfor-
mance of BHC systems at two different trailed sprayers (BHC3
and BHC4) in a second set of tests (Table 1). The aim of these
tests was to identify suitable parameters describing the re-
sults of the BHC tests and to find out the consistency of the
test results according to the number of repetitions. These tests
were replicated 5 times.
For all tests, both target area units were applying the pro-
files with the same sign (height control mode) as well as with
opposite sign (tilt control mode).
2.4. Statistical analysis
The results of all tests were described by different statistical
parameters characterising the accuracy of the BHC systems.
First parameter was the standard deviation SD calculated
from the deviations from the set value as:
SD ¼
ffiffiffiffiffiffiffiffiffiffiffiffiffiffiffiffiffiffiffiffiffiffiffiffiffiffiPni¼1
ðhi � hsÞ2
n� 1
vuuut(1)
where hi is boom height at instant i, hs is set value of boom
height and n number of measuring values.
The second parameter was the percentage f10 of measured
values within a maximum deviation of 10 cm from the set
value.
The third parameter was a modified Hockley-Index HI,
defined as:
HI ¼ f10 þ 0:75f25 þ 0:25f40 � f>40 (2)
where f10 is percentage ofmeasuring valueswith a deviation of
�10 cm from set value; f25 is percentage of measuring values
with a deviation of >10 cm and �25 cm; f40 percentage of
measuringvalueswithadeviationof>25cmand�40cmand f>40is percentage ofmeasuring valueswith a deviation of>40 cm.
hl hrhs
27 m
2 mdl
dr
Fig. 6 e The boom height deviation d at virtual horizontal position of sprayer and boom for each longitudinal relief position
is considered as the disturbance profile at each side of the boom.
b i o s y s t em s e n g i n e e r i n g 1 7 4 ( 2 0 1 8 ) 1 1 5e1 2 5120
The consistency of the BHC tests should be characterised
by repeating themeasurements for test set 2 (BHC3 and BHC4)
in height and tilt control mode. Each of these four systems
was tested five times using the synthetic profile. For each of
the parameters SD, f10 and HI obtained as the average values,
several statistical analyseswere conducted using only the first
three replications versus using all five. The aim was to
calculate least significant differences (LSD) that can be ob-
tained from the BHC tests and to verify if they could be
improved by increasing the samples. The hypotheses for the
statistical evaluations were:
- null hypothesis: no statistical differences between
tested BHC systems or between any of the systems and
a limit value
- alternative hypothesis: statistical difference between
tested BHC systems or between any of the systems and
a limit value
The initial investigation checked to which extent the BHC
test was able to discriminate between different systems in a
comparative test. A variance analysis for each parameter was
conducted to identify whether there were differences in con-
trol quality. LSD values for each parameter were calculated
using the multiple t-test. The LSDt for this test is defined as:
LSDt ¼ t0:975;aðk�1Þ
ffiffiffiffiffiffiffiffiffiffiffiffiffi2MQR
k
r(3)
where a is the number of variants, k is sample size (number of
replications for each BHC test), t0.975;a(k�1) is the quantile of the
t distribution for a significance level of 95% (two-sided) with
a(k�1) degrees of freedom andMQR is mean square of residues
(result of the variance analysis).
Table 1 e Summary of the tests.
Test set System Sprayer workingwidth/m
Disf
1 BHC1 36
BHC2 36
2 BHC3 30
BHC4 27
Ultimately, the BHC test should show whether the system
under test would meet a limit value with certain reliability. So
another statistical analysis was conducted to show whether
the BHC test procedure was appropriate and which of the
statistical parameters were suitable to assess whether a BHC
system would comply with a certain performance limit.
Therefore, the confidence interval was calculated for each
parameter. The half of this interval equals the LSD of the
average test result to a limit value calculated using the one-
sample t-test:
LSD ¼ t0:95;ðk�1Þsffiffiffik
p (4)
where t0.95;(k�1) is the quantile of the t distribution for a sig-
nificance level of 95% and a sample size of k and s is the
standard deviation of the statistical parameters within k
replications of the test.
3. Results
Figure 7 gives an example for the differences in the charac-
teristics of the profiles used for the tests. The amplitudes of
the field profiles are obviously bigger than those from the
synthetic profile and would exceed the ±500 mm range of the
test bench considerably. This is why the field profiles were
reduced by a factor of 0.6 prior to the tests.
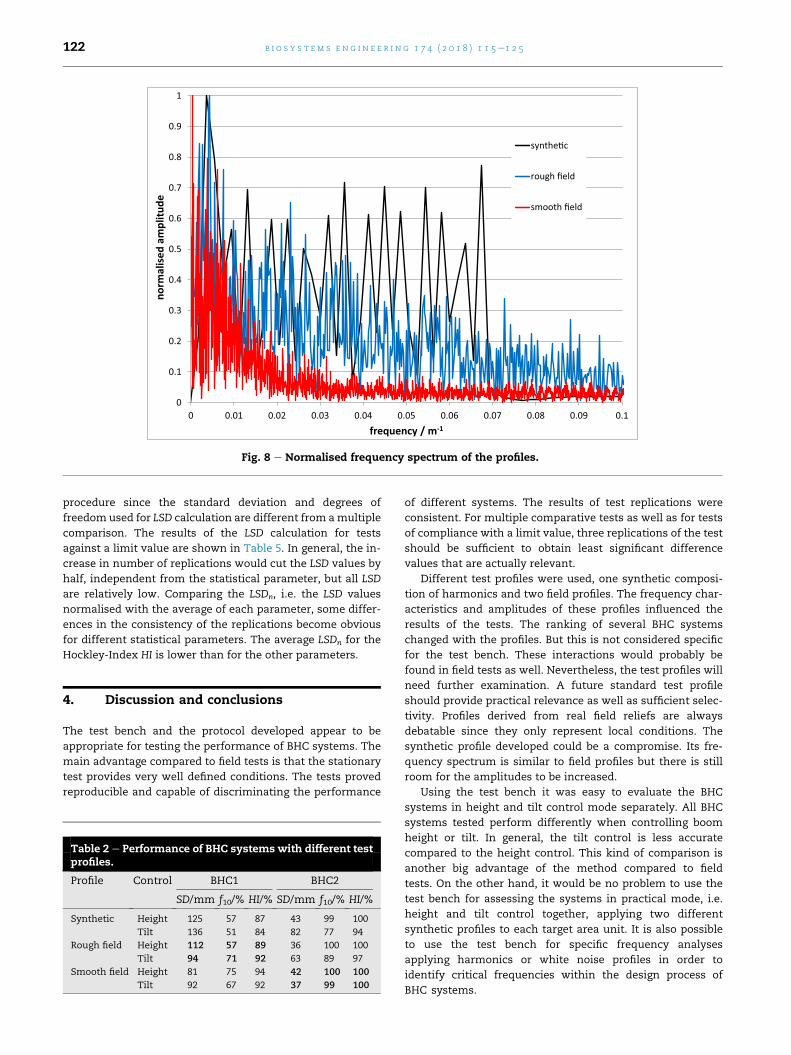
Differences in the frequency characteristics can be seen in
Fig. 8 showing the results of the FFT. The amplitudes were
normalised. So it is possible to identify the frequency ranges
with higher amplitudes compared to those with lower am-
plitudes in the different profiles. It is obvious that in all cases
the highest amplitudes have a frequency below 0.01 m�1 or in
tance of height sensorsrom boom centre/m
Profiles used
13.50 field (rough, smooth), synthetic
13.50
12.30 synthetic
10.75

b i o s y s t em s e ng i n e e r i n g 1 7 4 ( 2 0 1 8 ) 1 1 5e1 2 5 121
other words, the wavelength of the biggest profile roughness
is above 100 m. The synthetic profile spectrum shows higher
amplitudes at higher frequencies compared to the rough field
profile whereas there is almost no roughness with frequencies
above 0.02 m�1 in the smooth field profile.
When the different profiles were used for testing different
BHC systems, the results shown in Table 2 were obtained. In
general all tests using the different profiles gave a better per-
formance of BHC2 compared to BHC1. Comparing the pa-
rameters between height and tilt control for each profile and
BHC system, the height control works more accurate than tilt
control in general. But in two cases the result was opposite
(bold numbers). This is an indication of interactions between
the test profile and the control systems or in other words, the
relative performance of a control system can depend on the
test profile. For BHC2 which performs very well the smooth
field profile only shows very low differences between height
and tilt control.
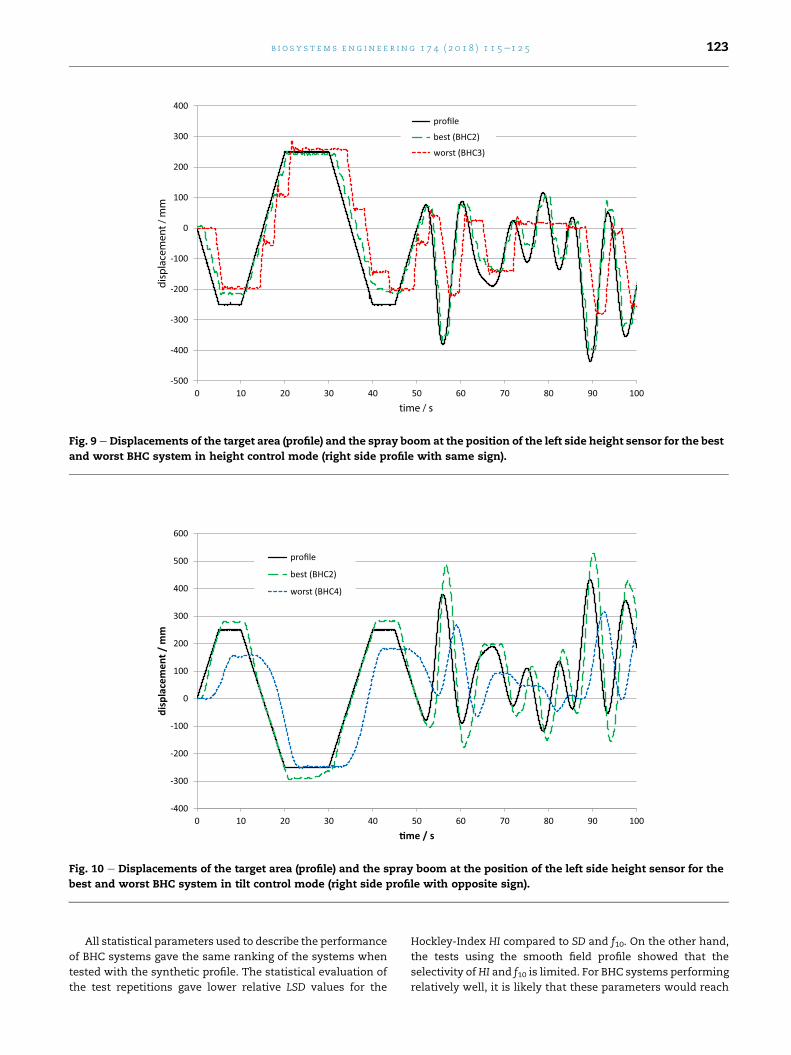
Figures 9 and 10 show examples of the measured boom
movements at the left height sensor position following the
target area performing the synthetic profile. The curves
represent the displacement from the initial position (t¼ 0 s) of
the target area (profile) and the boom. So each curve starts at
zero, although the boom height was set to 0.5 m above the
target area. As the boom curves do not follow the profile
exactly, there aredeviations from the set value. In heightmode
control the worst systemwas BHC3 (SD ¼ 131mm) whereas in
tilt control mode the worst was BHC4 (SD ¼ 160 mm). In both
cases BHC2 performed best, with SD ¼ 43 mm in height and
SD¼ 82mm in tilt controlmode. As expected, the boomcannot
follow the target areas exactly due to the dynamic character-
istics of the control system. Usually the settings of the system
allowa certaindeviation from the set value. This and theuse of
-1000
-800
-600
-400
-200
0
200
400
600
800
1000
0 100 200 300
disp
lace
men
t / m
m
dist
synthe�c
rough field
smooth field
Fig. 7 e Profiles (below left height sen
a simple two-wayvalve for controlling the boom lift can lead to
the stepwise adjustment of the boom height (Fig. 9). The sys-
tem shows a different behaviour when only the boom tilt is
controlled (Fig. 10) as due to the integral characteristics of the
actuator and the boom inertia, it ismore difficult to control the
rotational boom movement.
The statistical parameters derived from the test set 2
measurements are listed in Table 3. The results of the repli-
cations are consistent, and this is true for all statistical
parameters.
Further processing of the data should showwhat statistical
accuracy can be obtained from the tests for the different sta-
tistical parameters considering the sample size, e.g. number
of replications.
Table 4 shows the LSD values calculated for a multiple
comparison of the test results for the different BHC systems
and control modes, if only the first 3 or all 5 replications were
considered. Such a comparison would bemade for instance in
case of a comparative test.
Comparing the average and standard deviation values
resulting from 3 or 5 replications, the differences appear very
low. Accordingly, the increase of the LSDt values caused by the
reduction of the sample size is only very moderate. It would
not have any influence on the ranking of the systems. There is
also no influence of the statistical parameter on the results of
themultiple comparisons. LSDt is dependent on the number of
variants, i.e. the number of BHC systems, involved. But as
there were only 4 variants compared, LSDt values would be
reduced in a typical comparison test scenario with more sys-
tems involved.
But a comparative test is only one possible scenario. Just as
important are comparisons of the test results with a limit
value. From a statistical prospect this requires another test
400 500 600 700ance / m
sor) used for the tests (test set 1).
0
0.1
0.2
0.3
0.4
0.5
0.6
0.7
0.8
0.9
1
0 0.01 0.02 0.03 0.04 0.05 0.06 0.07 0.08 0.09 0.1
norm
alis
ed a
mpl
itude
frequency / m-1
synthe�c
rough field
smooth field
Fig. 8 e Normalised frequency spectrum of the profiles.
b i o s y s t em s e n g i n e e r i n g 1 7 4 ( 2 0 1 8 ) 1 1 5e1 2 5122
procedure since the standard deviation and degrees of
freedom used for LSD calculation are different from amultiple
comparison. The results of the LSD calculation for tests
against a limit value are shown in Table 5. In general, the in-
crease in number of replications would cut the LSD values by
half, independent from the statistical parameter, but all LSD
are relatively low. Comparing the LSDn, i.e. the LSD values
normalised with the average of each parameter, some differ-
ences in the consistency of the replications become obvious
for different statistical parameters. The average LSDn for the
Hockley-Index HI is lower than for the other parameters.
4. Discussion and conclusions
The test bench and the protocol developed appear to be
appropriate for testing the performance of BHC systems. The
main advantage compared to field tests is that the stationary
test provides very well defined conditions. The tests proved
reproducible and capable of discriminating the performance
Table 2 e Performance of BHC systems with different testprofiles.
Profile Control BHC1 BHC2
SD/mm f10/% HI/% SD/mm f10/% HI/%
Synthetic Height 125 57 87 43 99 100
Tilt 136 51 84 82 77 94
Rough field Height 112 57 89 36 100 100
Tilt 94 71 92 63 89 97
Smooth field Height 81 75 94 42 100 100
Tilt 92 67 92 37 99 100
of different systems. The results of test replications were
consistent. For multiple comparative tests as well as for tests
of compliance with a limit value, three replications of the test
should be sufficient to obtain least significant difference
values that are actually relevant.
Different test profiles were used, one synthetic composi-
tion of harmonics and two field profiles. The frequency char-
acteristics and amplitudes of these profiles influenced the
results of the tests. The ranking of several BHC systems
changed with the profiles. But this is not considered specific
for the test bench. These interactions would probably be
found in field tests as well. Nevertheless, the test profiles will
need further examination. A future standard test profile
should provide practical relevance as well as sufficient selec-
tivity. Profiles derived from real field reliefs are always
debatable since they only represent local conditions. The
synthetic profile developed could be a compromise. Its fre-
quency spectrum is similar to field profiles but there is still
room for the amplitudes to be increased.
Using the test bench it was easy to evaluate the BHC
systems in height and tilt control mode separately. All BHC
systems tested perform differently when controlling boom
height or tilt. In general, the tilt control is less accurate
compared to the height control. This kind of comparison is
another big advantage of the method compared to field
tests. On the other hand, it would be no problem to use the
test bench for assessing the systems in practical mode, i.e.
height and tilt control together, applying two different
synthetic profiles to each target area unit. It is also possible
to use the test bench for specific frequency analyses
applying harmonics or white noise profiles in order to
identify critical frequencies within the design process of
BHC systems.
-500
-400
-300
-200
-100
0
100
200
300
400
0 10 20 30 40 50 60 70 80 90 100
disp
lace
men
t / m
m
time / s
profile
best (BHC2)
worst (BHC3)
Fig. 9 e Displacements of the target area (profile) and the spray boom at the position of the left side height sensor for the best
and worst BHC system in height control mode (right side profile with same sign).
-400
-300
-200
-100
0
100
200
300
400
500
600
0 10 20 30 40 50 60 70 80 90 100
disp
lace
men
t / m
m
�me / s
profile
best (BHC2)
worst (BHC4)
Fig. 10 e Displacements of the target area (profile) and the spray boom at the position of the left side height sensor for the
best and worst BHC system in tilt control mode (right side profile with opposite sign).
b i o s y s t em s e ng i n e e r i n g 1 7 4 ( 2 0 1 8 ) 1 1 5e1 2 5 123
All statistical parameters used to describe the performance
of BHC systems gave the same ranking of the systems when
tested with the synthetic profile. The statistical evaluation of
the test repetitions gave lower relative LSD values for the
Hockley-Index HI compared to SD and f10. On the other hand,
the tests using the smooth field profile showed that the
selectivity of HI and f10 is limited. For BHC systems performing
relatively well, it is likely that these parameters would reach

Table 3 e Statistical parameters obtained from eachreplication of the tests for two different BHC systems inheight and tilt control mode.
1 2 3 4 5
SD/mm
BHC3 Height 129 132 131 132 129
Tilt 158 150 151 156 150
BHC4 Height 109 105 104 105 104
Tilt 161 160 157 158 160
f10/%
BHC3 Height 59.6 58.9 59.6 58.5 60
Tilt 47.7 51.1 50.2 50.1 50
BHC4 Height 66.9 68.9 68.1 68.4 69
Tilt 50.3 53.1 51.3 49.8 51.5
HI/%
BHC3 Height 86 85 85 85 86
Tilt 79 81 81 80 81
BHC4 Height 90 91 91 91 91
Tilt 79 80 80 80 80
Table 5 e Absolute and normalised values of LSD of theparameters calculated from the test results (test set 2) fordifferent sample sizes for the comparison of eachmeasurement to a limit value (significance level 95%).
k ¼ 3 k ¼ 5
LSD LSDn/% LSD LSDn/%
SD/mm
BHC3 Height 2.6 2.0 1.4 1.1
Tilt 7.3 4.8 3.6 2.3
BHC4 Height 4.5 4.2 2.0 1.9
Tilt 3.5 2.2 1.6 1.0
f10/%
BHC3 Height 0.7 1.1 0.6 1.0
Tilt 3.0 6.0 1.2 2.4
BHC4 Height 1.7 2.5 0.8 1.2
Tilt 2.4 4.6 1.2 2.4
HI/%
BHC3 Height 1.0 1.1 0.5 0.6
Tilt 1.9 2.4 0.9 1.1
BHC4 Height 1.0 1.1 0.4 0.5
Tilt 1.0 1.2 0.4 0.5
b i o s y s t em s e n g i n e e r i n g 1 7 4 ( 2 0 1 8 ) 1 1 5e1 2 5124
their maximum value of 100%, which would not allow for
further discrimination, while deviations of the boom height
from the set value are still evident. This means that the
standard deviation SD should be used for the evaluation of
tests requiring a high selectivity, providing the tests give
sufficient statistical precision.
All results presented refer to the position of the height
sensor. This is representing the whole boom in case of height
control mode but the position of the height sensors in relation
to the boom tip may be important for the evaluation of the
results for tilt control. Considering the relatively inflexible
structure of the spray boom in vertical direction, it is possible
to calculate the actual distance of any point at the boom to any
virtual target area from the test results. But the BHC system
can only account for the target area profiles below the height
sensor positions. This is why the performance of the BHC
system should be evaluated only considering these positions.
The test bench used consists of two target area units. With
this it is possible to test only boom control systems with two
Table 4 e Statistics of the parameters calculated from the test rmultiple comparison of all variants, significance level 95%).
k ¼ 3
average s LSDt
SD/mm
BHC3 Height 131 1.5 10.4
Tilt 153 4.4
BHC4 Height 106 2.6
Tilt 159 2.1
f10/%
BHC3 Height 59 0.4 4.6
Tilt 50 1.8
BHC4 Height 68 1.0
Tilt 52 1.4
HI/%
BHC3 Height 85 0.6 2.8
Tilt 80 1.2
BHC4 Height 91 0.6
Tilt 80 0.6
sensors controlling boom height and tilt. But the test bench is
designed in amodular way. It can easily be extended to enable
tests of more complex BHC systems for spray booms with a
variable geometry. It is also planned to combine the test bench
with a shaking platform (Herbst, 2011) which can excite
sprayer movements. This is necessary for adequate testing of
BHC systems equipped with additional sensorsmeasuring the
sprayer roll angle.
Official performance limits or test schemes for boom
sprayers do not currently include BHC systems, although
these systems have become more common in recent years.
The test bench developed for this study can be considered a
potential basis of a standardised protocol for BHC assessment
as well as for the definition of performance limits. This should
allow including the BHC performance in future sprayer eval-
uation schemes.
esults (test set 2) for different sample sizes (LSDt refer to the
k ¼ 5
rank average s LSDt rank
2 131 1.5 8.1 2
3 153 3.7 3
1 105 2.1 1
3 159 1.6 3
2 59 0.6 3.5 2
3 50 1.3 3
1 68 0.8 1
3 51 1.3 3
2 85 0.5 2.1 2
3 80 0.9 3
1 91 0.4 1
3 80 0.4 3

b i o s y s t em s e ng i n e e r i n g 1 7 4 ( 2 0 1 8 ) 1 1 5e1 2 5 125
Conflicts on interest
The authors wish to confirm that there are no known conflicts
of interest associatedwith this publication and there has been
no significant financial support for this work that could have
influenced its outcome.
Acknowledgements
The authors wish to acknowledge support for the develop-
ment of the test bench from Werner Fleer. We also thank
Katrin Ahrens for her helpful advices regarding the statistical
analysis of the test results, Dirk Rautmann for proof reading
the paper and Jane Bonds for providing language help.
The project was supported by funds of the Federal Ministry
of Food and Agriculture (BMEL) based on a decision of the
Parliament of the Federal Republic of Germany via the Federal
Office for Agriculture and Food (BLE) under the innovation
support program (grant number 2815405510).
r e f e r e n c e s
DLG. (2014). 60 Gespanne stehen am Start. DLG-Mitteilungen 6/2014(pp. 14e15). Innovations-Magazin.
Griffith, J., Strelioff, B., & Schnaider, J. (2012). The Hockley Index.In American Society of Agricultural and Biological Engineers AnnualInternational Meeting 2012 (Vol. 2, pp. 1325e1332). ASABE.
Herbst, A. (2011). Bewegungsverhalten von Spritzgest€angen beiFeldspritzger€aten. VDI-Berichte, 2111, 97e102.
Jeon, H. Y., Womac, A. R., & Gunn, J. (2004). Sprayer boomdynamic effects on application uniformity. Transactions of theASAE, 47(3), 647e658.
Miller, P. C. H., Lane, A. G., O'Sullivan, C. M., Tuck, C. R., &Ellis, M. C. B. (2008). Factors influencing the risk of spray driftfrom nozzles operating on a boom sprayer. Aspects of AppliedBiology, 84, 9e16.
Nuyttens, D., De Schampheleire, M., Baetens, K., & Sonck, B.(2007). The influence of operator-controlled variables on spraydrift from field crop sprayers. Transactions of the ASABE, 50(4),1129e1140.
Wolf, P. (2002). Verteilungsqualit€at von Feldspritzger€aten. Germany:Braunschweig, Technical University (Ph.D. thesis).