a novel method for the measurement of liquid film ... · film thickness during fuel spray...
TRANSCRIPT

A novel method for the measurement of liquid
film thickness during fuel spray impingement on
surfaces
S. Henkel,1 F. Beyrau,2 Y. Hardalupas,1,* and A.M.K.P. Taylor1
1 Department of Mechanical Engineering, Imperial College London, SW7 2AZ, London, UK 2 Lehrstuhl für Technische Thermodynamik, Otto-von-Guericke-Universität Magdeburg, 39106 Magdeburg, Germany
Abstract: This paper describes the development and application of a novel
optical technique for the measurement of liquid film thickness formed on
surfaces during the impingement of automotive fuel sprays. The technique
makes use of the change of the light scattering characteristics of a metal
surface with known roughness, when liquid is deposited. Important
advantages of the technique over previously established methods are the
ability to measure the time-dependent spatial distribution of the liquid film
without a need to add a fluorescent tracer to the liquid, while the measurement
principle is not influenced by changes of the pressure and temperature of the
liquid or the surrounding gas phase. Also, there is no need for non-fluorescing
surrogate fuels. However, an in-situ calibration of the dependence of signal
intensity on liquid film thickness is required. The developed method can be
applied to measure the time-dependent and two-dimensional distribution of
the liquid fuel film thickness on the piston or the liner of gasoline direct
injection (GDI) engines.
The applicability of this technique was evaluated with impinging sprays
of several linear alkanes and alcohols with different thermo-physical
properties. The surface temperature of the impingement plate was controlled
to simulate the range of piston surface temperatures inside a GDI engine. Two
sets of liquid film thickness measurements were obtained. During the first set,
the surface temperature of the plate was kept constant, while the spray of
different fuels interacted with the surface. In the second set, the plate
temperature was adjusted to match the boiling temperature of each fuel. In
this way, the influence of the surface temperature on the liquid film created
by the spray of different fuels and their evaporation characteristics could be
demonstrated.
2016 Optical Society of America
OCIS codes: (000.2170) Equipment and techniques; (120.4820) Optical systems; (240.0310)
Thin films; (240.5770) Roughness; (290.5880) Scattering, rough surfaces; (310.6870) Thin films,
other properties
References and links
1. R. van Basshuysen and U. Spicher, Gasoline Engine with Direct Injection: Processes, Systems, Development, Potential. Wiesbaden: Springer Verlag, 2009.
2. M. C. Drake and T. D. Fansler, “Piston Fuel Films as a Source of Smoke and Hydrocarbon Emissions from a
Wall-Controlled Spark-Ignited Direct-Injection Engine,” SAE Tech. Pap. Ser., (2003–01–0547), (2003). 3. M. C. Drake and D. C. Haworth, “Advanced gasoline engine development using optical diagnostics and
numerical modeling,” Proc. Combust. Inst., 31(1), 99–124 (2007).
4. X. He, M. A. Ratcliff, and B. T. Zig, “Effects of Gasoline Direct Injection Engine Operating Parameters on Particle Number Emissions,” Energy & Fuels, 26(4), 2014–2027 (2012).
5. S. Malaguti and S. Fontanesi, “CFD Investigation of Fuel Film Formation Within a GDI Engine Under Cold
Start Cranking Operation,” Proc. 2009 Spring Tech. Conf. ASME Int. Combust. Engine Div., 555–562

(2009).
6. F. F. Zhao, D. L. Harrington, and M. C. Lai, Automotive Gasoline Direct-Injection Engines. Oxford: Society of Automotive Engineers, 2002.
7. B. D. Stojkovic, T. D. Fansler, M. C. Drake, and V. Sick, “High-speed imaging of OH* and soot temperature
and concentration in a stratified-charge direct-injection gasoline engine,” Proc. Combust. Inst., 30(2), 2657–2665 (2005).
8. M. M. Maricq, “Chemical characterization of particulate emissions from diesel engines: A review,” J. Aerosol
Sci., 38(11), 1079–1118 (2007). 9. E. Hecht, Optics. San Francisco: Addison-Wesley Longman, Incorporated, 2002.
10. T. Ohyama, K. Endoh, A. Mikami, and Y. H. Mori, “Optical interferometry for measuring instantaneous
thickness of transparent solid and liquid films,” Rev. Sci. Instrum., 59(9), 2018–2022 (1988). 11. S.-W. Kim and G.-H. Kim, “Thickness-Profile Measurement of Transparent Thin-Film Layers by White-
Light Scanning Interferometry,” Appl. Opt., 38(28), 5968–5973 (1999).
12. N. Borgetto, C. Galizzi, F. André, and D. Escudié, “A thickness measurement technique based on low-coherence interferometry applied to a liquid film with thermal gradient,” Exp. Therm. Fluid Sci., 34(8), 1242–
1246 (2010).
13. F. Gao, H. Muhamedsalih, and X. Jiang, “Surface and thickness measurement of a transparent film using wavelength scanning interferometry.,” Opt. Express, 20(19), 21450–6 (2012).
14. X. Jiang, K. Wang, F. Gao, and H. Muhamedsalih, “Fast surface measurement using wavelength scanning
interferometry with compensation of environmental noise,” Appl. Opt., 49(15), 2903–2909 (2010).
15. S. K. Debnath, M. P. Kothiyal, J. Schmit, and P. Hariharan, “Spectrally resolved phase-shifting interferometry
of transparent thin films: sensitivity of thickness measurements.,” Appl. Opt., 45(34), 8636–40 (2006).
16. X. S. Wang and H. H. Qiu, “Fringe probing of liquid film thickness of a plug bubble in a micropipe,” Meas. Sci. Technol., 16(2), 594–600 (2005).
17. A. Kariyasaki, Y. Yamasaki, M. Kagawa, T. Nagashima, A. Ousaka, and S. Morooka, “Measurement of
Liquid Film Thickness by a Fringe Method,” Heat Transf. Eng., 30(1–2), 28–36 (2009). 18. M. Kuhner and E. Sackmann, “Ultrathin hydrated dextran films grafted on glass: Preparation and
characterization of structural, viscous, and elastic properties by quantitative microinterferometry,” Langmuir, 12(20), 4866–4876 (1996).
19. G. Wiegand, K. R. Neumaier, and E. Sackmann, “Microinterferometry: Three-Dimensional Reconstruction
of Surface Microtopography for Thin-Film and Wetting Studies by Reflection Interference Contrast Microscopy (RICM),” Appl. Opt., 37(29), 6892–6905 (1998).
20. I. B. Ozdemir and J. H. Whitelaw, “An Optical Method for the Measurement of Unsteady Film Thickness,”
Exp. Fluids, 13(5), 321–331 (1992). 21. C. Schulz and V. Sick, “Tracer-LIF diagnostics: quantitative measurement of fuel concentration, temperature
and fuel/air ratio in practical combustion systems,” Prog. Energy Combust. Sci., 31(1), 75–121 (Jan. 2005).
22. A. C. Eckbreth, Laser Diagnostics for Combustion Temperature and Species. Amsterdam: Gordon and Breach Publishers, 1996.
23. M. Alonso, P. J. Kay, P. J. Bowen, R. Gilchrist, and S. Sapsford, “A laser induced fluorescence technique for
quantifying transient liquid fuel films utilising total internal reflection,” Exp. Fluids, 48(1), 133–142 (2010). 24. T. Fujikawa, Y. Hattori, M. Koike, K. Akihama, T. Kobayashi, and S. Matsushita, “Quantitative 2-D fuel
distribution measurements in a direct-injection gasoline engine using laser-induced fluorescence technique,”
JSME Int. J. Ser. B-Fluids Therm. Eng., 42(4), 760–767 (1999). 25. Y. Cheng, K. Deng, and T. Li, “Measurement and simulation of wall-wetted fuel film thickness,” Int. J.
Therm. Sci., 49(4), 733–739 (2010).
26. F. Schulz, J. Schmidt, and F. Beyrau, “Development of a sensitive Experimental Set-up for LIF Fuel Wall Film Measurements in a Pressure Vessel,” Accept. Publ. Exp. Fluids, (2015).
27. I. Duewel, J. Schorr, P. Peuser, P. Zeller, J. Wolfrum, and C. Schulz, “Spray diagnostics using an all-solid-
state Nd:YAlO3 laser and fluorescence tracers in commercial gasoline and diesel fuels,” Appl. Phys. B, 79(2), 249–254 (2004).
28. R. Domann and Y. Hardalupas, “Spatial distribution of fluorescence intensity within large droplets and its
dependence on dye concentration,” Appl. Opt., 40(21), 3586–3597 (2001). 29. M. Davy, P. Williams, D. Han, and R. Steeper, “Evaporation characteristics of the 3-pentanone-isooctane
binary system,” Exp. Fluids, 35(1), 92–99 (2003).
30. D. Greszik, H. Yang, T. Dreier, and C. Schulz, “Laser-based diagnostics for the measurement of liquid water film thickness,” Appl. Opt., 50(4), A60–A67 (2011).
31. I. K. Kabardin, V. G. Meledin, I. a. Eliseev, and V. V. Rakhmanov, “Optical measurement of instantaneous
liquid film thickness based on total internal reflection,” J. Eng. Thermophys., 20(4), 407–415 (2011).
32. C. H. Hidrovo and D. P. Hart, “Emission reabsorption laser induced fluorescence (ERLIF) film thickness
measurement,” Meas. Sci. Technol., 12(4), 467–477 (2001).
33. A. A. Mouza, N. A. Vlachos, S. V. Paras, and A. J. Karabelas, “Measurement of liquid film thickness using a laser light absorption method,” Exp. Fluids, 28(4), 355–359 (2000).
34. B. Commoner and D. Lipkin, “The Application of the Beer-Lambert Law to Optically Anisotropic Systems,”
Science (80-. )., 110(2845), 41–43 (1949). 35. H. Yang, D. Greszik, T. Dreier, and C. Schulz, “Simultaneous measurement of liquid water film thickness

and vapor temperature using near-infrared tunable diode laser spectroscopy,” Appl. Phys. B, 99(3), 385–390
(2010). 36. G. M. Hale and M. R. Querry, “Optical Constants of Water in the 200-nm to 200-micrometer Wavelength
Region,” Appl. Opt., 12(3), 555–563 (1973).
37. M. C. Fansler, T.D., Drake, “Optical Diagnostics Applied to Spark-Ignited Direct-Injection Engine Development,” 5. Int. Symp. fuer Verbrennungsdiagnostik, Baden-bad., (2002).
38. M. E. Drake, M.C. , Fansler, T.D. , and Rosalik, “Quantitative high-speed imaging of piston fuel films in
direct-injection engines using a refractive-index- matching techniquee,” ILASS-02 – 15th Annu. Conf. Liq. At. Spray Syst. Madison, WI, (2002).
39. B. Yang and J. Ghandhi, “Measurement of Diesel Spray Impingement and Fuel Film Characteristics Using
Refractive Index Matching Method,” SAE Tech. Pap. Ser., (2007–01–0485), (2007). 40. D. Maligne and G. Bruneaux, “Time-Resolved Fuel Film Thickness Measurement for Direct Injection SI
Engines Using Refractive Index Matching,” SAE Tech. Pap. Ser., (2011–01–1215), (2011).
41. Q. Lu, N. V Suryanrayana, and C. Christododoulu, “Film Thickness Measurement with an Ultrasonic Transducer,” Exp. Therm. Fluid Sci., 7(4), 354–361 (1993).
42. P. C. Pedersen, Z. Cakareski, and J. C. Hermanson, “Ultrasonic monitoring of film condensation for
applications in reduced gravity,” Ultrasonics, 38(1–8), 486–490 (2000). 43. M. W. E. Coney, “The theory and application of conductance probes for the measurement of liquid film
thickness in two-phase flow,” J. Phys. E., 6(9), 903 (1973).
44. T. Fukano, “Measurement of time varying thickness of liquid film flowing with high speed gas flow by a
constant electric current method (CECM),” Nucl. Eng. Des., 184(2–3), 363–377 (1998).
45. P. Seleghim and E. Hervieu, “Direct imaging of two-phase flows by electrical impedance measurements,”
Meas. Sci. Technol., 9(9), 1492–1500 (1998). 46. M. R. Ozgu, J. C. Chen, and N. Eberhardt, “A capacitance method for measurement of film thickness in two-
phase flow,” Rev. Sci. Instrum., 44(12), 1714–1716 (1973).
47. J. F. Klausner, L. Z. Zeng, and D. M. Bernhard, “Development of a film thickness probe using capacitance for asymmetrical two-phase flow with heat addition,” Rev. Sci. Instrum., 63(5), 3147–3152 (1992).
48. M. Raffel, C. E. Willert, S. T. Wereley, and J. Kompenhans, Particle Image Velocimetry: A Practical Guide. Heidelberg: Springer, 2007.
49. J. Weickert, “A review of nonlinear diffusion filtering,” in Scale-Space Theory in Computer Vision SE - 1,
1252, B. Haar Romeny, L. Florack, J. Koenderink, and M. Viergever, Eds. Springer Berlin Heidelberg, 1–28 1997.
50. J. Weickert, B. M. T. H. Romeny, and M. A. Viergever, “Efficient and reliable schemes for nonlinear
diffusion filtering,” Image Process. IEEE Trans., 7(3), 398–410 (1998). 51. S. Pfadler, F. Beyrau, and A. Leipertz, “Flame front detection and characterization using conditioned particle
image velocimetry (CPIV),” Opt. Express, 15(23), 15444–15456 (2007).
52. “NIST Chemisrty Webbook,” NIST Standard Reference Database Number 69. [Online]. Available:
http://webbook.nist.gov/chemistry/.
1. Introduction
Wall wetting is a widely observed phenomenon in many engineering applications. This process
describes the formation of a liquid layer on a solid surface. In applications where a liquid spray
is injected into a chamber this is usually an unwanted problem. One particular example of this
process is the piston wetting during the fuel injection process [1] inside a gasoline direct
injection engine. In this context, previous experiments showed a connection between particulate
emissions at the exhaust and the formation of a fuel liquid film on the piston. During the
combustion process, wall wetting can lead to pool fires linked with rich diffusion flames on top
of the liquid deposit [2–7]. This can contribute to unwanted increase in pollutant formation and
an increase of unburned hydrocarbons due to insufficient mixing between air and fuel [2]. It
becomes more and more important for car manufacturers to minimize these effects, since
governmental regulations demand a low threshold of emissions from modern cars [8]. As such,
it is of great interest to get a better understanding of the physical process involved in liquid fuel
deposition and subsequent evaporation and the influence of the fuel characteristics and surface
temperatures.
One family of techniques for liquid film thickness measurements is based on
interferometry. This principle links the interference of two or more scattered light waves from
the liquid film to form a spatial interference fringe pattern [9]. This interference pattern can
yield information about the thickness of transparent liquid films [10, 11]. There are several
different versions of interferometry used to investigate thin liquid films. Borgetto et al. [12]

used low-coherence interferometry (LCI) to measure liquid film thickness of linear alkanes. In
their case, a super luminescent LED (light emitting diode) was used as a light source to
illuminate the film and create interference patterns. From the spacing between individual
maxima in the interferogram, it was possible to measure the film thickness. Gao et al. [13] used
wavelength scanning interferometry to investigate transparent films. Combining a white light
interferometer with a near-infrared super luminescent light-emitting diode interferometer, it was
possible to measure the liquid film thickness, while compensating for environmental noise and
vibrations at the same time [13, 14]. Debnath et al. [15] used spectrally resolved phase-shifting
interferometry to investigate thin transparent films illuminated by a white light source. They
were able to measure the thickness of a thin transparent film on a reflecting substrate by
analysing the phase shift in spectrally resolved interferograms. All presented methods of
interferometry have a common limitation that they can only measure along a line. Also, the
temporal resolution of the technique is somewhat limited. This means that, for investigations of
highly unsteady liquid deposits, these techniques might not be reliable.
Similar to the interferometry method is the so-called fringe method. This technique is often
used to measure the thickness of liquid films in capillaries or investigate two phase flows inside
small diameter tubes [16]. Kariyasaki et al. [17] showed that this technique can also be used to
measure the film thickness of thin transparent films on top of a solid surface. By using parallel
illumination of the liquid film with a coherent light source at a fixed angle, it is possible to
create fringe patterns [18, 19] due to the fact that the liquid film is not perfectly uniform across
the surface. Therefore, the parallel light gets refracted and reflected at different locations of the
film. The reflected and refracted light can interfere and create a spatial fringe pattern that
changes with the local film thickness. Since the fringe pattern is formed at the surface of the
liquid film, precise focusing of the optical system is necessary. Kariyasaki et al. [17] used a
microscope with a CCD camera to generate and record the fringe patterns. They presented
thickness profiles across the spatial distribution of a liquid film. In another set of experiments,
they showed that it is possible to track and quantify an evaporating hexane film over time by
using shorter exposure times and higher recording frequencies. The advantage of the fringe
method is its high sensitivity on the local film thickness, even in multi-phase flows [17]. With
the presented realisation of this technique, however, it is only possible to measure along a line
and not in two dimensions. Furthermore, the temporal resolution illustrated with a volatile liquid
at room temperature might not be sufficient at higher temperatures, especially if the boiling
point of the liquid is exceeded. Additionally, the rather complex optical alignment might limit
the in-situ application of this technique to an injection chamber or pressure vessel, where the
angle of illumination is fixed and the optical distance to the specimen may be large.
Another technique based on the fringe pattern formation was used by Ozdemir and
Whitelaw [20]. They derived an analytical correlation between the interferometric fringe pattern
and the thickness of an unsteady liquid film. Solving for the optical transformation function of
their optical setup, the intensity fluctuations created by the fringes could be linked to the film
thickness without the need for a separate calibration. Using a photodiode to detect the signal,
they were able to achieve a high temporal resolution. However, the recordings only yielded
time-dependent liquid film thickness measurements at a point, similar to the techniques
discussed earlier.
Probably the most commonly applied technique to investigate liquid deposits on solid
surfaces is based on Laser Induced Fluorescence (LIF) [21]. Fluorescence describes the
spontaneous emission of radiation from an electronically excited molecule. In the case of LIF,
this excitation is generated by the laser light source [22]. This method requires a fluorescent
proxies to be present in the liquid. This can be either one of the components of the liquid itself
or a fluorescent dye added to the liquid. In both cases, a laser is used to excite the tracer
molecules, which then emit a fluorescence signal. If the laser intensity and the concentration of
the tracer in the liquid are constant, it is possible to relate the recorded fluorescent intensity
signal to the amount of liquid on the surface [21]. Also, with the use of appropriate optical

components, it is possible to illuminate the entire liquid film. In this way, the emitted fluorescent
intensity from the entire area of the liquid deposit can be captured, usually with a CCD camera,
which includes information on the local film thickness. With such an optical setup it is possible
to obtain spatially and temporally resolved information. However, selecting the tracer can be
challenging for this kind of application [23]. Ideally, the tracer should yield a strong fluorescent
intensity signal, while remaining proportional to the concentration of the tracer and insensitive
to changes, such as pressure and temperature. Also, the tracer should show the same physical
behaviour as the investigated fuel. This means properties like evaporation rate, diffusivity,
convection, surface tension and viscosity should be the same. In practical applications it is
usually not possible to find a tracer which meets all of these requirements [23]. For
investigations that involve multi-component liquid fuels, like gasoline, it is common to replace
the original fuel with a mixture of a fluorescent tracer and non-fluorescing fuel substitute. This
can be 3-pentanone which is excitable with a UV laser and iso-octane as a non-fluorescing
surrogate fuel [23–26]. However, the evaporation behaviour of this fuel is, depending on the
conditions, certainly not directly comparable to that of real gasoline. In a scenario where a set
of real gasoline blends need to be investigated, such substitution of a fuel component is not an
option. Alternatively, it is possible to add a strongly fluorescent dye which acts as the tracer
substance to the real fuel. These dyes have a very high fluorescence yield, which means only
small amounts need to be added to the fuel [27]. This way the physical properties of the liquid
remain largely unchanged, usually without any effect on the measurement. However, care
should be taken to ensure that the absorption of the incident light within thick liquid films does
not lead to a non-linear dependence of the fluorescent intensity on the fluorescent dye
concentration [28]. The downside of this concept is that they do not co-evaporate with the liquid
of interest [29] and the dye concentration changes over time. This means it is not possible to
obtain a reliable time-dependent signal of the evaporating liquid deposit. Consequently, only
films which are not significantly affected by evaporation can be investigated in order to
minimize this error. Both approaches, with an added dye or a liquid tracer, have the
disadvantage that by illuminating the liquid film it is very likely that the region above the liquid
film is also illuminated. This means that the fluorescent intensity signal not only corresponds to
the actual liquid film but also to the areas above it. Alonso et al. [23], Greszik et al. [30] and
Kabadin et al. [31] developed a method to overcome this issue. By coupling the light source
into the glass plate where the liquid deposit is formed on, it is possible to achieve total internal
reflection between the glass plate and the surrounding air. Hence, the light escapes from the
glass plate only at those positions where it is covered by a liquid layer. To further improve the
LIF technique, Hidrovo et al. [32] presented a method called reemission reabsorption laser
induced fluorescence. Essentially, the physical fundamentals are based on LIF, however, it uses
emission and subsequent reabsorption of two different dyes instead of pure fluorescence of a
single tracer. The absorption and emission spectra were selected in a way that the fluorescent
wavelength of the first dye overlapped with the absorption spectrum of the second. The latter
then fluoresces at a third wavelength. By calculating the ratio between the two fluorescence
signals, it was possible to very accurately determine the actual film thickness, because effects
such as reflection and changes in illumination intensity were cancelled out. The detection of
two wavelengths, however, makes the optical setup more complex compared to ordinary LIF.
Hidrovo et al. [24] used two CCD cameras equipped with optical filters and mounted on the
same lens with an optical-path-splitting module. In this way, it was possible to ensure good
overlap between the two images and achieve very high accuracy during their measurements.
Furthermore, using the fluorescence intensity ratio makes the calibration independent of the
optical characteristics of a particular setup as they are cancelled out by the normalisation. The
downside of the reabsorption method is the limited range of film thicknesses it can be applied
to. The main factor is the necessity of an optically thick medium with enough reabsorption to
be able to accurately quantify the thickness. In combination with the non-evaporative behaviour

of the dyes, this technique might not be reliable enough for investigations of evaporating fuel
deposits.
An additional laser based technique to measure liquid film thicknesses is the laser light
absorption method. Mouza et al. [33] used the absorption of light from a diode laser passing
through a thin liquid film which contained a dye. Using the law of Beer and Lambert, it is
possible to determine the film thickness by measuring the absorption ratio in a calibrated system
[34]. The light source used in these experiments was a low power diode laser. The signal was
recorded with a silicon photodiode at a fixed distance from the light source. This setup yielded
zero-dimensional measurements. In the case of a steady film, it would be possible to move the
laser and detector along a line across the film. Consequently, spatial information of the liquid
deposit would be available. Generally, this particular method is very similar to the dye based
LIF technique, only the physical principle is different. This means that the advantages and
disadvantages also apply here. Dye based absorption measurements yield a good signal with
very little tracer concentration. The dye used by Mouza et al. [33] was methylene blue, which
does not co-evaporate and hence is only suitable for non-evaporating deposits or measurements
with no temporal resolution. Yang et al. [35] used a near-infrared (NIR) diode laser to measure
the thickness of liquid water films. In these experiments, the addition of a tracer is not necessary,
since liquid water shows broad band absorption for infrared light [36]. In order to further
separate the absorption signal from any background noise, they used two diode lasers of
different IR wavelength, both being absorbed by water. Since the absorption spectrum of water
changes with temperature, it was also possible to obtain temperature information. A later work
by Greszik et al. [30] compared this method to LIF and spontaneous Raman scattering. As a
result they were able to show that both the spontaneous Raman and the NIR based techniques
can capture the evaporation behaviour of water films very well. However, not all liquids, such
as gasoline, absorb at the NIR range. This would mean that in such applications a chemical
tracer would be necessary. This fact causes the same dilemma for this type of investigations as
the LIF based methods.
A rather novel optical technique used to investigate liquid deposits called Refractive Index
Matching (RIM) was developed by Drake et al. [37] and first presented in 2002 [2, 37, 38]. It
was used to quantitatively analyze liquid deposit formation on the glass piston surface of an
optically accessible gasoline direct injection engine. Due to the temperature changes during the
cycles of the engine, the use of a LIF based method was not favored, because of the temperature
dependence of the fluorescent signal. Refractive Index Matching provides quantitative
information about the fuel deposit with large temporal and spatial resolution while remaining
insensitive to temperature and pressure variations. Also, this method works for single and multi-
component fuels [2]. The physical basis of RIM is that light scattering behavior of a rough glass
plate is changing with the thickness of a liquid deposit on top of it. The refractive index of the
liquid and the glass are approximately matching. The observed change can then be correlated
to the thickness of the liquid by using an appropriate calibration. Yang et al. [39] were using
RIM to investigate impinging Diesel sprays in a heated test chamber and the effect of changing
air temperature on the deposit. Maligne et al. [40] used the Refractive Index Matching technique
to conduct time resolved measurements of fuel deposit formed by a gasoline spray impinging
on a glass plate. Overall RIM has the advantage of making a tracer addition unnecessary and
being independent of temperature and pressure changes. However, the use of a glass piston
instead of the actual metal piston in an engine might change the heat flux into the liquid deposit
and therefore its evaporation behaviour. This could hinder investigations focusing on exactly
this process.
Apart from optical methods presented here, there are also acoustic techniques used to
investigate liquid films. Commonly, these are utilising ultrasonic waves, which are attenuated
and reflected due to discontinuities created by liquid/gas interfaces. The application of different
iterations of acoustic techniques can be found in [41] and [42].

As a final class, electrical techniques shall be mentioned. These are split into conductance-
based and capacitance-based methods. The former uses electrodes to generate an electrical
potential difference. The resulting current between the electrodes can be related to the liquid
film thickness. Applications are presented in [43–45]. The capacitance method uses two parallel
metal plates to form a capacitor by applying electrical current to them. The capacitance is then
changed if a liquid film is present. This change can be linked to the thickness of the deposit.
Further details can be found in [46] and [47].
In the presented study a new technique was developed to investigate liquid deposits created
by impinging sprays, similar to those found in direct injection engines. Similar to RIM, the
technique relies on the change of the light scattering behaviour of a rough solid surface, once
liquid is applied. In this case, however, a treated metal plate was used instead of a glass piston.
With the use of a rough metal surface, it was possible to resemble the conditions found inside
the cylinder of an engine more closely, compared to other techniques. The temperature of the
metal surface was adjustable, which allowed insight into the effect of the surface temperature
on the liquid deposit.
2. Experimental setup
The experimental setup presented in Fig. 1 comprises of an injection chamber with the injector,
an impingement plate and a fuel preparation section. The injection chamber consisted of a
cubical frame with a length of 300 mm. It was mounted on a metal base plate elevated with feet,
allowing for the connection of a vapour extraction system. The sides of the chamber could be
closed with polycarbonate windows and sealed off with rubber gaskets. Also the contact area
between the frame and the base plate was sealed with rubber foaming. In this way, stable
ambient conditions could be achieved and maintained. The rear of the chamber was closed with
an aluminium plate that formed the support of the impingement plate. The hollow impingement
plate was mounted with aluminium brackets and could be purged with conditioned silicone oil
(Rhodorsil 47V100, Bentley Advanced Materials). The plate was connected to a heat exchanger
(Julabo ME-12, Julabo UK LTD), which could control the plate temperature automatically with
the help of a temperature sensor inside the plate. Furthermore, the surface temperature was
checked with a k-type thermocouple. An additional air heater (LHS 21L System, Leister AG)
could be used to stabilise the ambient temperature inside the injection chamber.
Fig. 1. Overview of the experimental setup with a schematic of the camera and light source arrangement.

The top was also closed with an aluminium plate providing structural support for the
injector mount and the optional air heating manifold. The injector sat in a custom designed
aluminium mount and was held into place with a brass cap. The fit between those two
components was designed to provide enough seal for fuel pressures larger than 150 bar. The
high pressure fuel line was connected to the brass cap with compression fittings (Swagelok
Company).
The injected fuel was conditioned in a fuel preparation section. A pneumatically actuated
pump was supplying fuel from a reservoir to the system at pressures of 150 bar. The fuel
pressure was adjusted with a needle valve and controlled via a pressure gauge connected to the
fuel line. A pressure cylinder was installed between the pump and the injector to dampen any
pressure fluctuations caused by the opening of the injector. A drain valve at the bottom of the
section allowed for purging the system and replacing the fuel with a different blend. Also a
bleeding and pressure relief valve was installed in order to remove the air from inside the system
and relieve the fuel pressure if necessary.
The injector was powered and actuated with an engine control unit ECU, controlled by a
custom build triggering unit. The injector was a purpose built single hole model injector
producing a spray angle of 20°. The injection duration was set to 1.50 ms by the injector control
unit.
The development of the measurement technique and all in-situ measurements were
performed on a stainless steel metal plate with a surface roughness of Ra=60 µm (Blackburns
Metal LTD). Comparison experiments were done using a quartz glass plate of the same surface
roughness (manufactured by UQG optics). Different Ra values were tested and a roughness of
60 µm was eventually selected for the final technique development steps and the later
measurements to have enough headroom for potential large liquid film thicknesses during
measurements applying this technique. The individual measurement limits are determined by
the Ra values. During the development stages it became apparent that the sensitivity threshold
of the technique is at around 30% of the Ra. Liquid films with larger thicknesses cannot be
resolved reliably beyond this threshold, for a respective surface roughness.
The development of the measurement technique and the comparison between metal and
glass plates were performed with a Pike F-032 CCD camera from Allied Vision Technologies.
This 14 bit monochromatic camera had a resolution of 640x480 pixels and provided sufficient
resolution, dynamic range and sensitivity to quantify a wide range of film thicknesses. The
recording rate was 10 frames per second with an exposure of 5 ms. The images were recorded
with Allied Vision’s SmartView software and stored as a bitmap series. These recordings were
subsequently analysed in Matlab 2013b (MathWorks, Inc).
All time resolved measurements involving sprays in the injection chamber were performed
with a high speed CMOS camera of the type HighSpeedStar 6 from LaVision GmbH. The image
resolution was 1024x1024 with a digitisation depth of 12 bit. Images were recorded at a frame
rate of 2000 fps and an exposure time of 0.5 ms. The camera was mounted with its viewing axis
tilted downwards from the horizontal by 10º. A Scheimpflug adapter was set to 20º to improve
the depth of field [48]. The injection system was triggered by the high speed controller of the
camera, in order to synchronise the recording with the injection. The raw images were captured
in Davis 7.2 (LaVision GmbH) and processed in Matlab 2013b using the same basic algorithms
as for the images acquired during the methodology development phase.
In all cases a 50 W halogen light source was used which was placed close the camera lens
at an angle of about 40° relative to the orientation of the impingement plate and 10° relative to
the camera as indicated in Fig. 1 (please note that the light source is not shown in the actual
photograph of the experimental setup, but only in the schematic drawing). The illumination
cone of the light bulb had an angle of. The bulb was powered by a 12 V DC power supply
(IPS1810H, ISO-TECH) to avoid fluctuations in the illumination intensity.
During the development of the methodology, several factors influencing the sensitivity and
reliability of the results, were investigated. The angle of the optical setup (light source, camera)

play a significant role. Additionally, the feasibility range of the measurements depend on the
surface roughness of the plate, which needs to be selected according to the expected range of
film thicknesses. In general, it was found that the light source positioned close to the camera is
preferred for this application with the camera at a larger angle. Due to the restricted optical
access to the injection chamber, the described optical arrangement was found to be the optimum
for these experiments.
3. Development of the liquid film thickness measurement
3.1 Fundamental principle
The basic principle of the technique for the measurement of liquid film thickness is the change
of scattering patterns of a roughened surface exposed to liquid deposit of varying thickness. The
fundamental mechanism underlying this technique is shown in Fig. 2.
Fig. 2. Optical surface phenomena in case of a roughened metal plate without (a) and with (b)
liquid covering the surface.
In case of a homogeneously roughened metal surface incident light illuminating the plate
at a defined angle is scattered diffusely in all directions. Part of the light is scattered towards
the detector, which is located well outside the specular reflection angle. When a liquid is
deposited on the surface a partially smooth surface is created. For this reason the part of the
incident light which is reflected specularly increases, while the amount of the light that is
scattered towards the detector is reduced. The actual amount of specular reflection depends on
the extent of the smooth part of the surface, which increases with the amount of liquid on the
plate until the thickness of the liquid layer is larger than the roughness. By carefully selecting
the angle of the incident light and the angle of detection relative to the metal plate, it is possible
to correlate this intensity change ,R x y to the actual thickness of the liquid deposit:
0
,, 1
,
liqi x y
R x yi x y
(1)
with
0 0, , , ,i x y i x y f d x y (2)
where 0
i is the local intensity without any liquid present, liq
i the respective intensity with a
liquid film covering the surface, d the thickness of the film and x and y are the local
coordinates. Note that the function ,f d x y is nonlinear and that it is based on a calibration
which is only valid if the optical setup is kept unchanged.
In order to verify these assumptions, tests were performed comparing the metal surface to
a glass surface at ambient temperature, following the approach of the Refractive Index Matching

method presented by Drake et al. [38]. For this purpose, both the metal and the glass plates were
installed and tested in the fuel injection chamber. The angles of the light source and the camera
were kept the same in each case. The fuel injection was triggered by the initiation of recording
by the camera, making sure to record the entire process, which included the surface before and
after impingement. Please note that it is not possible to record reliable data during the actual
injection process, because the spray is blocking the direct line of sight of the liquid film.
From the recorded images, the average normalised intensity 0liq
i i was calculated for an
area of 5x5 mm2 at the centre of the liquid film. The selected area of each frame was divided by
the same area of the reference frame without a liquid. The results for both plates are presented
in Fig. 3.
Fig. 3. Comparison of the area averaged normalised intensity of a roughened metal ( ) and a
roughened glass plate ( ).
The overall shape of both curves looks very similar, only the sensitivity (i.e. the change of
the scattered light intensity) is different. Before the fuel injection, the normalised intensity
equals one. The impingement of the spray results in the formation of a liquid deposit and, as
such, causes a sudden decrease of the normalised intensity. Over time, as the liquid deposit
evaporates, the intensity gradually increases again. It should be noted that the images were not
corrected for noise, which is why the values do not become unity again. Both plots are
comprised of segments with different slopes. In general, the evaporation process is significantly
quicker with the metal plate, probably caused by the larger thermal conductivity of the metal.
In comparison to the glass plate, the metal plate shows a smaller sensitivity. The smallest value
of the normalised intensity for the metal plate in this test is approximately twice as large as that
for the glass plate (appr. 0.6 for metal and 0.3 for glass). A possible explanation could be that
for the non-transparent metal plate, the effect of refracted light is missing. This means that the
incident light always gets reflected and scattered completely. Despite this difference, the results
provide good evidence that, with an appropriate calibration, it is possible to correlate the
intensity change to the actual film thickness of the deposit, as both cases are able to portray the
multi-phased evaporation behaviour of the liquid.
3.2 Calibration method and data processing
In order to calibrate the optical setup, known volumes of liquid were applied to a well-defined
area on the metal surface, while recording images with the CCD camera. Due to capillary forces
generated by the surface asperities, the liquid spreads immediately after getting in contact with
the surface [39]. Dodecane was chosen as a calibration liquid, because of its low volatility.
Furthermore, its wettability on metal surfaces proved to be very good. Using this liquid, it was
possible to generate very thin films while minimising systematic errors caused by evaporation.
In order to verify this, 1 µl of dodecane was dropped on a rough metal plate, which was placed
on a micro balance (R200D, Sartorius Research) at room temperature. Over the course of 10
minutes the change in mass was less than 0.5%. Based on this, the amount of dodecane was
considered to be stable for the duration of each calibration point. The liquid was applied to the
surface with the help of a microliter pipette (Rainin Classic PR2 0.1-2 µL, Anachem Ltd). In
order to define the area of the metal plate that the liquid can cover, a circular paraffin boundary,
approximately 15 mm in diameter, was created with a PAP pen (Marker PAP PEN
Immunostaining, VWR). As such, it was possible to not only generate very thin films, but also
create homogeneous thicknesses significantly larger than 10 µm. An important advantage of the
technique is that the calibration is independent of the liquid that is used, as long as the reflective
index has the same magnitude and the wetting behaviour is similar. Therefore, the calibration
with dodecane is valid for all liquids with a similar refractive index, which is the case for the
fuels investigated here.
In order to obtain a calibration function based on Eq. (1), known volumes of dodecane were
deposited on the roughened metal plate while recording images. The recorded images at the
beginning with no liquid on the surface were used to calculate the initial intensity 0.i Once the
liquid film was spread evenly across the surface, series of images were obtained from which the
intensity liqi could be calculated. By repeating these steps with different amounts of liquid, it
was possible to derive the relation between liquid film thickness d and the change of intensity
ratio .R After recording the images with the CCD camera, several processing steps were
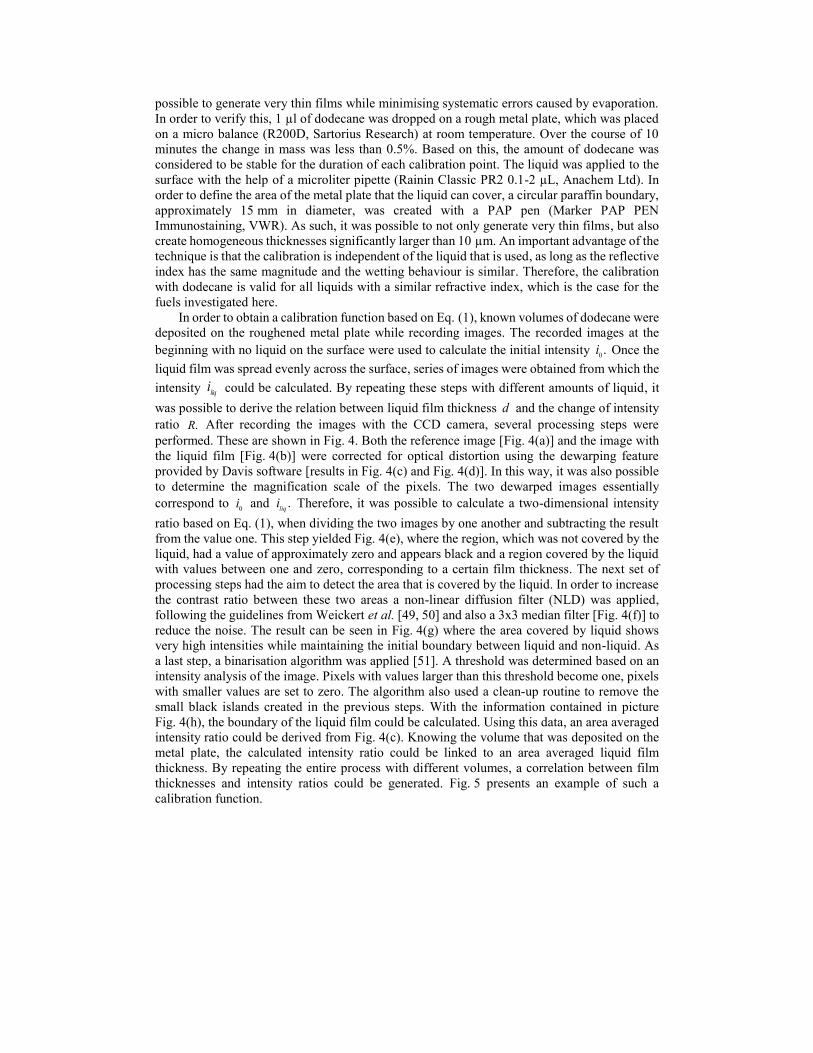
performed. These are shown in Fig. 4. Both the reference image [Fig. 4(a)] and the image with
the liquid film [Fig. 4(b)] were corrected for optical distortion using the dewarping feature
provided by Davis software [results in Fig. 4(c) and Fig. 4(d)]. In this way, it was also possible
to determine the magnification scale of the pixels. The two dewarped images essentially
correspond to 0
i and .liqi Therefore, it was possible to calculate a two-dimensional intensity
ratio based on Eq. (1), when dividing the two images by one another and subtracting the result
from the value one. This step yielded Fig. 4(e), where the region, which was not covered by the
liquid, had a value of approximately zero and appears black and a region covered by the liquid
with values between one and zero, corresponding to a certain film thickness. The next set of
processing steps had the aim to detect the area that is covered by the liquid. In order to increase
the contrast ratio between these two areas a non-linear diffusion filter (NLD) was applied,
following the guidelines from Weickert et al. [49, 50] and also a 3x3 median filter [Fig. 4(f)] to
reduce the noise. The result can be seen in Fig. 4(g) where the area covered by liquid shows
very high intensities while maintaining the initial boundary between liquid and non-liquid. As
a last step, a binarisation algorithm was applied [51]. A threshold was determined based on an
intensity analysis of the image. Pixels with values larger than this threshold become one, pixels
with smaller values are set to zero. The algorithm also used a clean-up routine to remove the
small black islands created in the previous steps. With the information contained in picture
Fig. 4(h), the boundary of the liquid film could be calculated. Using this data, an area averaged
intensity ratio could be derived from Fig. 4(c). Knowing the volume that was deposited on the
metal plate, the calculated intensity ratio could be linked to an area averaged liquid film
thickness. By repeating the entire process with different volumes, a correlation between film
thicknesses and intensity ratios could be generated. Fig. 5 presents an example of such a
calibration function.

Fig. 4. Image processing to derive the calibration function
Fig. 5. Calibration points ( ) obtained during the calibration procedure are shown with a double exponential fit ( ), error approximation ( ) and the calibration function.
In this case, the calibration function was derived from a least squares fit method using a
double exponential function in the form of
bx dxy a e c e e (3)
The dashed lines indicate an uncertainty of 1.25 µm in film thickness, which corresponds to a
volume of approximately 0.2 µl (10% of the pipette maximum) of liquid. With this
approximation it can be seen that the sensitivity of the method varies notably with the thickness
of the liquid film. Basically, the plot can be split into two regions. Between zero and about 0.4
intensity ratio there is a high sensitivity towards changes in the film thickness. For intensity
ratio values larger than 0.5 the calibration becomes very insensitive, which is why thicknesses
larger than 0.25 mm cannot be captured reliably with this setup. A change in the optical

arrangement or a different roughened metal plate would be necessary to further extend the
measurement range towards larger values.
The data processing used for analyzing the measurements follows similar image processing
steps as the calibration. Using the dewarped images before [Fig. 6(a)] and after [Fig. 6(b)] the
liquid impingement on the surface, the intensity ratio was calculated. By applying the
calibration function, the actual two-dimensional film thickness could be calculated as shown in
Fig. 6(d). Essentially, this process yields the quasi-instantaneous two-dimensional information
of the liquid film thickness, from which the cumulative deposit volume can also be calculated.
If these steps are repeated for all the recorded high speed images, one can calculate the total
volume of the liquid film over time.
Please note that this is a line of sight measurement technique. Because of this it is not
possible to reliably detect the liquid film during the impingement as the spray impedes direct
view of the liquid film. Once the injection is complete and the spray itself is gone reliable data
of the wall deposit can be obtained.
Fig. 6. Image processing used to analyse liquid films: dewarped images before (a) and after (b)
the impingement, the calculated intensity ratio (c) and the actual film thickness after applying the calibration function (d).
4. Measurement uncertainty
The optical alignment angles of the camera and the light source relative to the impingement
plate play a significant factor for the measurement technique. During the development of the
technique it was found that a shallow angle leads to an oversensitive setup, where even very
thin liquid films already lead to intensity ratios larger than 0.5. This also makes the technique
very insensitive towards changes of thicker liquid films. At the other end of the spectrum are
angles that cause direct reflections of the light source towards the camera. These need to be
avoided completely. This issue might not be evident without a liquid film on the rough surface
because the incident light gets scattered evenly and the surface appears grey. Once a deposit is
partially smoothing the rough surface, regions of very high intensity are recorded. The intensity
values associated with these areas are larger than those without a liquid which would result in
a negative intensity ratio and makes the measurement invalid. The angles that were chosen for
the present experimental setup were mainly determined by the compromise between sensitivity,
measurement range and optical access of the setup. By using a different light source and
recording optics (e.g. endoscope or fibre optics) it would be possible to extend the range of the
alignment angles and thus broaden the applicability of the setup, especially in optical engines
with limited access.
Other factors that contribute to measurement uncertainty can be split into two categories,
errors that affect the calibration procedure and errors that occur during measurements. When
calibrating the setup, the largest uncertainty comes from applying defined volumes of liquid on
the plate with the microliter pipette. As shown in the calibration plot [cf. Fig. 4.3] for the used
setup the intensity ratio is quite sensitive towards errors in the transferred volume of the liquid
in the region between 0.1 and 0.4. For intensity ratios that are larger than 0.4, the error

approximation is converging with the calibration line as the relationship becomes more
insensitive with changes in the film thickness. The approximation of a constant error of 0.2 µl
as shown in Fig. 5 was used to illustrate the two sensitivity regions of the calibration and is
overestimating the error for smaller volumes that were applied to generate calibration
thicknesses. An error of 10% relative to the actually applied liquid volume results in
approximately 10% error of the film thickness for a given area. With that the intensity ratio is
fluctuating by approximately ±0.03 in this range.
The image processing steps necessary to detect the boundaries of the liquid film and to
determine the film area can induce a minor shift of the film front by two pixels in the worst
case. The intensity gradient based binarisation algorithm cannot produce sub-pixel accuracy of
the boundary, but is limited to a whole pixel. Effectively, this corresponds to an offset of plus
or minus one pixel. For this worst case approximation of a two pixel shift and a given
magnification of the setup this results in a length of 0.116 mm. In relation to the circular area
with a diameter of approximately 15 mm that was used during the calibration (created with the
paraffin pen) this equates to an error of less than 1.6% relative to the film area. Because of the
small magnitude, the accuracy of the boundary detection procedure of the liquid film is
satisfying and this error will not be considered in the discussion of the results obtained with this
method.
Noise introduced by the DC power supply will also be neglected for the discussion. The
power supply was specified for fluctuations of 1 mVrms at 12 V operating voltage. The cameras
were left to warm up for at least 30 minutes until a stable operating temperature of the internal
cooling system was achieved. In this way, the drift in the sensitivity of the chips during
measurement was minimized. In addition, the noise calibration feature provided in the recording
software was used to subtract the noise of the dark image, before each measurement. With this,
the noise generated by the recording electronics was minimized and kept constant for all
experiments.
During measurements the main uncertainty was introduced through fluctuations from
injection to injection. It was observed, that the values of the maximum deposit volume measured
could fluctuate by up to ±10%. To ensure reasonable significance of the data, measurements
were repeated five times and the mean value as well as the standard deviation were calculated.
5. Results
This study focussed on developing an optical technique, which can be used to investigate the
fuel spray-piston interactions that occur inside a gasoline direct injection engine. In order to
demonstrate the potential application of this technique, a selection of single component fuels
with known physical properties were tested in the fuel injection chamber. The fuels were
selected so that the effects of the boiling temperature of the liquid on the measured liquid deposit
and its evaporation time can be considered.
The first set of single component fuels consisted of the linear alkanes hexane, heptane and
octane (all technical grade, VWR International). The properties of these chemicals are very well
investigated and share some similarities with the components found in regular gasoline. The
three chemicals have comparable thermo-physical properties with virtually the same density,
heat capacity and heat of evaporation. The viscosity and surface tension change by small
amounts. The second set of fuels comprised of ethanol, propanol and butanol (technical grade,
VWR International), representing linear alcohols. Unlike the alkanes, these chemicals have
different thermo-physical properties regarding viscosity, heat capacity and heat of evaporation.
Only the density and surface tension do not change significantly. A summary of the physical
properties can be found in Table 1.

Table 1. Physical properties of the liquids investigated [52].
fuel
boiling
temperature,
°C
density,
g/cm3
viscosity,
mPas
surface
tension,
dyn/cm
heat
capacity,
J/(K kg)
heat of
evaporation
kJ/kg
hexane 69 0.659 0.326 18.40 2293.69 334.78
heptane 98 0.684 0.386 20.14 2241.87 364.26
octane 126 0.703 0.542 21.62 2238.32 362.01
ethanol 78 0.789 1.144 22.39 2420.96 837.02
propanol 97 0.803 1.938 23.79 2406.19 689.57
butanol 117 0.810 2.544 24.20 2386.08 584.04
In the case of the alkanes only the boiling temperature varies significantly. In this way,
potential differences in the liquid film thickness can be linked mainly to the boiling temperature
of the liquids.
In the first set of experiments the plate temperature was maintained constant at 100 °C for
all fuels (alkanes and alcohols). The injection duration was kept constant at 1.50 ms and the air
temperature inside the test chamber was constant and only affected by the plate temperature
(steady state). From the recorded high speed images, the cumulative volume of the liquid deposit
was measured as a function of time using the approach and the calibration that were described
in the previous section. These measurements are presented in Fig. 7 and Fig. 8 with time starting
when the injector is triggered.

Fig. 7. Mean liquid volume of wall deposit of hexane ( ), heptane ( ) and octane ( ) fuels
as a function of time after triggering the injector and a plate temperature of 100°C (a) and the individual mean time signal ( ) for hexane (b), heptane (c) and octane (d) including the
respective standard deviation ( ).

Fig. 8. Mean liquid volume of wall deposit of hexane ( ), heptane ( ) and octane ( ) fuels as a function of time after triggering the injector and a plate temperature of 100°C (a) and the
individual mean time signal ( ) for hexane (b), heptane (c) and octane (d) including the
respective standard deviation ( ).
With increasing boiling temperature of the alkanes, the volume of the liquid deposit increases
significantly. Hexane produces almost no liquid film compared to the other two fuels. The film
generated by octane has about twice the thickness of heptane and takes an order of magnitude
longer to evaporate. The behaviour of the three alkanes indicates the significance of the boiling
temperature and the surface temperature if it comes to formation of liquid deposits post
injection. Having a plate temperature higher than the boiling temperature leads to almost no
deposit in case of hexane, while having a plate temperature lower than the boiling temperature
produces very large deposits in the case of octane. Looking at the individual plots of the liquid
deposit volume [Figs. 7(b), (c) and (d)] it can be seen that the standard deviation shows a similar
characteristic for the alkanes. Only in the case of hexane do the fluctuations between the
recordings seem to be less pronounced. Overall it can also be seen that the standard deviation
becomes smaller as the liquid film evaporates completely and converges with the mean value.
Similar observations can also be identified with the linear alcohols. Looking solely at the
boiling temperature, the order of the liquid fuel thickness follows the same sequence as for the
alkanes. It should be noted that with all alcohols, but more significantly for propanol and
butanol, boiling was observed inside the film. This was not observed with the alkanes. This is
the reason that the measured liquid volume at the early stages of spray impingement for alcohols
in Fig. 8 is lower than the volume for alkanes in Fig. 7. The formation of bubbles inside the
liquid film alters the scattering behaviour of the incident light and also modifies the evaporation
rate of the liquids. The larger the deposit, the more pronounced the bubble formation inside the
liquid. Despite this different behaviour, it appears that if the boiling temperature is lower than
the plate temperature the deposit is small, and the opposite if the boiling temperature is higher.
Essentially, the same liquid film behaviour is observed with the alcohols as with the alkanes.

The separate plots of each alcohol [Figs. 8(b), (c) and (d)] show that the standard deviation
increases from ethanol to propanol and butanol. Fluctuations between the ethanol injections are
very small and the standard deviation follows the mean value very closely. The other two fuels
have more variances between injections, especially at the beginning of the recording in the
region close to the initial deposit volume. Over time, the standard deviation lines are also
converging with the mean, similar to the alkanes
Comparing the results of the alkanes in Fig. 7 with the alcohols in Fig. 8, it is noticeable
that the time scale of evaporation of the liquid film is significantly longer for the latter, almost
around two times. Looking at the physical properties, the larger heat of evaporation of the three
alcohols is apparent. However, the fuel with the smallest heat of evaporation of the alcohols,
butanol, takes the longest to evaporate. This could mean that the different behaviour alcohols
vs. alkanes might not only be connected to this property.
To further elaborate on this matter the total energy to evaporate the fuel film, based on the
physical properties shown in Table 1, was calculated. Table 2 shows these values. The
theoretical deposit volume, which was used to estimate the total evaporation energy required
for each fuel, assumes that the entire volume of spray gets deposited during injection. This
assumption neglects any real interaction between the spray and the surface, and can be regarded
as a worst case scenario. The resulting film volume is 15 µl, based on the flow rate information
provided by the manufacturer of the injector. Based on this deposit volume, the energy required
to heat up each liquid to boiling temperature can be calculated, assuming that the initial film
has a temperature of 20 °C. Once the film reaches boiling temperature, the energy to evaporate
the liquid was calculated using the latent heat of evaporation from Table 1. By combining these
two values, the theoretical total energy was calculated.
Within the group of alkanes the total energy based on this theoretical deposit volume
increases as the boiling temperature becomes larger. The reason for this is that the latent heat
of evaporation is almost identical between the three fuels. Therefore, the only contributing
factor is the boiling temperature and the energy required to heat up the liquid. Ultimately, this
yields a trend which agrees with the results found in the experiments.
In case of the alcohols, however, this trend cannot be observed. Similar to the alkanes, the
energy required to reach boiling temperature increases from ethanol to butanol. Albeit, the latent
heat of evaporation decreases significantly at the same time. So much in fact, that the energy
required to evaporate the respective alcohol compensates for the increasing energy required to
reach boiling temperature of the fuels. In the end, the total energy necessary to evaporate each
alcohol does not increase with the boiling temperature.
If the total evaporation energy is calculated in the same way as before, but based on the
maximum volume measured in the experiments, one can see the same trend as observed in the
experiments. With increasing boiling temperature of the single component fuel, the total energy
to evaporate the deposit also increases. Furthermore, if the alkane is compared to the alcohol
with a similar boiling temperature, one can see that the required energy is higher. This could
explain why the initial deposit volume is higher in case of the alcohols, again with the exception
of butanol.

Table 2. Calculated evaporation energy for each fuel based on a theoretical deposit volume and on the
measured volume.
fuel
energy to reach
boiling
temperature,
J
energy to
evaporate,
J
total energy based
on the theoretical
volume,
J
total energy based on
the measured volume,
J
hexane 1.11 3.31 4.42 0.13
heptane 1.79 3.74 5.53 0.20
octane 2.50 3.82 6.32 0.49
ethanol 1.66 9.91 11.57 0.16
propanol 2.23 8.31 10.54 0.44
butanol 2.81 7.10 9.91 0.54
In order to further understand the significance of the surface temperature on the liquid deposit
formation and evaporation, a second set of experiments was conducted. This time, the surface
temperature was adjusted during each measurement to match the individual boiling temperature
of the liquid. The measurements were analysed in the same way as before and are presented in
Fig. 9 and Fig. 10.
Fig. 9. Liquid volume of wall deposit of hexane ( ), heptane ( ) and octane ( ) fuels as a
function of time after triggering the injector and with the plate temperature matching the boiling temperature of each individual liquid.

Fig. 10. Liquid volume of wall deposit of ethanol ( ), propanol ( ) and butanol ( ) fuels as
a function of time after triggering the injector and with the plate temperature matching the boiling temperature of each individual liquid.
The results show that the curves of evaporation of the liquid film as a function of time for each
set of liquids now overlap nearly perfectly. As mentioned before, in the case of the alkanes, the
only physical property that varies significantly is the boiling temperature. This means that
adjusting the plate temperature to match the boiling temperature of the liquid has a dramatic
impact on deposit formation and evaporation. Surprisingly, the three alcohols seem to behave
in the same way, despite them having less similarities in their physical properties than the
alkanes. This would mean that the boiling temperature of the liquid is the most influential
property for the liquid deposit formation and evaporation, which is remarkable.
Between the two families of fuels, a difference in the time scale remains with the alcohols
taking 5-6 times as long as the alkanes to evaporate, although the initially deposited volume is
similar. Please note, that all alcohols also showed minor boiling inside the film, similar to the
first set of experiments, which was most pronounced in the case of butanol. This could explain
that the initial deposit volume of butanol appears to be smaller compared to ethanol and
propanol. Similar to the 100 °C case, the scattering behaviour could be affected by bubble
formation, which reflects more light towards the camera, and therefore results in a calculated
film thickness smaller than the actual value.
Overall, the results show the significance and importance of the relationship between the
surface temperature and the boiling temperature of the liquid. If this observation is applied to
the cylinder wall and piston wetting inside a direct injection engine, this would mean that by
increasing the wall and piston surface temperature inside an engine to match or exceed the
boiling temperature of the fuel, the amount of liquid deposit will be reduced significantly. This
finding has the potential to reduce the amount of particulate emissions from modern gasoline
engines, since the exhaust particulate emissions are linked to the liquid film formation during
the injection process 1.
6. Summary and Conclusions
A novel method to investigate the physics of liquid fuel deposits and evaporation, created by a
spray of a fuel injector impinging on a piston or wall surface, was developed. The technique
makes use of the change of the liquid scattering intensity emitted from a metal surface with
known roughness, when liquid is deposited. Important advantages of the technique over
previously established methods are the ability to measure time-dependent spatial distribution of
liquid film thickness without a need to add a fluorescent tracer in the liquid, while the
measurement principle is not influenced by changes at the pressure and temperature of the liquid

or the surrounding gas and liquid properties. However, an in-situ calibration of the dependence
of signal intensity on liquid film thickness is required for each optical setup. Therefore, the
developed method can be applied to measure the time-dependent and two-dimensional
distribution of the liquid film within the environment of gasoline direct injection engines.
However, the technique can also be applied to numerous applications, where liquid film deposits
on a solid non-transparent surface is important. The main findings of the paper are presented
below.
The principle of the technique, the data processing approach and the calibration
procedure were presented and demonstrated. A comparison of the evaporation
behaviour of liquid fuel deposited on a metal and a glass plate was also performed, to
further demonstrate the applicability of the technique.
The application of the technique was demonstrated by selecting linear alkanes and
alcohols with changing boiling temperature and studying the behaviour of the liquid
film thickness on a metal impingement plate with variable temperatures. When
keeping the surface temperature constant at 100 °C, an increase in the liquid film
thickness was observed with increasing boiling temperature, both with the alkanes and
the alcohols. By adjusting the plate temperature from 100 °C to match the boiling
temperature of each individual fuel, it was possible to overlap the evaporation curve
of all alkanes and alcohols respectively. This means that not only the time scale until
complete evaporation was similar within each group of fuels, but also the initial
volume of the liquid film . Overall, this shows the strong influence of the boiling
temperature of the fuel on the behaviour of the liquid film thickness, which suggests
that control of the wall temperature in the cylinder of a gasoline direct injection engine
may reduce the liquid fuel deposit, which may assist the reduction of particulate
emissions at the exhaust.
Future work is required to further develop the technique and make it more independent
towards the effects of the angle of illumination and detection. This would broaden the
applicability and open it up for numerous investigations.
The necessity of an in-situ calibration might prove obstructive for the transfer of the
technique to metal test engine. By further understanding the effect of the light source
and optics positioning it could be possible to abstract this step outside of the actual
chamber and apply it inside the cylinder during later measurements. In combination
with endoscopic optical excess this would make the technique viable in real engines.
Finally, the effect of surface roughness on the evaporation rate of thin liquid films
should be evaluated, which may assist the reduction of wall wetting in IC engines.
Acknowledgments
The authors gratefully acknowledge financial support from Shell Global Solutions for parts of
this work.