a novel mooring tether for highly-dynamic offshore
TRANSCRIPT
J. Mar. Sci. Eng. 2015, 3, 1287-1310; doi:10.3390/jmse3041287
Journal of Marine Science
and Engineering ISSN 2077-1312
www.mdpi.com/journal/jmse
Article
A Novel Mooring Tether for Highly-Dynamic Offshore Applications; Mitigating Peak and Fatigue Loads via Selectable Axial Stiffness
Tessa Gordelier †, David Parish †,*, Philipp R. Thies and Lars Johanning
University of Exeter, Treliever Road, Penryn, Cornwall TR10 9FE, UK;
E-Mails: [email protected] (T.G.); [email protected] (P.R.T.); [email protected] (L.J.)
† These authors contributed equally to this work.
* Author to whom correspondence should be addressed; E-Mail: [email protected];
Tel.: +44-132-625-4180.
Academic Editors: Bjoern Elsaesser and Umesh A. Korde
Received: 10 August 2015 / Accepted: 19 October 2015 / Published: 22 October 2015
Abstract: Highly-dynamic floating bodies such as wave energy convertors require mooring
lines with particular mechanical properties; the mooring system must achieve adequate
station keeping whilst controlling mooring tensions within acceptable limits. Optimised
compliant mooring systems can meet these requirements but where compliance is achieved
through system architecture, the complexity of the system increases together with the
mooring footprint. This work introduces the “Exeter Tether”, a novel fibre rope mooring
tether providing advantages over conventional fibre ropes. The tether concept aims to
provide a significantly lower axial stiffness by de-coupling this attribute from the minimum
breaking load of the line. A benefit of reduced axial stiffness is the reduction of mooring
system stiffness providing a reduction of peak and fatigue loads, without increasing mooring
system complexity. Reducing these loads improves system reliability and allows a reduction
in mass of both the mooring system and the floating body, thus reducing costs. The principles
behind the novel tether design are presented here, along with an outline of eight prototype
tether variants. Results from the proof of concept study are given together with preliminary
findings from sea trials conducted in Falmouth Bay. Results demonstrate that the Exeter
Tether can be configured to achieve a significantly lower axial stiffness than conventional
OPEN ACCESS

J. Mar. Sci. Eng. 2015, 3 1288
fibre rope and that the stiffness is selectable within limits for a given breaking strength. Strain
values greater than 0.35 are achieved at 30% of line breaking strength; this represents more
than a threefold increase of the strain achievable with a conventional rope of the same
material. The tether was subjected to six months of sea trials to establish any threats to its
own reliability and to inform future design enhancements in this respect.
Keywords: elastomeric mooring; compliant mooring; peak load; fatigue load; mooring load;
tether; wave energy; reliability; axial stiffness; DMaC; SWMTF
1. Introduction
The mooring system is one of the most critical sub-systems for a floating offshore installation.
In particular, marine renewable energy developers seek to install devices in highly-dynamic
environments governed by wave and tidal conditions. The requirements and design issues are extensively
described by [1–4]. Importantly, mooring systems must satisfy the following requirements:
1. Survivability under extreme load conditions.
2. Long-term reliability.
3. Provision of required compliance so as to minimise peak loads.
4. Minimise the mooring spread footprint.
As a consequence, items 1 and 2 typically require a high Minimum Breaking Load (MBL), to allow
sufficiently high factors of safety (FOS) to warrant long-term reliability. For conventional mooring
systems both requirements conflict with objectives three and four, and vice versa. The cost of
conventional mooring line material (e.g., chain, steel wire and polyester) is directly proportional to the
rated MBL [4]. As a consequence any peak loads, such as those experienced during storm events, have
a direct impact on the mooring cost. The dilemma for floating offshore installations is that the capital
cost of the mooring system is driven by extreme (peak load) conditions, whilst the revenue is generated
under normal operating conditions. If peak loads can be mitigated the cost of mooring systems and
associated structural elements, as well as deployment and installation costs, can be significantly reduced.
The design challenge is to find a feasible combination of all four objectives listed above. Objectives 1–3
are directly affected by the compliance and associated MBL of the mooring lines. In some cases system
architecture can assist with achieving objectives 1–3 (e.g., by introducing multi-catenary mooring
configurations); however, this comes at the expense of objective 4[4].
Wave buoys typically feature a highly elastic mooring configuration using rubber materials [5].
This satisfies the design requirements for wave buoys to follow the orbital wave motion (item three
above), whilst absorbing some of the wave and tide-induced forces to increase system reliability (item
two above).
At the other end of the spectrum are taut mooring systems for tension-leg platforms (TLPs) using steel
wire, which are one of the proposed solutions for floating offshore wind installations [6,7]. The compliance
of these systems is minimal and very high MBLs are required to satisfy item 1 (survivability).
J. Mar. Sci. Eng. 2015, 3 1289
Whilst the different mentioned mooring solutions match the requirements for wave buoys and TLPs
well, a combination of soft and stiff response elements would constitute an optimised mooring solution
as it would allow a reconciliation of the diverging design objectives. A number of systems have been
proposed to combine these characteristics, among which are the Seaflex buoy mooring system [8] and
the TfI mooring tether [9,10]. The development and proof of concept for a third innovative mooring
design, the Exeter Tether, is the subject of this paper.
Recent studies [9,11] have indicated that mooring systems with this non-linear, combined response
offer significant potential for peak load reductions. A numerical study [12] specifically performed for
the Exeter Tether described in this paper has demonstrated peak load reduction by a factor of three.
The non-linear coupled modelling and simulations compared the non-linear mooring load response
against real load data during high energy wave conditions for a conventional nylon rope.
Conventional fibre ropes display hysteresis when subjected to cyclic loading, a proportion of the work
done during the extension being transferred to heat [13]. This is an important consideration for both
conventional ropes and the Exeter Tether (which also displays hysteretic behaviour) as the hysteresis
will contribute to the damping of the system. The hysteretic damping characteristics of the Exeter Tether
are not detailed within this paper but will be addressed as further work.
As for all innovative systems the performance characteristics and long-term behaviour require careful
consideration, research and demonstration. This paper addresses these aspects for the Exeter Tether by
introducing the design philosophy behind the tether and presenting results from a proof of concept study
conducted with eight tether prototypes.
2. Technical Background
2.1. Axial Stiffness, Maximum Strain, and Minimum Breaking Load
Three important properties of a mooring line that strongly influence its performance [4] are:
2.1.1. Axial Stiffness in Tension
This parameter describes the extension of a line in relation to its original length, when it is subjected
to a given tensile load. A line with high stiffness (low compliance), for instance steel wire or steel chain,
will not yield much when a load is applied [14]. This high stiffness can lead to excessively high “snatch”
loads being generated within the mooring system which are transmitted into the floating structure [4].
Axial stiffness is defined as load/strain, or the gradient of the load vs. strain plot line.
2.1.2. Minimum Breaking Load
The minimum breaking load (MBL) under tension is specified for any rope, chain or similar structural
tie. This value can be considered to be the least value at which a rope, chain or other will fail completely.
Some permanent damage or change might occur at a lower load.
J. Mar. Sci. Eng. 2015, 3 1290
2.1.3. Maximum Limit of Axial Strain
This defines the maximum extension that a line can achieve before breaking at MBL. Conventional fibre
ropes can achieve a maximum strain of around 0.40 (nylon, three-strand laid construction, new rope) [13].
The ability to achieve high values of strain can be useful where large displacements must be allowed
e.g., when tide height varies significantly in relation to the water depth.
In conventional fibre ropes the axial stiffness and MBL are strongly associated parameters.
Consequently there is little capability to vary the stiffness of any particular rope, which is governed by
the MBL. Some selection of stiffness for a given MBL is possible by means of the following:
Material selection: fibre rope for offshore mooring might be of polyester, nylon, high modulus
polyethylene or other polymer construction. The different polymer yarns exhibit differing
extension and recovery properties; nylon has the lowest stiffness [13].
Construction geometry: fibre rope for offshore use can be constructed such that the main load
carrying sub-ropes run either parallel to the rope itself (parallel lay), are helically wound within
the rope (three-strand laid), or those that approximate a helical form, such as braided or plaited
ropes. Ropes with parallel lay sub-ropes will exhibit higher stiffness than ropes where the load is
carried helically [15].
The lowest axial stiffness for any given MBL of conventional fibre rope will therefore be achieved
with a nylon rope. However, the advantageous maximum strain of 0.4 is only available at loads
approaching the MBL of the rope. If a factor of safety is applied, to allow for uncertainties in the load
case and degradations to the rope, the axial stiffness increases with the increase to MBL.
2.2. The Exeter Tether
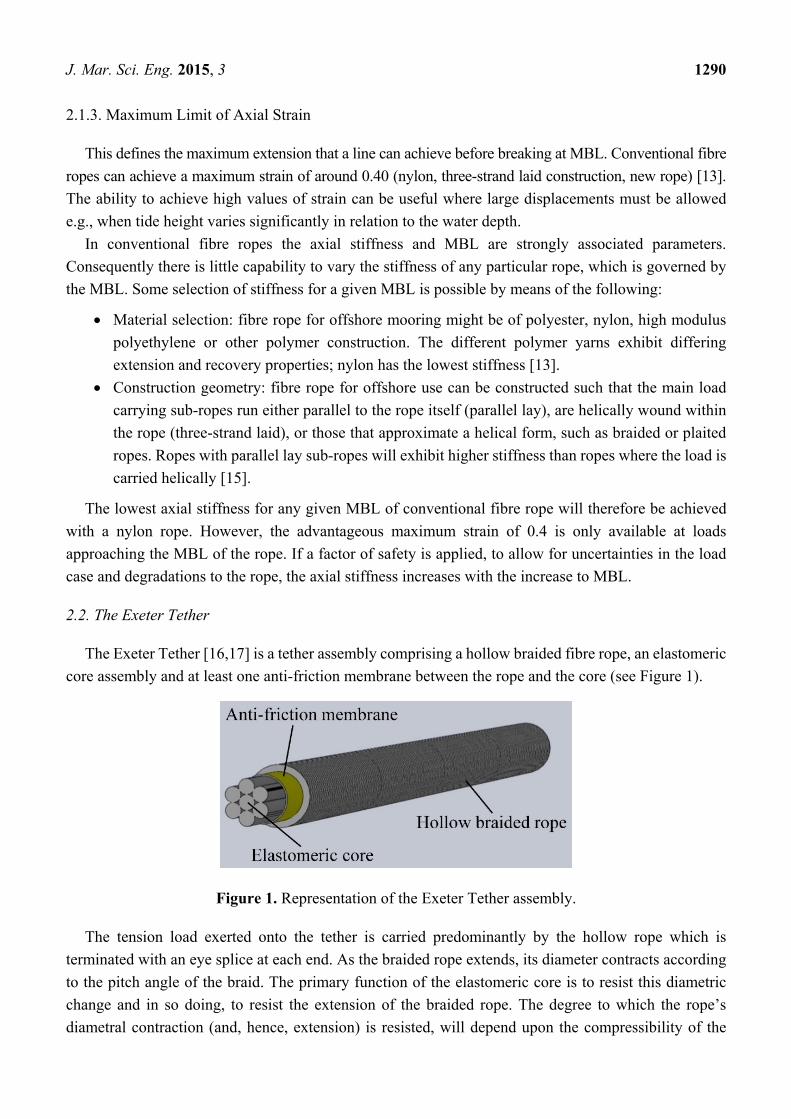
The Exeter Tether [16,17] is a tether assembly comprising a hollow braided fibre rope, an elastomeric
core assembly and at least one anti-friction membrane between the rope and the core (see Figure 1).
Figure 1. Representation of the Exeter Tether assembly.
The tension load exerted onto the tether is carried predominantly by the hollow rope which is
terminated with an eye splice at each end. As the braided rope extends, its diameter contracts according
to the pitch angle of the braid. The primary function of the elastomeric core is to resist this diametric
change and in so doing, to resist the extension of the braided rope. The degree to which the rope’s
diametral contraction (and, hence, extension) is resisted, will depend upon the compressibility of the

J. Mar. Sci. Eng. 2015, 3 1291
elastomeric core. This can be altered by design changes to the elastomer material hardness and to the
cross sectional form of the core assembly. A core structure with seven round sections as shown will
provide easy initial compression of the core whilst the elastomer cords deform towards a more solid
cross section. This will result in an initial soft extension response of the tether which will stiffen
markedly as the elastomer core assembly becomes solid. From this point on, further extension is achieved
via the Poisson’s diminution of the elastomer material, the extension of the polyester rope strands and a
degree of embedment of the rope strands into the surface of the core. With a braid angle in excess of 50°
(from the axis), the hollow rope has a mechanical advantage in compressing the core during the initial
extension. However, as the braid angle decreases with the tether extension, so does the mechanical
advantage over the core. This gradual change acts to reinforce the two stage extension property of the
tether attributed to the core structure. Braid angle change and diametral contraction are demonstrated in
Figure 2.
(a) (b)
Figure 2. (a) P1-2 tether at zero extension; and (b) P1-2 tether at 30% extension.
The core assembly extends as the tether extends and therefore the elastomer cords carry a tensile load
themselves. However, due to the low Young’s modulus of the core’s elastomer material, this contribution
to load carrying is less than 10% of the load carried by the tether [12]. The remaining balance of the load
is carried by the hollow rope.
Importantly, design changes to the core’s material and structure can be made independently of the
strength of the hollow rope such that the extension properties of the tether are not coupled to its MBL.
This allows the selection, at tether design stage, of lower axial stiffness and a higher strain limit whilst
specifying the MBL to allow an adequate factor of safety.
Scaling of the tether between prototype stages has been successfully achieved through the
maintenance of geometric proportions in the cross section of the tether. This includes the cross sectional
area of the load carrying rope strands which scale the linear density and hence the MBL of the rope
accordingly. The diameter of the braided rope strands does not need to follow the geometric scaling
directly and the number of strands comprising the braid is not critical. The solidity of the pack of the
rope strands in relation to the cross sectional area of the hollow rope is however important and this is
maintained as a constant when scaling the tether.
J. Mar. Sci. Eng. 2015, 3 1292
3. Proof of Concept Prototypes
Prototype tethers were constructed for the proof of concept study and are referred to as the P1 series
prototypes. The elastomer cores, together with their anti-friction membranes, were assembled by
University of Exeter (UoE). These core assemblies were then taken to Lankhorst Ropes’ manufacturing
facility in Maia, Portugal, where the rope was braided onto the cores and the eye splices were made. The
completed tether assemblies were then shipped back to UoE for test work and analysis.
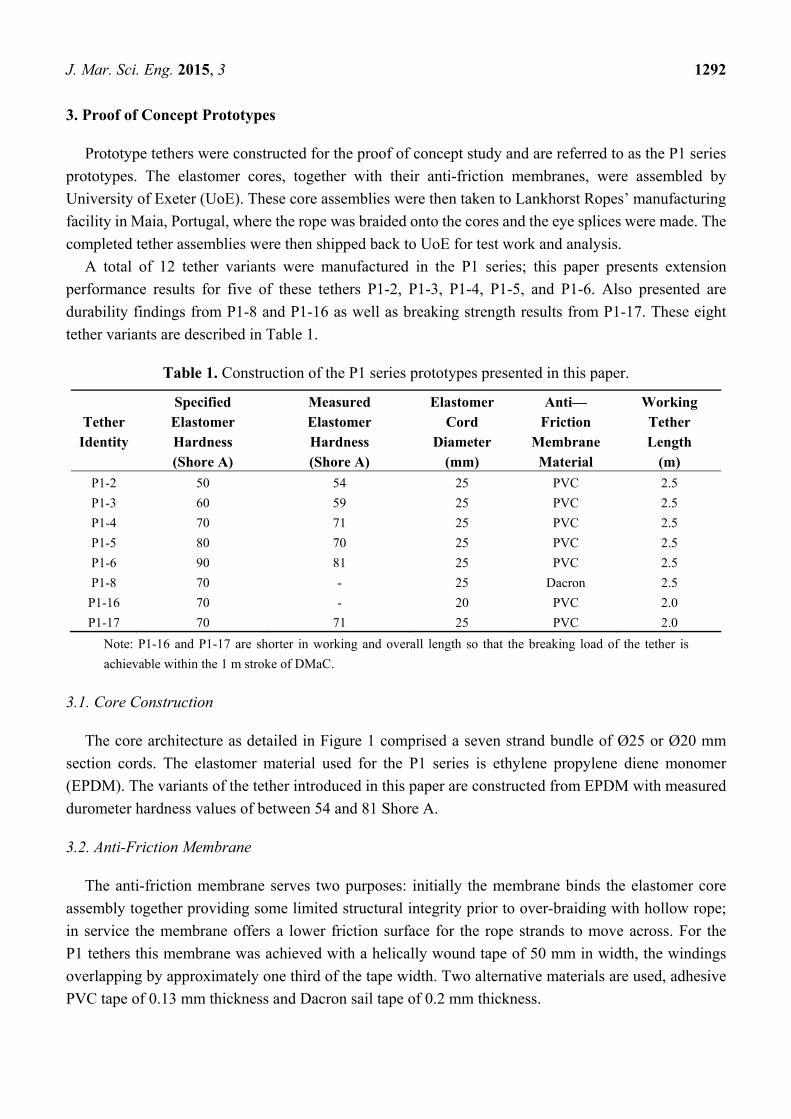
A total of 12 tether variants were manufactured in the P1 series; this paper presents extension
performance results for five of these tethers P1-2, P1-3, P1-4, P1-5, and P1-6. Also presented are
durability findings from P1-8 and P1-16 as well as breaking strength results from P1-17. These eight
tether variants are described in Table 1.
Table 1. Construction of the P1 series prototypes presented in this paper.
Tether Identity
Specified Elastomer Hardness (Shore A)
Measured Elastomer Hardness (Shore A)
Elastomer Cord
Diameter (mm)
Anti—Friction
Membrane Material
Working Tether Length
(m)
P1-2 50 54 25 PVC 2.5
P1-3 60 59 25 PVC 2.5
P1-4 70 71 25 PVC 2.5
P1-5 80 70 25 PVC 2.5
P1-6 90 81 25 PVC 2.5
P1-8 70 - 25 Dacron 2.5
P1-16 70 - 20 PVC 2.0
P1-17 70 71 25 PVC 2.0
Note: P1-16 and P1-17 are shorter in working and overall length so that the breaking load of the tether is
achievable within the 1 m stroke of DMaC.
3.1. Core Construction
The core architecture as detailed in Figure 1 comprised a seven strand bundle of Ø25 or Ø20 mm
section cords. The elastomer material used for the P1 series is ethylene propylene diene monomer
(EPDM). The variants of the tether introduced in this paper are constructed from EPDM with measured
durometer hardness values of between 54 and 81 Shore A.
3.2. Anti-Friction Membrane
The anti-friction membrane serves two purposes: initially the membrane binds the elastomer core
assembly together providing some limited structural integrity prior to over-braiding with hollow rope;
in service the membrane offers a lower friction surface for the rope strands to move across. For the
P1 tethers this membrane was achieved with a helically wound tape of 50 mm in width, the windings
overlapping by approximately one third of the tape width. Two alternative materials are used, adhesive
PVC tape of 0.13 mm thickness and Dacron sail tape of 0.2 mm thickness.

J. Mar. Sci. Eng. 2015, 3 1293
3.3. Hollow Rope
The material selected for the hollow rope was polyester. The construction was a 1 × 1 braid of
48 strands (24 in each helix direction) with a strand diameter of 4.5 mm. The braiding machine was set
to produce a 202.5 mm pitch helix for each strand. The resulting outer diameter of the hollow rope was
60 mm which increased to approximately 80 mm when braiding onto the standard core (constructed of
25 mm cords) which was fed into the rear of the machine. The hollow rope was terminated at both ends
using a form of Lankhorst Rope’s A3 eye splice.
3.4. Tether Assemblies
The construction and identification of the P1 series of prototypes described in this paper is detailed
in Table 1. The dimensions of the tether are detailed in Figure 3.
Figure 3. Working length (core length) and overall length of the P1 tethers (except P1-16/17).
4. Methods
4.1. Dynamic Marine Component Test Facility
4.1.1. Facility Overview
The Dynamic Marine Component test facility (DMaC) is based in Falmouth Docks and is owned and
operated by the University of Exeter. It is a large horizontal test machine that has a linear actuator and a
two-degrees-of-freedom headstock. Further specifications of DMaC and examples of other component
tests are detailed in [18–20]. For the tether test work the headstock is not utilised and the linear actuator
is used to provide displacement of up to 1000 mm and tension of up to 222 kN. The linear actuator
follows a prescribed time series for either displacement or for tension and in both cases has full feedback
control of the driving parameter.
The test piece can be submerged in fresh water which is essential for the tether test work in order that
the assembly is properly lubricated. For the tether test work, an interchangeable headstock platen was
manufactured that provided 800 mm of pre-tension travel via an M64 thread. The “top hat” form of this
platen also increases the effective test bed length of DMaC by 300 mm. Figure 4a shows DMaC with a
tether assembly fitted ready to test (submerged in water) and Figure 4b shows the pre-tension adjuster
providing maximum pre-tension. The pre-tension adjuster is important because it allows the slack to
be removed from the test piece without using any of the 1000 mm linear stroke available from the
hydraulic ram.

J. Mar. Sci. Eng. 2015, 3 1294
(a) (b)
Figure 4. (a) DMaC with a tether fitted and full of water; and (b) the pre-tension adjuster
and “top hat”.
4.1.2. Calibration
DMaC was calibrated using a reference five tonne load cell which itself has calibration traceable to
national standards. The results of the final DMaC calibration run are given in Figure 5.
Figure 5. Final calibration run of DMaC using 5 T reference load cell.
A line of best fit has been fitted to the data points in the final calibration run which achieves a
R2 value of 0.9999 (the square of the Pearson product moment correlation coefficient). The equation for
the line in the final calibration run here is:
y = 1.0016x − 0.0752 (1)
Applying this linear relationship to the range of loads investigated in the test work reported below
provides a maximum error of ±0.07 kN.
J. Mar. Sci. Eng. 2015, 3 1295
4.2. Test Considerations
The following considerations inform the general test methodology for the tether extension tests:
- The Mullins effect, or stress softening, occurs in most thermoplastic elastomers [21]. The effect
manifests itself as a reduction in the stress required to achieve a particular strain value once that
strain value has been achieved on a single occasion; it occurs in both tension and compression.
Cantournet et al. [22] state that the behaviour of these elastomers does not strictly follow the
idealised case and that the effect is still significant for the second strain cycle. They add that
stability is soon reached with only negligible effect after 5–10 cycles.
- The Exeter Tether is specifically designed for use underwater. The elastomeric core assembly
requires the lubrication and cooling afforded to it by submersion in water.
- Conventional fibre ropes require repeated strain cycles before the stability is adequate for
representative test results. Ten cycles are recommended although individual test plans differ [13].
During these “bedding in” cycles, individual fibre components of the rope adopt their optimal position.
- The hollow braided rope of the P1 prototypes is likely to require less bedding in than ropes of a
more complex construction.
- The tether is a novel and unknown technology. The test methodology must strike a balance
between rigorous test work and the preservation of the prototypes which had unknown durability
at the onset of the test work.
- The tether is primarily designed for use as a mooring tether for floating marine renewable
energy converters. The scale of the P1 prototypes is suited to small devices moored in the
nearshore environment.
4.3. General Test Methodology for Tether Extension Tests
The considerations listed above resulted in the following general practises for extension tests:
- All extension test work was conducted with the tethers fully submerged in fresh water with the
exception of the eye splice extension test and the breaking load test.
- All of the P1 tethers were subjected to conditioning tests to achieve “bedding in” prior to any
primary data tests or durability tests. Primary data is the data which is subsequently presented or
used in further analysis. The conditioning tests are summarised in Table 2 together with the
primary data and durability tests.
- Cyclical primary data tests have five extension cycles, the fifth cycle providing the primary data.
- Extension cycles follow a sine wave, having a frequency of 0.125 Hz (8 s period).
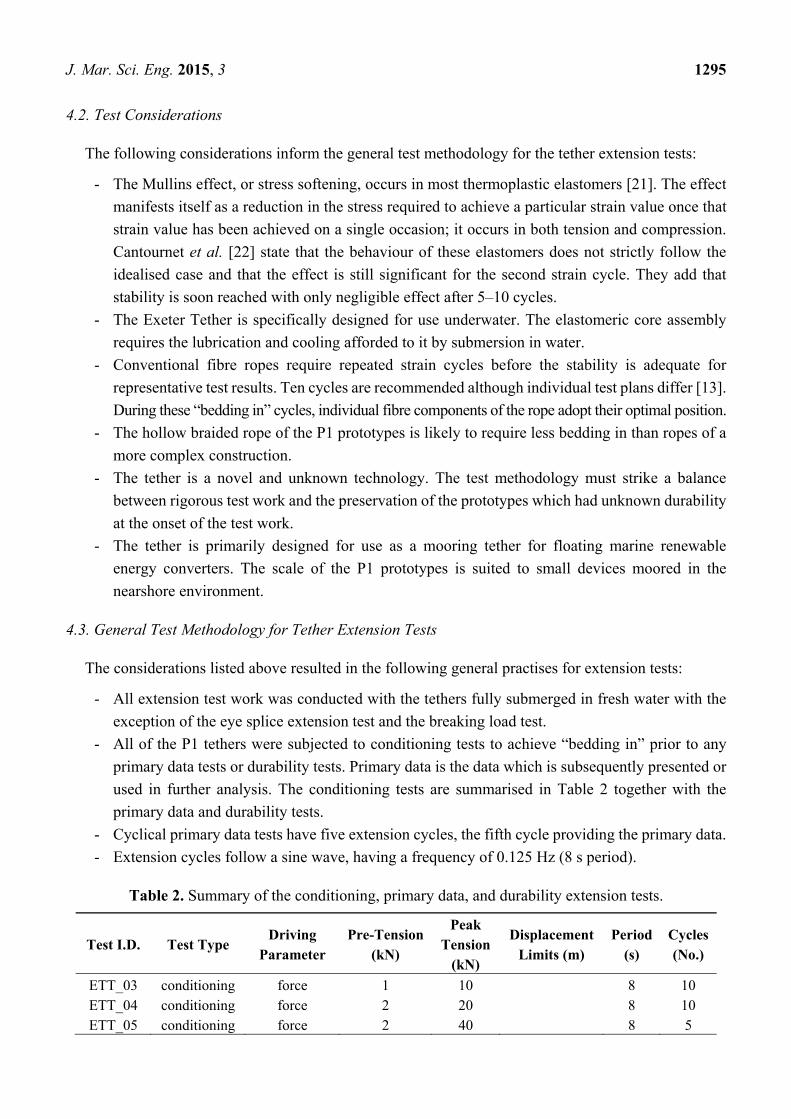
Table 2. Summary of the conditioning, primary data, and durability extension tests.
Test I.D. Test Type Driving
Parameter Pre-Tension
(kN)
Peak Tension
(kN)
Displacement Limits (m)
Period (s)
Cycles (No.)
ETT_03 conditioning force 1 10 8 10 ETT_04 conditioning force 2 20 8 10 ETT_05 conditioning force 2 40 8 5
J. Mar. Sci. Eng. 2015, 3 1296
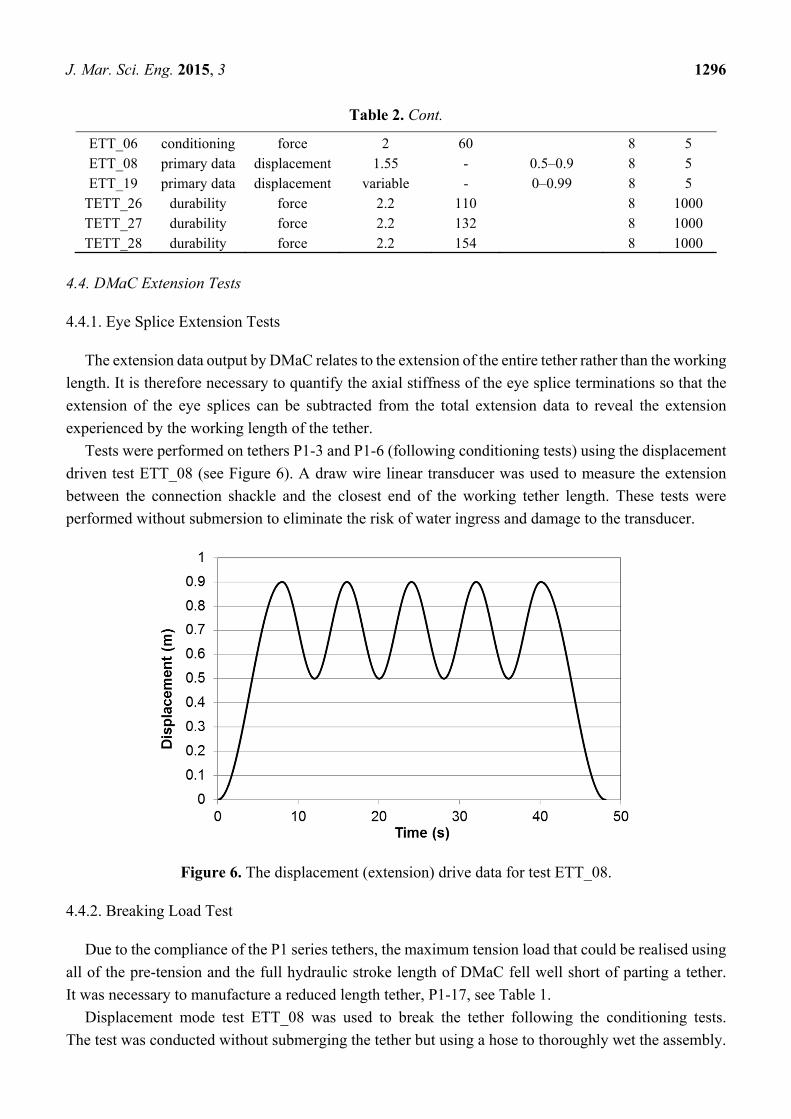
Table 2. Cont.
ETT_06 conditioning force 2 60 8 5 ETT_08 primary data displacement 1.55 - 0.5–0.9 8 5 ETT_19 primary data displacement variable - 0–0.99 8 5
TETT_26 durability force 2.2 110 8 1000 TETT_27 durability force 2.2 132 8 1000 TETT_28 durability force 2.2 154 8 1000
4.4. DMaC Extension Tests
4.4.1. Eye Splice Extension Tests
The extension data output by DMaC relates to the extension of the entire tether rather than the working
length. It is therefore necessary to quantify the axial stiffness of the eye splice terminations so that the
extension of the eye splices can be subtracted from the total extension data to reveal the extension
experienced by the working length of the tether.
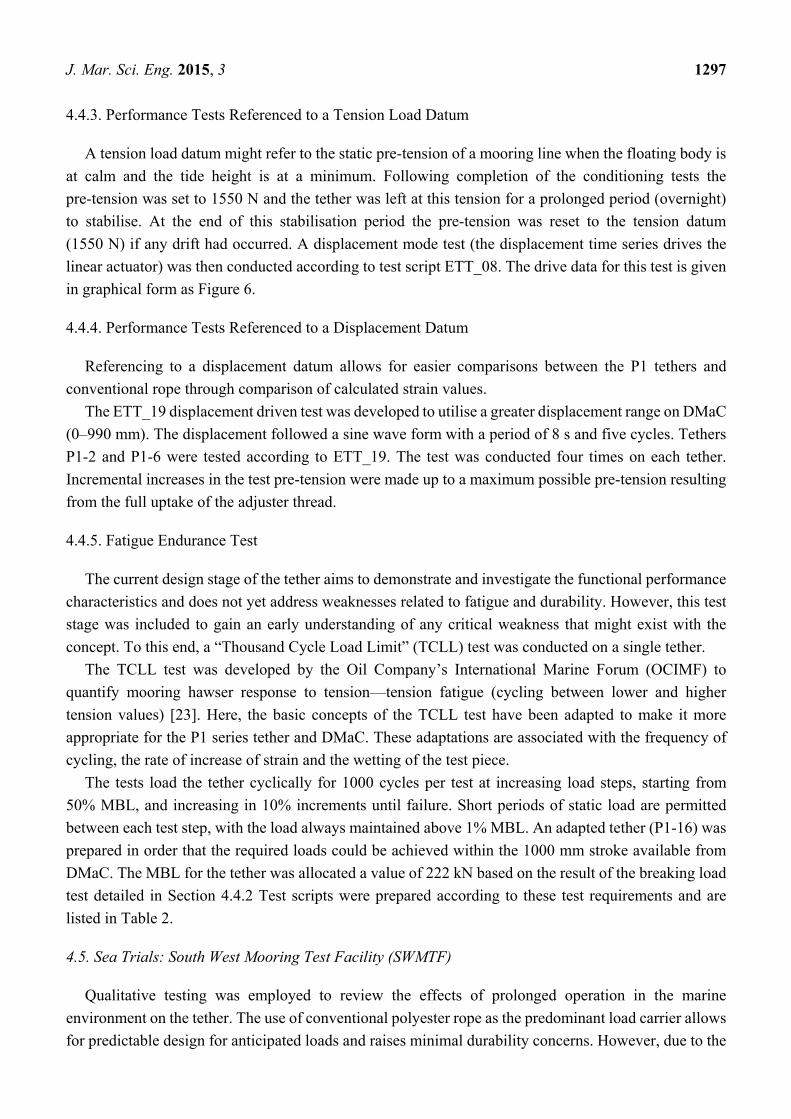
Tests were performed on tethers P1-3 and P1-6 (following conditioning tests) using the displacement
driven test ETT_08 (see Figure 6). A draw wire linear transducer was used to measure the extension
between the connection shackle and the closest end of the working tether length. These tests were
performed without submersion to eliminate the risk of water ingress and damage to the transducer.
Figure 6. The displacement (extension) drive data for test ETT_08.
4.4.2. Breaking Load Test
Due to the compliance of the P1 series tethers, the maximum tension load that could be realised using
all of the pre-tension and the full hydraulic stroke length of DMaC fell well short of parting a tether.
It was necessary to manufacture a reduced length tether, P1-17, see Table 1.
Displacement mode test ETT_08 was used to break the tether following the conditioning tests.
The test was conducted without submerging the tether but using a hose to thoroughly wet the assembly.
J. Mar. Sci. Eng. 2015, 3 1297
4.4.3. Performance Tests Referenced to a Tension Load Datum
A tension load datum might refer to the static pre-tension of a mooring line when the floating body is
at calm and the tide height is at a minimum. Following completion of the conditioning tests the
pre-tension was set to 1550 N and the tether was left at this tension for a prolonged period (overnight)
to stabilise. At the end of this stabilisation period the pre-tension was reset to the tension datum
(1550 N) if any drift had occurred. A displacement mode test (the displacement time series drives the
linear actuator) was then conducted according to test script ETT_08. The drive data for this test is given
in graphical form as Figure 6.
4.4.4. Performance Tests Referenced to a Displacement Datum
Referencing to a displacement datum allows for easier comparisons between the P1 tethers and
conventional rope through comparison of calculated strain values.
The ETT_19 displacement driven test was developed to utilise a greater displacement range on DMaC
(0–990 mm). The displacement followed a sine wave form with a period of 8 s and five cycles. Tethers
P1-2 and P1-6 were tested according to ETT_19. The test was conducted four times on each tether.
Incremental increases in the test pre-tension were made up to a maximum possible pre-tension resulting
from the full uptake of the adjuster thread.
4.4.5. Fatigue Endurance Test
The current design stage of the tether aims to demonstrate and investigate the functional performance
characteristics and does not yet address weaknesses related to fatigue and durability. However, this test
stage was included to gain an early understanding of any critical weakness that might exist with the
concept. To this end, a “Thousand Cycle Load Limit” (TCLL) test was conducted on a single tether.
The TCLL test was developed by the Oil Company’s International Marine Forum (OCIMF) to
quantify mooring hawser response to tension—tension fatigue (cycling between lower and higher
tension values) [23]. Here, the basic concepts of the TCLL test have been adapted to make it more
appropriate for the P1 series tether and DMaC. These adaptations are associated with the frequency of
cycling, the rate of increase of strain and the wetting of the test piece.
The tests load the tether cyclically for 1000 cycles per test at increasing load steps, starting from
50% MBL, and increasing in 10% increments until failure. Short periods of static load are permitted
between each test step, with the load always maintained above 1% MBL. An adapted tether (P1-16) was
prepared in order that the required loads could be achieved within the 1000 mm stroke available from
DMaC. The MBL for the tether was allocated a value of 222 kN based on the result of the breaking load
test detailed in Section 4.4.2 Test scripts were prepared according to these test requirements and are
listed in Table 2.
4.5. Sea Trials: South West Mooring Test Facility (SWMTF)
Qualitative testing was employed to review the effects of prolonged operation in the marine
environment on the tether. The use of conventional polyester rope as the predominant load carrier allows
for predictable design for anticipated loads and raises minimal durability concerns. However, due to the

J. Mar. Sci. Eng. 2015, 3 1298
novel nature of other components of the tether, key durability considerations of interest from this sea
trial are:
‐ Biofouling: the extent marine growth can infiltrate the rope, anti-friction membrane, and core of
the tether is of interest. In the short term the change in surface friction and additional weight
could affect tether operation, and in the long term the introduction of rough particles could lead
to friction wear and eventually failure of the tether [24,25].
‐ Anti-friction membrane durability: the effect of the environment and continuous tether operation
on the membrane was reviewed.
‐ Core integrity: the effect of the environment and continuous compression loading on the
elastomer core was reviewed.
The SWMTF operated by the UoE is located in Falmouth Bay and enables mooring systems and
components to be exposed to representative sea conditions, as described in the literature [20,26].
The 3.25 tonne displacement SWMTF buoy has a three-limbed compliant mooring system, each limb
comprising a chain catenary and a fibre rope upper element. The major components of the standard
mooring limb are as follows (listed from the seabed upwards):
1. 1.1 tonne drag embedment anchor
2. DN32 stud link chain × 5 m
3. DN24 open link chain × 36 m
4. Diameter 44 mm double braid nylon rope × 20 m
Four tethers were attached to each other end on end using cow hitches to form a single 19 m long
tether. This line of tethers was substituted for the 20 m nylon rope tail (detailed in point four above) from
the southern limb of the SWMTF mooring system (Figure 7). The tethers were ordered as shown in
Table 3 with P1-8 being positioned at the top where marine growth and wave action is more intensive.
Tether P1-8, having a mid-range nominal core hardness of 70 Shore A and Dacron helical tape
anti-friction membrane, was selected as the primary subject for this trial.
(a) (b)
Figure 7. (a) Four tethers for deployment; (b) tethers being deployed at SWMTF.
J. Mar. Sci. Eng. 2015, 3 1299
Table 3. The tethers deployed at SWMTF and their position in the southern limb.
Position Lower (1st) 2nd 3rd Upper (4th)
Tether P1-10 P1-12 P1-3 P1-8
Deployment of the tethers at the SWMTF was between 3 June 2013 and 26 November 2013 after
which they were recovered for examination.
4.6. Durometer Hardness Testing
The core elastomer material was supplied as five extruded round section lengths of 25 mm diameter
having specified durometer hardness values of 50, 60, 70, 80, and 90 Shore A. A sample of 18 mm in
length was cut from the middle part of each extrusion. The test end of each sample piece was polished
using a wet 240 grit micro-section polishing wheel to produce a uniform flat surface. A Mitutoyo
Hardmatic HH-331(A) durometer was used to take three readings for each test piece. Care was taken to
distribute the three tests around the face of each test piece so as to avoid misrepresentation caused by
slow material recovery after penetration of the indenter. Test indentations were made approximately
8 mm from the edge of the test face.
5. Results and Discussion
5.1. DMaC Extension Tests
5.1.1. Eye Splice Extension Tests
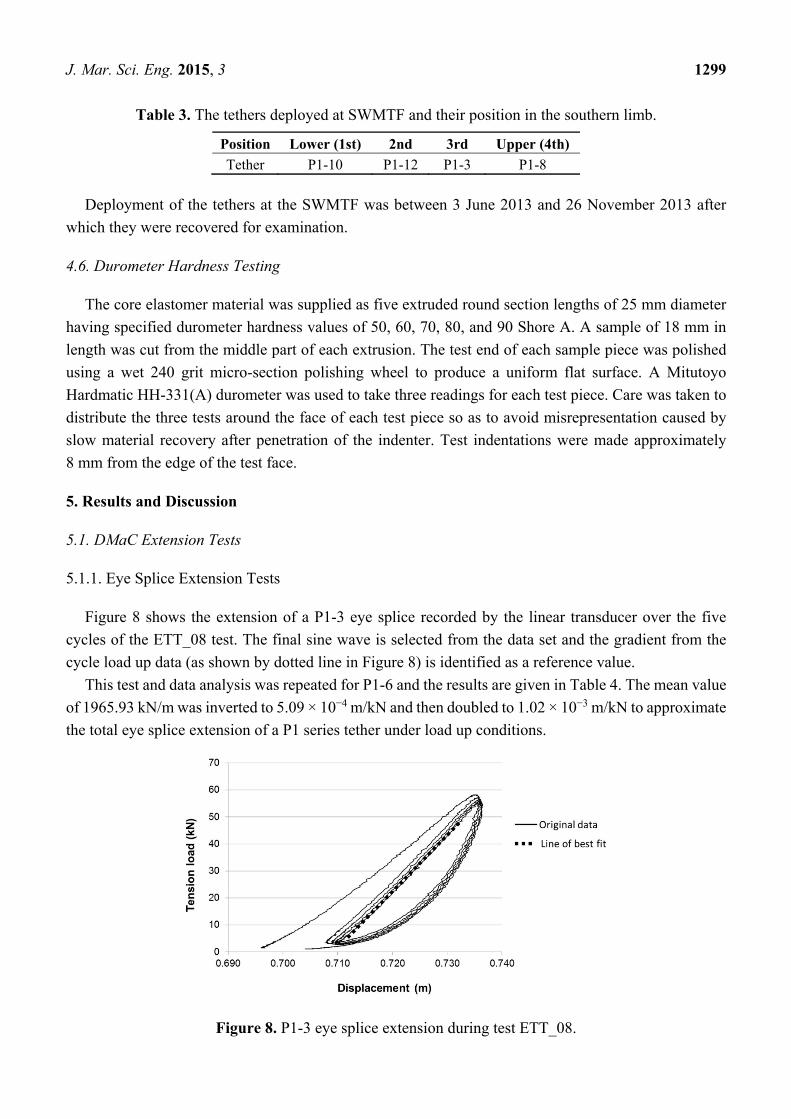
Figure 8 shows the extension of a P1-3 eye splice recorded by the linear transducer over the five
cycles of the ETT_08 test. The final sine wave is selected from the data set and the gradient from the
cycle load up data (as shown by dotted line in Figure 8) is identified as a reference value.
This test and data analysis was repeated for P1-6 and the results are given in Table 4. The mean value
of 1965.93 kN/m was inverted to 5.09 × 10⁻⁴ m/kN and then doubled to 1.02 × 10⁻³ m/kN to approximate
the total eye splice extension of a P1 series tether under load up conditions.
Figure 8. P1-3 eye splice extension during test ETT_08.
J. Mar. Sci. Eng. 2015, 3 1300
Table 4. Results of the eye splice extension tests (where R2 value is the square of the Pearson
product moment correlation coefficient).
Tether I.D. Straight Line Gradient (kN/m) R2 Value
P1-3 (single end) 2065.68 0.999 P1-6 (single end) 1866.18 0.999 Mean (single end) 1965.93 -
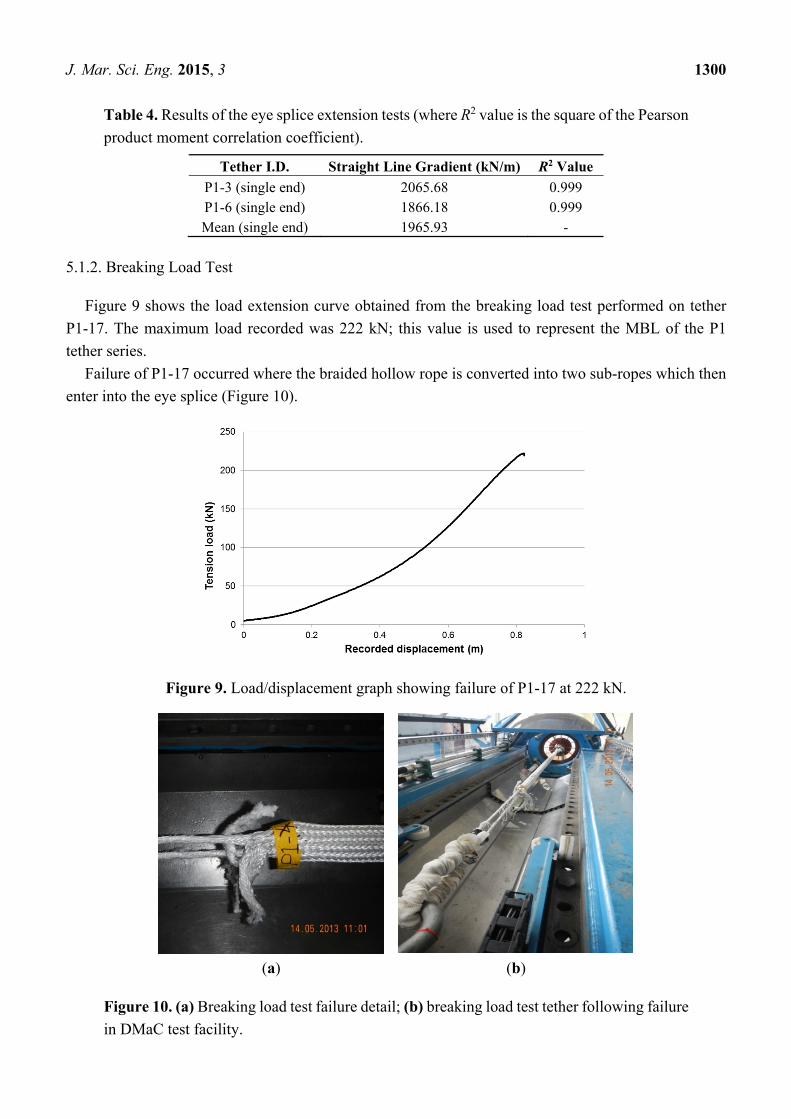
5.1.2. Breaking Load Test
Figure 9 shows the load extension curve obtained from the breaking load test performed on tether
P1-17. The maximum load recorded was 222 kN; this value is used to represent the MBL of the P1
tether series.
Failure of P1-17 occurred where the braided hollow rope is converted into two sub-ropes which then
enter into the eye splice (Figure 10).
Figure 9. Load/displacement graph showing failure of P1-17 at 222 kN.
(a) (b)
Figure 10. (a) Breaking load test failure detail; (b) breaking load test tether following failure
in DMaC test facility.
J. Mar. Sci. Eng. 2015, 3 1301
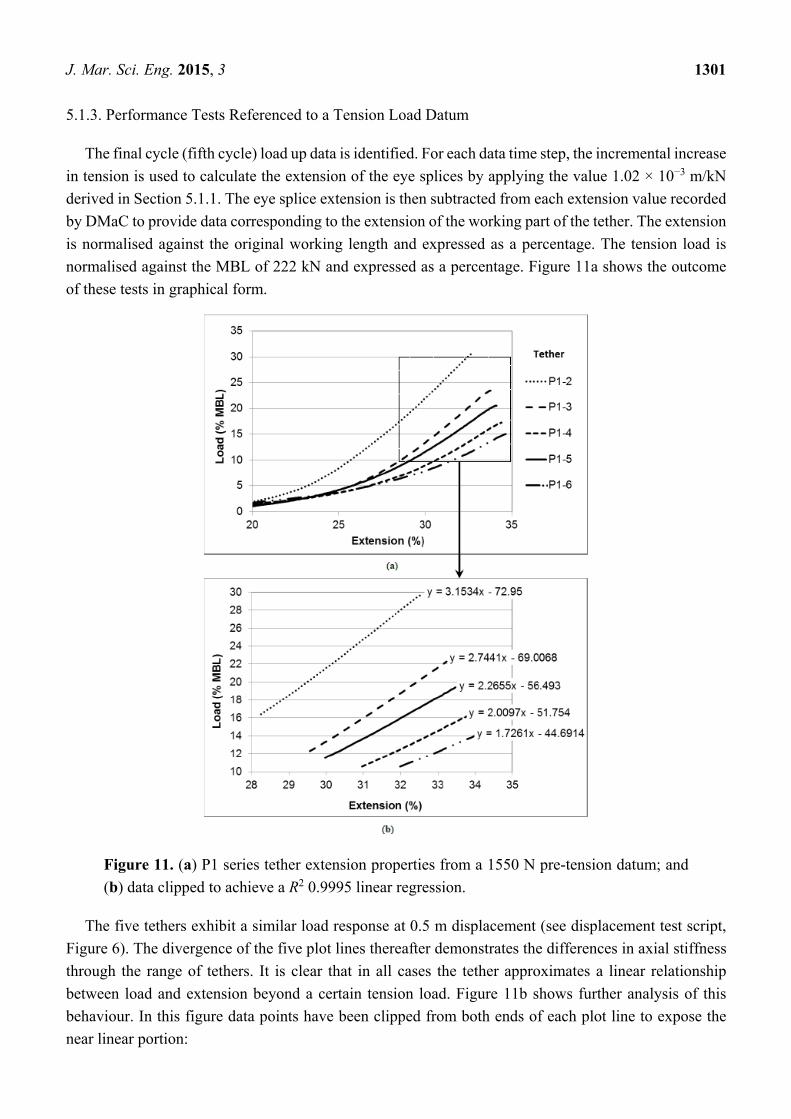
5.1.3. Performance Tests Referenced to a Tension Load Datum
The final cycle (fifth cycle) load up data is identified. For each data time step, the incremental increase
in tension is used to calculate the extension of the eye splices by applying the value 1.02 × 10⁻³ m/kN
derived in Section 5.1.1. The eye splice extension is then subtracted from each extension value recorded
by DMaC to provide data corresponding to the extension of the working part of the tether. The extension
is normalised against the original working length and expressed as a percentage. The tension load is
normalised against the MBL of 222 kN and expressed as a percentage. Figure 11a shows the outcome
of these tests in graphical form.
Figure 11. (a) P1 series tether extension properties from a 1550 N pre-tension datum; and
(b) data clipped to achieve a R2 0.9995 linear regression.
The five tethers exhibit a similar load response at 0.5 m displacement (see displacement test script,
Figure 6). The divergence of the five plot lines thereafter demonstrates the differences in axial stiffness
through the range of tethers. It is clear that in all cases the tether approximates a linear relationship
between load and extension beyond a certain tension load. Figure 11b shows further analysis of this
behaviour. In this figure data points have been clipped from both ends of each plot line to expose the
near linear portion:
J. Mar. Sci. Eng. 2015, 3 1302
- The final 20 data points have been clipped from each data set to remove a small portion of
non-linear behaviour at the top end of the load up cycle. This non-linear behaviour is caused by
the viscous, time dependant properties of the elastomers as the displacement sine wave causes
the stroke velocity to tend towards zero.
- A much greater amount of data has been removed from the lower end of the plot lines. Sufficient
data was removed so that an R2 value (the square of the Pearson product moment correlation
coefficient) of 0.9995 was achieved with the remaining data.
The equation for the near linear line was then detailed (Figure 11b); the critical value being the
gradient, as this represents the tether axial stiffness, the crucial property under investigation.
The equation of the best fit straight line is shown in Figure 11b and the gradients are repeated in
Table 5. The tethers are ranked according to their gradient and it is apparent that there is a relationship
between the durometer hardness of the elastomer and the gradient (durometer hardness results are
detailed in Section 5.3). It should be noted that the stiffest tether is achieved with the softest core material
and the most compliant tether with the hardest core material. This counter-intuitive result will be
discussed in Section 6.
Table 5. Tabulated results of the linear regressions shown in Figure 10.
Hardness (Shore A) Tether Gradient Stiffness Ranking
54 P1-2 3.1534 1 59 P1-3 2.7441 2 70 P1-5 2.2655 3 71 P1-4 2.0097 4 81 P1-6 1.7261 5
5.1.4. Performance Tests Referenced to a Displacement Datum
The final cycle (fifth cycle) load up data is identified. In these tests a waterproof linear transducer
recorded extension of the eye splice at one end of the tether during every test. For each displacement
data point, the single eye splice extension result was doubled to approximate the total eye splice
extension. This value was then subtracted from the total tether extension recorded by DMaC to derive
the extension of the working part of the tether.
The tethers yield significantly upon initial loading, taking on a temporary extension “set”. For this
analysis, the extension results are referenced to a “dynamic zero load length” that better represents the
free length of the tether during cyclic loading. This zero load length is derived from a simple static load
versus extension graph for each tether. The equation of the best fit straight line is then applied to the load
recorded at the first data point to derive the corresponding extension.
The tension load for the tethers is referenced against the MBL of 222 kN based on the breaking load
test (Section 5.1.2). This allows load to be plotted as % of MBL for direct comparison to other ropes.
Figure 12 details the extension properties for the tethers tested alongside a reference rope: a double braid
polyester rope in the as new condition (data obtained from Lankhorst Ropes). The P1 series prototypes
exhibit two phases of extension with an intermediate transition phase. The first phase has very low axial

J. Mar. Sci. Eng. 2015, 3 1303
stiffness, the second phase being markedly stiffer. This closely matches the expectations of the
mechanisms described in Section 2.2.
The comparison of P1-2 and P1-6 to the reference rope demonstrates the reduced stiffness achieved
with the tether design, with P1-6 achieving a strain in excess of 35% whilst remaining under 30% MBL.
Figure 12. Normalised extension properties of Exeter Tether prototypes shown alongside a
double braid polyester reference rope.
5.1.5. Fatigue Endurance Test
Tether P1-16 failed during test TETT 28 (a load range of 1%–70% MBL or 2.2–154 kN) at the 176th
cycle. The calculation for the thousand cycle load level is detailed in [23]:
100%6.91 100%
59.91% (2)
where TLL = test load level at which cycles to failure was determined
CTF = cycles to failure at test load level
6.91 = natural logarithm of 1000
Further work is required to fully quantify the TCLL value in relation to other mooring options.
Some publications suggest a TCLL of just 52% for polypropylene ropes [27]; however improvements in
rope technology are now producing ropes with TCLL values approaching 80% [27,28]. For an early
proof of concept prototype 60% is an acceptable TCLL with clear potential for improvement in
subsequent prototypes.
Figure 13. Failed tether under fatigue cycle loading.
J. Mar. Sci. Eng. 2015, 3 1304
The failure (parting of strands) occurred at the point where the rope increases in diameter to envelop
the core bundle. The edge of the core bundle caused fretting which is likely to have promoted this failure,
shown in Figure 13.
Minor changes to the geometry of the core, such as a more gradual slope from the full diameter
bundle to the empty rope should reduce the fretting in this area and lead to an improved TCLL value.
Other variations on membrane could also be trialled to reduce friction at this point. As previously
mentioned the P1 series tethers were designed as a proof of concept and durability was not a main
objective at this stage.
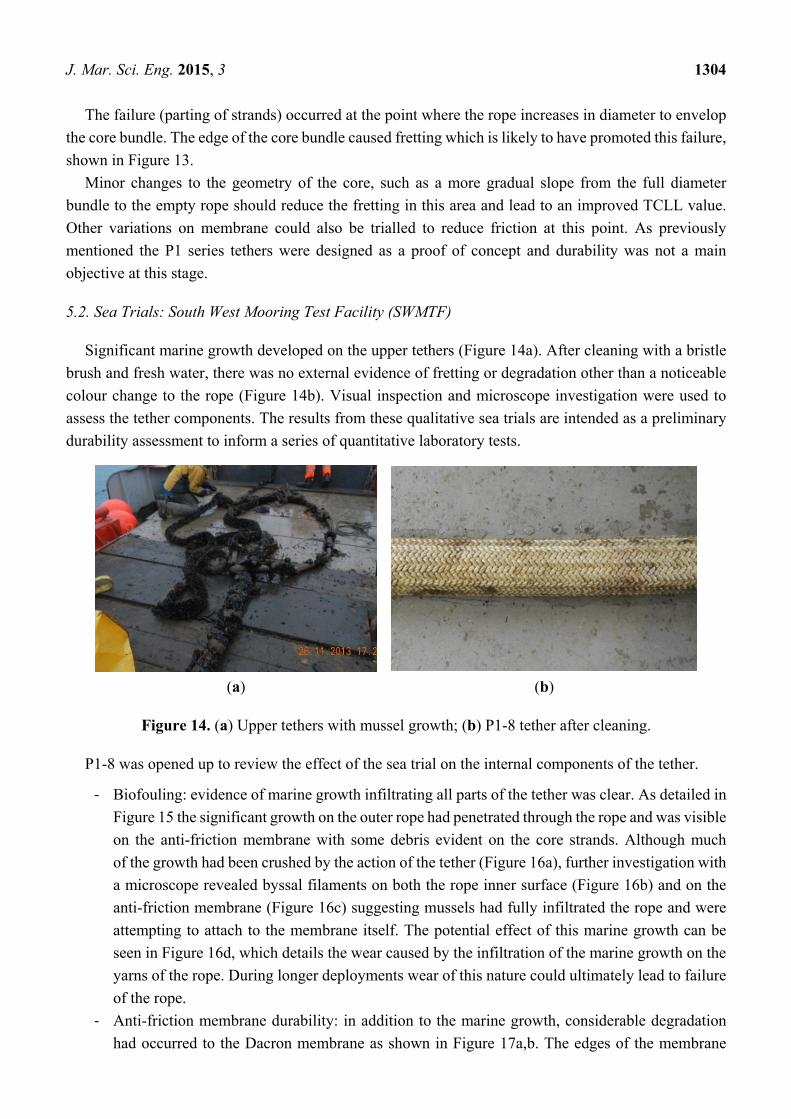
5.2. Sea Trials: South West Mooring Test Facility (SWMTF)
Significant marine growth developed on the upper tethers (Figure 14a). After cleaning with a bristle
brush and fresh water, there was no external evidence of fretting or degradation other than a noticeable
colour change to the rope (Figure 14b). Visual inspection and microscope investigation were used to
assess the tether components. The results from these qualitative sea trials are intended as a preliminary
durability assessment to inform a series of quantitative laboratory tests.
(a) (b)
Figure 14. (a) Upper tethers with mussel growth; (b) P1-8 tether after cleaning.
P1-8 was opened up to review the effect of the sea trial on the internal components of the tether.
‐ Biofouling: evidence of marine growth infiltrating all parts of the tether was clear. As detailed in
Figure 15 the significant growth on the outer rope had penetrated through the rope and was visible
on the anti-friction membrane with some debris evident on the core strands. Although much
of the growth had been crushed by the action of the tether (Figure 16a), further investigation with
a microscope revealed byssal filaments on both the rope inner surface (Figure 16b) and on the
anti-friction membrane (Figure 16c) suggesting mussels had fully infiltrated the rope and were
attempting to attach to the membrane itself. The potential effect of this marine growth can be
seen in Figure 16d, which details the wear caused by the infiltration of the marine growth on the
yarns of the rope. During longer deployments wear of this nature could ultimately lead to failure
of the rope.
‐ Anti-friction membrane durability: in addition to the marine growth, considerable degradation
had occurred to the Dacron membrane as shown in Figure 17a,b. The edges of the membrane

J. Mar. Sci. Eng. 2015, 3 1305
have frayed significantly and “pressure tears” are evident within the membrane. These rough
edges create a higher friction surface which could lead to increased levels of wear to the load
carrying rope during tether operation. The early stage of this may be detailed in Figure 18 where
evidence of the filaments of the rough membrane can be seen in an area of worn rope.
‐ Core integrity: minor compression deformations were visible on the outer surface of the core
elastomer strands as shown in Figure 19. The repeated high pressure exerted by the rope on the
core during tether operation is likely to have caused this imprint. Although the permanent
deformation of the core will not lead to a critical failure of the tether, it requires further
investigation as it may lead to altered operating parameters and therefore reduced mooring
load mitigation.
Figure 15. Internal view of P1-8 following sea trials, debris from marine growth is evident
on the anti-friction membrane.
(a) (b)
Figure 16. Cont.

J. Mar. Sci. Eng. 2015, 3 1306
(c) (d)
Figure 16. (a) Crushed mussel growth; (b) byssal filaments on inner surface of rope;
(c) byssal filaments on the anti-friction membrane; and (d) evidence of wear of rope yarns.
(a)
(b)
Figure 17. (a) Degradation of outer surface of anti-friction membrane; and (b) degradation
of inner surface of anti-friction membrane.

J. Mar. Sci. Eng. 2015, 3 1307
Figure 18. Red strands from anti-friction membrane evident in areas exhibiting wear of
rope yarns.
Figure 19. Minor compression deformations on the outer surface of the tether core strands.
5.3. Durometer Hardness Tests
Durometer hardness readings and mean results are given in Table 6.
From the results detailed, it is clear that the EPDM used for both P1-5 and P1-6 was not as specified.
Results detailed in Section 5.1.3 relating tether performance to hardness values have, therefore, been
presented with reference to the mean hardness values detailed in Table 6.
Table 6. Durometer test results.
Target Tether I.D.
Specified Hardness (Shore A)
Hardness Readings (Shore A)
Mean Hardness (Shore A)
P1-2 50 54 54 54 54.0 P1-3 60 59 59 59 59.0 P1-4 70 70 71 71 70.7 P1-5 80 70 70 70 70.0 P1-6 90 81 80 81 80.7
6. Conclusions and Further Work
The results described here prove the working concept of the Exeter Tether. The tether successfully
de-couples the extension properties from the MBL of the load carrier. Thus, the tether allows the
selection, between certain limits, of axial stiffness for a given MBL. The tether is shown to have
satisfactory load carrying capability and durability for this prototype stage of its development.
J. Mar. Sci. Eng. 2015, 3 1308
During tests, the tether displayed two phases of extension according to the design principles, each
phase having a distinct axial stiffness. The two phases are separated by a smooth transition phase.
The initial phase is one that provides soft extension properties up to a load limit of around 5% of MBL.
The second phase of extension displays a markedly stiffer behaviour but remains less stiff than a double
braid rope of the same material.
The stiffness of the second phase is shown to be inversely related to the durometer hardness of the
core material. It is possible that this effect is due to bulging of the core material into the space between
the braided rope strands; this material then provides direct resistance to the braid angle decrease during
tether extension. The softer materials provide a greater resistance due to increased penetration into the
braid. The analysis of this effect needs to be progressed further before this theory can be confirmed.
Strain values in excess of 0.35 (35% extension) are shown to be achievable whilst remaining below
30% MBL. This is more than three times greater than the strain value achievable at 30% MBL for a
conventional double braid rope of the same material.
Results from the first sea trials of the P1 prototypes are promising and indicate that the tether can
survive nearly six months of exposure to the marine environment with realistic loading conditions and
show minimal wear to the principal load carrier. However, the sea trials have also highlighted three
aspects of the tether that require further investigation. Firstly, the development of an outer protective
jacket is necessary to prevent the ingress of marine growth into the inner components of the tether.
Secondly, the anti-friction membrane should be developed to better withstand the operating conditions
of the tether. Several alternative anti-friction membranes have been assembled and will be trialled under
controlled conditions in DMaC prior to another round of sea testing. Finally, following evidence of
permanent deformation of the tether core, detailed quantitative testing has been conducted on the
elastomer, investigating both the effects of the marine environment and continuous fatigue load cycles
on key material properties. These test results will be detailed in future publications.
The results reported here demonstrate that the Exeter Tether has the potential to mitigate the conflict
between axial stiffness and MBL discussed in the introduction. This will enable mooring designers to
achieve a more compliant mooring design thus reducing peak and fatigue loads and subsequently
reducing the costs of all structural elements within the system. Further work is on-going to quantify the
reductions in peak line loads possible through use of the tether.
Acknowledgments
The authors gratefully acknowledge the support of Lankhorst Ropes who collaborated with the
University of Exeter to conduct the proof of concept study. The authors would also like to acknowledge
the support of the UK Centre for Marine Energy Research (UKCMER) through the SuperGen
programme funded by the EPSRC. Support from IFREMER’s Materials in a Marine Environment
Laboratory is also gratefully acknowledged, funded through the MARINET Programme.
Author Contributions
T.G. and D.P. contributed equally to this paper, and performed all experiments in collaboration.
D.P. conceived the Exeter Tether and developed the P1 series. D.P. led on tether functionality
experimentation and data processing. T.G. led on tether durability experimentation and data processing.
J. Mar. Sci. Eng. 2015, 3 1309
P.T. wrote Section 1 and L.J. provided scientific advice and supervision throughout. All authors
discussed the results and implications, and commented on the manuscript at all stages.
Conflicts of Interest
The authors declare no conflict of interest.
References
1. Johanning, L.; Wolfram, J. Challenging tasks on moorings for floating wecs. In Proceedings of the
International Symposium on Fluid Machinery for Wave and Tidal Energy (IMechE), London, UK,
19 October 2005.
2. Johanning, L.; Smith, G.; Wolfram, J. Towards design standards for wec moorings. In Proceedings
of the 6th European Wave Tidal Energy Conference, Glasgow, UK, 29 September–2 October 2005.
3. Johanning, L.; Smith, G.H.; Wolfram, J. Measurements of static and dynamic mooring line damping
and their importance for floating wec devices. Ocean Eng. 2007, 34, 1918–1934.
4. Harris, R.E.; Johanning, L.; Wolfram, J. Mooring systems for wave energy converters: A review of
design issues and choices. In Proceedings of the 3rd International Conference on Marine Renewable
Energy, Blyth, UK, 6–9 July 2004.
5. Joosten, H. Elastic mooring of navigation buoys. Int. Ocean Syst. 2006, 10, 16.
6. Musial, W.; Butterfield, S.; Boone, A. Feasibility of floating platform systems for wind turbines.
In Proceedings of the 23rd ASME Wind Energy Symposium, Reno, NV, USA, 5–8 January 2004.
7. Bachynski, E.E.; Moan, T. Design considerations for tension leg platform wind turbines.
Mar. Struct. 2012, 29, 89–114.
8. Bengtsson, N.; Ekström, V. Seaflex. The Buoy Mooring System: Increase Life Cycle and Decrease
Cost for Navigation Buoys; Technical Report for Navigations Teknik AB: Vinslöv, Sweden, 2010.
9. McEvoy, P. Combined elastomeric and thermoplasit mooring tethers. In Proceedings of the 4th
International Conference on Ocean Energy, Dublin, Ireland, 17–19 October 2012.
10. Thies, P.R.; Johanning, L.; McEvoy, P. A novel mooring tether for peak load mitigation:
Performance and service simulation testing. Int. J. Mar. Energy 2014, 7, 43–56.
11. Thies, P.R.; Crowley, S.; Johanning, L.; Micklethwaite, W.; Ye, H.; Tang, D.; Cui, L.; Li, X. Novel
mooring design options for high-intensity typhoon conditions—An investigation for wave energy
in china. In Proceedings of the Royal Institution of Naval Archiects (RINA) Structural Load &
Fatigue on Floating Structures, London, UK, 25–26 February 2015.
12. Parish, D. A Novel Mooring Tether for Highly Dynamic Offshore Applications. University of
Exeter: Exeter, UK, 2015.
13. McKenna, H.A.; Hearle, J.W.S.; O’Hear, N. Handbook of Fibre Rope Technology; Woodhead
Publishing in Textiles: Cambridge, UK, 2000.
14. Oil Companies International Marine Forum. Effective Mooring: Your Guide to Mooring Equipment
and Operations, 2nd ed.; Witherby’s Publishing: Livingston, UK, 2005.
15. Weller, S.; Davies, P.; Johanning, L. The influence of load history on synthetic rope. In Proceedings
of the European Wave and Tidal Energy Conference, Aalborg, Denmark, 2–5 September 2013.

J. Mar. Sci. Eng. 2015, 3 1310
16. Parish, D.; Johanning, L. Mooring Limb. International Patent Application Publication Number:
Wo 2011/089545 A1, 28 July 2011.
17. Parish, D.; Johanning, L. Mooring limb. US Patent Application Publisher No. US 2012/0298028
A1, 29 November 2012.
18. Johanning, L.; Thies, P.R.; Smith, G.H. Component test facilities for marine renewable energy
converters. In Proceedings of the Marine and Offshore Renewable Energy Conference, London,
UK, 21–23 April 2010.
19. Thies, P.R.; Johanning, L. Development of a marine component testing facility for marine energy
converters. In Proceedings of the 3rd International Conference on Ocean Energy, Bilbao, Spain,
6–8 October 2010.
20. Weller, S.D.; Thies, P.R.; Gordelier, T.; Parish, D.; Harnois, V.; Johanning, L. Navigating the valley
of death: Reducing reliability uncertainties for marine renewable energy. In Proceedings of
the ASRSNet International Conference on Offshore Renewable Energy, Glasgow, UK, 15–17
September 2014.
21. Mark, J.E.; Erman, B.; Roland, M. The Science and Technology of Rubber; Academic Press:
Waltham, MA, US, 2013.
22. Cantournet, S.; Desmorat, R.; Besson, J. Mullins effect and cyclic stress softening of filled
elastomers by internal sliding and friction thermodynamics model. Int. J. Solids Struct. 2009, 46,
2255–2264.
23. Oil Companies International Marine Forum. Guidelines for the Purchasing and Testing of Spm
Hawsers; Witherby’s Publishing: Livingston, UK, 2000.
24. Polyurethane Elastomer Coating; Offshore division, Lankhorst Ropes: Póvoa de Varzim,
Portugal, 2010.
25. Ayres, R. Characterizing Polyester Rope Mooring Installation Damage; Inc. report to Minerals
Management Service: Washington, DC, USA, 2001.
26. Johanning, L.; Spargo, A.; Parish, D. Large scale mooring test facility: A technical note.
In Proceedings of the 2nd International Conference on Ocean Energy (ICOE), Brest, France,
15–17 October 2008.
27. Baaj, H.P. Maritime Ropes Briefing 1/2011; Lankhorst Ropes: Sneek, The Netherlands, 2011.
28. High Performance Ropes Euroflex (Catalouge Extract); Lankhorst Ropes: Sneek,
The Netherlands, 2008.
© 2015 by the authors; licensee MDPI, Basel, Switzerland. This article is an open access article
distributed under the terms and conditions of the Creative Commons Attribution license
(http://creativecommons.org/licenses/by/4.0/).