a novel ontology and machine learning driven hybrid … · 2015-11-03 · cal decision support...
TRANSCRIPT

A Novel Ontology and Machine Learning DrivenHybrid Clinical Decision Support Framework for
Cardiovascular Preventative Care
Thesis submitted in accordance with the requirements ofthe University of Stirling for the degree of Doctor of Philosophy
by
Kamran Farooq
Division of Computing Science and MathematicsSchool of Natural Sciences
University of StirlingScotland, UK
March 2015

Kamran Farooq : A Novel Ontology and Machine Learning Driven Hy-
brid Clinical Decision Support Framework for Cardiovascular Preventative Care
Doctor of Philosophy, © March 2015
i

ABSTRACT
Clinical risk assessment of chronic illnesses is a challenging and complex task
which requires the utilisation of standardised clinical practice guidelines and doc-
umentation procedures in order to ensure consistent and efficient patient care.
Conventional cardiovascular decision support systems have significant limitations,
which include the inflexibility to deal with complex clinical processes, hard-wired
rigid architectures based on branching logic and the inability to deal with legacy
patient data without significant software engineering work. In light of these chal-
lenges, we are proposing a novel ontology and machine learning-driven hybrid
clinical decision support framework for cardiovascular preventative care.
An ontology-inspired approach provides a foundation for information collec-
tion, knowledge acquisition and decision support capabilities and aims to develop
context sensitive decision support solutions based on ontology engineering prin-
ciples. The proposed framework incorporates an ontology-driven clinical risk
assessment and recommendation system (ODCRARS) and a Machine Learning
Driven Prognostic System (MLDPS), integrated as a complete system to pro-
vide a cardiovascular preventative care solution. The proposed clinical decision
support framework has been developed under the close supervision of clinical do-
main experts from both UK and US hospitals and is capable of handling multiple
cardiovascular diseases.
The proposed framework comprises of two novel key components: (1) OD-
CRARS (2) MLDPS.
The ODCRARS is developed under the close supervision of consultant car-
diologists Professor Calum MacRae from Harvard Medical School and Professor
ii

Stephen Leslie from Raigmore Hospital in Inverness, UK. The ODCRARS com-
prises of various components, which include:
(a) Ontology-driven intelligent context-aware information collection for con-
ducting patient interviews which are driven through a novel clinical questionnaire
ontology.
(b) A patient semantic profile, is generated using patient medical records
which are collated during patient interviews (conducted through an ontology-
driven context aware adaptive information collection component). The semantic
transformation of patients medical data is carried out through a novel patient
semantic profile ontology in order to give patient data an intrinsic meaning and
alleviate interoperability issues with third party healthcare systems.
(c) Ontology driven clinical decision support comprises of a recommendation
ontology and a NICE/Expert driven clinical rules engine. The recommendation
ontology is developed using clinical rules provided by the consultant cardiologist
from the US hospital. The recommendation ontology utilises the patient semantic
profile for lab tests and medication recommendation.
A clinical rules engine is developed to implement a cardiac risk assessment
mechanism for various cardiovascular conditions. The clinical rules engine is also
utilised to control the patient flow within the integrated cardiovascular preven-
tative care solution.
The machine learning-driven prognostic system is developed in an iterative
manner using state of the art feature selection and machine learning techniques. A
prognostic model development process is exploited for the development of MLDPS
based on clinical case studies in the cardiovascular domain. An additional clinical
case study in the breast cancer domain is also carried out for the development and
validation purposes. The prognostic model development process is general enough
to handle a variety of healthcare datasets which will enable researchers to develop
cost effective and evidence based clinical decision support systems. The proposed
clinical decision support framework also provides a learning mechanism based on
machine learning techniques. Learning mechanism is provided through exchange
of patient data amongst the MLDPS and the ODCRARS. The machine learning-
iii

driven prognostic system is validated using Raigmore Hospital’s RACPC, heart
disease and breast cancer clinical case studies.
iv

Contents
ABSTRACT ii
CONTENTS x
LIST OF FIGURES xviii
LIST OF TABLES xviii
DECLARATION xix
ACKNOWLEDGEMENTS xx
GLOSSARY OF ABBREVIATIONS xxii
1 INTRODUCTION 1
1.1 Organisation of Thesis . . . . . . . . . . . . . . . . . . . . . . . . 5
1.2 Motivation and aims . . . . . . . . . . . . . . . . . . . . . . . . . 6
1.3 Original Contributions . . . . . . . . . . . . . . . . . . . . . . . . 7
1.4 Publications . . . . . . . . . . . . . . . . . . . . . . . . . . . . . . 9
2 LITERATURE REVIEW 14
2.1 Clinical Decision Support Systems . . . . . . . . . . . . . . . . . . 14
2.1.1 Ontology Driven Clinical Decision Support Frameworks . . 18
2.1.2 Clinical Decision Support Systems in Cardiovascular Care 26
2.1.3 Cardiovascular Risk Estimation Systems for Disease Pre-
vention . . . . . . . . . . . . . . . . . . . . . . . . . . . . . 29
v

2.1.4 Machine Learning Driven Cardiovascular Decision Support
Systems . . . . . . . . . . . . . . . . . . . . . . . . . . . . 31
2.1.5 Role of Feature Selection in Clinical Decision Support Sys-
tems . . . . . . . . . . . . . . . . . . . . . . . . . . . . . . 35
2.2 Conclusion and Discussion . . . . . . . . . . . . . . . . . . . . . . 38
3 A Novel Ontology and Machine Learning Driven Hybrid Clini-
cal Decision Support Framework for Cardiovascular Preventative
Care 40
3.1 Proposed Framework . . . . . . . . . . . . . . . . . . . . . . . . . 41
3.2 ODCRARS for Cardiovascular Preventative Care . . . . . . . . . 46
3.2.1 Ontology driven intelligent context aware information col-
lection component . . . . . . . . . . . . . . . . . . . . . . 46
3.2.2 Patient Medical Records . . . . . . . . . . . . . . . . . . . 49
3.2.3 Ontology Driven Decision Support . . . . . . . . . . . . . 52
3.3 Machine Learning Driven Prognostic Modelling for Cardiovascular
Preventative Care . . . . . . . . . . . . . . . . . . . . . . . . . . 53
3.4 Machine Learning Driven Prognostic Model . . . . . . . . . . . . 54
3.4.1 Data Acquisition . . . . . . . . . . . . . . . . . . . . . . . 55
3.4.2 Data Pre-Processing . . . . . . . . . . . . . . . . . . . . . 56
3.4.3 Feature Selection . . . . . . . . . . . . . . . . . . . . . . . 59
3.4.4 Prognostic Model Development . . . . . . . . . . . . . . . 60
3.4.5 Prognostic Model Validation and Evaluation . . . . . . . . 61
3.4.6 Online Clinical Prognostic Model . . . . . . . . . . . . . . 65
3.5 Conclusion and Discussion . . . . . . . . . . . . . . . . . . . . . . 65
4 Ontology Driven Clinical Risk Assessment and Recommendation
System (ODCRARS) for Cardiovascular Preventative Care 67
4.1 Implementation of the Ontology Driven Clinical Risk Assessment
and Recommendation System (ODCRARS) . . . . . . . . . . . . 68
4.2 Ontology driven intelligent context aware information collection:
Design and Implementation . . . . . . . . . . . . . . . . . . . . . 70
vi

4.2.1 Ontology Driven Intelligent Context Aware Ontology Model 71
4.2.2 Adaptive Clinical Questionnaire: Design and Implementation 74
4.2.3 Proposed Novel Decision Tree based Approach . . . . . . 75
4.2.4 Dynamic Adaptation . . . . . . . . . . . . . . . . . . . . . 77
4.3 Patient Medical Records . . . . . . . . . . . . . . . . . . . . . . . 79
4.4 Patient Semantic Profile : Design and Implementation . . . . . . 81
4.4.1 Ontology Development . . . . . . . . . . . . . . . . . . . . 82
4.5 Ontology Driven Clinical Decision Support: Design and Implemen-
tation . . . . . . . . . . . . . . . . . . . . . . . . . . . . . . . . . 87
4.5.1 Recommendation Ontology . . . . . . . . . . . . . . . . . . 88
4.6 Clinical Rules Engine: Design and Implementation . . . . . . . . 92
4.6.1 Clinical Rules Data - Patient Fact Representation . . . . . 93
4.6.2 Jess: Java based Rules Engine . . . . . . . . . . . . . . . 94
4.6.3 Partitioning the Rules . . . . . . . . . . . . . . . . . . . . 98
4.6.4 Cardiovascular Risk Assessment . . . . . . . . . . . . . . 103
4.7 System Implementation: Integration of ODCRARS and MLDPS . 107
4.7.1 Patient Module . . . . . . . . . . . . . . . . . . . . . . . . 107
4.8 Doctor’s Module . . . . . . . . . . . . . . . . . . . . . . . . . . . 108
4.8.1 Integration of the ODCRARS with the machine learning
driven cardiac chest pain and heart disease prognostic models111
4.9 Conclusion and Discussion . . . . . . . . . . . . . . . . . . . . . . 113
5 Machine Learning Driven Prognostic System (MLDPS) for Car-
diovascular Preventative Care 115
5.1 Case Study 1: Rapid Access Chest Pain Clinic . . . . . . . . . . . 116
5.1.1 Background . . . . . . . . . . . . . . . . . . . . . . . . . . 116
5.1.2 Aims . . . . . . . . . . . . . . . . . . . . . . . . . . . . . . 118
5.2 RACPC Clinical Dataset 1 . . . . . . . . . . . . . . . . . . . . . . 119
5.2.1 Data Acquisition . . . . . . . . . . . . . . . . . . . . . . . 119
5.2.2 Data Preparation . . . . . . . . . . . . . . . . . . . . . . . 120
5.2.3 Missing Data Handling . . . . . . . . . . . . . . . . . . . . 122
vii

5.2.4 Feature Selection . . . . . . . . . . . . . . . . . . . . . . . 123
5.2.5 Prognostic Model Development: Experimental Setups and
Results . . . . . . . . . . . . . . . . . . . . . . . . . . . . . 124
5.2.6 Final Diagnosis . . . . . . . . . . . . . . . . . . . . . . . . 124
5.2.7 Evaluation of RACPC Results . . . . . . . . . . . . . . . . 125
5.2.8 Results of Comparative Machine Learning Classification . 127
5.2.9 Analysis of Variance (ANOVA) Test for Performance Eval-
uation . . . . . . . . . . . . . . . . . . . . . . . . . . . . . 132
5.3 RACPC Clinical Dataset 2: Demonstrating Effects of missing
Data on Verification Results . . . . . . . . . . . . . . . . . . . . . 139
5.3.1 Background . . . . . . . . . . . . . . . . . . . . . . . . . . 139
5.3.2 Pre-processing of Missing Data using Probability Estimation141
5.3.3 Expectation Maximisation (EM) Approach . . . . . . . . . 142
5.3.4 Experiments . . . . . . . . . . . . . . . . . . . . . . . . . . 144
5.3.5 Classification for the Incomplete Clinical Data . . . . . . . 145
5.3.6 Filling the Incomplete Data . . . . . . . . . . . . . . . . . 145
5.4 RACPC Clinical Case Study: RACPC Clinical Dataset 3 . . . . 149
5.4.1 Study Group 1: Clinical Risk Factors . . . . . . . . . . . . 150
5.4.2 Evaluation . . . . . . . . . . . . . . . . . . . . . . . . . . . 151
5.4.3 Performance evaluation of experimental setups . . . . . . 153
5.4.4 Study Group 2: Test Results . . . . . . . . . . . . . . . . . 156
5.4.5 Evaluation . . . . . . . . . . . . . . . . . . . . . . . . . . . 156
5.4.6 Performance evaluation of experimental setups . . . . . . . 158
5.4.7 Implementation of online Clinical Prognostic Models . . . 159
5.4.8 Machine Learning Driven Cardiac chest pain prognostic
model’s integration with the recommendation system . . . 164
5.5 Case Study 2: Heart Disease . . . . . . . . . . . . . . . . . . . . . 165
5.5.1 Background . . . . . . . . . . . . . . . . . . . . . . . . . . 165
5.5.2 Aims . . . . . . . . . . . . . . . . . . . . . . . . . . . . . . 166
5.5.3 Data Preparation . . . . . . . . . . . . . . . . . . . . . . . 167
5.5.4 Feature Selection . . . . . . . . . . . . . . . . . . . . . . . 170
viii

5.5.5 Prognostic Model Development . . . . . . . . . . . . . . . 170
5.5.6 Prognostic Model Validation and Evaluation . . . . . . . . 171
5.5.7 Performance evaluation of experimental setups . . . . . . . 173
5.5.8 Implementation of online Clinical Prognostic Models . . . 174
5.6 Case Study 3: Breast Cancer Prognostic Modelling . . . . . . . . 180
5.6.1 Background . . . . . . . . . . . . . . . . . . . . . . . . . . 180
5.6.2 Aims . . . . . . . . . . . . . . . . . . . . . . . . . . . . . . 180
5.6.3 Candidate Clinical Variable Selection . . . . . . . . . . . . 180
5.6.4 Prognostic Model Development . . . . . . . . . . . . . . . 181
5.6.5 Prognostic Model Validation and Evaluation . . . . . . . . 182
5.6.6 Performance Evaluation of Experimental Setups . . . . . . 184
5.6.7 Online Clinical Prognostic Model . . . . . . . . . . . . . . 187
5.7 Verification and Validation of the Clinical Prototypes . . . . . . . 188
5.7.1 Validation of the Machine Learning Driven System (MLDPS)
and Ontology Driven Clinical Risk Assessment and Recom-
mendation System (ODCRARS) . . . . . . . . . . . . . . . 189
5.8 Summary and Conclusion . . . . . . . . . . . . . . . . . . . . . . 195
6 CONCLUSIONS AND FUTURE WORK 197
6.1 Conclusions . . . . . . . . . . . . . . . . . . . . . . . . . . . . . . 197
6.2 Discussion and Summary of Contributions . . . . . . . . . . . . . 198
6.3 Future Work . . . . . . . . . . . . . . . . . . . . . . . . . . . . . . 203
6.3.1 Utilisation of Fuzzy Cognitive Maps for Collaborative Care 204
6.3.2 Active Manifold Learning Strategy in Machine Learning
Driven Prognsotic Modelling based on Big Data . . . . . . 206
6.4 Limitations . . . . . . . . . . . . . . . . . . . . . . . . . . . . . . 208
Appendices 209
A Clinical Experts Validation Feedback 210
B RACPC Clinical Case Study: Clinical dataset 3 detailed analysis216
ix

C Breast Cancer Clinical Case Study: Comparative Machine Learn-
ing Analysis 219
C.1 Kernel Models Implementation with Logistic Regression . . . . . . 219
C.1.1 Performance Vector . . . . . . . . . . . . . . . . . . . . . . 219
C.2 Random Forest Classification Results . . . . . . . . . . . . . . . . 223
Bibliography 240
x

List of Figures
2.1 Example of a Rule encoded in MYCIN. [1] . . . . . . . . . . . . . 18
2.2 Hybrid architecture of the rule-engine / clinical knowledge-base
preoperative risk assessment system [2]. . . . . . . . . . . . . . . . 20
2.3 Ontology Driven Breast Cancer Decision Support System [3]. . . . 23
2.4 Hybrid Clinical Decision Support System [4]. . . . . . . . . . . . . 24
2.5 Hybrid Decision Support Model for Optimal Ventricular Assist De-
vice Weaning [5]. . . . . . . . . . . . . . . . . . . . . . . . . . . . 34
2.6 Feature selection process based on wrappers and filtering methods. 37
2.7 Block Diagram of SFFS Algorithm as described by Hicham et al. . 38
3.1 A Novel Ontology and Machine learning-driven hybrid Clinical De-
cision Support Framework for Cardiovascular Preventative Care. . 44
3.2 Chest Pain risk assessment questionnaire encoded in MUMPS, de-
veloped by Professor Warner Slack from Harvard Medical School
[6]. . . . . . . . . . . . . . . . . . . . . . . . . . . . . . . . . . . . 48
3.3 Patient Semantic Profile in OWL, developed using Protege-OWL. 51
3.4 Schematic view of the Prognostic Model development process. . . 55
3.5 A sample ROC curve. The dotted line on the 45 degree diagonal
is the expected curve to show that the classifier is making random
predictions. . . . . . . . . . . . . . . . . . . . . . . . . . . . . . . 64
4.1 The Ontology Driven Clinical Risk Assessment and Recommenda-
tion System’s Generic Clinical Questionnaire Ontology. . . . . . . 72
xi

4.2 Context Sensitive Questionnaire Tree Structure. . . . . . . . . . . 76
4.3 Tree Structure detail . . . . . . . . . . . . . . . . . . . . . . . . . 77
4.4 Stack implementation of the context-sensitive questionnaire. . . . 78
4.5 The Architecture of the Ontology Driven Intelligent Context Aware
Questionnaire. . . . . . . . . . . . . . . . . . . . . . . . . . . . . . 79
4.6 The Architecture of the Ontology Driven Intelligent Context Aware
Questionnaire. . . . . . . . . . . . . . . . . . . . . . . . . . . . . . 80
4.7 Answers collated during Patient’s System Review. . . . . . . . . . 81
4.8 Patient Semantic Profile classes and visualisation in OWLVIZ In-
terface. . . . . . . . . . . . . . . . . . . . . . . . . . . . . . . . . . 83
4.9 Object Properties list in Protg-4.1. . . . . . . . . . . . . . . . . . 84
4.10 Data Properties in Patient Semantic Profile ontology. . . . . . . . 85
4.11 Patient Semantic Profile developed in Protege OWL. . . . . . . . 86
4.12 OWLVIZ classes view of the Recommendation Ontology. . . . . . 89
4.13 Clinical Rules for Lab Tests Recommendation. . . . . . . . . . . . 90
4.14 List of Suggested Lab Tests. . . . . . . . . . . . . . . . . . . . . . 90
4.15 Clinical Rules for Medication Prescription. . . . . . . . . . . . . . 91
4.16 Clinical Rules Execution Life Cycle. . . . . . . . . . . . . . . . . . 93
4.17 Patient’s basic details representation as a fact using the patient
fact template. . . . . . . . . . . . . . . . . . . . . . . . . . . . . . 95
4.18 Patient symptoms and signs representation as facts. . . . . . . . . 96
4.19 Flow Chart Diagram for Review of the System Procedure. . . . . 97
4.20 Flow chart diagram represents patient flow within the Recommen-
dation system. . . . . . . . . . . . . . . . . . . . . . . . . . . . . . 100
4.21 Rules for the first two steps to control Patient Flow. . . . . . . . . 101
4.22 Screenshot showing the first two steps in patient flow. . . . . . . . 101
4.23 Screenshot showing a visit-doctor halt. . . . . . . . . . . . . . . . 102
4.24 Cardiac Risk Assessment Mechanism provided by the Clinical De-
cision Support Framework. . . . . . . . . . . . . . . . . . . . . . . 105
4.25 Use Case for the Patient and Clinicians . . . . . . . . . . . . . . . 108
4.26 Patients’ Interface. . . . . . . . . . . . . . . . . . . . . . . . . . . 109
xii

4.27 Doctor’s interface. . . . . . . . . . . . . . . . . . . . . . . . . . . . 110
4.28 Integration of ODCRARS and MLDPS. . . . . . . . . . . . . . . . 113
5.1 Data Acquisition Stages - Raigmore Hospital’s RACPC Databases. 120
5.2 Graphical output of weighted classification accuracies using differ-
ent setups. . . . . . . . . . . . . . . . . . . . . . . . . . . . . . . . 135
5.3 Confusion Matrix for a binary classification problem. . . . . . . . 136
5.4 ROC curves for different Experimental Setups. . . . . . . . . . . . 136
5.5 ROCs using different experimental setups, SFFS feature selection
is also compared. . . . . . . . . . . . . . . . . . . . . . . . . . . . 137
5.6 ROCs using different experimental setups, mRMR feature selection
is added. . . . . . . . . . . . . . . . . . . . . . . . . . . . . . . . . 138
5.7 Upper figure: Multi-colour graph represents 5 randomly selected
datasets in which 4 datasets were used for training and 1 for testing
(for each M). Lower figure: Experimental results showing average
accuracies of different number of mixture density models . . . . . 147
5.8 Upper figure: Multi-colour graph represents accuracies obtained
using 5 randomly selected datasets in which 4 datasets were used
for training and 1 for testing for each different type of kernel func-
tion. Lower figure: Experimental results showing average accura-
cies of different types of kernel functions including: 1- Linear, 2-
Polynomial, 3- Radial Basis Function and 4- Sigmoid Function . . 148
5.9 ROC curves of various experimental setups utilised in the study
group 1 for comparison purpose. . . . . . . . . . . . . . . . . . . . 154
5.10 ROCs for various experimental setups utilised in Test Results (study
group 2) for comparison purpose. . . . . . . . . . . . . . . . . . . 160
5.11 Cardiac Chest Pain Prognostic Model’s front end. . . . . . . . . . 162
5.12 Output example of the Cardiac Chest Pain Prognostic Model. . . 163
5.13 Output example of the Cardiac Chest Pain Prognostic Model. . . 164
5.14 Output example of the Cardiac Chest Pain Prognostic Model. . . 165
5.15 ROC curves of the best classification setups for comparison purpose.175
xiii

5.16 Machine Learning Driven Heart Disease Prognostic Model’s front
end, is available at http://www.cs.stir.ac.uk/ kfa/HDP/hd3/hd3.html.177
5.17 Output example of the Machine Learning driven Heart Disease
Prognostic Model. . . . . . . . . . . . . . . . . . . . . . . . . . . . 178
5.18 Machine Learning Driven Heart Disease Prognostic Model’s front
end, is available at http://www.cs.stir.ac.uk/ kfa/HD1/hd1/hd1.html.178
5.19 Output example of the Cardiac Chest Pain Prognostic Model, is
available at http://www.cs.stir.ac.uk/ kfa/HDP/hd2/hd2.html.179
5.20 ROC curves of the best classification setups for comparison with
the expert driven LR experimental setup. . . . . . . . . . . . . . . 185
5.21 The machine learning driven Breast Cancer Prognsotic Model’s
front end, is available at http://www.cs.stir.ac.uk/ kfa/bc/bc1.html.187
5.22 Clinical use case for the validation of ontology driven clinical risk
assessment and recommendation system. . . . . . . . . . . . . . . 191
5.23 Clinical use case for the validation of Ontology Driven Clinical
Risk Assessment and Recommendation System. . . . . . . . . . . 192
5.24 Clinical validation of the Ontology Driven Clinical Risk Assess-
ment and Recommendation system (ODCRARS). . . . . . . . . . 193
5.25 Cardiac Chest Pain Risk Score Calculation as part of the Inte-
grated ODCRARS. . . . . . . . . . . . . . . . . . . . . . . . . . . 194
6.1 The Architecture of Sentic Avatar proposed by Cambria et al. . . 204
6.2 Representation of an FCM Model as in [7]. . . . . . . . . . . . . . 205
A.1 Consultant Cardiologist, Professor Stephen Leslie’s Feedback on
RACPC Clinical Prototypes. . . . . . . . . . . . . . . . . . . . . . 211
A.2 Clinical validation report issued by General Medical Practitioner
from a GP practice in Edinburgh, Scotland. . . . . . . . . . . . . 212
A.3 Clinical validation report issued by a cardiac thoracic surgeon from
Kings College Hospital in London. . . . . . . . . . . . . . . . . . . 213
A.4 Clinical assessment by clinical informatics expert, Professor Warner
Slack from Harvard Medical School, US. . . . . . . . . . . . . . . 214
xiv

A.5 Clinical validation report issued by the oncologist from The Beat-
son, Cancer Centre, West of Scotland, UK. . . . . . . . . . . . . . 215
C.1 Comparison ROCs. . . . . . . . . . . . . . . . . . . . . . . . . . . 222
C.2 Comparative ROCs after applying various classification techniques 222
C.3 Comparative ROCs Decision Trees . . . . . . . . . . . . . . . . . 224
xv

List of Tables
2.1 The clinical impact of a combination of risk factors on CVD test. 28
3.1 Different types of Coding Schemes for Categorical Variables, adapted
from ”Multiple Regression (MR) Using Categorical Variables in
MR” tutorial. . . . . . . . . . . . . . . . . . . . . . . . . . . . . . 57
3.2 Confusion matrix for two-class classification problem. . . . . . . . 63
4.1 Questionnaire Types for the Review of the System . . . . . . . . . 73
4.2 Prediction Equation Coefficients. . . . . . . . . . . . . . . . . . . 104
4.3 Global Risk Score Calculation . . . . . . . . . . . . . . . . . . . . 106
5.1 Clinical Variables Selected for the RACPC Clinical Case Study. . 122
5.2 Weighted classification Accuracies with common clinical variables
(highlighted in bold) in each iteration. . . . . . . . . . . . . . . . 126
5.3 Classification results in terms of several evaluations. . . . . . . . . 126
5.4 Confusion Matrix of Logistic Regression (LR) based Experimental
Setups. . . . . . . . . . . . . . . . . . . . . . . . . . . . . . . . . . 129
5.5 Confusion Matrix of Decision Tree (DT) based Experimental Setups.130
5.6 Confusion Matrix of Support Vector Machine (SVM) based Exper-
imental Setups. . . . . . . . . . . . . . . . . . . . . . . . . . . . . 130
5.7 P-values of the candidate clinical variables. . . . . . . . . . . . . . 131
5.8 Experimental Setups based on machine learning classifiers and fea-
ture selection techniques. . . . . . . . . . . . . . . . . . . . . . . . 132
xvi

5.9 Anova Summary Table - RACPC Classifiers Performance Measure-
ment. . . . . . . . . . . . . . . . . . . . . . . . . . . . . . . . . . . 133
5.10 Anova Test Results shows F static value, P-value and F critical
value. . . . . . . . . . . . . . . . . . . . . . . . . . . . . . . . . . 134
5.11 RACPC Features List after further Pre-Processing of Smoking free
text Description . . . . . . . . . . . . . . . . . . . . . . . . . . . . 140
5.12 Final Diagnoses . . . . . . . . . . . . . . . . . . . . . . . . . . . . 142
5.13 Clinical Risk Factors and Test Results in two study groups. . . . . 149
5.14 Study group 1 (Risk Factors)- Feature Selection . . . . . . . . . . 151
5.15 The confusion matrix of LR and feature selection based classifica-
tion setups, study group 1. . . . . . . . . . . . . . . . . . . . . . . 152
5.16 Experiment results in terms of different evaluation measurements. 152
5.17 Confusion Matrix of DT and feature selection based classification
setups, study group 1. . . . . . . . . . . . . . . . . . . . . . . . . 152
5.18 Confusion Matrix of SVM and feature selection based classification
setups, study group 1. . . . . . . . . . . . . . . . . . . . . . . . . 153
5.19 One-way ANOVA Test for the performance evaluation of LR, DT
and SVM based classification setups. . . . . . . . . . . . . . . . . 155
5.20 P-values of the clinical variables (study group 2). . . . . . . . . . 157
5.21 Feature Selection results, Study group 2 (Test Results). . . . . . . 157
5.22 Experiment results in terms of different evaluation measurements. 158
5.23 Confusion matrix obtained using LR based classification setups. . 158
5.24 Confusion matrix obtained using DT based classification setups. . 158
5.25 Confusion matrix obtained using SVM based classification setups. 159
5.26 One-way ANOVA Test for the performance evaluation of LR, DT
and SVM based classification setups (Study group 2- Test Results). 161
5.27 Classification setups considered for the development of machine
learning driven cardiac chest pain prognostic model. . . . . . . . . 161
5.28 Clinical Variables extracted from the UCI heart disease dataset. . 168
5.29 Final list of clinical variables after the effects coding scheme. . . . 169
xvii

5.30 P-values of the clinical variables selected in the heart disease clin-
ical case study. . . . . . . . . . . . . . . . . . . . . . . . . . . . . 170
5.31 Experimental setups based on the machine learning classification
and feature selection methods. . . . . . . . . . . . . . . . . . . . . 172
5.32 The confusion matrix of LR based classification setups. . . . . . . 172
5.33 The confusion matrix of DT based classification setups. . . . . . . 173
5.34 The confusion matrix of SVM based classification setups. . . . . . 173
5.35 Experiment results in terms of different evaluation measurements. 174
5.36 Performance Analysis of different classification techniques. . . . . 174
5.37 ANOVA Test Results. . . . . . . . . . . . . . . . . . . . . . . . . 174
5.38 P-values of the clinical variables used in the breast cancer clinical
case study. . . . . . . . . . . . . . . . . . . . . . . . . . . . . . . . 181
5.39 Experimental Setups including feature selection results. . . . . . . 182
5.40 The confusion matrix of different experimental setups based on
Logistic Regression and Feature Selection Methods. . . . . . . . . 183
5.41 The confusion matrix of different experimental setups based on
Decision Tree and Feature Selection Methods. . . . . . . . . . . . 183
5.42 The confusion matrix of different experimental setups based on
Support Vector Machine and Feature Selection Methods. . . . . . 183
5.43 Experiment results in terms of different evaluation measurements. 184
5.44 Performance Analysis of different classification techniques using
One-Way ANOVA. . . . . . . . . . . . . . . . . . . . . . . . . . . 184
5.45 ANOVA Test Results. . . . . . . . . . . . . . . . . . . . . . . . . 186
B.1 Risk Factors and two Classes (Weighted) . . . . . . . . . . . . . . 218
B.2 Test Results and Two Classes (Weighted) . . . . . . . . . . . . . . 218
C.1 Logistic Regression - Performance Vector . . . . . . . . . . . . . . 221
C.2 Performance Vector kNN. . . . . . . . . . . . . . . . . . . . . . . 221
C.3 Random Forests Decision Trees. . . . . . . . . . . . . . . . . . . . 225
C.4 Performance Vector Random Forest . . . . . . . . . . . . . . . . . 226
xviii

DECLARATION
I understand the nature of plagiarism, and I am aware of the University’s policy
on this. I certify that this dissertation reports original work by me during my
University project. I confirm that this thesis has not been previously submitted
for the award of a degree by this or any other university.
Signature Date
xix
31 March 2015

ACKNOWLEDGEMENTS
This thesis would not have been possible without the help and support of a large
number of individuals. First and foremost, I would like to thank my family mem-
bers, especially my beloved parents, my wife and my lovely daughter, Safa and
who have endured my absence during my research and helped me tremendously
in all ways possible. Without their continued help, support and guidance, this
would never have been possible. Thank you.
My heartfelt thanks to my principal supervisor, Professor Amir Hussain, for
his generous offer of the PhD position so that I can fulfil my dream of doctoral
study. Thank you for your support and guidance throughout this research: for
constantly guiding me toward exploration in the right directions; for questioning
me about unclear key thoughts; and for shaping my ambiguous concepts by inter-
preting the research from different perspectives. I am thankful to the Engineering
and Physical Sciences Research Council (EPSRC Grant Ref. no. EP/H501584/1)
and Sitekit Solutions for funding my PhD. I would further like to thank Dr David
Cairns and Professor Evan Magill for their support and encouragement.
I would like to thank my industrial supervisor Chris Eckl and Campbell Grant,
CEO of Sitekit Solutions for providing me this excellent research opportunity to
work closely with researchers at the Sitekit Lab and for trusting my abilities to
move the project forward and for his invaluable insights. I am deeply indebted
to Professor Stephen Leslie, consultant cardiologist from Raigmore Hospital in
Scotland for providing me the required domain expertise as well as facilitating
me to utilise the RACPC patient’s data for this thesis. I would like to thank
Professor Calum MacRae from Brigham and Women’s hospital for his continuing
xx

support and guidance and for acting as my domain clinical expert. My heartfelt
thanks to Professor Warner Slack, Hollis Kowaloff, Charles Safran and Henry
Feldman from Beth Israel Deaconesses Medical Centre, Harvard Medical School
for providing guidance and encouragement to me every step of the way.
I am also thankful to Professor Cheng Lin Liu and Professor Chengqing Zhong
from the Chinese Academy of Sciences in Beijing; Professor Bin Luo and Professor
Jin Tang from the Anhui University in China for trusting me with visiting research
fellow opportunities to carry out work on UK-China joint research projects. I
am also thankful to John Moore from MIT New Media Medicine lab for his
invaluable input and feedback on clinical questionnaires and clinical prototypes
that I have developed during this PhD. I am very grateful to Hicham Atassi and
Jan Karasek for offering me a visiting research fellow opportunity to exchange
technical expertise with researchers at the Brno University of Technology in Czech
Republic. I am very thankful to RACPC clinicians in Raigmore hospital for their
kind support and timely advice.
Lastly, I would like to thank my colleagues and friends from the COSIPRA
Lab with whom I had the opportunity to discuss areas of mutual interests : Muaz
Niazi, Wajeeha Aneel, David Vidal, Peipei, Aihua, Amjad Ullah, Zeeshan Malik,
Thomas Mazzocco, Erik Cambria, Erfu Yang and Zhengzheng Tu. I would like
to thank Alexander Saunders from University of Aberdeen. I also would like to
thank Grace McArthur, Lynn Reilly, Linda Bradley and Gemma Gardiner for
providing support throughout my PhD.
xxi

GLOSSARY OF ABBREVIATIONS
xxii

ACC American College of CardiologyAFL Atrial FlutterAI Artificial IntelligenceAT Atrial TachycardiaACC American College of CardiologyAI Artificial IntelligenceBLR Binary Logistic RegressionCAD Coronary Artery DiseaseCABG Coronary Artery Bypass GraftingCDSS Clinical Decision Support SystemCHF Congestive Heart FailureCPGs Clinical Practice GuidelinesCPR Cardiopulmonary ResuscitationCSU Cardiac Sciences UnitCPOE (Computerised Physician Order Entry)DBP Diastolic Blood PressureDM Diabetes MellitusDSP Digital Signal ProcessingDWT Discrete Wavelet TransformEBM Evidence Based MedicineEHRs Electronic Healthcare RecordsEM Expectation-MaximisationEP ElectrophysiologyFE Fisher’s ExactFIS Fuzzy Inference SystemGDM Gradient Descent with MomentumHF High Frequency PowerHL7 Health Level 7HRA Heart Rate AsymmetryHRT Heart Rate TurbulenceHTN HypertensionK-NN K Nearest NeighborsLBBB Left Bundle Branch BlockMUMPS Massachusetts General Hospital Utility Multi-Programming SystemMLDPS Machine Learning Driven Prognostic SystemNICE National Institute for Health and Care ExcellenceNOAF No Postoperative Atrial FibrillationODCRARS Ontology Driven Clinical Risk Assessment and Recommendation SystemPOAF Post Operative Atrial Fibrillation
xxiii

PCI Percutaneous Coronary InterventionPPV Positive Predictive ValuePVI Pulmonary Vein IsolationQP Quadratic ProgrammingRA Right AtriumRACPC Rapid Access Chest Pain ClinicRF Radio frequencyRMS Root Mean SquareRMSSD Root Mean Square Successive DifferenceRR R-R IntervalRBF Radial Basis FunctionROC Receiver Operating CharacteristicSAPW Signal Averaged P-WaveSBP Systolic Blood PressureSCD Sudden Cardiac DeathSICSA Scottish Informatics and Computing Science AllianceSFFS Sequential Floating Forward SelectionSVM Support Vector MachinesSNOMED CT Systematised Nomenclature of Medicine- Clinical TermVAD Ventricular Assist DevicesWPBC Wisconsin Prognostic Breast Cancer
xxiv

Chapter 1
INTRODUCTION
Clinical data is the foundation of health learning, with the aim of creating effective
clinical solutions for healthcare providers all over the world [8]. Issues motivat-
ing discussion include the potential for clinical data as a resource for continuous
learning. A key component of an efficient healthcare system revolves around the
key area of data transformation through interoperable data resources and creates
awareness among clinical domain and informatics experts regarding these issues.
Healthcare organisations have been collecting and storing large amounts of data
for decades. Most of this invaluable legacy patient data resides in distributed hos-
pital repositories, which are often ignored or badly utilised for learning purposes
that aim to improve clinical pathways, and are difficult to access and pre-process
(data interoperability, disparate coding standards like SNOMED CT, HL7 and
missing data issues) for a meaningful purpose by healthcare solution providers.
With the advent of “Big Data”, predictive clinical analytics is now one of the
most researched areas of academic and commercial partners globally and has an
aim to develop cost effective healthcare solutions to promote evidence-based/data
driven preventative care. Clinical predictive analytics has the potential to trans-
form the way healthcare solution providers develop clinical decision support tech-
nologies using synthetic data. Healthcare solution providers can develop more
cost effective and efficient prospective and preventative care solutions by way of
learning from the legacy data stored in clinical data repositories. Thus, they can
1

make more informed decisions and improve data-driven/evidence-based patient
care [9]. The onus is on healthcare organisations at a national level to enable
domain experts, clinicians, researchers and healthcare trusts to unlock the true
potential of the legacy data stored within their proprietary healthcare systems.
Big data is transforming the discussion of what is appropriate for a patient
and for the healthcare ecosystem. The release of big data has helped authorities
to develop patient-centric healthcare models by considering a holistic view of
care. New care models have been proposed, which are built on 5 key pathways,
as presented by Groves et al [10]; details of these key pathways are as follows:
1. Right Living: Patients can be made custodians of their well-being by getting
them involved in the decision-making process, the prescription of treatment
plans and decision prevention schemes. The right living pathway focuses on
encouraging patients to make lifestyle choices such as lowering their Body
Mass Index (BMI), dieting and engaging in exercise.
2. Right Care: This pathway entails ensuring that patients get the most timely,
appropriate care when needed. It also specifies a need for a coordinated
approach to be followed across different healthcare providers and aims to
share the same clinical data amongst its stakeholders to avoid duplication
while fostering effort and promoting suboptimal strategies.
3. Right Provider: This pathway proposes that patients should always be
treated by professionals who are best suited to the task and can deliver
the best outcome. This clinical pathway also reiterates that healthcare
providers be selected as per their track record [10].
4. Right Value: This pathway involves multiple measures that can be intro-
duced to ensure the cost effectiveness of care by eliminating redundant
clinical workflows in healthcare systems.
5. Right Innovation: This pathway involves promoting research and devel-
opment activities in the healthcare sector so legacy clinical data could be
2

utilised to learn from existing clinical systems and improve clinical trials
and treatment protocols [10].
Big data predictive clinical analytics paves the way for the development of
next generation healthcare learning systems and promote personalised care for
patients. Healthcare learning systems are built on the core principle of learning
from existing clinical practices through legacy clinical data, as well as utilising
existing clinical practice guidelines to facilitate efficient clinical decision-making
operations. A learning activity in these intelligent healthcare systems can be de-
scribed as an activity which focuses on the delivery of the healthcare operations
or uses personalised health information (derived from legacy clinical data repos-
itories) and has a targeted objective of learning from existing clinical work flows
to improve clinical practice guidelines. This with a view to improving the quality,
efficiency of the systems, institutions and modalities through which healthcare
services are provided by healthcare providers. All of the aforementioned activities
are deemed as learning activities which are enshrined in the next generation of
healthcare learning systems. These systems can benefit from conventional clinical
research, comparative effectiveness research, quality improvement research, qual-
ity improvement and patient safety practices, healthcare operations, quality as-
surance or evidence-based personalised care. All of these operations/components
are the building blocks for the next generation of healthcare systems based on
learning activities [11].
Legacy clinical data combined with clinical practice guidelines is a data sci-
ence methodology that can identify patterns in home monitoring physiologic data.
Coupled with interaction with the patient and their caregivers, we can give the
care team early warning of a worsening of the patient’s clinical status. In the UK,
NICE (National Institute of Clinical Excellence) states that all clinical domains
can be used as a means of evidence. These guidelines are defined as systematically
developed rules to assist clinicians in clinical decision-making about appropriate
health care for specific clinical circumstances. These guidelines are based on
the most rigorous research available, and are often referred to as best practice
guidelines. Applied at the individual patient level, these guidelines provide a set
3

of corrective actions based on conditional logic for solving problems or accom-
plishing tasks. Appropriately applied, the guidelines can reduce the uncertainties
associated with clinical decisions, diminish the variation around usual practices,
demystify unfamiliar terminology and decrease the need to search for journals
and articles [12]. It is therefore vital to make use of these guidelines combined
with clinical data if we are to build efficient and personalised care models.
Predictive Clinical Analytics based on learning retrospective clinical data focuses
on patients with complex chronic diseases and aims to improve health, reduce
avoidable hospitalisations and acute care events and, as a result of the decreased
need for expense acute care, also reduce costs. Predictive Analytics has the po-
tential to help physicians make better decisions across the board and help to
deliver evidence-based personalised care and treatments as part of a preventative
care solution; hence increasing efficiency, thereby reducing the burden on primary
and secondary care.
The aim of this interdisciplinary research project is to develop a hybrid clinical
decision support framework for cardiovascular preventative care. Our proposed
ontology and machine learning-driven hybrid clinical decision support framework
builds on Bouamrane et al.’s clinical decision support framework [2] by provid-
ing an advanced ontology driven clinical decision support and machine learning
driven prognostic modelling capabilities. The proposed ontology and machine
learning driven hybrid clinical decision support framework comprises of Ontology
Driven Clinical Risk Assessment and Recommendation system (ODCRARS) and
the Machine Learning Driven Prognostic System (MLDPS) to provide a cardio-
vascular preventative solution.
The ODCRARS provides intelligent context aware information collection for
gathering a patient’s medical history. This is then transformed into a semantic
profile (to alleviate interoperability issues) by using answers provided in patient
interviews. The patient semantic profile combined with a recommendation on-
tology is utilised for the recommendation of lab tests and medications for car-
diovascular patients. A clinical rules engine is developed to provide cardiac risk
assessment tools to carry out cardiac risk scores calculation for various cardio-
4

vascular diseases.
The proposed clinical decision support framework also incorporates a ma-
chine learning-driven prognostic system. The machine learning-driven prognostic
system is validated in the cardiovascular and breast cancer domains and online
prognostic models have also been developed and deployed online for further clin-
ical trials and validation. The proposed ontology and machine learning-driven
hybrid clinical decision support framework provides a learning mechanism built
using machine learning techniques. The learning facility is provided through the
exchange of patient data amongst the MLDPS and ODCRARS.
The MLDPS and ODCRARS are integrated in order to provide a cardiovascu-
lar preventative care solution for patients and clinicians in primary and secondary
care using dedicated interfaces. The machine learning driven cardiac chest pain
and heart disease risk scores calculation is provided in the integrated system
along with other cardiac risk scores to facilitate clinicians in the clinical decision
making process.
1.1 Organisation of Thesis
This thesis is organised as follows. Chapter 2 provides a literature review of the
existing clinical decision support systems.
Chapter 3 presents the proposed Novel Ontology and Machine Learning Driven
Hybrid Clinical Decision Support Framework for cardiovascular preventative care
and its two key components: (1) ODCRARS and (2) MLDPS. Chapter 4 explains
the development of the ODCRARS for preventative cardiovascular care. Details
of design, the development and validation of ontology-driven intelligent context
aware information collection, patient semantic profiles, a clinical rules engine (for
lab tests and medication prescriptions), the cardiac risk assessment tools and the
integration of a machine learning cardiac chest pain prognostic model including
cardiac chest pain risk score calculation are explained. Chapter 5 introduces a
MLDPS for cardiovascular preventative care. It describes key development stages
(keeping in line with the prognostic model development process as described in
chapter 3), while a clinical case study for RACPC patients is discussed in de-
5

tail along with the development and clinical validation of a cardiac chest pain
prognostic model. Utilisation of additional two datasets in the heart disease and
breast cancer domains, for validation purposes, along with development of breast
cancer and heart disease prognostic models are discussed at the end. Chapter 6
presents an analysis of the work and discusses the future directions of research.
1.2 Motivation and aims
Conventional healthcare information management systems suffer from a general
lack of intelligence. They are successful in offering basic patient management
capabilities to their end users but they do not offer substantial decision support
functionalities or automation to lend a helping hand to clinicians. These sys-
tems have been designed using branching logic-based rigid architectures, which
are hard to maintain and upgrade without considerable labour intensive effort.
Retrospective clinical data is often discarded by the machine learning experts
while efficient feedback loops are not built into the decision support mechanism
and do not support continuous learning and refining processes.
Clinical decision support systems in particular have been built with a signifi-
cant amount of design weaknesses, which is why very few decision support oper-
ations have been built into the core fabric of the clinical infrastructure governed
by national and regional healthcare service authorities. Healthcare systems have
a substantial amount of limitations, such as rigidity and nonconformity to com-
plex clinical protocols like electronic healthcare records and effective utilisation
of clinical practice guidelines, which can help to promote clinical standardisation.
Information collection systems provide episodic historic data to clinical de-
cision support systems for inference purposes. Clinical patient assessment is
currently being performed using clinical questionnaires (non-standard question-
naires), which vary from one practice to another within the same healthcare
region. In order for CDSSs to be fully successful in a problem domain like cardio-
vascular disease, efforts are required to develop adaptive clinical questionnaires
using standardised expert knowledge in order to promote better exploitation of
these clinical systems. The success of these clinical decision support systems re-
6

lies on its generated outcome, which is normally referred to as Electronic Patient
Records or Electronic Healthcare Records. A clinical decision support system
relies on each patient’s factual data along with clinical risk assessment guidelines
as it aims to construe a clinical conclusion as part of the decision-making process.
This multidisciplinary industrial research project set out to develop a hybrid
clinical decision support mechanism for cardiovascular preventative care, which
could be utilised as a triage mechanism for patients undertaking primary and
secondary care. The primary aim of this thesis is to provide a clinical decision
support mechanism for cardiovascular patients by combining evidence, extrapo-
lated through legacy patient data (based on AI-inspired techniques like ontology
and machine learning-driven techniques) in order to facilitate cardiovascular pre-
ventative care. As part of our research, clinical case studies in the RACPC, heart
disease and breast cancer domains have been considered for the development and
clinical validation of the machine learning prognostic system.
The proposed ontology and machine learning driven integrated system could
be used as a triage system in the cardiovascular preventative care, which could
help clinicians to prioritise patient appointments after reviewing snapshot of their
medical history. This would be collected through ontology-driven intelligent con-
text aware information collection using standardised clinical questionnaires. The
results contain patient demographics information, cardiac risk scores, cardiac
chest pain score, medication and recommended lab test details. We also aim to
validate the proposed novel ontology and machine learning-driven hybrid clinical
decision support framework in other application areas.
1.3 Original Contributions
1. Developed a novel ontology and machine learning driven hybrid clinical
decision support framework for cardiovascular preventative care under the
close supervision of UK (Professor Stephen Leslie from Marmoreal Hospital)
and US (Professor Calum MacRae and Professor Warner Slack from Har-
vard Medical School) clinicians. The developed framework provides cardiac
risk score calculation, lab tests and medication recommendation through
7

the ontology driven clinical risk assessment and recommendation system
(ODCRARS).
2. The MLDPS is validated using Raigmore Hospital’s RACPC. Two addi-
tional clinical case studies in the heart disease and breast cancer domains
in collaboration with primary (General Medical Practitioner in the heart
disease clinical case study) and secondary care (breast cancer oncologist
in the breast cancer clinical case study) clinicians were undertaken for the
development and clinical validation of the MLDPS. We highlight the prob-
lem of learning from incomplete real patient from statistical perspective the
likelihood-based approach to deal with imbalanced and missing data issues.
There are multiple benefits of our approach: to complement existing SVM
techniques to deal with missing data within a statistical framework, and
to illustrate a set of challenging statistical machine learning algorithms,
derived from the likelihood-based framework that handles clustering, clas-
sification, and function approximation from missing/incomplete data in an
intelligent and resourceful manner. New benchmark prognostic models have
been developed using RACPC, Heart Disease and Breast Cancer datasets
which have been validated through clinical domain experts in the UK and
US.
3. A novel ODCRARS provides an ontology driven intelligent context aware
information collection built on a standardised questionnaire ontology for
generating patient medical records.
4. The patient medical records are transformed semantically through patient
semantic profile ontology to give patient data an intrinsic meaning and also
to alleviate interoperability issues.
5. A novel decision tree based adaptive questionnaire is proposed and utilised
for the system development purposes.
6. Developed a generic ontology based on clinical questionnaires at the system
level and demonstrated its utilisation in the cardiovascular preventative care
8

solution. This ontology is developed based on generic classes which could
be utilised in a variety of different clinical domains and it is particularly
useful for providing metadata and structure of questionnaires elements at
the database level.
1.4 Publications
The following papers have been published or accepted for publication during the
course of this research and included additional work to the material presented in
this thesis.
Refereed International Conference Proceedings
1. Kamran Farooq, Amir Hussain, Warner Slack and Bin Luo: An Ontol-
ogy and Machine Learning Driven Hybrid Cardiovascular Decision Support
Framework. IEEE SSCI, Cape Town, December 2015, In Preparation.
2. Kamran Farooq, Jan Karasek, Hicham Atassi, Amir Hussain, Peipei Yang,
Calum MacRae, Chris Eckl, Warner Slack and Bin Luo: A Novel Cardiovas-
cular Decision Support Framework for Effective Clinical Risk Assessment.
IEEE SSCI, Orlando 2014: 14925.
3. Kamran Farooq, Peipei Yang, Amir Hussain, Kaizhu Huang, Chris Eckl,
Calum MacRae, Warner Slack: Efficient Clinical Decision Making by learn-
ing from missing Clinical Data. IEEE SSCI, Singapore 2013: p1024. (Nom-
inated for the best paper award).
4. Kamran Farooq, Amir Hussain, Stephen Leslie, Chris Eckl, Warner Slack:
Ontology-driven cardiovascular decision support system. Pervasive Health
2011: 283-286.
Peer Reviewed Book Chapters
1. Kamran Farooq, Amir Hussain, Hicham Atassi, Stephen Leslie, Chris Eckl,
Calum MacRae, Warner Slack- A Novel Clinical Expert System for Chest
Pain Risk Assessment. BICS, Beijing, June 2013.
9

2. Kamran Farooq, Amir Hussain, Stephen Leslie, Chris Eckl, Calum MacRae,
Warner Slack: An Ontology Driven and Bayesian Network Based Cardio-
vascular Decision Support Framework. BICS 2012: 31-41
3. Kamran Farooq, Amir Hussain, Stephen Leslie, Chris Eckl, Calum MacRae,
Warner Slack: Semantically Inspired Electronic Healthcare Records. BICS
2012: 42-51.
Peer Reviewed Journal Papers
1. Kamran Farooq, Amir Hussain, Warner Slack A Novel Ontology and Ma-
chine Learning Driven Hybrid Clinical Decision Support Framework for
Cardiovascular Preventative Care, BioMed Medical Informatics and Deci-
sion Making journal, impact factor 1.5, Conditionally Accepted April 2015.
2. Kamran Farooq, Amir Hussain, Warner Slack, A Machine Learning Driven
Prognostic System for Holistic Clinical Prognosis for Cardiovascular Pa-
tients: Elsevier Expert Systems with Applications, Under Review 2015.
3. Kamran Farooq, Amir Hussain, Warner Slack, Efficient Cardiovascular
Prognosis by Learning from Missing Clinical Data : Elsevier Artificial In-
telligence in Medicine, Under Review 2015.
4. Kamran Farooq, Amir Hussain, Warner Slack, A Novel Machine Learning
Driven Prognostic System for Breast Cancer Preventative Care: Elsevier
Computers in Biology and Medicine, Under Review 2015.
5. Kamran Farooq, Amir Hussain, Warner Slack, A Novel Ontology and Ma-
chine Learning Driven Hybrid Clinical Decision Support Framework for
Cardiovascular Preventative Care: Elsevier Computer Methods and Pro-
grams in Biomedicine, Under Review 2015.
6. Kamran Farooq, Muaz Niazi, Stephen Leslie, Amir Hussain, Warner Slack,
A Scientometric Review of Clinical Decision Support Systems, Springer
Scientometrics Journal, In Preparation.
10

Posters and Clinical Prototypes Demonstration
1. Demonstration of RACPC and Heart Disease Risk Assessment prototypes
(developed as part of my PhD) at the 3rd SICSA Workshop on Technology
for Health and Well Being (THAW), 20 June 2014, held at the University
of Strathclyde, Scotland, UK.
2. Poster Presentation along with the demonstration of Cardiovascular Risk
Predictors (developed as part of my PhD) at the 2nd SICSA Workshop on
Technology for Health and Well Being (THAW), 20 March 2014, held at
the Glasgow Caledonian University, Scotland, UK.
3. Poster presentation at the SICSA Cognitive Computation Summer School,
University of Stirling, 25-30 Aug 2013- Presented poster title: A Novel
Cardiovascular Decision Support Framework for Effective Clinical Risk As-
sessment.
4. Poster presentation at the 5th China-Scotland SIPRA Workshop on the
Next Generation Intelligent Signal Image Processing Technologies and Ap-
plications, 15-19 April, 2013, poster title: A Novel Expert System for Chest
Pain Risk Assessment.
5. Sitekit Labs Future of e-health symposium, Napier University, Edinburgh
17-18 May 2012, poster title: An Ontology Driven Cardiovascular Decision
Support Framework. Also demonstrated UPrevent’s context sensitive Elec-
tronic Healthcare Records (EHR) building mechanism, which was developed
as part of my PhD (cardiovascular preventative care prototype).
6. Poster presentation at the Judge Business School, University of Cambridge
2011, title: Cardiovascular Decision Support Framework - A Preventative
Care Enterprise Solution.
7. Poster presentation at the Sitekit Labs, Highland Games Conference, Isle
of Skye, Inverness, Sept 2010, poster title: Clinical Expert System for Car-
diovascular Risk Assessment.
11

Invited Talks
1. The Care Technologies Group at the Department of Computing Science and
Mathematics, University of Stirling, March 2011, title: Effective Cardiovas-
cular Risk Assessment using Ontology driven Decision Support Framework.
2. Sitekit Labs Future of e-health symposium, Napier University, Edinburgh,
17-18 May 2012, title: Next generation Clinical Decision Support Frame-
work for Cardiovascular Patients.
3. The Computational Intelligence Group, University of Stirling, seminar talk,
March 2012, title: How to build Effective Prospective Clinical Decision
Support Systems.
4. The Cognitive Signal Image and Control Processing Research (COSIPRA)
Lab Seminar, University of Stirling, Oct 2011, title: Learning from missing
clinical data to build effective clinical decision support systems.
5. BICS conference 2012, Beijing, title: Semantically Inspired Electronic Health-
care Records.
6. BICS 2012 conference, Beijing, Title: Ontology Driven and Bayesian Net-
work Inspired Cardiovascular Decision Support Framework.
7. Chinese Academy of Sciences, Beijing, Feb 2012, seminar talk, tile: An AI
Inspired Clinical Decision Support Framework.
8. 2013 IEEE Symposium on Computational Intelligence in healthcare and e-
health (IEEE CICARE 2013), title: Efficient Clinical Decision Making by
Learning from Missing Clinical Data. (Nominated for the best publication).
9. Anhui University, Hefei, China, June 2013, seminar talk, title: Towards
Learning from Retrospective Legacy Data for making Effective Prospective
Clinical Decision Support Systems.
12

10. COSIPRA Lab, University of Stirling, seminar talk, July 2013, title: Fea-
ture Selection and Machine Learning based Classification Techniques for
Chest Pain Patients.
11. FP7 funded Signal Processing workshop organized at the Brno University of
Technology, October 2013, on Efficient clinical risk assessment of cardiovas-
cular patients using an Ontology driven and Machine Learning Approach.
12. IEEE SSCI 2014, Orlando, USA, Session Chair CICARE 2014, title, ”A
Novel Cardiovascular Decision Support Framework for Effective Clinical
Risk Assessment Kamran Farooq, Jan Karasek, Hicham Atassi, Amir Hus-
sain, Peipei Yang, Calum MacRae, Chris Eckl, Warner Slack, Bin Luo and
Mufti Mahmud.
13

Chapter 2
LITERATURE REVIEW
This chapter covers general background material for the thesis and provides com-
prehensive reviews of related topics that are investigated in the thesis. In the
beginning, an overview of clinical decision support systems and their benefits,
followed by utilisation of different techniques in the cardiovascular clinical deci-
sion support solutions based on different techniques. In the latter part, a concise
review of relevant clinical decision support systems used in this thesis is explained.
2.1 Clinical Decision Support Systems
Since the advent of computers, healthcare professionals have anticipated the time
when machines would assist them in clinical decision making and other restorative
procedures. The very first articles dealing with this provision appeared in the
late 1950s [13] and experimental prototypes were made available within a few
years [13]. Three advisory systems from the 1970s provide a useful overview of
the origin of work on clinical decision-support systems: deDombals system for
diagnosis of abdominal pain [14, 15], Shortliffes MYCIN system for selection of
antibiotic therapy [15] and the HELP system for delivery of inpatient medical
alerts [16, 17].
The adoption of clinical decision support systems (CDSSs) in the diagno-
sis and administration of major chronic diseases e.g. Dementia [18], cancer
[19],diabetes [20], hypertension [21] and heart disease [22] have made significant
14

contributions in improving the clinical outcomes at primary and secondary care
healthcare organisations all over the world. CDSS have also made it possible
for system developers and knowledge engineers to collate and construct domain
expert knowledge for the purpose of clinical risk assessment and screening by
clinicians [23, 24].
Many reviews have identified the benefits of CDSS, in particular CPOE (com-
puterised physician order entry) systems [25] [26, 27].CDSS as part of CPOE have
been found to alleviate medication errors and adverse drug events [28, 29, 30].
Clinical decision support systems also have demonstrated to improve clinician
performance, by way of promoting electronic prescription of drugs, adherence to
guidelines and to an extent efficient use of time [30, 29]. CDSSs perform a key
role in providing preventative measures at outpatient clinics and primary care, for
example by alerting care givers of the need for routine blood pressure checking,
to offer influenza vaccination and to recommend cervical screening [26] and [31].
The key benefits of CDSS reported in the studies conducted in [24, 32, 33, 34]
and [1] are as follows:
1. Higher Standards of Patient Safety
Clinical decision support systems have helped healthcare organizations all
over the world acquiring higher standards of patient safety.They adhere
to standardized clinical procedures governed by the clinical workflows thus
reducing diagnostic, prescribing errors and drug doubling issues.
2. Improving quality of direct patient care
Furthermore, authors concluded that with the advent of CDSS, quality
of care has improved considerably levels with this extra support provided
to clinicians (who are already struggling to cope with current healthcare
demands). This has made it possible for clinical experts to allocate more
time to providing direct patient care.
3. Standardization and Conformance of Care using Clinical Practice Guide-
lines
The standardisation of clinical pathways and procedures set precedents and
15

evaluation benchmarks for healthcare trusts to achieve higher patient sat-
isfaction levels set out by different healthcare organizations in different re-
gions. CDSSs also promote the utilisation of clinical practice guidelines
(CPGs) for the development of knowledge-aware systems capable of per-
forming effective clinical decision making to promote standardised care.
4. Collaborative Decision Making
CDSSs have helped healthcare stakeholders that include clinicians, health-
care trusts and policy makers to develop safe and efficient care models
using collaborative decision making approach to benefit both patient and
a clinician. CDSS have also helped healthcare trusts to Improve effective-
ness in prescribing facility through cost effective drugs order dispensation
[24]. CDSS are also playing an important role in the integration of EHRs
(Electronic healthcare records) which will help healthcare authorities to
streamline information collection and clinical diagnosis operations in order
to promote efficient data gathering [34]. Audit trail is another important as-
pect of modern healthcare systems which is achieved through the intelligent
exploitation of clinical decision support capabilities.
Clinical decision support systems are being extensively deployed in health-
care settings all over the world. Modern clinical decision support systems are
increasingly dissimilar to each other, despite following the same generic architec-
ture which defines a typical CDSS [35]. These clinical decision support systems
incorporate a variety of innovative techniques to perform various key operations
which include clinical knowledge dissemination and collecting patient’s medical
history for effective clinical decision making. These systems aim to provide clinical
decision support and automatic personalised clinical advice through inference ca-
pabilities [36].They also help to streamline clinical workflows through integration
with electronic healthcare records for patient clinical history collection, diagnosis,
inference and training.
Clinical decision support operations are an integral part of modern healthcare
16

management systems. They assist clinicians, patients and healthcare stakehold-
ers by providing expert clinical knowledge and patient-centric information [37].
The information provided by these intelligent clinical systems is used for clinical
decision making in order to improve the effectiveness and quality of healthcare.
Automated cardiovascular decision support systems are now being deployed in
hospitals and primary care organizations in order to meet the ever growing clinical
needs of prognosis in the areas of cardiovascular disease and coronary heart dis-
ease. Computerized decision support strategies have already been implemented
successfully in several areas of cardiovascular care [38]. These applications are
being used as part of the extension of clinical informatics infrastructure in the
UK and US. These systems are also being used in both primary and secondary
care settings for providing efficient healthcare delivery to its patients. In order to
capitalise on the benefits provided by cardiovascular decision support systems, a
strong foundation in evidence-based medicine and well-established clinical prac-
tice guidelines (CPGs) have to be considered to ensure clinical governance in the
next generation clinical systems. An alternate approach to computer-assisted
decision support was provided in the MYCIN development program, a clinical
consultation system that de-emphasized diagnosis to concentrate on appropriate
management of patients who have infections [39]. Knowledge of infectious dis-
eases in MYCIN was represented as production rules, each containing a packet of
knowledge derived from discussions with collaborating experts (2.1). The MYCIN
program determined which rules to use and how to chain them together to make
decisions about a specific case.
In MYCIN, rules are conditional statements that indicate what course of
action to be taken if a specified condition is set to True. A team of clinical
experts evaluated MYCINs performance on therapy selection for patients with
blood-borne bacterial infections [40] and for those with meningitis [40]. MYCIN,
however, is best known as a system based on early exploration of methods for
capturing and applying ill-structured expert knowledge to solve important med-
ical problems. Although the program was never used clinically, it paved the way
for a great deal of research and development in the 1980s [41].
17

Figure 2.1: Example of a Rule encoded in MYCIN. [1].
2.1.1 Ontology Driven Clinical Decision Support Frame-
works
An ontology is an explicit specification of a conceptualization. The term is bor-
rowed from philosophy, where an ontology is a systematic account of existence.
For AI systems, what “exists” is that which can be represented. When the knowl-
edge of a domain is represented in a declarative formalism, the set of objects that
can be represented is called the universe of discourse. This set of objects, and
the describable relationships among them, are reflected in the representational
vocabulary with which a knowledge-based program represents knowledge. Thus,
in the context of AI, we can describe the ontology of a program by defining a set
of representational terms. In such an ontology, definitions associate the names
of entities in the universe of discourse (e.g., classes, relations, functions, or other
objects) with human-readable text describing what the names mean, and formal
axioms that constrain the interpretation and well-formed use of these terms. For-
mally, an ontology is the statement of a logical theory [42]. Ontologies are often
equated with taxonomic hierarchies of classes, but class definitions, and the sub-
sumption relation, but ontologies need not be limited to these forms. Ontologies
are also not limited to conservative definitions, that is, definitions in the tradi-
tional logic sense that only introduce terminology and do not add any knowledge
about the world [43].
18

The Systematized Nomenclature of Medicine Clinical Terms (SNOMED CT)
is an onto-logical resource specifically developed some thirty years ago with a
view to standardize healthcare systems. SNOMED CT and with UMLS are
clinical thesauruses, aiming to resolve documentation standardization issues in
clinical systems. These are large scale medical taxonomies which have been ex-
ploited in modern clinical systems showing significant good results in the tar-
geted clinical systems. In [44] it shows that the clinicians using healthcare sys-
tems equipped with SNOMED outperformed clinicians using conventional sys-
tems without SNOMED CT capabilities.
Bouamrane et al implemented an ontology driven approach for the devel-
opment of clinical decision support system in the pre-operative risk assessment
domain. In [45], they reported their work by combining a preventative care soft-
ware system in the pre-operative risk assessment domain with a decision support
ontology developed with a logic based knowledge representation formalism.
Patient medical history was modelled in the Web Ontology Language (OWL),
combined with a reasoning tool to recommend appropriate preoperative tests
based on an implementation of NICE preoperative risk assessment guidelines).
This work was carried out as part of the post doctoral research project to build
semantic technology into their existing pre-operative risk assessment software
called “Synopsis”. The overall architecture of the pre-operative risk assessment
is illustrated in Fig 2.2.
19

Figure 2.2: Hybrid architecture of the rule-engine / clinical knowledge-base pre-operative risk assessment system [2].
20

Authors demonstrated that the use of knowledge representation in OWL-DL
and reasoning helped them overcome a number of limitations in their existing
pre-operative risk assessment system. They also proposed a methodology for
the semi automatic generation of patient medical history through legacy clinical
data. They concluded that prior to the introduction of semantic technology, the
pre-operative system was composed of few static components responsible for data
collection and rules engine, which is why pre-operative risk assessment was almost
entirely based on a set of static rules and numeric risk scores. Domain specific
decision support ontologies were developed which were used to carry out decision
support operations based on patient data gathered in the information collection
stage [45].
The Risk assessment ontology was developed to highlight potential intra-
operative and post-operative complications given a patient medical profile and
the scheduled surgical procedure in the secondary care. As part of decision sup-
port operations, Recommended Test Ontology is developed to suggest certain
pre-operative tests , which may help to decide whether it is safe to go ahead with
the planned surgery. This ontology is based on NICE clinical guidelines, the last
domain of the decision support ontology is the precaution ontology which could
suggest a management or a follow up protocol given a specific medical complica-
tion. In their developed system, decision support is provided in a 2 step process,
in the first stage risk scores or surgical risk grades are calculated using set of rules
given the Goldman and Detsky cardiac risk index, the Physiological and Opera-
tive Severity Score for the enUmeration of Morality and Morbidity (POSSUM),
etc. Once the risk grades and categories are derived from the first risk calcula-
tion sept, the system can then perform decision support through the utilisation
of Java based PELLET reasoner which is provided in the Protege development
editor for OWL. NICE guidelines for the pre-operative risk assessment were im-
plemented as set of rules, whilst going through 1242 rules which were set out for
pre-operative risk assessment procedures, a lot of redundant rules were discarded
during the development phase. These set of rules were introduced as axioms
in OWL,the main advantage of modelling preoperative investigation guidelines
21

as OWL axioms is that these rules can be utilised with third party taxonomies
without having to develop executable guidelines from scratch [46].
Bouamrane et al concluded that a small number of inconsistencies in the pre-
operative guidelines, also guidelines don’t cover whole range of combinations of
different surgical procedures and co-morbidities and some of the most serious
complications are not covered by these pre-operative risk assessment guidelines
which is why clinicians will have to use their own clinical judgement to decide
what preoperative tests are to be carried out before any major surgical operation.
Furthermore, they noted that the major obstacle towards effective use of these
clinical guidelines is the format in which they are represented which make them
both intellectually demanding and knowledge intensive. Clinical decision support
systems have to play a key role in bridging this gap among clinicians and com-
puter science experts in solving these real challenges in healthcare specifically in
the guidelines standardisation and automatic execution without reinventing the
wheel. These clinical guidelines need to be comprehensive to cover a wide variety
of complications as well being systematic in the presentation of the results. [2]
demonstrated that the ontology driven decision support systems outweigh other
types of clinical decision support terms in terms of its cost effective maintenance,
easy to reuse the expert’s modelled view in OWL and facilitates development
of scalable applications which can be deployed in healthcare data centres as a
commercial clinical solution.
In [47], Zhang et al, demonstrated an ontology driven approach for the diag-
nosis of mild cognitive impairment (MCI), specialised clinical knowledge is coded
into an ontology for the construction of a rule set utilised by machine learning
algorithms. The reasoning engine is also exploited to automatically distinguish
MCI patients from normal ones. The rule set was trained by MRI data of 187
patients, a support vector machine (SVM), a Bayesian Network (BN) and back
propagation (BP) neural networks were used for the construction of reasoning
rules. Their evaluation results suggested that their approach would be useful to
assist clinicians in effectively diagnose patients with mild cognitive impairment.
Their framework demonstrated that domain ontology combined with machine
22

learning techniques are useful in diagnosing complex chronic illnesses.
Ontology driven decision support systems are being used extensively in the
clinical risk assessment of chronic diseases. They are renowned for their flexi-
ble architectures, easy to reuse knowledge modelling structures and inexpensive
maintenance operations. The ontology driven clinical decision support framework
for handling co-morbidities in [48] showed exceptional results in the risk assess-
ment and disease management of breast cancer patients which was deployed as a
clinical decision support system handling co-morbidities in Canada. They utilised
semantic web techniques to model the clinical practice guidelines which were en-
coded in the form of set of rules (through a domain specific ontology) utilised by
clinical decision support system for generating patient specific recommendations.
In Figure 2.3, an ontology inspired decision support system in breast cancer
care is shown; this clinical system was developed as part of NICHE (Knowledge
Intensive Computing for Healthcare Enterprises) project in Halifax, Canada. This
system utilises ontology based approaches for the development of a breast cancer
ontology combined with clinical practice guidelines ontology. The ontological
transformation of the CPGs was carried out using the Guideline Element Model
(GEM) tool.
Figure 2.3: Ontology Driven Breast Cancer Decision Support System [3]..
23

Hybrid Clinical Decision Support Frameworks
In Figure 2.4, authors present a framework that enables medical decision making
in the presence of partial information, leveraging ontological representations and
machine learning techniques to enhance existing patient datasets. The hybrid
decision support systems have been classified into two main categories based on
how they deal with the information challenge. Firstly, Knowledge-based systems
are human-engineered mappings from best medical practises and patient data
to recommendations. secondly, Learning-based or Non knowledge-based systems
derive the mapping using techniques from data mining,statistics, and machine
learning.
Hybrid clinical decision support systems in different clinical domains are play-
ing an important role in assisting medical professionals in making decisions. This
is based on current patient data and best practices encoded in a rule base, in
scenarios where there may be missing data.
Figure 2.4: Hybrid Clinical Decision Support System [4].
In [49], Yuan et al, presented a novel context-aware hybrid reasoning frame-
work through the exploitation of fuzzy rule-based reasoning has been proposed
24

to achieve pervasive healthcare in smart home environment. Authors presented
a personalised , flexible and extensible hybrid reasoning framework for context
aware real-time assistant in a smart home environment. This provides context-
sensitive sensor data as well as anomaly detection mechanisms that supports
Activity of Daily Living analysis and alert generation. They deployed a perva-
sive healthcare system in a lab setting comprised of wearable wireless sensors,
smart home sensors, and a remote monitoring system. In the proposed hybrid
framework, fuzzy logic was utilised in the development of pervasive healthcare
system. The fuzzy logic system comprises of three main parts: fuzzy sets, rules
and inference engine. The reasoning engine plays a key role both on the client
and the server side as an intelligent agent. It executes a series of rules which can
be customised as per clinical requirements and rules are processed in real time to
generate immediate alerts in case of emergencies. CARA system collects avail-
able sensor data through wireless communication protocols ( bluetooth etc). The
raw numeric data is interpreted to generate the context for the user under test
and collect information about environmental factors. In their recent study they
focussed on the hybrid reasoning framework which is a combination of case based
reasoning and fuzzy rule-based reasoning. Current limitation in their framework
is the real time processing of case based and fuzzy rule-based reasoning.
In [50, 51], Sessen et al proposed an ontology inspired approach was utilised
to develop a clinical decision support framework for lung cancer patients. They
exploited ontological inference using dynamic logic reasoner to create patient-
specific treatment arguments by automatically grouping patients based on set
of guidelines (British Thoracic Society Guidelines into Lung Cancer Assistant
system) written in the ontology. A novel feature of their proposed lung cancer
assistant was its ability to provide a rule-based and probabilistic decision support
within a single platform. The guideline-based CDS is based on clinical guideline
rules, while the probabilistic CDS is based on a Bayesian network trained on the
English Lung Cancer Audit Database (LUCADA). They assessed rule-based and
probabilistic recommendations based on their consonance with the treatments
recorded in LUCADA. Their key findings were that the guideline rule-based rec-
25

ommendations perform well in simulating the recorded treatments with exact and
partial concordance rates of 0.57 and 0.79, respectively. On the other hand, the
exact and partial concordance rates achieved with probabilistic results are rela-
tively poorer with 0.27 and 0.76. However, probabilistic decision support fulfils
a complementary role in providing accurate survival estimations.
2.1.2 Clinical Decision Support Systems in Cardiovascu-
lar Care
Cardiovascular domain is the most demanding area of research all over the world.
World Health organisation publishes mortality statistics every year to increase
awareness about the seriousness of the problem. Almost half (46%) of all deaths
are as a result of cardiovascular disease. Cardiovascular disease Statistics pro-
vided by the British Heart Foundation. Heart disease and circulatory diseases
(Cardiovascular disease or CVD) are the major cause of death all over the world.
In the UK alone, it accounts for approx 200,000 deaths each year- one in three of
all deaths. The main forms of CHD (Coronary heart disease) are heart attack and
Stroke. CHD is the leading cause of sudden and premature deaths in the United
Kingdom. In 2008, approximately 88,000 deaths were because of coronary heart
disease. Stroke caused over 43000 deaths in the UK and there were a further
60,000 deaths from other circulatory diseases. CHD is also the main reason of
premature death in United Kingdom, 28% of premature deaths in men and 20%
of premature deaths in women were caused by CVD in 2008.
(CVD) is the collective term for a group of related conditions affecting the
heart, arteries or blood vessels, including coronary heart disease (accounting for
about 50%) and stroke (accounting for about 25% of these conditions). CVD
represent the single largest cause of mortality in the developed economies and
are rapidly reaching epidemic proportions in the developing world. According to
recent studies [52] and [53], up to 90% of the risk of a first heart attack is due to
lifestyle factors that can be changed.
Coronary heart disease (CHD) also contributes to high mortalities ratio in the
UK, and the death rate in the UK is still higher than many European countries.
26

Approximately 2 million people are currently living with angina in the UK. This
condition is associated with an annual mortality between 2.8% to 6.6% per annum
[54]. The incidence of angina and acute coronary syndromes has been shown to
vary according to risk factors such as age, gender and ethnicity.
The AHA (American Heart Association) recently published statistics in [55]
showed some alarming figures. The total number of inpatient cardiovascular op-
erations and procedures increased from 5939000 in 2000 to 588000 in 2010 (Na-
tional Heart, Lung, and Blood Institute computation based on National Centre
for Health Statistics). The total direct and indirect cost of CVD and stroke in
the United States for 2010 is estimated to be $315.4 billion dollars. This figure
includes health expenditures (direct costs, which include the cost of physicians
and other professionals annual data). By comparison, in 2008, the estimated
cost of all cancer and benign neoplasms was $201.5 billion ($77.4 billion in direct
costs, and $124 billion in mortality indirect costs). CVD costs more than any
other diagnostic group in their statistical analysis study which demonstrated its
severity and high mortality ratio in the US.
Automated Cardiovascular decision support systems are now being deployed
in hospitals and primary care organizations in order to meet the ever growing
clinical needs of prognosis in the areas of cardiovascular disease and Coronary
heart disease. Computerized decision support strategies have already been im-
plemented successfully in several areas of cardiovascular care. These applications
are being used as part of the extension of clinical informatics infrastructure in
the UK and US. These systems are being used in both primary and secondary
care settings in pursuit of providing efficient healthcare delivery to its patients.
In order to capitalize on the benefits provided by cardiovascular decision support
systems, a strong foundation in evidence-based medicine and well-established
CPGs have to be considered to ensure clinical governance in the next generation
clinical systems.
In Table 2.1, information has been extracted from European Guidelines on the
avoidance of the CVD in the primary and secondary care setting. If we analyse
statistics given in the Table 2.1, we can make an easy distinction to find out which
27

type of the patient is more suited for the prescription of ”statin” keeping in view
their information associated with multiple risk factors.This study has helped all
the authors responsible for writing current clinical guidelines to reinforce the need
to take into account multiple risk factors before clinical judgement (diagnosis,
prescription etc.) is made. The clinical guidelines can be made more vigorous
and easy to reuse by incorporating results achieved as part of the deployment of
these CVD risk estimation systems.
Gender Age (Years)Total Cholesterolmmol/l (mg/dl)
SBP (mm Hg) SmokerScore Risk %-10 year risk of Fatal CVD
F 60 8 (309) 120 No 2F 60 7(271) 140 Yes 5M 60 6((232) 160 No 8M 60 5(193) 180 Yes 21
Table 2.1: The clinical impact of a combination of risk factors on CVD test.
A novel cardiovascular decision support framework was presented by Farooq
et al.,2011 [56], with a view to provide a triage mechanism for primary and sec-
ondary care clinicians in the UK and US hospitals. The aim of their clinical
decision support framework was to help improve the diagnostic and performance
capabilities of Rapid Access Chest Pain Clinic(RACPC), by reducing delay and
inaccuracies in the cardiovascular risk assessment of patients with chest pain by
helping clinicians effectively distinguish acute angina patients from those with
other causes of chest pain. The key components of the proposed framework were
presented in [56, 57, 58]. Their proposed framework is also capable of learning
from legacy patient data containing missing information and its effective utilisa-
tion in the overall clinical decision making was demonstrated [59]. Their work
was further extended through the exploitation of RACPC (chest pain) patient
dataset in [60, 61]. They demonstrated the clinical effectiveness of the hybrid
clinical decision support mechanism through utilisation of ontology and machine
learning driving techniques. The proposed framework was also validated using
real chest pain patient data provided by Raigmore Hospital in the UK.
28

2.1.3 Cardiovascular Risk Estimation Systems for Dis-
ease Prevention
In the last few years, numerous risk scoring systems for coronary heart disease
and cardiovascular disease have been developed for clinicians.Some of the most
commonly used cardiac risk calculators are FRAMINGHAM, HEARTSCORE,
INTERHEART and ASSIGN.
Framingham Cardiac Risk Scoring Systems
The Framingham algorithms are the most widely accepted method for projecting
cardiovascular disease/coronary disease risks, and are used in the British, Euro-
pean and New Zealand guidelines [62, 63].These risk scoring systems are reliable
in ranking individual CHD and CVD risks within populations, based on conven-
tional risk factors, but have been shown to give a variable performance when
predicting actual events within populations [64, 62].
The Framingham group has developed the best known risk-estimation system
serving health communities all over the world. They have been recognized as
pioneers in the domain of cardiovascular risk estimation. The Framingham group
was also successful in developing some of the major statistical methods which
are used in modern risk-estimation systems. The Framingham risk- estimation
system has been adapted and made part of the clinical guidelines all over the
world as part of CVD preventative care.
The Assign Score
The Assign-Score is a risk calculator developed specifically for European pop-
ulations and the risk estimation function can be recalibrated in order for it to
be deployed in other countries outside Europe. ASSIGN includes social depri-
vation for the first time, and family history of cardiovascular disease, with the
classic risk factors. High risk (score 20 or more) implies risk-lowering medication
and/or other medical help. ASSIGN is the cardiovascular risk score chosen for use
by SIGN (Scottish Intercollegiate Guidelines Network) and Scottish Government
Health Directorates.
29

HeartScore Cardiovascular Risk Estimation System
HeartScore is aimed at providing clinical decision support to clinicians in opti-
mising individual cardiovascular risk reduction [65].The European Society of Car-
diology, European Society of Hypertension and European Atherosclerosis Society
have made a recommendation to estimate total cardiovascular risk in apparently
healthy individuals [66].The aim of their research study was to find a mechanism
which clinicians could use to better identify patients at high risk of developing
cardiovascular disease [67].
The HeartScore risk assessment is derived from a large dataset of prospective
European studies and predicts fatal atherosclerotic CVD events over a ten year
period.This risk estimation is based on the following risk factors: gender, age,
smoking, systolic blood pressure and total cholesterol. This score model has
been calibrated according to each European country’s mortality statistics. In
other words, if used on the entire population aged 40-65, it will predict the exact
number of fatal CVD-events that eventually will occur after 10 years.
The relative risk chart may be used to show younger people at low total
risk that, relative to others in their age group, their risk may be many times
higher than necessary. This may help to motivate decisions about avoidance of
smoking, healthy nutrition and exercise, as well as flagging those who may become
candidates for medication. This chart refers to relative risk, not percentage risk.
In [68] Heart-Score offers a simple and quick risk assessment tool as a triage
system for patients in Accident and Emergency clinic. Triage of patients with
chest pain after an Emergency Medical System EMS call normally occurs in
the hospital emergency room (ER). It has been shown that the HEART-score
offers a simple and quick risk-stratifying tool in these patients. The European
Heart SCORE model constitutes the basis for national guidelines for primary
prevention and treatment of cardiovascular disease (CVD) in several European
countries. The model estimates individual’s 10-year CVD mortality risks from
age, sex, smoking status, systolic blood pressure, and total cholesterol level. The
SCORE model, however, is not mathematically consistent and does not estimate
30

all-cause mortality [66]. Using a competing risk approach, they first re-estimated
the cause-specific risk of dying from cardiovascular disease, and secondly they
incorporated non-CVD mortality. Finally, non-CVD mortality was allowed to
also depend on smoking status, and not only age and sex. From the models, they
estimated CVD-specific and all-cause 10-year mortality risk, and the expected
residual lifetime together with corresponding expected effects of statin treatment.
InterHeart Risk Estimation System
The INTERHEART study focussed on the development of risk estimation system
assessed using the significant risk factors for coronary artery disease worldwide.
Nine measured and potentially modifiable risk factors, accounted for more than
90% of the proportion of the risk for acute myocardial infarction. ”Smoking,
history of hypertension or diabetes, waist hip ratio, dietary pattern, physical ac-
tivity, alcohol consumption, blood apolipoproteins and psychosocial factors were
identified as the key risk factors”. The effect of these risk factors was consis-
tent in men and women across different geographic regions and by ethnic group.
The British Regional Heart Study also found that smoking, blood pressure and
cholesterol accounted for 90% of attributable risk of CHD worldwide, the two
most important modifiable cardiovascular risk factors are smoking and abnormal
lipids. Hypertension, diabetes, psychosocial factors and abdominal obesity are
the next most important but their relative effects vary in different regions of the
world.
2.1.4 Machine Learning Driven Cardiovascular Decision
Support Systems
Machine learning refers to a type of artificial intelligence algorithm designed to
identify patterns in input data, such as patient characteristics, in order to perform
complex classification tasks.Machine Learning based clinical decision support sys-
tems can avoid the bottleneck of knowledge acquisition because knowledge is di-
rectly learned through the clinical data. In addition, ML-based clinical decision
support systems are able to give recommendations that are generated by non-
31

linear forms of knowledge, and are easily maintainable by simply adding new
cases [69].
[70], considered a clinical use case of predicting cases of POAF (post atrial
fibrillation) following CABG (coronary artery bypass graft) surgery. Predictive
features such as age, body mass index (BMI), and systolic blood pressure (SBP),
were selected to predict whether patients could develop AF (Atrial Fibrillation)
during the recovery period following CABG. Authors utilised k-NN algorithm in
their experimental setups. The k-NN algorithm was provided with a number of
labelled training samples, which in this case consisted of a set of three features
for a series of patients who have undergone CABG in the past, as well as their
clinical outcome in terms of AF occurrence, or lack thereof, during the recovery
period. As part of their experimental setup, it works on the basis that when a
new patient arrives, their age, BMI and blood pressure are given as inputs to
the k-NN algorithm, creating a new point in three-dimensional feature space. In
order to predict whether or not this new patient will develop POAF following
CABG, their data are compared with the set of labelled training examples pro-
vided. The k-NN algorithm then classifies this new scenario based on the class of
its k-nearest neighbours in feature space, where k is a number pre-defined by the
user. If, for example, a value of k = 3 is selected, the three nearest neighbours in
feature space are identified, and the class most common among these neighbours
are assigned with the values from the new unlabelled example. Any value of k
could be selected, although it is beneficial to choose odd numbers in order to avoid
tied votes, and also to find a balance amongst selecting really large or really small
values of k for experimental design purposes. The advantage of a small value of
k is that it can create good distinction between class boundaries, whereas a large
value for k is less likely to be adversely affected by artefact and outliers. However,
larger value of k is beneficial when there is ample training data and therefore all
k neighbours are nearby in feature space. Additionally, a common modification
to the k-NN algorithm is to weigh the contribution of the k-nearest neighbours by
dividing their vote, essentially a 1, by their distance to the input example. This
facilitates closer neighbours to exert greater influence on the final outcome. Fi-
32

nally, if the algorithm’s purpose is to truly simulate a learning process, it may be
beneficial to add new, correct labelled cases to the set of example data in order to
increase the accuracy of future predictions. However, due diligence is required to
select and collect accurate and reliable features in a consistent manner. For exam-
ple, there may be a small difference in risk between a patient born in January and
a patient born in December of the same year; perhaps it would be beneficial to
measure age in days for this reason. In addition, measures such as blood pressure
and body mass index may fluctuate during the course of the day. The authors
hypothesize that the risk for POAF may be significantly independent of these
fluctuations, despite their potential effect on classification of patients. A second
approach which was considered in their experimental setup was the support vec-
tor machine (SVM). This algorithm, which is similar to the k-NN algorithm, uses
a set of labelled training data to prepare a model capable of accurately classifying
new unlabelled examples. The difference, however, is that the SVM attempts to
divide the points in the feature space by finding an optimal separator between
classes, where the gap between the separator and points on either side is as wide
as possible. The algorithm classifies new examples based on which side of the
separator they are placed. Another machine learning based clinical decision sup-
port system was demonstrated in Fig 2.5, through the exploitation of a Bayesian
Belief Network by combining expert’s opinion with multivariate statistical data
analysis. Expert’s knowledge was derived from interviews of 11 members of the
Artificial Heart Program at the University of Pittsburgh Medical Centre. This
was complimented with retrospective clinical data from the 19 VAD (Ventricular
Assist Devices) patients considered for wearing between 1996 and 2004. Artificial
Neural Networks and Natural Language Processing were used to mine these data
and extract sensitive variables.
In [71], a number of computational intelligence techniques were utilised in
the detection of heart disease as a preventative measure. A comparative analysis
of 6 well-known machine learning classifiers was carried out using the Cleveland
heart disease dataset. Authors introduced medical knowledge driven feature se-
lection (MFS)and it was compared against the state of the art feature selection
33

Figure 2.5: Hybrid Decision Support Model for Optimal Ventricular Assist DeviceWeaning [5].
.
algorithms.Their experimental results showed that machine learning classification
combined with MFS significantly improved the performance of binary classifica-
tion. MFS feature selection technique was combined with computerised feature
selection process to further refine classification accuracies obtained in previous it-
erations. MFS combined with Naive Bayes and Sequential minimal optimisation
(SMO for training of support vector machine) provided the best classification ac-
curacies and TP (true positive) and F-measure resulted in a higher performance
as compare to experimental setups based on state of the art feature selection
techniques combined with machine learning classifiers.
34

2.1.5 Role of Feature Selection in Clinical Decision Sup-
port Systems
The main objective of feature selection in machine learning based clinical decision
support systems is to reduce the number of predictive clinical features used in
the model while improving performance of the clinical predictive model without
degrading its performance. A large number of features causes several computation
problems. One of the most significant issue is the cost of computation (in terms
of time and computational resources). If the number of clinical creatures is high,
the computation time and memory space will rise dramatically. The problem
becomes intractable for some simple induction algorithms. Another problem is the
generalization of predictive performance. Complexity increases with the number
of features, and high complexity may result in over-fitting because too many
features may be redundant or misleading. In addition, a large number of features
requires a lot of storage space and may increase the cost of data maintenance.
In [72], authors classified feature selection techniques as either filter or wrapper
models. The filter model is a preprocessing step to induction methods. Feature
ranking is an example of filtering. In feature ranking, we use a function inde-
pendent of the induction method to rank features based on scores. For example,
features can be ranked by the Pearson correlation coefficient,
R(i) =cov(Xi, Y )√var(Xi)var(Y )
(2.1)
where X is the variable set, Y is the class label, and i indicates the variable of
interest. We can also build several single-variable classifiers, and rank classifiers
(features) based on error rates.
Feature selection techniques can be categorized according to a number of cri-
teria as shown in Figure 2.6 [73]. One popular categorisation is based on whether
the target classification algorithm will be used during the process of feature eval-
uation. A feature selection method, that makes an independent assessment only
based on general characteristics of the data, is named “filter [74]; while, on the
35

other hand, if a method evaluates features based on accuracy estimates provided
by certain learning algorithm which will ultimately be employed for classification,
it will be named as “wrapper [74], [75].
Using wrapper methods, the performance of a feature subset is measured
in terms of the learning algorithm’s classification performance using just those
features. The classification performance is estimated using the normal procedure
of cross validation, or the bootstrap estimator. Thus, the entire feature selection
process is rather computation-intensive. For example, if each evaluation involves
a 10-fold cross validation, the classification procedure will be executed 10 times.
For this reason, wrappers do not scale well to data sets containing many
features [76]. Also, wrappers have to be re-run when switching from one clas-
sification algorithm to another. In contrast to wrapper methods, filters operate
independently of any learning algorithm and the features selected can be applied
to any learning algorithm at the classification stage. Filters have been proven to
be much faster than wrappers, and hence can be applied to data sets with many
features.
Sequential Floating Forward Selection (SFFS) is one of the most efficient
wrapping methods for feature selection proposed in [77]. This method operates
in a similar manner as Forward selection, also works in an iterative manner and
starts with empty set of features. However, the features selected after each itera-
tion are removed one by one [78]. If the removal of a feature results in increasing
the classification accuracy, then the corresponding feature is permanently dis-
carded from the feature set. This approach guarantees that the final set does not
contain correlated features.
Minimal-Redundancy Maximal-Relevance Criterion : In [79], this fea-
ture selection was proposed with a view to identify most discriminant features
according to two criteria :
1. Maximal Relevance
maxR(Z, c), R =1
|Z|∑xiεZ
I(fi : c), (2.2)
36

Figure 2.6: Feature selection process based on wrappers and filtering methods.
2. Minimal Redundancy
minO(Z), O =1
|Z|2∑fi,fiεZ
I(fi : fj), (2.3)
Where Z is the group of clinical variables under examination I(fi : c) is
the mutual information between features fi and class c and I(fi : fj) is the
mutual information between the features . The criterion combining constraints in
Equations 2.2 and 2.3 is called Minimal redundancy maximal-relevance (mRMR).
The advantages of mRMR algorithm are low computational complexity, classifier-
independence and highly effective selection of uncorrelated features. Details of
some of the other commonly used classification techniques are provided in the
Appendix ??.
37

Figure 2.7: Block Diagram of SFFS Algorithm as described by Hicham et al.
2.2 Conclusion and Discussion
This chapter describes a number of existing clinical decision support techniques
through which clinical decision support operations may be built. The focus of
our review was to critically review the existing state of the art of a wide range of
clinical decision support systems and techniques exploited in them with a view
to build a clinical decision support framework to meet the key objectives of this
research project. A number of clinical decision support mechanisms were critically
analysed, some of which are based on conventional best design practices like rule
based systems and risk estimation systems, others take into account an array of
AI inspired techniques which included machine learning inspired clinical decision
38

support systems, ontology driven clinical decision support systems and hybrid
clinical decision support systems.
An extensive review of some of the most well established techniques in clinical
decision support systems were studied, particularly commercial clinical decision
support systems and pre-operative clinical decision support systems based on
NICE clinical guidelines were reviewed. In ontology driven hybrid clinical deci-
sion support frameworks, we found a lot of similarity among key components of-
fered by these clinical decision support frameworks. Electronic healthcare records
generation is one of the most important aspect of these systems and they encapsu-
late episodic patient’s summary which is often needed at the time of assessment
by the clinicians. These CDSSs prioritise and display recommendations which
are pertinent to the patients’ medical histories and provide a foundation for the
development of biologically inspired clinical decision support systems. Ontology
driven techniques provide scalable and component based approach through which
reusable decisions support components can be developed in an iterative manner.
This scalable and reusable approach facilitates cost effective development and
maintenance of different clinical decision support components which could be
integrated in an intelligent manner to deliver a holistic clinical decision support
mechanism. In the forthcoming chapters, details of the proposed framework along
with its key components will be discussed.
39

Chapter 3
A Novel Ontology and Machine Learn-ing Driven Hybrid Clinical Deci-sion Support Framework for Car-diovascular Preventative Care
A background review of the clinical decision support systems and evaluation
of some of the most recent techniques deployed in these clinical systems has been
conducted (demonstrated in chapter 2), its findings were discussed with project’s
clinical domain experts from the UK and US hospitals. Our project’s clinical
domain experts team comprises of Professor Stephen Leslie, (consultant cardiol-
ogist from Raigmore Hospital) in the UK, Professor Calum MacRae (consultant
cardiologist from Brigham and Women’s Hospital, Harvard Medical School) and
Professor Warner Slack (Beth Israel Deaconess Medical centre, Harvard Medical
School) in the US. The multidisciplinary research project’s key aims were anal-
ysed in light of literate review’s findings with a view to propose a novel clinical
decision support framework to suit clinical needs of both primary and secondary
care clinicians in the UK and US.
The primary objective of this research project is to provide a clinical decision
support framework for cardiovascular patients by utilising the legacy RACPC
patient data (held in Raigmore Hospital’s clinical repositories) to facilitate evi-
dence based cardiovascular preventative care. Professor Stephen Leslie, consul-
tant cardiologist from Raigmore Hospital helped identify, a clinical case study for
40

Raigmore Hospital’s RACPC in order to develop a clinical decision support mech-
anism for RACPC clinicians. He also specified a requirement for RACPC specific
cardiac chest pain prognostic models to be developed for RACPC clinicians to
diagnose cardiac chest pain patients efficiently.
Professor Calum MacRae, consultant cardiologist from Brigham and Women’s
Hospital specified a need of a triage mechanism as part of the proposed clini-
cal decision support framework for cardiovascular preventative care. This triage
mechanism is envisaged to act as an initial encounter (before patients are seen by
the consultant cardiologist) for patients to build their patient medical records by
answering a series of questions (ontology driven context sensitive clinical question-
naires) regarding their medical histories. The clinical decision support framework
is expected to utilise information recorded in the patient medical profile to carry
out cardiac risk assessment for various cardiovascular diseases like coronary heart
disease, myocardial infarction and recommendation of lab tests and medication
as per the clinical rules provided by the consultant cardiologist from Harvard
Medical School.
Professor Warner Slack from Beth Israel Deaconess Medical centre, Harvard
medical school is recognised as an authority in the areas of patient interview-
ing systems and developing healthcare systems focussing on improving doctor-
patient interaction through the utilisation of standardised clinical questionnaires,
he wrote some 40 years ago. He has developed clinical questionnaires in multi-
ple clinical domains which are currently in use in the patient healthcare system
at the Beth Israel Deaconess Medical centre.Professor Slack kindly shared his
clinical questionnaires in the cardiovascular and family history domain which are
utilised in the adaptive information collection component for generating patient’s
medical history.
3.1 Proposed Framework
A cornerstone of my literature review was the prior ontology driven and hybrid
clinical decision support framework in the domain of pre-operative clinical risk
assessment by Matt Mouley Bouamrane in [80], [46] [2] and [81] by Matt Mouley
41
et al from the Institute of Health and Wellbeing from University of Glasgow.
They implemented a hybrid system for preoperative risk assessment of patient
undergoing elective surgery. Their developed decision support system was based
on a Rule Engine and Reasoner on a clinic ontology driven framework for the
development of a decision support system in the pre-operative risk assessment of
patients in the secondary care. This preoperative decision support system relies
on information collection component to collate patient’s medical and demograph-
ics data. As this system was developed inspired by semantic web development
techniques, therefore acquired patient medical data was modelled in OWL [46]
to give patient data an intrinsic meaning in order to perform decision support
operations using domain specific ontologies and NICE guidelines [80].
Their clinical decision support framework provides a pre-operative risk as-
sessment mechanism (as per NICE clinical guidelines) for patients and lab tests
recommendation before they are being considered for any major surgical proce-
dures in the secondary care. Bouamrane et al demonstrated through their post
doctoral research work in [2] that the ontology driven decision support systems
outweigh other types of clinical decision support frameworks in terms of its cost
effective maintenance, easy to reuse the expert’s modelled view in OWL and fa-
cilitates development of scalable healthcare applications which can be deployed
in healthcare setting as a commercial preventative care clinical solution [81].
As a result of the detailed review in chapter 2 and keeping in view our project’s
key aims/objectives, an ontology and machine learning driven hybrid clinical de-
cision support framework is proposed to provide clinical decision support mech-
anism for primary and secondary care clinicians. The proposed clinical decision
support framework aims to provide a cardiovascular preventative care solution, it
comprises of two key components - (1) an Ontology Driven Clinical Risk Assess-
ment and Recommendation System (ODCRARS) and (2) the Machine Learning
Driven Prognostic System (MLDPS). The utilisation of ontology driven methods
help system developers build more scalable, cost effective, reusable and modu-
larised clinical decision support components which are integrated as clinical de-
cision support hybrid frameworks. These clinical decision support hybrid frame-
42

works could be exploited in other clinical domains to provide clinical decision
support by modifying clinical rules engine and domain specific ontologies with-
out altering the interface, database and framework design.
43

Patient
Medical
Records
Cardiac Risk Scores for Chest
Pain and Heart Disease
Lab Tests and Medication
Recommendation
RACPC(Chest Pain) and
Heart Disease Patient
Datasets, Pre-processing,
Missing Data Handling
Feature Selection and Machine
Learning
Cardiac Chest pain and
Heart Disease
Prognostic Models
Centralised
Database
Legacy Patient DataQuestionnaire
OntologyPatient Semantic
Profile in OWL
NICE/Expert Driven
Clinical Rules
Engine
User Input Adaptive
Clinical
Questionnaire
Ontology Driven Clinical Risk
Assessment and Recommendation
System
Machine Learning Driven
Prognostic System
Ontology Driven Clinical
Decision Support
Recommendation
Ontology
1.
2.a
2.b
3.a
3.b
4.a
5.
6.
7.a
7.b
8.
9.
Figure 3.1: A Novel Ontology and Machine learning-driven hybrid Clinical Deci-sion Support Framework for Cardiovascular Preventative Care.
44

The proposed clinical decision support framework could be used for automat-
ically conducting patient pre-visit interviews. It will not replace a human doctor,
but would be used before an hospital visit to prepare the patient, deliver edu-
cational materials, cardiac risk assessment scores, cardiac chest pain and heart
disease scores and pre-order appropriate tests, making better use of both clinician
and patient time. The ODCRARS could be used as a triage system in the cardio-
vascular preventative care which could help clinicians prioritise patient appoint-
ments after reviewing snapshot of patient’s medical history (collected through an
ontology driven intelligent context aware information collection using standard-
ised clinical questionnaires) containing patient demographics information, cardiac
risk scores, cardiac chest pain and heart disease risk scores, recommended lab tests
and medication details. We also aim to validate the proposed novel ontology and
machine learning driven hybrid clinical decision support framework in other ap-
plication areas. Further two clinical case studies in the heart disease and breast
cancer domains are considered for the development and clinical validation of the
MLDPS.
One of the key aims of the proposed clinical decision support framework is
to help improve the diagnostic and performance capabilities of Raigmore Hospi-
tal’s RACPC (Rapid Access Chest Pain Clinic) patients, by reducing delay and
inaccuracies in the cardiovascular risk assessment of patients with chest pain by
helping clinicians effectively distinguish acute angina patients from those with
other causes of chest pain. We decided to build a clinical decision support frame-
work in order to develop a novel ontology and machine learning driven hybrid
clinical decision support framework which is reusable, scalable with cost effec-
tive maintenance. The proposed framework could be utilised in other application
areas like diabetes, arthritis, cancer etc.
The key components of the framework are reusable (through mapping of dis-
ease specific questionnaire ontology, recommendation ontology based on clinical
rules and NICE guidelines) in the disease management of other chronic illnesses.
The proposed ontology and machine learning driven hybrid clinical decision
support framework comprises of two key components to provide a cardiovascular
45

preventative care solution for primary and secondary care clinicians in UK and
US. The key components are as follows:
1. Ontology Driven Clinical Risk Assessment and Recommendation System
(ODCRARS).
2. Machine Learning Driven Prognostic System (MLDPS).
3.2 ODCRARS for Cardiovascular Preventative
Care
The proposed ODCRARS is developed using a hybrid approach based on on-
tology driven techniques and clinical rules engine. Ontology driven approach is
exploited in the development of Intelligent Context aware Information Collec-
tion Component and recommendation of lab tests and medication is carried out
through the recommendation Ontology. A dedicated clinical rules engine is de-
veloped to carry out the cardiac risk assessment (for calculating global, absolute
and relative cardiac risk scores) and for implementing access control for system
users (patients and clinicians).
3.2.1 Ontology driven intelligent context aware informa-
tion collection component
Healthcare information systems are widely used all over the world to alleviate
diverse healthcare demands and supply gaps [82]. Clinical systems based on
information collection through questionnaires are fundamental to the core func-
tioning of healthcare information management systems. With the recent success
of electronic healthcare records globally, information collection through intelli-
gent means has now become one of the most important components of modern
healthcare systems. In modern patient interviewing/screening systems, one of
the main challenges to date is to get patients involved in the clinical decision
making process by getting them to interact with usable information collection
systems to collect their medical records. Healthcare resources in most parts of
46

the world are stretched to the limit which is why healthcare providers’ main focus
is to build preventative care solutions based on patient medical records. Patient
triage systems are more in demand than ever before, demonstrating why they are
an essential component of healthcare information management systems. They
ensure safe record keeping of patient medical records along with clinical risk as-
sessment information, details of recommended lab tests and medication as part
of preventative care measure. Patient triage systems help clinicians optimise the
referral process and enable them to utilise their consultation time more efficiently
by focussing on providing more direct care for their patients.
Information collection systems should make patient interviews relevant for the
majority of patients, and be presented in a very clear, concise and well-organised
way without sacrificing comprehensiveness. This has proved to be very difficult to
achieve using conventional interviewing systems based on static questionnaires. In
order to overcome these, we propose an ontology driven intelligent context aware
information collection component which to conduct patient interviews. Another
purpose of the ontology driven adaptive questionnaire is to mimic the exploratory
behaviour exhibited by the clinicians. Patient answers provided in these inter-
views are used for generating patient medical records. The standardised clinical
questionnaires written by Professor Warner Slack in the cardiovascular and family
history domains are utilised in the development of an ontology driven adaptive
questionnaire which adapts itself as per patient’s medical history thus only ask-
ing relevant information which is pertinent to patient’s circumstances. These
questionnaires have been clinically validated and are currently being deployed
(for patient’s online interviews/screening and to collect their medical histories)
in the healthcare information management system called “PatientSite” at Beth
Israel Deaconess Medical Centre, which is affiliated teaching hospital of Harvard
Medical School. These clinical questionnaires (cardiovascular, chest pain and
family history) were originally developed using branching logic encoded in a non-
procedural MUMPS language 1. Branching logic encoded in questionnaires was
1MUMPS is a general-purpose computer programming language that provides ACID(Atomic, Consistent, Isolated, and Durable) transaction processing.
47

decoded (by following programming constructs in MUMPS language) into simple
text. As it can be seen in Fig 3.2, clinical questionnaires are encoded in a procedu-
ral language with Go To” operators and frame numbers which provide a switching
mechanism in these static questionnaires. After decrypting these questionnaires
we developed a high level questionnaire design using a decision tree based ap-
proach to decrypt clinical work flows encoded in these questionnaire. The high
level questionnaire design was then used for the development of ontology driven
adaptive questionnaire
Figure 3.2: Chest Pain risk assessment questionnaire encoded in MUMPS, devel-oped by Professor Warner Slack from Harvard Medical School [6].
The proposed ontology driven intelligent context aware information collection
component could be used for automatically conducting patient pre-visit interviews
and for preparing patient medical records before actual appointments with their
relevant clinicians, this will free up resources (in terms of filling paper based
questionnaires, nurses workload) and will enable clinicians to make better use
of their consultation time in providing quality patient care. As cardiovascular
48

risk assessment can be time consuming, ontology driven intelligent context aware
information collection provides a robust, scalable and configurable mechanism
which could help free up expensive and limited resources, leaving clinicians with
more time to fulfil their primary goal of administrating medical care for their
patients. The details of development, design and validation stages of the proposed
ontology driven intelligent context aware information collection component will
be provided in chapter 4.
3.2.2 Patient Medical Records
Patient medical records are generated using patient answers collated through the
ontology driven adaptive clinical questionnaire. This information containing pa-
tient demographics and clinical review details is saved in the centralised database
for its utilisation by clinical rules engine for clinical risk assessment purposes.
Patient medical records is generated using patient answers and it provides a
snapshot of patient’s medical history. These medical records are used by clinical
rules engine for the cardiac clinical risk assessment of patients to calculate risk
scores of various cardiovascular diseases which includes, Coronary Heart Disease,
Myocardial Infarction etc. Cardiac global, absolute and relative risk scores are
calculated using a set of clinical rules executed by Java rules engine called jess.
Patient Semantic Profile
The information represented at the patient records level lacks flexibility in its
structure and due to their static nature, patient medical records do not carry
any intrinsic meaning. The information collection based on an ontology driven
approach provides an opportunity to generate patient semantic profile through a
clinical ontology in order to preserve the semantics in the information collected.
The importance of utilising this approach is that patient medical records are be-
ing a single repository of information that could be used to provide a number of
services within the proposed framework. They could be used as an input to a
clinical rules engine for cardiac risk assessment for various cardiovascular diseases,
for generating patient summaries/doctor notes and provide vital clinical data re-
source for the semantic transformation of patient medical records to generate pa-
49

tient semantic profile. This approach provides greater flexibility in comparison to
standard healthcare software implementations. This will help build system com-
ponents using modularised approach of building reusable components. Patient
Semantic profile generated in the proposed framework is a formal representation
of the information collected through the cardiac risk assessment of patient based
on patient interviews which are conducted using ontology driven intelligent con-
text aware information collection component. Modelling of patient information
contained in patient medical records for any of the given patients is an extremely
challenging process, however doing so in a more constrained clinical domain is
somehow more manageable.
The ODCRARS utilises clinical questionnaires to carry out complete clini-
cal review of the patient. For patient modelling work our focus is on the data
transformation of patient medical records extracted through ontology driven car-
diovascular and family history questionnaires. Figure 3.3 presents a patient se-
mantic profile generated using web ontology language in the Protege application
programming interface. As it can be seen in the generated profile, many items of
information of clinical relevance are represented through boolean-type data with
the help of owl data types i.e. absence or presence of a specific clinical condi-
tion. Examples are “has absence of Myocardial Infarction” and “has presence
of high blood pressure”. This information was collated in the patient medi-
cal records as part of patient interviewing processes conducted through context
aware information collection component. The purpose of collating this clinical
information is to highlight existence and absence of certain medical conditions to
the clinicians, so that these clinical risk factors could be taken in account whilst
patients are being considered for various lab tests or prescribing any medications
to treat any specific cardiovascular condition. In the patient semantic profile,
occurrences of past medical conditions are represented through data properties
like “hasPresence” and “hasAbsence” data properties. Qualitative information is
represented as “HasCT-Result” which is shown as normal. Details of myocardial
perfusion scans can be asserted in the questionnaire ontology to make it more
specific and define different levels of tests and their clinical interpretations for
50

clarity purposes. Temporal information is provided through the inclusion of data
properties like “FalseinPast-and-True-atPresent” and “True-in-Past-and-True-in-
Present” etc. A patient data record modelled in the semantic profile reads as
a patient who is male of 75 years of age and was assessed by clinician at the
Rapid Access Chest Pain Clinic (RACPC). The patient’s initial assessment was
“New Exertional Angina”, with a condition of hypertension and absence of high
cholesterol levels. Lab results like MPS and CT scans were normal. Patient is a
smoker although patient did not smoke in the past. Patient is diabetic and clin-
ician’s final assessment corroborated with initial findings of RACPC clinicians
which is “Acute Coronary Syndrome”. The patient semantic profile is modelled
using OWL Semantic Modeller, we here provided a short description of the pa-
tient semantic profile, its purpose and utilisation in the cardiovascular domain.
Details of its design and development will be provided in chapter 4.
Figure 3.3: Patient Semantic Profile in OWL, developed using Protege-OWL.
51

3.2.3 Ontology Driven Decision Support
The ODCRARS provides clinical decision support mechanism based on a recom-
mendation ontology (for lab tests and medication recommendation) and clinical
rules engine. The proposed ODCRARS shown in Fig 3.1 aims to provide an online
cardiovascular preventative care solution, with a view to enhance the clinician-
patient consultation mechanism effectively by facilitating patients to complete
a standardised clinical review of their current and past medical histories prior
to hospital visits. These reviews are conducted through the ontology driven
intelligent context aware information collection component. The recommenda-
tion system exploits information held in the patient medical records and patient
semantic profile to carry out clinical decision support operations using clinical
rules engine and recommendation ontology for the recommendation of lab tests
and prescription of medication.
The ODCRARS collects structured information ( driven through a web-based
context-sensitive standardised clinical questionnaires) using a systematic medical
extermination technique known as the patient clinical review. It then provides
a suggested list of laboratory tests and medication using domain specific recom-
mendation ontology
In addition to these cardiac risk assessment scores, the ODCRARS also pro-
vides cardiac chest pain and heart disease risk scores. These risk scores are
displayed within the doctor’s risk assessment module in the ODCRARS. It pro-
vides a holistic cardiovascular decision support by providing clinicians an array of
cardiovascular risk assessment scores, recommendation of lab tests and medica-
tion. Implementation details of the recommendation ontology and clinical rules
engine will be provided in chapter 4.
52

3.3 Machine Learning Driven Prognostic Mod-
elling for Cardiovascular Preventative Care
Computational Intelligence and healthcare informatics, are transforming health-
care to a proactive P4 medicine that is Predictive, Preventative, Personalised and
Participatory. Computational intelligence - holistic, and integrative approach has
given rise to machine learning driven prognostic modelling. In this chapter, we
propose a MLDPS for cardiovascular preventative care. Legacy patient data resid-
ing in clinical repositories provide the foundation of building a machine learning
driven prognostic system based on clinical case studies for RACPC/cardiac chest
pain and heart disease patient datasets, with a view to develop chest pain and
heart disease specific prognostic models for the clinical risk assessment of car-
diovascular patients. The development of the MLDPS was carried out in close
collaboration with clinical experts, the RACPC (chest pain) clinical case study
was identified by the consultant cardiologist from Raigmore Hospital in Inverness,
UK. The key objective of the RACPC clinical case study was to help improve
the diagnostic and performance capabilities of the RACPC. The other key objec-
tive is to reduce delay and inaccuracies in the cardiovascular risk assessment of
patients with chest pain and help clinicians effectively distinguish acute angina
patients from those with other causes of chest pain.
The heart disease clinical case study was carried out in collaboration with
a general medical practitioner from UK in order to develop a preventative care
mechanism for patients who are at risk of developing heart disease.
An additional clinical case study in the breast cancer domain is also carried out
for the development and validation of the MLDPS to demonstrate its effectiveness
in other clinical application areas. In Fig 3.1, a high level overview of the overall
ontology and machine learning driven hybrid clinical decision support framework
and its two key components i.e. MLDPS and the ODCRARS are represented as
modular components which could be adapted to provide clinical risk assessment
53

in other application areas.
The ODCRARS is a knowledge-based system which is based on clinical ex-
pert’s knowledge, encoded in the form of clinical rules (utilised by the clinical
rules engine) to carry out cardiac risk assessment for various cardiovascular dis-
eases. The MLDPS is a non knowledge-based/data driven prognostic system
which is developed by applying machine learning and feature selection techniques
on legacy patient datasets.This approach eliminates the need for writing clini-
cal rules thereby reducing dependency on clinical experts to encode their advice
in the clinical decision making. Non-knowledge based clinical decision support
systems are utilised in providing point-of-care clinical decision making and im-
plementation of such solutions facilitate development of cost effective solutions
with improvement in the quality of care provided.
3.4 Machine Learning Driven Prognostic Model
An iterative development process, based on machine learning and feature selec-
tion, has been utilised in the development of machine learning driven prognostic
models. The prognostic model development process is general enough to handle
a variety of healthcare datasets which will enable researchers to develop effec-
tive evidence based clinical decision support systems. The key stages of the
prognostic model development process are shown in Fig 3.4, we will provide de-
tailed description of each development stage pertinent to each clinical case study
(RACPC, heart disease and breast cancer) in chapter 5. The general description
of each stage is as follows:
1. Data Acquisition
2. Data Pre-Processing
3. Feature Selection
4. Prognostic Model Development
5. Prognostic Model Validation and Evaluation
6. Online Clinical Prognostic Model
54

Figure 3.4: Schematic view of the Prognostic Model development process.
3.4.1 Data Acquisition
In the data acquisition stage, details of collating data through proprietary clinical
data repositories are described along with details of data extraction procedures
i.e. manual (running database scripts to export patient data from relational
databases) or through utilisation of electronic data capture (EDC). Electronic
data capture are particularly useful in the extraction of clinical data for clinical
trials or data analysis purposes. These methods increase the data accuracy and
decrease the time to collect data for longitudinal clinical studies.
The MLDPS is developed using machine learning and feature selection tech-
niques based on legacy patient data for RACPC (chest pain) and heart disease
datasets. An additional case study in the breast cancer domain has also been
utilised in the development and validation of the MLDPS. Clinical data in the
RACPC clinic case study were collated using manual procedures, since patient
data resided in multiple clinical repositories in disparate locations at Raigmore
hospital. This is why electronic data capture methods could not have been utilised
for this purpose. The heart disease and breast cancer datasets were extracted
from UCI data repositories. These data were originally shared by researchers
55

from University of Cleveland and University of Wisconsin for machine learning
projects.
3.4.2 Data Pre-Processing
As stated earlier, non-knowledge-based CDSS relies on evidence extrapolated
through a known dataset in order to provide predictions on unseen cases. Clinical
data is composed of a number of patient data records/data points, each of them
as a number of inputs expressed as independent variables and one output as the
dependent variable. Data pre-processing entails a number of sub-processes for the
pre-processing of data, these sub-processes are vital towards developing efficient
and accurate prognostic models.
Clinical Variables Pre-Processing
In the prognostic model development, pre-processing of candidate variables is
done in accordance with data types associated with each clinical variable. Clinical
variables could be categorised as follows:
1. Categorical variables, a type of variable that can take a finite number of
values, thus assigning each individual to a specific group or “category”.
Categorical variables can be further divided into:
� Nominal variables, which have two or more values without an intrinsic
order;
� Ordinal variables, which have two or more values with an intrinsic
order or ranking;
� Binary variables, which can assume only two values.
� Dichotomous variables, which can have only two categories. For exam-
ple, if we were looking at gender, we would most probably categorise
somebody as either ”male” or ”female”. This is an example of a di-
chotomous variable.
2. Continuous variables are also known as quantitative variables , which can
take any real value within given intervals;
56

Continuous variables are normally used “as is” or after a normalisation
process. Categorical variables cannot be used “as is. They need to be
encoded into a series of n - 1 binary variables where n is the number of
categories to be represented. It has to be noted that n - 1 binary variables
are able to define exactly n categories, while using n binary variables would
lead to a n-th variable which could be expressed as function of the other n -
1 ones causing problems to learning algorithms (i.e. making impossible the
matrix inversion in the estimation algorithm). This coding is necessary to
avoid the well known dummy variable trap, making the regression problem
unsolvable [83]. Generally speaking, model specifications should always
explain how variables are collected (including units of measure), calculated
and used in order to guarantee that the model will always be applied to
datasets which are consistent with the one used for developing such models,
i.e. variables are of the same kind and measured in the same unit [84].
”Effect Coding Scheme” is often utilised to alleviate collinearity problem
in the categorical clinical variables, it is represented in Table 3.1. More
independent variables are generated using this coding scheme.
Group Dummy Codes Effect Codes Contrast Codes Trend Codesa1 a2 a3 a1 a2 a3 a1 a2 a3 a1 a2 a3
A1 1 0 0 1 0 0 3 0 0 -3 1 -1A2 0 1 0 0 1 0 -1 2 0 -1 -1 3A3 0 0 1 0 0 1 -1 -1 1 1 -1 -3A4 0 0 0 -1 -1 -1 -1 -1 -1 3 1 1
Table 3.1: Different types of Coding Schemes for Categorical Variables, adaptedfrom ”Multiple Regression (MR) Using Categorical Variables in MR” tutorial.
Normalisation
Normalisation process involves transforming the data to fall within a common
range such [-1, 1] or [0.0, 1.0]. The term standardise and normalisation are used
interchangeably in data pre-processing. Normalising the data attempts to give all
clinical variables an equal weight. It is often useful for classification algorithms
involving neural networks or distance measurements such as nearest-neighbor
57

classification and clustering. The most commonly used normalisation technique
is z-score normalisation (zero mean normalisation) method, which converts all
variables to a common scale with an average of zero and standard deviation of
one.
Collinearity issue among independent variables
Collinearity test is often carried out to find out whether two or more independent
variables have a strong correlation: if there is strong collinearity between inde-
pendent variables it becomes impossible to obtain unique estimates of the model
coefficients [85]. However, also high levels of collinearity also present a problem
for any regression analysis [86], increasing the probability that a good predictor
(i.e. an independent variable which has good explanatory power) is considered
not significant and then rejected by the model. It is estimated that less than 20%
of published literature on medical logistic regression models reported appropriate
tests for detecting collinearity problems [87]. The prognostic model development
process recommends that an appropriate test is carried out to detect collinearity
issues. Various collinearity diagnostics are available; for example, the variance
inflation factor (VIF) or the tolerance statistics (defined as 1/VIF). VIF provides
an estimate of how much the variance of an estimated coefficient is increased
by the effect of collinearity [88]. Common criteria to determine if a collinearity
problem is present are a tolerance value less than 0.1 [89] or, equivalently, a VIF
value greater than 10 [90].
Missing Data Handling
Clinical decision making frequently involves making decisions under uncertainty
because of missing key patient data (e.g. demographics, episodic and clinical
diagnosis details) - this information is essential for modern clinical decision sup-
port systems to perform learning, inference and prediction operations. Machine
learning and clinical informatics experts aim to reduce this clinical uncertainty
by learning from the missing clinical attributes with a view to improve the overall
decision making. These high-dimensional clinical datasets are often complex and
carry multifaceted patterns of key missing clinical attributes.
58
The problem of learning from incomplete real patient data acquired from hos-
pital repositories could be handled through a statistical perspective. This could
entail using the likelihood-based approach, one of the most renowned techniques
to deal with this challenging issue. The statistical framework based on a set of
challenging statistical machine learning algorithms, derived from the likelihood-
based framework can handle clustering, classification, and function approxima-
tion from missing/incomplete data in an intelligent and resourceful manner. The
implementation of mixture modelling algorithms as well as utilising Expectation-
Maximization techniques for the estimation of mixture components and for deal-
ing with the missing clinical data can provide useful insights on how best to
approach classification techniques after missing values are estimated. Another
technique which is often used in such cases is handling missing data by substitut-
ing a mean for this missing data. For example if you don’t know cholesterol levels
of a patient, just substitute the mean cholesterol level for the patient and con-
tinue with classifying the datasets. It is to be noted that using mean substitution
techniques introduces only a trivial change in the correlation coefficient and no
change in the regression coefficient, therefore likelihood-based approach is often a
preferred choice due to its efficiency and consistency (maximum likelihood always
produces the same results for the same set of data) when dealing with missing
data in the clinical datasets.
3.4.3 Feature Selection
The main objective of feature selection is to reduce the number of prognostic
clinical variables used in the prognostic model while improving performance of
the clinical prognostic model without degrading its performance. A large num-
ber of clinical variables causes several computation problems. One of the most
significant issue is the cost of computation (in terms of time and computational re-
sources). If the number of clinical features is high, then the computation time and
memory space required will rise dramatically. The problem becomes intractable
for some simple induction algorithms. Another problem is the generalization of
prognostic performance. Complexity increases with the number of features, and
59

high complexity may result in over-fitting because too many features may be re-
dundant or misleading. In addition, a large number of features requires a lot of
storage space and may increase the cost of data maintenance.
3.4.4 Prognostic Model Development
After dataset preparation, a number of clinical variables are extracted through
the legacy patient data for the prognostic model development phase. The vector
of selected candidate independent clinical variables is called X and B which is
a vector of coefficients. Depending on the desired output, in most cases, linear
and logistic regression are able to provide prognostic models with a reasonable
level of accuracy. Logistic regression will be utilised and compared with other
classification techniques such as support vector machines and decision trees in
chapter 5.
Clinical Prognoses problems can be distinguished by the form of the output
space Y. If the predictive class is numeric or continuous (i.e. Y = R, the real line),
then the prognostic problem is a regression problem (e.g. predicting a physical
measurement such as height) [91]. If the predictive class is discrete (i.e.Y = 0, 1,
. . . , K 1) then we have a classification problem (e.g. predicting in the case of
breast cancer study whether a tumour is benign or malignant, more details about
this clinical case study will be provided in chapter 5).
In all of our clinical case studies , classification problems fall into this category
(i.e.y(m)ε 0,1), in this case the model y = f(B,X) is the probability of an input
data value belonging to a certain class. A threshold is generally applied to the
probability calculated from the model in order to predict what class the data
point is expected to belong to. The threshold is often used to quickly evaluate
the accuracy of the model. Besides being needed in practical usage, the threshold
is also commonly used to quickly evaluate the accuracy of the model (i.e. once
a threshold has been selected, the accuracy of the model is worked out using the
receiver operating characteristic (ROC) curves in terms of providing sensitivity,
specificity values for True Positive (TP), True negative (TN), False Positive (FP)
and False Negatives (FN). TP and FP values are utilised in calculating the pre-
60

cision of the prognostic model, at the same time recall could be calculated by
utilising TP divided by sum of TP + FN. Details of prognostic model evaluations
will be provided in the forthcoming section on model evaluation in 3.4.5.
3.4.5 Prognostic Model Validation and Evaluation
Prognostic Model Validation
The key aim of a classification task is to map each element of a dataset to its
corresponding class amongst a number of possible ones. Logistic regression al-
gorithm (as well as other supervised machine learning techniques) infer a model
from labelled training data. The generated model is then evaluated on a separate
testing set, which provides an estimate of the accuracy of the model. A correct
estimation of the accuracy of a classifier (in this context, also referred as model
validation) is crucial both to predict its future predictive power and to choose
among a number of possible classifiers.
In the case of classification, if the number of data samples for training and
testing are limited , k-fold cross validation can be utilised to predict the error date
of a learning technique. In the k-fold cross validation, a full dataset is divided
randomly into k disjoint subsets of approximately equal size, in each of which the
class is represented in approximately the sample properties as in the full dataset
[92]. The process of k-fold cross validation works in the manner as follows:
1. Training and testing will be repeated k times on the k data subsets, using
k-1 partitions as the training set and the renaming partition as the testing
set.
2. The classification error of this iteration is calculated by testing the classifi-
cation model on the holdout set. Finally the k number of errors are added
up to generate an overall error estimate. The most commonly used value
of k = 10, which is the number of folds to obtain the best estimate of error,
and e theoretical evidence also backs this value of k=10 [92].
The “leave one out cross validation” (LOOCV) is simply n-fold cross valida-
tion, where n is the number of samples in the full dataset. In LOOCV, each
61

sample on its turn is discarded out whilst classifier is trained on the remain-
ing n-1 data samples. Classification error for each iteration is determined
on the class prediction for the holdout sample’s success or failure. LOOCV
utilises greater amount of data samples for training in each iteration and
involves no random shuffling of samples.
Prognostic Model Evaluation
There are several approaches for the evaluation of classification performance. The
most commonly used evaluation measure is the confusion matrix. A confusion
matrix is also referred to as a contingency table or an error matrix This matrix
visualizes the classifier’s output in terms of representing the patterns in the clas-
sified class, while each row contains the patterns in the actual class. The overall
evaluation of classifier performance is usually delivered by two characteristics:
the weighted accuracy and unweighted accuracy. These two characteristics are
identical only when all testing classes have the same number of data patterns.
The unweighted accuracy can be calculated as
Awa =100Ncor
Np
(3.1)
Where Ncor is the number of correctly classified data patterns of all classes
and Np is the total number of data patterns.
The weighted classification accuracy is denoted by
Auw =100
C
C∑c=1
N ccor (3.2)
Where N ccor is the number of correctly classified data patterns of class c and
C is the number of classes.
In binary classification scenarios are most commonly used in healthcare prog-
nostic modelling, the subjects are classified into two classes: positive and negative
[60].
The confusion matrix for binary classification is provided in Table 3.2.
62

Predicted ClassA B
Actual Class ATPTrue Positive
FNFalse Negative
BFPFalse Positive
TNTrue Negative
Table 3.2: Confusion matrix for two-class classification problem.
From the confusion matrix in Table 3.2, the true positive (TP) and true
negative (TN) are the correct classifications in samples of each class. A false
positive (FP) is when a class B sample is incorrectly predicted as class A sample;
a false negative (FN) is when a class A sample is predicted as a class B sample.
Each element of a confusion matrix shows the number of test samples for which
the actual class is the row and the predicted class is the column. The error
rate can be calculated as FP+FNTP+TN+FP+FN
.The error rate is a measurement of the
overall performance of a classifier; however a lower error rate does not necessarily
mean better performance, for example in the case of imbalanced datasets, 10
samples in class A and 90 samples in class B. If TP = 5 and TN = 85, then FP
= 5, FN=5, the error rate in this case is only 10%. However in the case of class
A, only 50 % of the samples are correctly classified. There are a number of other
evaluation metrics which can be utilised to correctly evaluate the classification
results without any bias.
1. Sensitivity or Recall measures the proportions of samples in class A which
are correctly classified as A. It is calculated as
True Positive Rate (TPRate) = TP(TP+FN)
2. Specificity measures the proportion of samples in class B which are correctly
classified as class B. It is calculated as
True Negative Rate (TNrate) = TN(FP+TN)
3. False Positive Rate (FPRate) = FP(FP+TN)
= 1− Specificity
4. False negative rate (FN Rate) = FN(TP+FN)
= 1− Sensitivity
63

Figure 3.5: A sample ROC curve. The dotted line on the 45 degree diagonal isthe expected curve to show that the classifier is making random predictions.
5. Positive Predictive Value(PPV) = TP(TP+FP )
, also known as precision, which
measures the proportion of the claimed class A samples are indeed class A
samples.
In classification tasks, higher TP rate normally co-exist with higher FP rates
and the same is the case with the TN and FN rate. The receiver operating
characteristic (ROC) curve is used to characterise the trade off between TP rate
and FP rate. The ROC curve shown in 3.5 plots TP rate on the Y axis against
FP rate on the X axis. With an ROC curve of a classifier , the evaluation metric
is the area under the ROC curve. The larger the area under the curve (the more
closely the curve follows the left-hand border and the top border of the ROC
space), hence more accurate the test.The ROC curve for a perfect classifier has
an area of 1.
64

3.4.6 Online Clinical Prognostic Model
The next stage in the prognostic model development (as shown in Figure 3.4) is
to get these novel prognostic models incorporated as part of the clinical workflows
for primary and secondary care clinicians in the UK and US. This objective is
reached through the implementation of cardiac chest pain and heart disease prog-
nostic models as online clinical prototypes. These online clinical risk assessment
prototypes are used for the clinical validation and evaluation purposes by consul-
tant cardiologist, Professor Stephen Leslie from Raigmore Hospital and Professor
Warner Slack from Harvard Medical School as well as primary care clinician (GP)
from Edinburgh who utilised heart disease prognostic models for clinical trials us-
ing real patient data. These online prognostic models could be used to collect
new data for further research work and could to be used with an online training
algorithm to improve performance of existing models and to optimise machine
learning inputs. These online prognostic models have been developed using PHP
scripts to acquire patient data and HTML front end was developed to provide
the risk score.
3.5 Conclusion and Discussion
In this chapter, we proposed a novel ontology and machine learning driven hybrid
clinical decision support framework for cardiovascular preventative care. The key
components of the proposed framework are (1) Ontology driven clinical risk as-
sessment and recommendation system (ODCRARS) and (2) The Machine Learn-
ing Prognostic System (MLDPS). The key components are developed in close
collaboration with cardiologists from UK and US hospitals. Clinical question-
naires encoded in the ontology driven cardiovascular risk assessment and recom-
mendation system were written by Professor Warner Slack from Harvard Medical
School in the US. The machine learning driven prognostic models for the cardiac
chest pain and heart disease are developed in collaboration with primary and sec-
ondary care clinicians.These prognostic models could help clinicians reduce load
on overly prescribed angiography treatments in a cost effective manner. Details
65

of development, design and validation of the key components will be provided in
chapter 4 and 5.
The proposed framework will also pave the way for the development of cost
effective and patient centric preventative care solutions for chronic diseases with
high mortality rates, such as breast cancer and diabetes. These chronic dis-
eases could be largely preventable through close partnership among healthcare
providers, commercial partners and researchers working in the healthcare infor-
matics domain towards developing innovative doctor-patient based interactive col-
laborative care solutions. The proposed framework will facilitate development of
the next generation commercial clinical decision support systems with a learning
capability based on machine learning (for information exchange among key com-
ponents for risk calculation for cardiac chest pain and heart disease conditions).
This could be utilised by primary and secondary care clinicians in the UK and
US as a cardiovascular preventative care solution. The proposed novel ontology
and machine learning driven hybrid clinical decision support framework exploits
both (ontology and machine learning driven) approaches. Our proposed frame-
work combines both clinical expert’s knowledge (encoded in the knowledge-based
ODCRARS) and evidence-based/data driven MLDPS in an intelligent manner
to deliver an effective, holistic and cost effective cardiovascular preventative care
solution.
66

Chapter 4
Ontology Driven Clinical Risk As-sessment and Recommendation Sys-tem (ODCRARS) for Cardiovas-cular Preventative Care
Chapter 3 presented the proposed novel ontology and machine learning driven
hybrid clinical decision support framework for cardiovascular preventative care.
This chapter focuses on the design, development and clinical validation of the
ODCRARS.
The ODCRARS is developed in order to provide a cardiovascular preventative
care solution for primary and secondary care clinicians and patients. It provides
clinicians with a snapshot of a patient’s medical history in the form of patient
medical records, details of recommended lab tests and medication; provides rel-
ative and absolute cardiac risk scores; cardiac chest pain and heart disease risk
scores. This provides a holistic cardiovascular decision support as part of a triage
mechanism for primary and secondary care clinicians. The ODCRARS is de-
veloped under the close supervision of Consultant Cardiologist, Professor Calum
MacRae from Brigham and Women’s Hospital, Harvard Medical School and of
Clinical Informatics expert, Professor Warner Slack from Beth Israel Deaconess
Medical Centre, Harvard Medical School.
The detailed design, development and validation details of various compo-
nents of the ODCRARS which includes ontology driven intelligent context aware
67

information collection, patient medical records, patient semantic profile, ontol-
ogy driven clinical decision support including NICE/Expert driven clinical rules
engine components are provided in detail.
In the latter part, ontology driven clinical decision support which is imple-
mented through the recommendation ontology and NICE/Expert driven clinical
rules engine is presented. The development, design and validation of the recom-
mended ontology which utilises the patient’s semantic profile for the recommen-
dation of lab tests and prescription of medication is discussed in detail.
We also discuss development of the NICE/Expert driven clinical rules en-
gine and its utilisation in the cardiovascular risk scores calculation for various
cardiovascular diseases. It also helps to control the patient flow within the car-
diovascular preventative care solution. The outcome general cardiac risk score
calculation using the Framingham risk score calculator is also explained.
The integration of the machine learning driven prognostic models (cardiac
chest pain and heart disease prognostic models) is discussed at the end. These
prognostic models are developed using the machine learning driven prognostic
system, further details of the machine learning drive prognostic system (MLDPS)
will be provided in Chapter 5.
4.1 Implementation of the Ontology Driven Clin-
ical Risk Assessment and Recommendation
System (ODCRARS)
In chapter 3, we introduced a novel ontology and machine learning driven hybrid
clinical decision support framework for cardiovascular preventative care, this sec-
tion focuses on the design and development aspects of different components of
the proposed ontology driven clinician risk assessment and recommendation sys-
tem. The components of the proposed ODCRARS are chronologically numbered
in Figure 3.1 for explanation and clarity purposes.
The proposed ODCRARS aims to provide a cardiovascular preventative care
solution for primary and secondary care clinicians in the UK and US hospitals by
68

way of automating patient encounter with the physician where a standard panel
of health information including basic physiological parameters such as weight
or blood pressure and patient demographics information is collected to generate
their medical records. The doctor-patient interaction/interviewing mechanism is
mimicked using the ontology driven context aware information collection com-
ponent. The proposed ODCRARS recommends a number of lab tests (e.g. for
cardiovascular, diabetes, cholesterol and other common risk factors), potentially
additional evaluations such as an ECG or stress test and with the results sees
the consultant again, who, based on the results of the physical exam and the
laboratory tests often prescribe one of several classes of medications, e.g. an
aspirin, a statin, an ACE inhibitor or an Angiotensin receptor blocker. It also
provides cardiac risk scores for various cardiovascular diseases along with cardiac
chest pain and heart disease risk scores which are calculated through the evidence
based MLDPS.
We utilise ontology based approach in the development of ODCRARS. On-
tology driven approach offers several advantages over conventional software engi-
neering techniques, Firstly, our proposed ODCRARS is more convenient to up-
date as modifying the ontology layer can be done without the need for additional
and costly software engineering work. The clean separation between core system
functionalities and the knowledge base utilised by the system means that the lat-
ter can me modified should requirements or clinical expert’s knowledge change.
Secondly, the ontology layer enables the system to perform operations, such as
clinical decision support, which are cumbersome to implement using database
and distributed system technologies on their own.
The proposed clinical decision support framework as shown in Fig 3.1 could
thus be used for automatically conducting patient pre-visit interviews. It will not
replace a human doctor, but could be used as a triage system to prepare a patient’s
summary/doctor’s notes and pre-order appropriate tests by facilitating clinicians
to make better use of their consultation time in providing direct patient-centric
care.
The key components of the ODCRARS are as follows:
69

1. Ontology driven intelligent context aware information collection.
2. Patient Medical Records.
3. Patient Semantic Profile.
4. Ontology driven clinical decision support and NICE/Expert driven clinical
rules engine.
4.2 Ontology driven intelligent context aware
information collection: Design and Imple-
mentation
Computer based patient interviewing systems can help free up precious and lim-
ited resources, leaving clinicians with more time to fulfil their primary mission of
administering medical care. In addition, clinical histories collected through these
interviewing systems have proved to be more accurate than traditional nurse led
data entry sessions or face-to-face interviews [45]. A challenge remains however
in designing clinical questionnaires which are general enough to suit a majority of
patients, while at the same time, being able to capture critical individual infor-
mation. We propose a solution to this challenging issue with an ontology driven
context-aware, intelligent information collection system [56].
The proposed method permits to iteratively capture fine-grained information
with each successive step, should this information be relevant according to a
questionnaire ontology. A solution to the challenge of making the information
collection process quick and efficient for the majority of patients without sacrific-
ing completeness, is to develop an adaptive questionnaire. By adaptive we mean
a dynamic modification of the behaviour of the application (i.e. structure of the
questionnaire) in response to user interaction (context-sensitive self-adaptation)
[93]. Previous methods used to implement context sensitive adaptation in med-
ical questionnaire include, conditional branching and finite state machines [94]
[95] [96]. Limitations of these proposed methods include complexity, scalability
70

and lack of flexibility for system maintenance. The proposed method intends
to replicate the investigating behaviour exhibited by clinicians when presented
with items of information which may be a cause of concern or require further
clinical investigation. While the system has the potential to reduce the number
of questions and thus save time and costs for healthy patients, the emphasis is
rather on collecting more relevant information so that a well-informed patient
risk assessment can be performed.
4.2.1 Ontology Driven Intelligent Context Aware Ontol-
ogy Model
OWL is a highly expressive ontology language created as part of efforts surround-
ing the development of the semantic web [97]. It represents a domain knowledge
using formal semantics such as subsumption (hierarchical property inheritance),
equivalence, disjointness, union, intersection, etc. OWL comes in several sub-
languages. Using OWL-DL (Description Logic), the formal semantics expressed
in an ontology can be used by a reasoner to perform certain inferences on the on-
tology (classification or reasoning) and uncover relations which were not explicitly
asserted in the ontology. Figure 4.1 shows class hierarchies in a domain specific
ontology for the context aware intelligent information collection component. We
utilised the following notation : words starting with a capital letters refers to the
classes of the targeted ontology (e.g. Questionnaire).
Questionnaire Classes
We identified and extracted structural elements from a number of clinical ques-
tionnaires. The resulting subsumption is illustrated in Figure 4.1. The main
classes in the ontology are as follows:
71

Figure 4.1: The Ontology Driven Clinical Risk Assessment and RecommendationSystem’s Generic Clinical Questionnaire Ontology.
72

The Questionnaire : These classes comprises of various subquestionnaires,
which are a group of thematically related Question classes.Subquestionnaire classes
were identified using the description provided in Table 4.1.
Review Type Clinical symptoms Associated with the review
General ReviewFeeling sick, weight loss or gain, general state of health,sense of well-being, strength, ability to conduct usual activities,exercise tolerance
Dermatologic Review
Rash, itching, pigmentation, moisture or dryness,texture, dentures,mouth sores, hoarseness, changes in hairgrowth or loss,nail changes Breast lumps, tenderness, swelling
Head/ Neck/ Ear/ Nose /Throat &Oral Cavity Review
Headaches , light headedness, injury ,Vision,double vision, tearing,blind spots, pain,Nose bleeding, colds, obstruction,discharge
Pulmonary ReviewCough, blood cough, breathe pain,short breath or wheeze
Cardiovascular ReviewChest pain, short breadth, palpitations, swelling of the legs,calves pain
Abdominal Review
Difficulty in swallowing , pain in swallowing, heart burn ,abdominal-pain,appetite loss, nausea, vomiting, diarrhoea, constipation,bowel-habits, haemorrhoids etc
Gynaecological Review regular menses, pain with menses
Genito urinary review
Urinate frequently, urinate blood , urinate odour, libido ,swollen glands,idiosyncrasy, abdominal pain, heartburn, nausea,vomiting, recent changes in bowel habits
Psychiatric Reviewtremor, emotional problems, anxiety, depression,previous psychiatric care,unusual perceptions, hallucinations
Table 4.1: Questionnaire Types for the Review of the System
Questions : These classes encapsulate the necessary information to determine
the runtime behaviour of a questionnaire implementation. This information in-
cludes: the set of valid answers to a specific question, information on how to
display the question on the front end and a set of valid actions. As an exam-
ple, the User Interface should only allow system users to select one answer to a
73

“MultipleChoice” Question.
Question Type : These classes specify a list of subclasses which are question
types.The subclasses are Check Boxes, Simple Text, Multiple Choice etc question
types.
Answers :
Answer classes essentially mirrors the Question classes while encapsulating
information subtleties which can be critical in the clinical domain. Examples of
such classes are TrueInPastAndAtPresent (e.g. I am diabetic), FalseInPastAn-
dAtPresent (e.g. “I have never smoked),TrueInPastAndFalseAtPresent (e.g. “I
use to take this aspirin but not any more).Also patient’s answers and clinical facts
are encapsulated.
Questionnaire Completed : Every time a user completes a survey of the
systematic examination the system store a reference to his username and the
questionnaireId in the centralised database. This class was created to keep track
of how far the user has progressed in the systematic review.
4.2.2 Adaptive Clinical Questionnaire: Design and Imple-
mentation
After the development of an ontology driven clinical questionnaire which pro-
vides the metadata and questionnaire structure for the system implementation
of the ontology driven clinical risk assessment and recommendation system, we
utilised a novel decision tree approach for the system implementation of the adap-
tive clinical questionnaire part at the database level. The standardised clinical
questionnaires written by Professor Warner Slack have been utilised for the devel-
opment of an adaptive clinical questionnaire. Cardiovascular and family history
questionnaires were provided by the project’s clinical informatics expert, Profes-
sor Warner Slack from the Harvard Medical School. These questionnaires were
initially encoded in the Beth Israel deaconess medical centre’s patient portal sys-
tem to provide systematic clinical reviews for new patients. These questionnaires
were encoded in a proprietary clinical language called Mumps and then compiled
74

using a dedicated converse compiler before they were deployed in the teaching
hospitals affiliated with Harvard Medical School. It took a considerable amount
of time to parse these questionnaires manually by referring mumps and converse
manuals. The fundamental research problem of converting existing questionnaire
system based on static branching logic was addressed using a new intelligent
decision tree and rules-based approach, outlined below:
Minimize c (Questionnaire ) = g1, g2, gn
Where
� C: The number of users who attempt to answer a questionnaire.
� Gi: A group of questions for splitting questionnaire into further segments.
In order to meet usability constraints in the proposed system, a constraint
was set to restrict the maximum number of questions to display per page.
This may be formulated like: Size(G i) <= S Where S is the maximum
number of questions per page. The value of S in the ODCRARS is set to
5 for usability purpose. This can be customised as per the clinical needs of
the hospital.
4.2.3 Proposed Novel Decision Tree based Approach
The adaptive clinical questionnaire is designed by following the key design prin-
ciples/practices:
1. Splitting the clinical questionnaire into groups of equal size S.
2. Utilising >(greater than) operator to select appropriate questions from the
questionnaire tree.
3. Sorting the questions in the group i using the greater than operator.
4. Splitting the questions in the group i into parent and children questions.
5. Using the user’s answers provided through the front end, define the next
course of action/questions to follow.
75

Greater than operator between questions
In order to define the order in which clinical questions should appear on
the front end, a greater than operator is used to compare questions in the
questionnaire tree. Every questionnaire is represented like a tree. In Figure
4.2, a tree structure of the adaptive questionnaire is displayed.
Figure 4.2: Context Sensitive Questionnaire Tree Structure.
Some important design constraints in our proposed tree structure:
� Not all the nodes in the questionnaire tree are visited. For example, the
node 1.1.1 is only visited if a user chooses to answer question 1.1.
� A question may be triggered for one or more answers through their cor-
responding parent tree. For example, the question 1.2.1 is triggered by
answers b or c in question 1.2.
The greater than operation is defined as:
Q1 >Q2 if level(Q1) >level(Q2)
For example, question 1.2 .1 is greater than question 1.2 but question 1.3.1
will be equal to question 1.3.2
76

Figure 4.3: Tree Structure detail
In a group of questions i, the questions are split into two groups: parent and
children. The parent questions are displayed on page j but children questions
appear on the following page (j +1) at the front end. Using the user’s answers we
define the next questions to follow. Tree traversing part is based on a depth-first
algorithm. However, not all the nodes in the tree are visited, since the path to
follow will depend on the user’s response/ answers.
For example: If the user in question 1.1 chooses b, the node 1.1.1 becomes
unreachable since the flow will be directed to question 1.1.2 as demonstrated in
4.3. Then the node 1.1.1 will be marked as unreachable and their children will
become unreachable as well.
4.2.4 Dynamic Adaptation
The run-time dynamic behaviour of the adaptive questionnaire is shown in Fig
4.4 in which each step corresponds to a complete system iteration (full interaction
loop shown in 4.5). Question 1 (Q1) does not have any adaptive properties and
leads directly to Q2 irrespective of the answer (step 1 -2).Question 2 does have
adaptive properties, however the user input did not trigger a call for further
questions and thus also leads directly to the next question Q3 (step 2-3).In step
3-4, the answer to Q3 triggers the call for a further question. This additional
question (Q3.1) now resides on top of the questionnaire stack (next question to
77

appear on the front end). Finally, the answer to Q3.1 triggers the call for three
additional questions (Q3.1.1, Q3.1.2 and Q3.1.3). These additional questions
are now positioned on top of the questionnaire stack, in the order of priority
asserted in the questionnaire ontology.Depending on the adaptive properties of the
remaining questions, the process of adding further questions could be iteratively
repeated until the engine finally reaches the bottom of the questionnaire stack.
Figure 4.4: Stack implementation of the context-sensitive questionnaire.
The proposed method is robust, scalable, highly configurable and could be
utilised in non clinical projects as well. One of the main advantages of our
proposed approach is its relative simplicity: it has less than 50 classes and 30
properties, yet it permits the design of arbitrarily large and complex question-
naires.Figure 4.6 illustrates the architecture of our ontology driven intelligent
context aware questionnaire implementation.It comprises of three components:the
User Interface, the adaptive engine and the questionnaire ontology. The adaptive
engine’s key role is to interpret the structural, composition and adaptive proper-
ties asserted in the ontology and to invoke appropriate user responses to the user
input. The user interaction loop works as follows: the system initially prompts
the first question. Once the user has selected an answer, the adaptive engine
first check whether the current question is adaptive or not. If it is non adaptive
question, the system just prompts the next question in the list. If however the
current question happens to be adaptive, the given answer is then cross checked
against a list of potential answers. If a match is found, the system moves to new
78

question state. If no match is found, the next question in the list if displayed on
the front end. The interaction loop is repeated until there are no more questions
to be asked.
Figure 4.5: The Architecture of the Ontology Driven Intelligent Context AwareQuestionnaire.
4.3 Patient Medical Records
In previous sections, we described an ontology driven intelligent context aware
information collection to conduct patient interviews.The patient answers gath-
ered through patient interviews as shown in Figure 4.7 are utilised to generate
medical records containing patient demographics and clinical episodic informa-
tion which is stored in the centralised database. This information is utilised by
NICE/Expert driven clinical rules engine for the cardiovascular risk assessment
for various cardiovascular diseases. Figure 4.6, illustrates utilisation of patient
medical records through clinical rules engine.
79

Figure 4.6: The Architecture of the Ontology Driven Intelligent Context AwareQuestionnaire.
80

Figure 4.7: Answers collated during Patient’s System Review.
4.4 Patient Semantic Profile : Design and Im-
plementation
As highlighted by [98], a major challenge faced by healthcare information man-
agement systems is continuously evolving work processes and practices due to
emerging guidelines, advances in healthcare and organisational changes. The pa-
tient medical records stored in the centralised database as shown in Figure 4.6
81

have no longer any intrinsic meaning. This data can only be correctly used and
interpreted via surrounding software components used to input data and extract
data from the database. This means that even small structural changes to the
healthcare system will often require significant software engineering work. Up-
dating the system on clinical sites will generally cause delays and disruptions to
the service.
In the proposed ontology driven clinical risk assessment and recommendation,
the information collection based on an ontology creates the opportunity to simul-
taneously generate a patient profile automatically generated from the medical
ontology and thus to preserve the semantics of the information collected. This
information representation is what we describe as the Semantic level. The key
benefit of this approach is that a single information repository, a patient semantic
profile, can now provide a number of services to various sources like, providing an
input to a clinical rules engine, generating doctor notes/electronic patient sum-
mary and storing patient data in the third party patient data repositories like
Health Vault (in the US context) for data sharing purposes etc. This system
design provides greater flexibility in adding or maintaining software components
without affecting the whole structure of the system.
4.4.1 Ontology Development
The patient semantic medical profile is a formal representation of the informa-
tion collected during the system review process through ontology driven context-
sensitive intelligent questionnaire. The Patient Semantic Profile is developed in
OWL Protege through a domain specific ontology. The high level class design
was done with a view to transform patient medical records acquired in section
4.3 in OWL. The main classes in the ontology design are shown in Figure 4.8.
82

Figure 4.8: Patient Semantic Profile classes and visualisation in OWLVIZ Inter-face.
83

Object Properties and Data Properties
The object properties in Figure 4.9are defined in order to establish relationship
between individual classes. The properties are also referred as Roles or relations
in UML terms. The purpose of the data properties is to be able to define the
relationship between individual classes and the XML schema data type.Object
properties establish a relationship between specific classes in order to model the
desired behaviour specified in the clinical use cases.
Figure 4.9: Object Properties list in Protg-4.1.
Figure 4.10 illustrates a list of data properties. The patient referral process
is implemented using the object property “has chest pain type which binds the
specific pain type with the patient using “Patient and “Chest Pain Type Classes.
The XML schema data type comes from the data properties which describes
pain type as an enumerated type showing the values as “typical, atypical or non-
typical.“Has diagnosis done text object type describes the relationship between
“Patient and “General Medical Practitioner”, “Cardiologist and “RACPC text
classes. This relationship models the behaviour of diagnosis done at each stage
84

by the clinicians involved in the referral process.
Figure 4.10: Data Properties in Patient Semantic Profile ontology.
Ontology Results
Figure 4.11 shows the transformation of patient clinical history in OWL which
is developed using the Protege ontology editor. Many items of information
which could be clinically useful for clinicians are being represented using Boolean
clauses. The critical medical conditions are modelled using “ Has Presence and
Has Absence properties, this sort of clinical information is very useful for clin-
icians involved in primary and secondary care and without spending too much
85

Figure 4.11: Patient Semantic Profile developed in Protege OWL.
time they can get a snapshot of patient’s medical history for referrals procedures.
The purpose of providing patient clinical history in a semantic formulation, is to
lend clinicians a helping hand during clinical decision making process and also
to flag clinical complications/issues requiring urgent medical attention or further
examination by the clinical domain experts.
The details of important clinical information encapsulated in the patient se-
mantic profile is as follows:
Medical Condition
In cardiology clinic, the key information which is of critical importance for the
clinical decision making, before any diagnostic procedures could be followed is
to find out whether the patient in question ever had a heart attack or a heart
abnormality of any kind in the past. This information is even more critical,
specially in the pre-operative risk assessment before any surgical operation is
scheduled. This information is modelled in an ontology using has absence and
86

has Presence data types in Figure 4.11, examples are item 15 “has absence of
Cholesterol and item 6 “has presence of Acute Coronary Syndrome.
Qualitative Information
. The Qualitative information is also modelled in the OWL semantic profile. Def-
initions of different chest pain types can be asserted in the ontology for clarity
purposes.The purpose of collating this clinical information is to highlight exis-
tence and absence of certain medical conditions so that these clinical risk factors
could be taken into account during recommendation of lab tests or prescription
of medications. Qualitative information marked in item 11 in Figure 4.11 shows
patient’s perfusion scan result which in this case is “Normal”.
Cardinal Information
It is possible to express cardinal information (e.g. numbers and ranges) in an
OWL ontology using cardinal restrictions by expressing it in number and ranges so
that the information in the patient ontology remains self-explanatory. Therefore,
one needs to define unit classes. There are two types of cardinal restrictions you
can apply in OWL; these are referred as Temporal and Quantity units.Temporal
information is provided through the inclusion of data properties like “FalseinPast-
and-True-atPresent” and True-in-Past-and-True-in-Present etc. In Figure 4.11,
in item 8 shows patient’s age which “75” and the unit to interpret this value is
“Year”.
4.5 Ontology Driven Clinical Decision Support:
Design and Implementation
A usual cardiovascular consultation encompasses multiple encounters with the
physician. The patient meets the clinician where a standard panel of health
information is collected along with some basic physiological parameters such as
weight or blood pressure etc. The patient then undergoes a number of laboratory
tests (e.g. for diabetes, cholesterol and other common risk factors). The patient
meets the consultant again who, based on the results of the physical exam and
87

the laboratory tests, prescribes one of several classes of medications:
� An aspirin
� A Statin
� An ACE inhibitor
� An Angiotensin receptor blocker
The aforementioned procedure demonstrates that the patient spends a lot of
time and effort in trying to provide clinically relevant information through nurse-
led clinics. This problem stems from the fact that clinicians have to extract
a lot of unstructured information from patients before appropriate diagnostic
procedures can be followed which is why manual history taking is essential for
clinical decision making.
The ontology driven clinical decision support in item 4a, in Figure 3.1 is one
of the vital components of the proposed ODCRARS. It comprises of a recom-
mendation ontology and NICE/Expert driven clinical rules engine. The recom-
mendation ontology is developed using clinical rules written by the consultant
cardiologist. The key objective of the bespoke recommendation ontology is to
utilise relevant clinical information encapsulated in the patient semantic profile
(demonstrated in previous section 4.4), for providing an automated lab tests and
medication recommendation for cardiovascular patients.
4.5.1 Recommendation Ontology
Figure 4.12 shows the classes and subclasses view using the OWLVIZ interface in
Protege.
The main classes of this ontology are as follows:
Lab Tests Recommendation
These classes encapsulate the lab tests recommendation part and different cat-
egories of basic lab tests, HBA1C (to check whether diabetes is under control)
and TSH test (test to check whether the thyroid gland is working properly). The
88

Figure 4.12: OWLVIZ classes view of the Recommendation Ontology.
clinical rules encoded in this ontology for lab tests were provided by the clinical
domain experts. Definitions of these clinical rules are shown in Figure 4.13.
The recommendation ontology combined with patient data encapsulated in
the patient semantic profile recommends a series of lab tests as shown in 4.14,
keeping in view user facts which are recorded during the patient interviewing
process and stored in the centralised database.
Medication Recommendation
These classes are created in order to model the medication prescription part
through the utilisation of sub classes as shown in Figure 4.12. Clinical rules
for the automated medication prescription are encoded in the ontology, actual
definitions of these clinical rules are shown in Figure 4.15.
89

Figure 4.13: Clinical Rules for Lab Tests Recommendation.
Figure 4.14: List of Suggested Lab Tests.
90

Figure 4.15: Clinical Rules for Medication Prescription.
91

In the clinical prototype development stage, clinical rules encoded in the rec-
ommendation ontology are utilised by a Java based rules engine called jess. These
rules are asserted in the ontology using JessTab plug-in in Protege.
4.6 Clinical Rules Engine: Design and Imple-
mentation
Clinical rules engine is one of the most fundamental components of the OD-
CRARS.A clinical rule is the execution of a business action or a sequence of
business actions once a pre-condition has been met e.g.
if systolic blood pressure <diastolic blood pressure then alert user of
input error
Although clinical rules are not explicitly defined as an if condition then ac-
tion statement, it is easier to visualise them as such, as the mechanism behind
the condition statement (as shown above) and that of clinical rules is more or
less identical. The mechanism behind clinical rules is to provide an application
run-time sandbox i.e. a safe environment, for rapidly changing clinical require-
ments. This means that when a clinical rule changes, the knock-on effect to the
development of new code should be minimal and the re-deployment of the rule
should cause a minimum amount of disruption to the end user.
The clinical rules engine performs following key functionalities:
1. Controls the flow of patients through the step wise inquiry.
2. Cardiac risk assessment mechanism to calculate risk scores for various car-
diovascular diseases.
As it can be seen in Figure 4.16, there are three main stages to running a
clinical rule. The first stage is the actual invocation of the rule itself from a
specific location within the application. This stage assumes that there is enough
information available, specific to the clinical rule to use in the next stage. This
next stage is required to perform data gathering for the clinical rule. Data gath-
ered at this stage is used for defining rule conditions and possibly used in the rule
92

actions themselves. This data is then used in the execution of the clinical rules
and, once this has completed, the process can either return a result by extracting
specific data produced by the rule, as depicted in the Figure 4.16, or stop and
return directly to the invocation stage (where the rule actions have performed all
the required functionality).
Figure 4.16: Clinical Rules Execution Life Cycle.
4.6.1 Clinical Rules Data - Patient Fact Representation
The general mechanism for representing clinical rules data is through the use of
facts. Facts are a simple wrapper object used for any data value. As described
before, Jess rules work by pattern-matching on facts so it was imperative to have
some idea what the facts will look like. Just like a class in Java, to represent an
object and its properties as a fact in Jess, an unordered fact had to be declared
using the deftemplate command. Its properties could be represented by the pres-
ence of multiple slots. The patient fact played a central role for the rules engine
as most of the diagnostic rules would deal with it. The patient fact template
properties included their most important characteristics i.e. their gender, age,
93

ethnicity, body mass index, total cholesterol and HDL cholesterol. Most of the
other facts were represented as ordered facts. They were easier to work with as
they get implicitly declared by the Jess engine at runtime without the need for a
deftemplate command to be declared.
4.6.2 Jess: Java based Rules Engine
The expert shells like Jess shell provide an inference engine for a rules based
system and a customisable programming interface in Java to build reusable ap-
plications. It also provides a modular structure for an ever expanding set of rules
and their inference engine supports forward chaining based on a Rete algorithm.
jess is an expert shell which is developed to provide a convenient way for Java
applets and facilitate reasoning ability. The choice of Jess was mainly based on
its support for Java programming language and its extensive library. The expert
shell was found to be ideal for the system development as it provides greater
flexibility through its feature rich programming interface.
The representation of patient’s symptoms as highlighted in Table 4.1 are rep-
resented through a number of facts about a particular patient. These facts are
stored in the working memory of the rules engine. The working memory consists
of following facts:
� Temporary facts specifying information about patient’s health.
� Permanent rules representing clinical knowledge that concerns diagnostics
and lab tests recommendation. Each of the rules consists of premises, spec-
ifying constrains (e.g. Patient’s age or sex or symptoms or risk status) and
recommendations (suggested tests and treatments).
A series of patient facts are introduced into the working memory which char-
acterise the current health condition of a patient. This can be made clear by
seeing the following facts about patient’s symptoms and signs shown in Figure
4.17 and 4.18. We encode the knowledge from the patient review of the system
as shown in Figure 4.19 into a series of facts that contain the attributes related
to signs and symptoms within one particular review.
94

Figure 4.17: Patient’s basic details representation as a fact using the patient facttemplate.
There are a total of 96 patient facts which are used to represent different
clinical symptoms which are recorded during a patient’s system review. Using
these patient facts, a set of permanent rules could be derived to provide various
types of recommendations within the targeted system.
95

Figure 4.18: Patient symptoms and signs representation as facts.
96

Figure 4.19: Flow Chart Diagram for Review of the System Procedure.
97

4.6.3 Partitioning the Rules
A clinical recommendation system could potentially have hundreds of rules, there-
fore it is essential to partition the knowledge base into modules. The Jess rules
engine provides support for such a partitioning, it also provides a set of constructs
or rules to be grouped together while explicitly controlling the access of one mod-
ule from another. The Jess rules engine is also utilised for the control, execution
and activation of clinical rules.
They are divided into the following modules:
� User Facts Module
� Global Risk assessment Module
� Patient Flow Module
User Facts Module
Module Name in Jess : USER-FACTS
User facts module contains all the general health facts for the patients. It in-
cludes the patient fact and other facts that were collated during patient’s review
of the system. Every new patient in the system gets allocated a memory alloca-
tion for their user-facts to be stored in the centralised database, so that patients’
user facts are not mixed in the working memory. These facts are accessed from
the modules using a syntax like
USER-FACTS:: <Fact-Name >
The user facts module does not contain any rules, it is used to act more like
a repository to store patient facts.
Global Risk Assessment Module
Module Name in Jess : GLOBAL-RISK
The module contains facts and clinical rules for the calculation of the global
risk total points from a set of tables containing a score sheet for different risk
98

factors. Each row in tables is represented as simple fact and is initialised au-
tomatically using the deffacts command which allows these facts to be loaded
into the working memory when the rules engine starts. Then a pattern matching
technique was used to match those facts with patient facts from the user facts
module. This is further explained in detail in section 4.6.4.
Patient Flow Module
Module Name in Jess: PATIENT-FLOW
One of the key operations of the clinical rules engine is to implement the
patient flow structure, this is provided through a series of steps shown in Figure
4.20. Instead of using lookup tables for storing the logic to complete these step
wise process, the rules engine was a preferred choice as it offers greater flexibility
and the cost effective maintenance of clinical rules should they change. The
patient flow is split into 5 steps. They are as follows:
1. Complete a basic profile form
2. Complete review of the system (ROS)
3. Complete Medication and Allergy review
4. Complete Medical Details (Optional)
5. View Suggested Lab Tests
99

Figure 4.20: Flow chart diagram represents patient flow within the Recommen-dation system.
100

In this module, rules mainly deal with two facts - enable and complete. It acts
as a state machine by which the current state is determined by past states. Every
time a user completes one step, a fact (complete profile) is added to the working
memory which fires the rule for step 2 to fire enabling system- review. Rules with
higher salience take precedence, this provides a conflict resolution mechanism in
case two or more rules are to be fired at the same time as shown in Figure 4.21.
Figure 4.21: Rules for the first two steps to control Patient Flow.
Figure 4.22: Screenshot showing the first two steps in patient flow.
In the case of emergency situation, system halts are introduced to handle
patients who are diagnosed to have serious conditions and require the immediate
attention of the doctor.Two types of halts are introduced, visit-doctor in Figure
4.23 and complete- halt. Each halt rule contains a (declare (auto-focus true))
101

command which allows the activation of this rule even if module is not in focus.
Figure 4.23: Screenshot showing a visit-doctor halt.
102

4.6.4 Cardiovascular Risk Assessment
The clinical rules engine is utilised to provide a cardiovascular risk assessment
mechanism. Cardiovascular risk assessment is an essential part of primary care
therapy for cardiovascular patients. It is a simple tool that can enhance clinical
judgement, and improve the ability to educate and motivate patients. There are
several types of risk assessments for cardiovascular patients but the most suc-
cessful to date is based on the study conducted by the Framingham Heart Study
(FHS). Comprehensive risk assessments help General Practitioners to effectively
manage their patient’s cardiovascular disease (CVD) risk by providing a mean-
ingful risk level. There are several known risk factors that can contribute to the
increased risk among the patients. Over the last 40 years FHS has identified
these factors as shown in Table 4.2, presence of any of these clinical risk factors
have a cumulative impact on the build-up of cardiovascular disease (CVD). The
proposed cardiovascular preventative care solution provides a range of cardiac
risk scores calculation as shown in Figure 4.24 for the following cardiovascular
diseases:
1. Myocardial infarction (MI )
2. CVD
3. CHD
4. Death from coronary heard diseases (CHD)
5. Death from CVD
6. Stroke
The major risk factors include age, systolic and diastolic blood pressure, high
density lipoprotein (HDL) cholesterol, total cholesterol levels, smoking and dia-
betes. These details would either be entered by the patient or by an observer.
The expert system includes these risk assessment evaluation in order to provide
an efficient clinical decision support mechanism for primary and secondary care
103

Coefficients CHD MI CHD Death Stroke CVDCVDDeath
0.9145 3.4064 2.9851 -0.4312 0.6536 0.8207-0.2784 -0.8584 -0.9142 0 -0.2402 -0.434615.5305 11.4712 11.2889 26.5116 18.8144 -3.0385
Female 28.4441 10.5109 0.2332 0.2019 -1.2146 0.2243Log(age) -1.4792 -0.7965 -0.944 -2.3741 -1.844 8.237(log(age))2 0 0 0 0 0 -1.2109(log(age)Xfemale 14.4588 -5.4216 0 0 0.3668 0(log(age))2,X female 1.8515 0.7101 0 0 0 0Log(SBP) -0.9119 -0.6623 -0.588 -2.4643 -1.4032 -0.8383Cigarettes,(Y/N) -0.2767 -0.2675 -0.1367 -0.3914 -0.3899 -0.1618Log(total-C,+ HDL-C) -0.7181 -0.4277 -0.3448 -0.0229 -0.539 -0.3493Diabetes -0.1759 -0.1534 -0.0474 -0.3087 -0.3036 -0.0833Diabetes X female -0.1999 -0.1165 -0.2233 -0.6391 -0.3764 -0.2067ECG-LVH -0.5865 0 -0.1237 -0.8663 -0.3362 -0.2946ECG-LVH X male 0 -0.1588 0 0 0 0
Table 4.2: Prediction Equation Coefficients.
clinicians. There are two steps in the cardiovascular risk calculation process, in
the first stage, the outcome general risk score is calculated for the cardiac events
mentioned in the Figure 4.24. At the second stage more qualified risk scores
including corresponding relative and absolute risk scores are calculated for the
coronary heart diseases (CHD). The global risk scores can help clinicians find out
the clinical risk factors which are more significant in the outcome risk scores. On
the other hand, the relative risk provides an overall risk status relative to a low-
risk state. This information is useful for both clinicians and patients with view to
agreeing a strategy through introducing changes in the life style (dietary, exercise
etc) in order to lower their cardiovascular risk score for various cardiovascular
diseases.
104

Figure 4.24: Cardiac Risk Assessment Mechanism provided by the Clinical Deci-sion Support Framework.
105

Global Risk Score Calculation
To calculate the global risk score, the risk points as shown in Table 4.3 for each risk
factor (age, total cholesterol, HDL cholesterol, systolic blood pressure, diabetes,
and smoker) is matched to the score sheet values relevant to the patient. Then
the sum of the points is then to be matched with another score sheet containing
the relative and absolute risk estimates for both male as well as female patients.
On other hand the global risk score, relative risk and absolute risk are based
on matching inputted values to a range of tabular data. This makes it easier to
be implemented as a set of rules and hence implemented as a module within the
rules engine named GLOBAL-RISK. A row of the data was encoded as facts in
the module. Every row in the score sheet could be represented as facts which are
loaded at the start-up. These score sheets are based on the latest findings from
the FHS regarding CHD risks in men and women.
Clinical Fact Representation
(age-riskfactor (age 40 44) (risk-points 1 0))(t-chol-riskfactor (t-chol 0 168) (risk-points -3 -2))(hdl-riskfactor (hdl-chol 0 35 ) (risk-points 2 5))(systolic-bp-riskfactor (systolic-bp 0 120) (risk-points 0 -3))(smoker-riskfactor (smoker yes)(risk-points 2 2 )))Absolute and Relative risk Fact Representation
(absolute-risk (point 17) (gender female) (total-chd 27)(hard-chd 20))(relative-risk (gender male)(age 30 34)(low-risk-level 2)(point 7 6.5)(relative-risk-type red))
Table 4.3: Global Risk Score Calculation
Absolute and Relative Risk
The term relative risk represents the ratio of the incidence in the exposed pop-
ulation divided by the incidence in the unexposed population. The denominator
of the ratio can either be the average risk of the entire population or the risk
of a group devoid of risk factors. Both the absolute and relative risk can be
derived from the recently published risk score sheets . The Relative risk keys are
106

as follows:
1. Below average risk
2. Average risk
3. Moderately above average risk
4. High risk
The outcome specific risk calculation is based on a statistical model and is
based on a lot of complex mathematical calculations while the global risk score
calculation is based on a set of look up tables.
4.7 System Implementation: Integration of OD-
CRARS and MLDPS
The Interfaces utilised in the ODCRARS was initially worked on by Farnush et
al as part of an Msc project. The novel proposed framework aims to provide a
cardiovascular preventative care solution with a view to enhancing and speeding
up the clinician- patient consultation mechanism by allowing the patients to com-
plete a standardised clinical review of their current and past medical history prior
to their hospital visits. The proposed cardiovascular preventative care solution
was developed using three-tier architecture comprising of J2EE (middle tier),
JDBC and Mysql (server side) and HTML and CSS (client side) technologies.
Java servlets and JSP are used for the development of dynamic web pages. OWL
is used for the development of ontologies in the Protege ontology development
editor and Netbeans was used for the Java development work.
4.7.1 Patient Module
The proposed cardiovascular preventative care provides a dedicated interface for
patients to log into the system using the credentials provided by their relevant
doctors at the time of registration. It enables them to answer questions about
their past and current medical conditions to generate patient medical records.
107
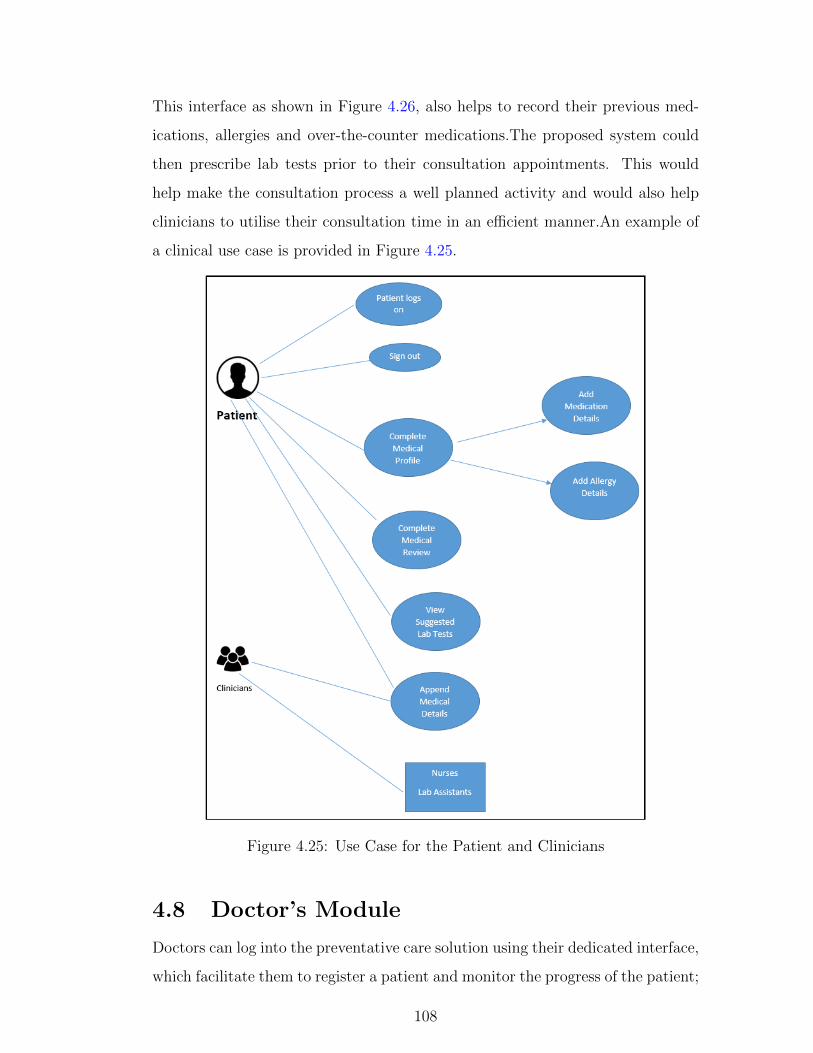
This interface as shown in Figure 4.26, also helps to record their previous med-
ications, allergies and over-the-counter medications.The proposed system could
then prescribe lab tests prior to their consultation appointments. This would
help make the consultation process a well planned activity and would also help
clinicians to utilise their consultation time in an efficient manner.An example of
a clinical use case is provided in Figure 4.25.
Figure 4.25: Use Case for the Patient and Clinicians
4.8 Doctor’s Module
Doctors can log into the preventative care solution using their dedicated interface,
which facilitate them to register a patient and monitor the progress of the patient;
108

it would alert the respective clinician once a patient’s medical profile is marked
as completed. This interface facilitates doctors to view patient’s medical records
and carry out cardiac risk assessment operations as explained in the cardiac risk
assessment Section 4.6.4. The system also provides an explanation of the sug-
gested lab tests for each patient and saves the results in the centralised database
provided by the proposed clinical decision support framework. An example of a
doctor clinical use case is provided in Figure 4.27.
Figure 4.26: Patients’ Interface.
For the purpose of validation and testing, various test patients were regis-
tered using the doctor ’s module as shown in Figure 4.27 which provides a pa-
tient registration facility for new patients. The project’s consultant cardiologist
provided a list of clinical rules (for lab tests recommendation etc) which were
109

Figure 4.27: Doctor’s interface.
encoded in the clinical rules engine. Patient data using the front end was gener-
ated in order to satisfy the clinical conditions which were specified in the clinical
rules, like patient’s age, gender, cholesterol, weight ,blood pressure levels etc.
Also patient data to test clinical conditions, defined through the clinical rules
for CHD(coronary heart disease) risk calculation for global, relative and absolute
risk scores) was added through the front end for validation purposes. A clinical
risk assessment was carried out after completing the review of the system for
these patients and results were cross-checked with the clinicians to ensure that
risk scores are in line with the expected outcome.
110
4.8.1 Integration of the ODCRARS with the machine learn-
ing driven cardiac chest pain and heart disease prog-
nostic models
In this chapter we have described design, development and validation of the
proposed ODCRARS. The proposed ontology and machine learning driven hybrid
clinical decision support framework is developed as a cardiovascular preventative
care solution for primary and secondary care clinicians in UK and US hospitals.
The ODCRARS is developed based on a clinical domain expert’s knowledge
(encoded in the form of clinical rules for lab tests and medication recommenda-
tions) and cardiovascular risk scoring systems (Framingham risk score calculator
again encoded in the form of rules and look up tables).
The MLDPS is developed based on evidence-based approach through utili-
sation of information extrapolated through real patient data repositories. We
utilised chest pain and heart disease clinical case studies for the development and
validation of the proposed MLDPS, and an additional case study in the breast
cancer domain is also utilised for the development and validation purpose. So it
can be noted that the clinical decision making in two key components is performed
based on two different information sources and development techniques.
We decided to combine clinical decision support results from both knowledge
based ODCRARS and non-knowledge based MLDPS with a view to providing a
holistic clinical decision support framework for clinicians.
We will discuss the development stages of the machine learning prognostic
system in chapter 5. In this chapter we provide a brief overview of the integration
process of the two vital components of the proposed framework.
The MLDPS is developed based on evidence based/data driven approach
which is why cardiac chest pain and heart disease prognostic models require
a series of inputs to perform the cardiac risk score calculation. Details of their
development will be discussed in chapter 5. These prognostic models are inte-
grated with a Java based cardiovascular preventative care solution using Java
server page (JSP), clinical variables required for the risk scores calculation are
111

passed on to cardiac chest pain and heart disease prognostic model as part of the
risk assessment load up operation.
These machine learning prognostic models have been developed under the
close supervision of clinical domain experts. The cardiac chest pain prognostic
model was developed under the close supervision of consultant cardiologist from
Raigmore hospital, the heart disease prognostic model was developed in collab-
oration with the general medical practitioner from NHS Edinburgh and Lothian
region. The clinical domain experts validated these prognostic models as follows:
Consultant Cardiologist utilised the cardiovascular preventative care solution
to carry out the risk assessment of the patient. He verifies clinical risk factors
information populated at the front end as shown in Figure 4.28. He clicks on
the clinical risk assessment button to see the cardiac risk scores for different
cardiovascular risk scores. He also verifies clinical information which is brought
up at the front end for the machine learning driven cardiac chest pain prognostic
system and clicks on calculate button to calculate the risk score as shown in the
figure. He gets a complete cardiac risk assessment profile for the patient.
112

Figure 4.28: Integration of ODCRARS and MLDPS.
4.9 Conclusion and Discussion
In this chapter, the design and development of the key components of the pro-
posed ontology driven clinical risk assessment and recommendation system (OD-
CRARS) is presented. An ontology driven approach (design and development
in Protege OWL) for the development of intelligent context aware information
collection and patient semantic profile components are explained in detail. We
demonstrated using an ontology for context-sensitive adaptation that the infor-
mation collection process can be tailored as per patients’ individual circumstances
113

and facilitates fine-grained information collection. Because of the clean-cut sepa-
ration between the questionnaire ontology and the implementation system, modi-
fying the structure and behaviour of the adaptive questionnaire now only requires
modifying the ontology. At the second step, we have argued that using a patient
ontology to model the information collected offers several advantages. Firstly
the semantics of the information collected are preserved and self-contained in the
ontology and thus remain interpretable regardless of surrounding technology and
software implementation. Then, the patient’s semantic medical profile can be
used to provide services to a number of software clients.
Also ontology driven clinical decision support operations based on recommen-
dation ontology (for the recommendation of lab tests and medication prescription)
as well as NICE/Expert driven clinical rules engine and its utilisation is explained
in detail. We demonstrated through the utilisation of a Java-based Jess rules en-
gine that a clinical expert’s rules can be utilised in a number of ways (through
partitioning of a clinical expert’s rules) to provide various types of recommenda-
tions for the clinicians. Cardiac risk assessment mechanism based on the clinical
rules engine was utilised for providing cardiac risk scores calculations for various
cardiovascular diseases. There are two parts for the risk calculations incorporated
into the system, one which calculates the outcome of general cardiac risk scores
for CHD, MI, CVD etc. while the other gives a more qualified risk score by giv-
ing a global risk score, corresponding relative risks and absolute risks of coronary
heart diseases (CHD).
114

Chapter 5
Machine Learning Driven Prognos-tic System (MLDPS) for Cardio-vascular Preventative Care
This chapter demonstrates the design, development and evaluation of the
MLDPS through clinical case studies in the cardiovascular domain. The Raigmore
Hospital’s RACPC (Rapid Access Chest Pain Clinic) and heart disease clinical
case studies are carried out in close collaboration with primary and secondary
care clinicians in the UK. An additional case study in the breast cancer domain
is also carried out for the development and validation of the proposed MLDPS.
In the RACPC clinical case study, we aim to improve the diagnostic and
performance capabilities of this specialised chest pain clinic, by reducing delay
and inaccuracies in the cardiovascular risk assessment of patients with chest pain,
also help clinicians effectively distinguish cardiac chest pain patients from those
with other causes of chest pain. The heart disease clinical case study concentrates
on attempting to distinguish heart disease patients from others with non-cardiac
symptoms. Additional clinical case study in the breast cancer domain aims to
help clinicians efficiently distinguish malignant breast cancer patients from others
with a benign condition.
In the beginning, the RACPC clinical case study which entails design, de-
velopment and evaluation of a novel machine learning driven cardiac chest pain
prognostic model is explained. Additional two clinical case studies in the heart
disease and breast cancer domains for the development and validation purposes
115

are explained. Also, implementation details of online clinical prognostic models
are provided. In the end integration of the cardiac chest pain and the heart
disease prognostic models with the ODCRARS is discussed in detail.
5.1 Case Study 1: Rapid Access Chest Pain
Clinic
In 2001, the National Service Framework for Coronary Heart Disease made a
commitment to have 50 rapid access chest pain clinics (RACPC) in England by
April 2001 [99]. These clinics were designed to allow direct access to cardiology
expertise without the need for accident and emergency assessment or admission
to a medical ward. Rapid access chest pain clinics (RACPCs) would appear to
be reliable and efficient to carry out the assessment of patients who are suspected
of angina and serious chest pain conditions [100].
5.1.1 Background
Rapid access chest pain clinics (RACPC) enable clinical risk assessment, inves-
tigation and arrangement of a treatment plan for chest pain patients without a
long waiting list. RACPC Clinicians often experience difficulties in the diagno-
sis of chest pain due to the inherent complexity of the clinical process and lack
of comprehensive automated diagnostic tools. To date, various risk assessment
models have been proposed, inspired by the National Institute of Health and Care
Excellence (NICE) guidelines to provide clinical decision support mechanism in
chest pain diagnosis.
At Raigmore Hospital’s RACPC, there are several stages being followed in the
management of patients with suspected cardiac chest pain. The initial assessment
should determine if it’s likely that this patient is describing chest pain of a cardiac
origin. This requires knowledge of the clinical history and risk factor profile of the
individual patients. There are several algorithms that can be used to assess the
most significant risk factor responsible for the disease outbreak. The algorithm
used in the recent NICE guideline is based on the age, gender, risk factors and
the typicality of the chest pain.
116

RACPC Clinical Guidelines
Several clinical guidelines exist for the administration of patients in the specialised
chest pain clinic at Raigmore Hospital’s RACPC. NICE recently made available
standardized guidelines to ensure clinical governance for the management of re-
cent onset chest pain [101]. However, producing clinical guidelines is not sufficient
and implementation of guidelines presents a significant challenge. Several barri-
ers to implementation of guidelines exist throughout the patient pathway, from
problems with delayed referral, limited access to specialists and to specialist tests
and rationing of some treatments. It remains difficult to ensure that all health
care professionals are aware of new guidelines and implement them. This results
from ever increasing demands on health care professionals time and increasingly
complex treatment regimes for patients. This is a particular problem for general
and primary care physicians who are required to maintain a breadth of skills and
knowledge base in a number of areas of medicine.
RACPC Diagnostic Tests
A resting ECG should be performed promptly in all patients complaining of
chest pain. In order to further assess the patient further there are a range of
available diagnostic tests including non-invasive functional testing such as exercise
ECG, stress echocardiography, myocardial perfusion scanning, and stress MRI or
anatomical testing such as CT coronary angiography or conventional diagnostic
coronary angiography. Which test used will depend on each individual patient
but also in part the relative availability at a local level.
RACPC Treatment
RACPC treatment usually involves medication but may also involve more invasive
strategies such as coronary artery stenting and coronary artery bypass surgery.
The timing of treatments and the need for invasive treatments such as stenting
or coronary artery bypass grafting requires to be assessed on a case by case basis
and decision making can be complex.
117

5.1.2 Aims
Rapid access chest pain clinics have improved diagnosis of incident angina for
those with high risk of cardiovascular disease, but misdiagnosis rates are high and
a recent study showed that a third of all cardiac events in subsequent follow-up
occurred in those diagnosed with non-cardiac chest pain. Three clinical datasets
are utilised in this clinical case study. The first clinical dataset comprises of 632
patients (male: 348, 55 % of male, female: 45%; median age 61 years) attending
rapid chest pain clinics (RACPC) at Raigmore Hospital between July 2009 and
September 2011.
The second clinical dataset comprises of 608 patients evaluating 23 clinical
variables. This data set contained a significant number of missing items which
were estimated using the Expectation- maximisation and mixture modelling tech-
niques.
The third clinical dataset was put together in light of feedback received regard-
ing results achieved with the first two datasets. As per clinical domain expert’s
recommendation, clinical lab results were taken out of the final dataset as a sep-
arate dataset with a view to compare the classification results with and without
clinical variables representing the lab test results.
The RACPC datasets for this clinical CASE study had to be extracted through
five separate clinical databases stored on three separate programs on the NHS
distributed computer systems. Missing data was handled by accessing the clinical
databases and doctor notes were utilised on an individual basis.
The key aims of this clinical case study are to help improve the diagnostic per-
formance of RACPC, specifically from the clinical decision support perspective.
The study cohort (first clinical dataset) comprises of 632 patients suspected of
cardiac chest pain. A retrospective data analysis of the clinical studies evaluating
14 clinical variables (risk factors and patient demographic data) was carried out
to develop cardiac chest pain specific clinical predictive models to help RACPC
clinicians effectively distinguish amongst cardiac and non cardiac chest pain pa-
tients. The second study cohort comprises of 608 patients was utilised for the
118

missing data estimation and classification work.
The third study cohort comprises of 632 patients focussed on comparing clas-
sification results with and without lab tests results to see their impact on the
overall clinical decision making.
The prognostic model development process explained in chapter 3 was fol-
lowed in the RACPC clinical study towards developing machine learning cardiac
chest pain prognostic models. The prognostic model development process is also
utilised in the heart disease and breast cancer clinical case studies.
5.2 RACPC Clinical Dataset 1
5.2.1 Data Acquisition
The data acquisition phase was carried out under the close supervision of con-
sultant cardiologist from Raigmore Hospital in Inverness, study cohort included
details of patients who attended the RACPC clinic, details of therapeutic inves-
tigations they underwent along with final diagnoses and treatment they received.
In the data acquisition stage, patient data was manually extracted through var-
ious database servers; excel spreadsheets and where required doctor notes were
taken into consideration to complete the retrospective data analysis of each pa-
tient. The acquired data were then normalized and held in a dedicated Ms Access
database for further data analysis.
Patient information resided on a number of dedicated clinical databases in
Raigmore hospital, as shown in Fig 5.1, which is why RACPC patient data
had to be extracted manually from five separate clinical databases. CT an-
giogram and myocardial perfusion scintigraphy information was stored on sep-
arate databases using the Radiology Information System (RIS). Data for exercise
tests and RACPC appointments was also in separate databases, but on the Tom-
cat (Phillips CVIS R6.1L1-SP1 2010) system. Information on invasive angiograms
and percutanious coronary intervention was stored in a single database on the
Minerva (version 98 Scot 6.2) system. This information was taken from the sepa-
rate sources and pooled into one Excel spreadsheet on the NHS computers within
119

the cardiology department in Raigmore for further processing.
Figure 5.1: Data Acquisition Stages - Raigmore Hospital’s RACPC Databases.
5.2.2 Data Preparation
After manual data extraction procedure, many repeat subjects were identified
in the accumulated dataset. This method produced many repeat patients, as
each consecutive attendance at a single service was entered as a new subject.
There was also a significant amount of missing data which had to be entered
individually into the data set. There were also some cardiac investigations which
occurred before or many months after attendance at the RACPC. These tests
which were not related to the RACPC clinic also needed to be removed from the
final dataset.
In the data cleansing stage, redundant patient data was removed without
120

losing any clinical relevant information on the subjects and missing data values
were populated by accessing the databases and using doctor notes. Any tests
which were performed before attendance at the RACPC, or more than 6 months
after the clinic were deemed not to be related to the clinic and were removed
from the data. A record was kept of all tests removed, so that no data was
permanently lost. Each patient was allocated a unique study number and all
patient identifiable information was removed from the dataset to ensure patient
confidentiality.
Normalisation
Normalisation process involves transforming the data to fall within a common
range such [-1, 1] or [0.0, 1.0]. The term standardise and normalisation are
used interchangeably in data pre-processing. Normalising the data attempts to
give all clinical variables an equal weight. It is often useful for classification
algorithms involving neural networks or distance measurements such as nearest-
neighbor classification and clustering. In our clinical case study we exploited the
mostly commonly used z-score normalisation (zero mean normalisation) method,
it converts all variables to a common scale with an average of zero and standard
deviation of one.
Candidate Clinical variables
A number of features were preselected through prior and ongoing consultations
with the consultant cardiologist from Raigmore Hospital. We mutually identi-
fied 14 clinical variables as shown in Table 5.1 containing patient demographics
and lab test results information. We also retrospectively completed episodic data
analysis of 632 patients using Microsoft Access database for sanity checking pur-
poses.
Pre-processing
In the preprocessing stage, free text and categorical data values are transformed
into numeric values for further processing. We carefully selected Non cardiac
symptom as one of the major classes which is also set as the target result. As it
121

Features/Risk Factors Targets/Final Diagnosis
AcronymNumber ofPatients
1 Smoker SMR Acute Coronary Syndrome 92 Number of Cigarettes NOC Angina 2743 Number of Years Smoked YOS Arrhythmia 114 Age AGE Declined Investigation 45 Pathway PWY GI Pain 396 Sex SEX Heart Failure 27 Diabetes Type DAB Syndrome X 58 Hypertension HPT Valve disease 39 Raised Cholesterol CHL Myocarditis 110 Initial Assessment INA Non Cardiac Symptoms 28411 ETT Result ETT12 CT Result CT Total patients 63213 MPS Result MPS14 Angio Result ANG
Table 5.1: Clinical Variables Selected for the RACPC Clinical Case Study.
can be seen in Table 5.1, there are a number of target values/classes with minimal
amount of patients associated with them such as Myocarditis, Syndrome X, Heart
Failure etc. which is why we decided to work with only two major targets,
namely Non Cardiac Symptoms (with 284 patients, also the control group)) and
Angina (comprises of 274 patients). We considered this as a binary classification
problem focusing on Non Cardiac Symptoms (0) and Cardiac related symptoms
by merging all of the cardiac related classes into 1 class.
5.2.3 Missing Data Handling
Raigmore Hospital’s Rapid Access Chest Pain Clinic (RACPC) is a nurse-led
paper based clinic. Many patients had no information available for patient de-
mographics, smoking and diabetes status. Intranet databases were accessed to
retrieve this missing information and hard copies of their notes were requested to
fill in missing information. A large number of patients still had no information
available for some of the key clinical variables. Patient data in this case was miss-
ing completely at random (MCAR) and missing values were replaced using mean
values. Expectation-Maximization (EM) techniques and mixture modelling algo-
122

rithms are also utilised for the estimation of mixture components and for dealing
with the missing clinical data of chest pain patients.
5.2.4 Feature Selection
Forward selection (FS), Backward selection (BS), mRMR (minimum redundancy
and maximum relevance), SFFS (sequential forward floating selection) and P-
Value feature selection methods are utilised in our experimental setups. Expert
driven technique based on pre-selection of variables by the clinical domain expert
is also compared with state of the art feature selection techniques for the data
classification purpose. FS, BS and SFFS algorithms choose the best features in
an iterative manner. Forward selection begins with no variables selected (the
null model). In the first step, it adds the most significant variable. At each
subsequent step, it adds the most significant variable of those not in the model,
until there are no variables that meet the criterion set by the user. Backward
selection begins with all the variables selected, and removes the least significant
one at each step, until none meet the criterion.
mRMR selects clinical variables on the basis of high correlation to the clas-
sification variable. The correlation is this case can be replaced by the statistical
dependency between clinical variables. The mRMR is an approximation to max-
imising the dependency between the joint distribution of the selected features
and the classification variable. SFFS is similar to the forward selection (FS)
technique, it also works in an iterative manner and starts with an empty set of
features. However, features selected after each iteration are removed one by one.
If the removal of any feature results in increasing the classification accuracy, then
the corresponding feature is permanently discarded from the feature set. This
approach guarantees that the final set does not contain correlated features. In
the case of P-value feature selection, clinical variables sorted (p-values obtained
from t-test) in order of their significance are utilised for the data classification
work.
123

5.2.5 Prognostic Model Development: Experimental Se-
tups and Results
For the purpose of this clinical case study, Logistic Regression (LR), Decision Tree
(DT) and Support Vector Machine (SVM) classifiers were utilised for prognostic
model development combined with feature selection techniques to identify the
best approach among them.
Clinical Variables Selection and Evaluation
The results for various experimental setups are reported in Table 5.2. The valida-
tion was performed by applying leave-one-out validation technique. The results
in 5.3 suggest that the decision tree based classifier combined with forward se-
lection (DT-FS) gives the best performance in terms of Matthew’s correlation,
recall, weighted accuracy and Unweighted accuracy. The ROC curves for all sug-
gested setups are illustrated in Figure 5.4. As the best performance was achieved
by Decision Tree combined with Forward Selection setup. Evaluation criteria
are taken into account in order to make a fair comparison of methods under ex-
amination. These measurements are standards for assessing pattern recognition
and expert systems. The advantage of the Matthew’s correlation is that it takes
into consideration all elements of the confusion matrix (true, false positives and
negatives).
5.2.6 Final Diagnosis
Fig 5.2 illustrates the weighted classification accuracies in each iteration for dif-
ferent experimental setups. These results are also reported in tabular format
in Table 5.2. The highlighted cells in the mentioned table represent the most
significant features. For example, the highest classification accuracy for BS-LR
was achieved by using features from iteration 4 to 13 (starting with ”NOC” and
ending with ”ANG”). As it can be seen in the case of FS-DT, the highest classi-
fication accuracy was achieved using 6 features, only 4 of them were considered
because the difference in terms of classification accuracy was not statistically sig-
nificant. It can also be seen through statistics given in table 5.2 that the ANG
124

and INA features are common among all experimental setups. It is also evident
that the ”CT Scan Result” appears to be relevant for FS-DT, BS-DT and BS-LR
methods.
Table 5.2 provides a comparative view of different experimental setups and
their results. Decision Tree and Logistic Regression models have been exploited
using Forward Selection and Backward selection techniques to help build optimum
models using the best feature set. As it can be seen clearly that the clinical risk
factors (highlighted in bold) like ANG (Angio Result) and INA (Initial Assess-
ment) are showing as significant among all four experiential setups which suggest
that the initial assessment of chest pain patients along with their Angio results
are the most important clinical risk factors in the risk assessment of RACPC
patients.
As per our comparative analysis of different machine learning techniques,
based on various experimental setups, patient’s ”Angio Result” and ”Initial Re-
sult” outcomes (as shown above) could be deciding factors for patient’s referral
through to the next stage of cardiac assessment. RACPC patients get referred
through different clinical pathways as per findings in each phase, there are exit
points in each stage for patients with non cardiac symptoms, patients with cardiac
related chest pain get referred through the clinical pathway called ” Presentation
Suggests Angina” for further clinical tests like ETT, Perfusion Scan and ETT,
followed by angiography for patients who are unable to do ETT or with abnormal
ECG (suspicious of CAD).
5.2.7 Evaluation of RACPC Results
In different experimental setups, training samples were used to build a learning
model while test samples are used to evaluate the accuracy of the model. During
validation, test samples were supplied to the model having their class labels “hid-
den” and then their predicted class labels assigned by the model are compared
with their corresponding original class labels to calculate classification/prediction
accuracy. If two labels (actual and predicted) of a test sample are found same,
then the prediction of that sample is counted as a “success” otherwise it is marked
125

Iteration FS-DT BS-DT FS-LR BS-LR1 ANG 64.7867 MPS 76.0240 INA 66.0596 ETT 74.34232 INA 71.7298 NOC 76.5198 AGE 67.8100 CHL 74.27763 CT 77.3454 CHL 76.8395 ANG 71.9423 DAB 74.42124 ETT 78.4341 SMR 77.1127 SEX 72.6789 NOC 74.45365 DAB 78.4341 ETT 77.1592 MPS 73.3831 MPS 73.89316 SEX 78.4604 DAB 76.8719 YOS 74.0550 SMR 73.30427 HPT 77.5943 YOS 73.6421 NOC 73.9113 HPT 73.81418 CHL 76.9650 AGE 75.0000 HPT 73.9902 YOS 73.67059 MPS 74.2492 PWY 77.3069 PWY 74.3099 CT 72.711310 NOC 73.9619 SEX 76.6270 ETT 74.3099 PWY 72.678911 PWY 76.3761 HPT 77.3454 CT 74.3099 SEX 71.942312 SMR 75.3379 CT 71.7298 SMR 74.4212 INA 68.174313 AGE 75.1153 INA 64.7867 DAB 74.1339 ANG 62.069014 YOS 75.1153 ANG CHL 74.1663
Table 5.2: Weighted classification Accuracies with common clinical variables(highlighted in bold) in each iteration.
Method Unweighted accuracyWeightedAccuracy
Precision Recall F-measureMatthew’sCorrelation
DT+FS 77.84% 78.46% 72.41% 85.13% 78.26% 0.5674%DT+BS 77.68% 77.34% 80.74% 79.15% 79.94% 0.5483%LR+FS 74.68% 74.42% 77.01% 77.01% 77.01% 0.4884%LR+BS 74.68% 74.45% 76.72% 77.16% 76.94% 0.4888%
Table 5.3: Classification results in terms of several evaluations.
as an “error”.
In Figure 5.3, a confusion matrix for two-class classification problem is pro-
vided. The true positive (TP) and true negative (TN) are correct classifications
in samples of each class, respectively. A false positive (FP) is when a class B
sample is incorrectly predicted as a class A sample; a false negative (FN) is when
a class A sample is predicted as a class B sample. Then each element of a con-
fusion matrix shows the number of test samples for which the actual class is the
row and the predicted class is the column. Thus, the error rate is just the number
of false positives and false negatives divided by the total number of test samples
(i.e. error rate = (FP+FN)/(TP+TN+FP+FN)).
The ROC curves for the initial experimental setups are illustrated in Figure
5.4. The dotted line of the 45 degree diagonal is the expected curve for our clas-
126

sifiers making random predictions. The best performance was achieved through
the utilisation of Decision Tree and Forward Selection experimental setup.
5.2.8 Results of Comparative Machine Learning Classifi-
cation
In the previous section, we presented data classification work (using the first
RACPC dataset) based on Logistic Regression (LR) and Decision Tree (DT)
classifiers combined with Forward Selection (FS) and Backward Selection (BS)
wrapping techniques. These classification techniques were selected as a result of
literature review conducted in chapter 2, which showed suitability/relevance of
LR and DT in supervised binary data classification problems, specifically in the
clinical domain. LR is popular among clinical domain experts due to its white
box approach which ensures transparency, so that the source and strength of
evidence could be fully disclosed to clinicians and other stakeholders.
LR is particularly useful in three of our clinical case studies as the target vari-
ables in all of our machine learning development work are binary i.e. dependent
variable can take the value 1 with a probability of success of success p, or the
value 0 with the probability of failure 1-p. The main objective of using LR is to
develop a regression type model relating the binary variable to the independent
variables. LR can also be used to examine the variation in the dependent variable
that can be explained by the independent variables to rank the independent vari-
ables based on their relative importance in predicting the target variable. LR is
also useful in determining the interactions effects among independent variables. It
predicts the value of the dependent variable and estimates the probability that a
dependent variable will have a given value. If the estimated probability is greater
than 0.5 then there is a high probability of the patient having the cardiac chest
pain.
LR is utilised as a base-line model in all of our clinical case studies and com-
pared with the DT and SVM based experimental setups. Decision tree is another
popular classification technique which is heavily used in clinical domain. Decision
trees are reliable and effective decision making technique which could provide a
127

simple representation of gathered knowledge with potential high classification ac-
curacy.The decision making process can be easily understood and validated by
clinical domain experts.
As we work with reasonably big datasets which is why SVM is utilised in order
to achieve good generalisation on our clinical datasets. SVM is basically logistic
regression with L2 regularisation and a slightly different loss function (SVM uses
hinge loss while logistic regression uses log loss). SVM maximises margin (Margin
= Distance of closest examples from the decision line/hyperplane) which is why
SVM is useful in building more robust models. Also kernel functions are already
implemented and well documented so they are far easier to use them with SVM.
So for these reasons, we decided to experiment with LR, DT and SVM combined
with various feature selection techniques for data classification purposes.
As part of this comparative machine learning classification analysis, the con-
fusion matrices for various experimental setups are provided in this section. Table
5.4 shows classification experimental setups based on LR combined with FS, BS,
Sequential Forward floating Selection (SFFS) and Minimum Redundancy and
Maximum Relevance (mRMR) feature selection methods. The confusion matri-
ces based on DT and SVM based experimental setups are provided in Tables 5.5
and 5.6.
Lets consider the confusion matrix illustrated in Table 5.4 of a binary classi-
fication problem. As per the statistics provided in this table, LR combined with
forward selection is the best experimental setup in terms of its classification ac-
curacy of 74.68 %. The true positive (268) and True Negative (204) are correct
classifications in samples of each class respectively. A False Positive (80) is when
a class B sample is predicted as a class A sample. A False Negative (80) is when a
class A sample is predicted as a class B sample. Then each element of a confusion
matrix shows the number of test samples for which the actual class is the row
and the predicted class is the column. Thus the error rate is just the number of
False Positive and False Negatives divided by the total number of test samples.
The Error Rate can be calculated as:
(FP+FN)/TP+TN+FP+FN)) 80+80/268+204+80+80 = 0.253
128

Predicted Output
Actual
LR+FS LR+BS LR+ED LR+SFFS LR+P LR+mRMRA 268 80 267 81 265 83 263 85 265 83 265 83B 80 204 79 205 79 205 78 206 79 205 79 205Accuracy 74.68 74.68 74.36 74.20 74.36 74.36
Table 5.4: Confusion Matrix of Logistic Regression (LR) based ExperimentalSetups.
Error rate is a measurement of overall performance of a classifier. To more
partially evaluate the classification results , other evaluation metrics are also
calculated based on LR+FS experimental setup shown in Table 5.4.
1. True Positive Rate ( TP Rate) = TP/(TP+FN), is also known as sensitivity
or recall which measures the proportion of samples in each class A that are
correctly classified as class A. In the case of LR+FS experimental setup,
sensitivity value = 0.770
2. True Negative Rate (TN Rate)= TN/(FP+TN), also known as specificity,
which measures the proportion of samples in class B that are correctly
classified as class B.
is calculated as 204/80+204 = 0.71
3. False Positive Rate (FP Rate) = FP/(FP+TN) = 1- specificity. is calcu-
lated as 1- 0.71 = 0.29
4. False Negative Rate (FN Rate) = FN/(TP+FN) = 1- sensitivity. This is
calculated as 1-0.71 = 0.23
5. Positive Predictive Value (PPV) = TP/(TP+FP) also known as precision,
which means the proportion of the claimed class A samples which are indeed
class A samples. This calculated as PPV = 268/268+80 = 0.770.
In the case of DT experimental setups as shown in Table 5.5, DT+FS
and DT+SFFS are the best experimental setups with highest classification
accuracies. The confusion matrix provides TP (252 and 280), FN(96 and
68), FP (44 and 67) and TN (240 and 217) rates along with a comparative
129

classification accuracies which are acquired through various state of the art
machine learning and feature selection techniques.
SVM+BS is the best experimental setup in terms of classification accuracy
as shown in Table5.6 with a lowest standard error (0.21) among all of three
classification setups. As it can be seen in all of the classification setups com-
bined with FS, BS, SFFS and mRMR feature selection methods, additional
P-value feature selection method is also utilised for the data classification
work. The P-values of the candidate variables are provided in Table 5.7.
The results of various feature selection based classification setups are also
compared with expert driven (ED) variable selection method. In the case
of ED feature selection, clinical variables pre-selected by clinical domain
experts are utilised for comparative machine learning analysis.
Predicted Output
Actual
DT+FS DT+BS DT+ED DT+SFFS DT+P DT+mRMRA 252 96 281 67 257 91 280 68 250 98 252 96B 44 240 74 210 64 220 67 217 63 221 62 222Accuracy 77.848 77.68 75.47 78.63 74.52 75
Table 5.5: Confusion Matrix of Decision Tree (DT) based Experimental Setups.
Predicted Output
Actual
SVM+FS SVM+BS SVM+ED SVM+SFFS SVM+P SVM+mRMRA 278 70 280 68 277 71 278 70 277 71 277 71B 68 216 69 215 74 210 73 211 74 210 74 210Accuracy 78.16 78.32 77.05 77.37 77.05 77.05
Table 5.6: Confusion Matrix of Support Vector Machine (SVM) based Experi-mental Setups.
Table 5.8 gives an account of the feature selection techniques which are utilised
in the RACPC clinical case study using three experimental setups based on
LR,DT and SVM. It is to be noted that in the case of DT+BS, DT+SFFS
and SVM+SFFS experimental setups, minimal amount of features are selected
to classify the patient data. In all of these experimental setups, clinical vari-
ables such as 14 (Angio Results), 10 ( Initial Assessment) and 12 (CT Result)
130

Clinical Variables P-value1. Smoker 0.0000 <0.00012. Number of Cigarettes 0.0000 <0.00013. Number of Years Smoked 0.0000 <0.00014. Age 0.0003 <0.00015. Pathway 0.0009 <0.00016. Sex 0.0057 <0.0017. Diabetes Type 0.0075 <0.0018. Hypertension 0.0300 <0.059. Raised Cholesterol 0.0599 <0.510. Initial Assessment 0.2359 <0.511. ETT Result 0.4010 <0.512. CT Result 0.4857 <0.513. MPS Result 0.5366 <0.114. Angio Result 0.7658 <0.1
Table 5.7: P-values of the candidate clinical variables.
were found common among some of the DT and SVM based experimental se-
tups. This means that using the initial assessment, CT Scan and Angio results,
clinicians will be able to diagnose cardiac chest pain patients with a classification
accuracy of 77.68 % which has been attained using DT+BS experimental setup.
At the same time, more transparent approaches like LR combined with BS wrap-
ping method requires 10 clinical variables to classify patient data with 74.68 %
classification accuracy. Due to imbalanced and limited RACPC datasets, high
classification accuracies (with low standard errors) could not have been achieved.
In spite of the data sparsity and missing data issues, we were able to achieve good
results through the utilisation of state of the art machine learning and feature
selection techniques. This clinical case study was carried out under the supervi-
sion of RACPC clinical domain expert, machine learning results were analysed
and way forward towards the development of online prognostic models (based on
transparent LR approach) was agreed among the project stakeholders. Details of
online RACPC prognostic models will be provided in the forthcoming sections.
The ROC curves for various experimental setups are shown in Figures 5.5 and
5.6.
131

RACPCCase Study
Experimental Setup Selected Features Accuracy1 LR+FS 10,4,14,6,13,3,2,8,5,11,12,1 74.682 LR+BS 1,3,4,5,6,8,10,12,13,14 74.683 LR+ED All 74.364 LR+SFFS 10,4,14,6,13,3 74.205 LR+P-Value 14,4,10,6,8,13,7,9,5,1,12,1,3,11 74.366 LR+mRMR 14,4,10,5,6,8,13,7,12,9,11,1,2,3 74.36
7 DT+FS 14,10,12,11,7,6 77.848 DT+BS 10,12,14 77.689 DT+ED All 75.4710 DT+SFFS 14,10,12,11 78.6311 DT+P-Value 14,4,10,6,8,13,7,9,5,1,12,2,3,11 74.5212 DT+mRMR 14,4,10,5,6,8,13,7,12,9,11,1,2,3 75.00
13 SVM+FS 14,10,12,6,11,5,4,13,9,3,8 78.1614 SVM+BS 3,4,5,6,8,9,10,12,13,14 78.3215 SVM+ED All 77.0516 SVM+SFFS 14,10,12 77.3717 SVM+P-Value 14,4,10,6,8,13,7,9,5,1,12,2,3,11 77.0518 SVM+mRMR 14,4,10,5,6,8,13,7,12,9,11,1,2,3 77.05
Table 5.8: Experimental Setups based on machine learning classifiers and featureselection techniques.
5.2.9 Analysis of Variance (ANOVA) Test for Performance
Evaluation
Anova is a statistical test which is used to compare three or more means to
ascertain whether there is a significant difference between these means or they
are all the same. ANOVAs are particularly useful in testing three or more groups
for statistical significance by minimising risk of committing a statistical type I
error [102].
In our example we compare classification accuracies, which are attained us-
ing three different classification setups based on Logistic Regression, Decision
Tree and Support Vector Machine (combined with feature selection techniques)
classifiers as shown in Tables 5.4, 5.5 and 5.6.
Table 5.9 is an Anova summary table which shows three groups showing num-
132

ber of count which is 6, it personifies number of iterations in each experimental
setup. The summary table shows averages and variances in each of our classifi-
cation setups.
Anova: Single FactorSUMMARYGroups Count Sum Average VarianceLogistic Regression 6 446.64 74.44 0.0384Decision Tree 6 459.14 76.52333333 2.990586667Support Vector Machine 6 465 77.5 0.34648
Table 5.9: Anova Summary Table - RACPC Classifiers Performance Measure-ment.
For the single factor Anova test, the Null Hypothesis is defined as follows:
H0 : µ1 = µ2 = µ3 (the means are all equal, hence the difference in means in
all of three experimental setups are all the same)
H1 :At least two of the means are different
α = 0.05
Table 5.10 shows Anova single factor test, it provides valuable information
which includes sums of squares, probability P-value, degrees of freedom (number
of groups -1 =2) and mean squares values. It works out the source of variation
among groups and within groups which in our case, are classification accuracies
within the same group and in comparison with other classifiers as well. The most
useful information in this table is the F statistic value. We now need to establish
whether this F statistic represents a significant value so that we could accept or
reject the null hypothesis. There are two methods to ascertain whether we could
accept or reject the null hypothesis.
In the first method, if the value of F statistic is greater than critical value of
F then we can safely reject the null hypothesis. Secondly, if the probability value
P is <0.05 than we can reject the null hypothesis.
As it can be seen in Table 5.10 the value of F statistic is 13.02 which is greater
than the critical value of F which is 3.682 so on this basis, we can reject the null
133

hypothesis. Also the p-value is 0.00005 which is less than 0.05 hence it can be
established that the difference in the means of classification accuracies is not
equal and classification accuracies achieved through three different experimental
setups (within individual groups and between other classifiers) are statistically
significant.
ANOVA
Source of Variation SS df MS F P-value F crit
Between Groups 29.31551111 2 14.65775556 13.02731474 0.000525374 3.682320344
Within Groups 16.87733333 15 1.125155556
Total 46.19284444 17
Table 5.10: Anova Test Results shows F static value, P-value and F critical value.
134

Figure 5.2: Graphical output of weighted classification accuracies using differentsetups.
135

Figure 5.3: Confusion Matrix for a binary classification problem.
0 0.1 0.2 0.3 0.4 0.5 0.6 0.7 0.8 0.9 10
0.1
0.2
0.3
0.4
0.5
0.6
0.7
0.8
0.9
1
False positive Rate
Tru
e P
ositi
ve R
ate
DT+BSLR+FSLR+BSDT+FS
Figure 5.4: ROC curves for different Experimental Setups.
136

0 0.1 0.2 0.3 0.4 0.5 0.6 0.7 0.8 0.9 10
0.1
0.2
0.3
0.4
0.5
0.6
0.7
0.8
0.9
1
False positive Rate
Tru
e P
ositi
ve R
ate
LR+EDLR+BSSVM+BSLR+FSDTS+SFFS
Figure 5.5: ROCs using different experimental setups, SFFS feature selection isalso compared.
137

0 0.1 0.2 0.3 0.4 0.5 0.6 0.7 0.8 0.9 10
0.1
0.2
0.3
0.4
0.5
0.6
0.7
0.8
0.9
1
False positive Rate
Tru
e P
ositi
ve R
ate
LR+EDLR+BSSVM+BSLR+FSDTS+SFFSDT+MRMR
Figure 5.6: ROCs using different experimental setups, mRMR feature selectionis added.
138

5.3 RACPC Clinical Dataset 2: Demonstrat-
ing Effects of missing Data on Verification
Results
Another clinical dataset collected as part of the RACPC clinical case study was
utilised in the RACPC clinical case study. This dataset contained a large number
of missing data items, patient demographics and lab tests details for majority
of the patients were found missing in this dataset. Doctor notes and patient
summary records were utilised where possible to complete patient records for this
clinical case study. In spite of huge number of missing data items, we decided
to utilise statistical machine learning techniques to estimate the missing data
components in the patient records with a view to learn from this patient data for
clinical decision making purpose.
In this section we highlight the problem of learning from incomplete real pa-
tient data acquired from Raigmore Hospital in Scotland, UK) from a statistical
perspective- the likelihood-based approach to deal with this challenging issue.
There are multiple benefits of our approach: to complement existing SVM (Sup-
port Vector Machine) techniques to deal with missing data within a statistical
framework, and to illustrate a set of challenging statistical machine learning al-
gorithms, derived from the likelihood-based framework that handles clustering,
classification, and function approximation from missing/incomplete data in an in-
telligent and resourceful manner. Our work concentrates on the implementation
of mixture modelling algorithms as well as utilising Expectation-Maximization
techniques for the estimation of mixture components and for dealing with the
missing clinical data of chest pain patients.
5.3.1 Background
In clinical information management systems, specifically patient records man-
agement systems often do not provide complete episodic information (pertinent
to each clinical scenario for individual patients) to the machine learning experts
139

RACPC Clinical Risk Factors1. SEX2. Diabetes Type3. HYPERTENSION4. RAISED CHOLESTEROL5. Not CAD Desc6. Ex-Smoker: How Many Cigarettes Per Day?7. Ex-Smoker: How Many Cigars Per Day?8. Ex-Smoker: Stopped How Many Weeks Ago?9. Smoker: How Many Cigarettes Per Day10. Smoker: How Many Cigars Per Day?11. Smoker: How Long?12. Gi Pain Desc13. Known CAD Desc14. Musculoskeletal Pain Desc15. Not Coronary Pain Desc16. ATTENDED Y/N17. NON CARDIAC Y/N18. ETT Y/N19. ANGINA Y/N20. FOR ANGIO Y/N21. PERFUSION SCAN Y/N22. CT23. ADMIT
Table 5.11: RACPC Features List after further Pre-Processing of Smoking freetext Description
[103]. For example, a cardiovascular decision support system may encounter many
partially recorded patient attributes, yet have to take into account missing data
for providing decision support utilities. Handling of missing data is still a greater
challenge for the machine learning experts working in different computational
intelligence projects all over the world. In this paper we evaluate the problem
of learning from incomplete data from a statistical machine learning perspective
inspired by work carried out in [104]. The goal of our research is two-fold: to
complement already developed SVM (support vector machine) models for disease
prediction and handling missing patient data using a statistical framework and
to further develop a set of novel algorithms that handle incomplete missing data
in an intelligent manner. For the purpose of review of the existing state of the
art, we also discuss function approximation, data classification and clustering
140

problems for large clinical datasets.
The statistical framework we further developed is based on existing work car-
ried out in [104]. Their work makes a clear demarcation among the environment,
which we pre-suppose to generate complete data, and the missing data mecha-
nism which renders some of the output of the environment unobservable to the
learner. The supervised learning problem consists of forming a map from inputs
to targets. The unsupervised learning process generally consists of extracting
some compact statistical description of the inputs. In both of these cases the
learner may benefit from knowledge of constraints both on the data generation
process (e.g., that it falls within a certain parametric family), and on the mecha-
nism which caused the pattern of incompleteness (e.g., that it is independent of
the data generation process). The use of statistical theory allows us to formal-
ize the consequences of these constraints and provides us with a framework for
deriving learning algorithms that make use of these consequences.
5.3.2 Pre-processing of Missing Data using Probability
Estimation
Feature 5, Smoking- Description in Table 5.11 contained free text data (doctor
notes), this feature was pre-processed in order to extract information about pa-
tient’s smoking history. This categorical feature was further broken down into
following features.
SMPNUM=length (smoketext); smokeattr=nan(SMPNUM,6);
IND EX CIGARETTE=1 1-Ex Smoker: How Many Cigarettes Per Day?IND EX CIGAR=2 2-Ex Smoker: How Many Cigars Per Day?IND EX TIME=3 3-Ex Smoker: Stopped How Many Weeks?IND SMK CIGARETTE=4 4-Smoker: How Many Cigarettes Per Day?IND SMK CIGAR=5 5-Smoker: How Many Cigars Per Day?IND SMK TIME=6 6-Smoker: How Long?
Patients belonging to each diagnosis category type are represented in Table
5.12. The Patient data utilised in this studies is imbalanced, most of the classes
(final diagnoses) did not have substantial amount of patient cases for data clas-
sification work.
141

Final Diagnosis Assessment Type Number of PatientsAcute coronary Syndrome 17New Exertional Angina 101Non-cardiac Symptoms 176Other 20Possible Exertional Angina 294
Total Number of Patients 608
Table 5.12: Final Diagnoses
5.3.3 Expectation Maximisation (EM) Approach
In order to utilize the missing/incomplete data effectively, we applied and ex-
tended the mixture probabilistic model appropriate for the given RACPC dataset
with missing values. We regarded the class label as a categorical feature of the
sample and estimated the joint distribution of the variables using the training
samples. Using the test sample we worked out its likelihood to estimate the
missing values in the given test sample. We assigned the estimated value to a
particular class keeping in view the maximal likelihood probability in which the
class label to be predicted was simply regarded as a missing data. In our data
classification problem, the features encapsulated in the RACPC dataset are trans-
formed into binary values (during the data analysis phase) which is why we have
implemented a model containing a mixture of several Bernoulli variables and a
categorical variable. We present the description of this mixture model as follows:
The data are assumed to be generated from a mixture of M densities, where
each component is a joint density composed of multiple Bernoulli variables and
a categorical variable. Since there are D = 17 binary features and C = 5
class labels, the model parameters for each (the j-th) component include 17
Bernoulli variables {µjd}17d=1 and a 5-dimensional categorical variable {νjd}5d=1,
where∑
y νjy = 1,∀j. Denoting the features are x = [x1 x2 . . . xD]> and the
label y, the probability of the occurrence of (x, y) is
142

P (x, y | µ, ν) =M∑j=1
P (ωj)P (x, y | νj, µj)
=M∑j=1
P (ωj)νjy
D∏d=1
µxdjd(1− µjd)(1−xd),
(5.1)
where ωj represents the j-th component of the mixture.
Then the log likelihood of the parameters given the data X = {(xi, yi)}Ni=1 is
l(µ, ν | X ) =N∑i=1
logP (xi, yi | µ, ν) (5.2)
Given any sample x, the likelihood P (x, y) for each class y = 1, 2, . . . , 5 is
calculated, and then the sample is assigned with the label corresponding to the
maximal likelihood.
Solving the EM Algorithm for Mixture Models
The parameters of the log likelihood (5.2) is usually intractable due to the loga-
rithm of the summation. In practice, the model is optimized by the Expectation-
Maximization (EM) algorithm.
To resolve the logarithm of summation, the binary indicator variables Z =
{zi}Ni=1 is introduced defined such that zi = [zi1 . . . ziM ] and zij = 1 iff (xi, yi) is
generated by the j-th density. Then the log likelihood can be written as
lc(µ, ν | X ,Z) =N∑i=1
M∑j=1
zij log[P (xi, yi | zi, µ, ν)P (zi)], (5.3)
which does not involve a logarithm of summation.
Denoting Q(µ, ν | µ(k), ν(k)) as the expectation of lc(µ, ν | X ,Z), then the
likelihood l(µ, ν | X ) can be maximized by iterating the following two steps:
E-step:
Q(µ, ν | µ(k), ν(k)) = E[lc(µ, ν | X ,Z) | X , µ(k), ν(k)]
143

M-step:
(µ(k+1), ν(k+1)) = arg minµ,νQ(µ, ν | µ(k), ν(k))
In the case where there exist missing data, the observation xi is divided into
(xoi ,xmi ) and the algorithm is rewritten as
E-step:
Q(µ, ν | µ(k), ν(k)) = E[lc(µ, ν | X o,Xm,Z) | X o, µ(k), ν(k)]
M-step:
(µ(k+1), ν(k+1)) = arg minµ,νQ(µ, ν | µ(k), ν(k)).
At the E-step, the expectation of zij is calculated over the observed part of
xi as
hij =νjyi
∏d∈Do
iµxidjd (1− µjd)(1−xid)∑M
l=1 νlyi∏
d∈Doiµxidld (1− µld)(1−xid)
,
where Doi is the indices of the observed part of the i-th sample, xid is the d-th
dimension of the i-th sample, and νjyi is the probability of that the label of a
sample from the j-th component is yi.
At the M-step, the parameters are re-estimated as
µk+1j =
∑Ni=1 hijxi∑Ni=1 hij
,
where hij is calculated from the E-step, and for the missing part hijxmi is replaced
with the expectation E[zijxmi | xoi , µ, ν] = hijµ
mj .
These two steps are repeated until convergence and we obtain the model of
this problem.
Given a test sample, the probability that this sample belongs to each class is
obtained from (5.1) and it is assigned to the class corresponding to the maximal
likelihood.
5.3.4 Experiments
We evaluated the proposed methods using the RACPC dataset (containing demo-
graphic and diagnostic features for 608 chest pain patients) by selecting different
144

parameters from the available samples. For the mixture density model, we re-
ported the results on a number of different carefully selected clusters. The SVM
(Support Vector Machine) classification and results were generated using differ-
ent kernel functions. In the experimentation phase, we divided the given RACPC
data into 5 subsets randomly. Then each random subset was selected as a test set
for testing purposes, while the remaining subsets were treated as training sets.
When the mixture model was used, we evaluated this method using a number
of different carefully selected components. The accuracies on each subset and
average accuracies are shown in Figure. 5.7.
5.3.5 Classification for the Incomplete Clinical Data
The objective of the classification task was to predict the final assessment of
the patients using the provided features extracted through the RACPC dataset.
These attributes/parameters were collected using a series of questionnaires used
in the nurse-led RACP clinics. The data for most of these patients (associ-
ated with diagnostic attributes) was found incomplete/missing in the RACPC
dataset provided by the Raigmore Hospital. As part of the data analysis work we
also ascertained (from the outset) that the conventional machine learning meth-
ods/techniques could not have been applied on the given dataset in its current
crude state which is why we had to implement the following two strategies to deal
with this problem.
5.3.6 Filling the Incomplete Data
The simplest and most efficient method to tackle the missing data problem to date
is through the deployment of a predefined strategy to fill the missing values in
the given dataset , followed by using a conventional/traditional machine learning
classifier approach to carry out the prediction of the desired label out of the
each available sample. Since the RACPC dataset utilised in this paper are in
binary state, we decided to make use of 1 to indicate the positive feature and -1
to personify the negative feature in the dataset. We then replaced the missing
features with zero values and exploited the one-vs-one support vector machine
145

model for the classification and prediction purposes.
After replacing the missing data values using the approach presented in Sec-
tion 5.3.6, we performed RACPC data classification using support vector machine
by utilising four different types of kernel functions including Linear kernel, Poly-
nomial, Radial basis function(RBF) and Sigmoid functions. For each kernel func-
tion, we selected the hyper-parameters using the cross-validation technique and
reported back our findings regarding the ones (selected for SVM classification)
yielding the optimal results. The results with different types of kernel functions
are shown in Fig. 5.8.
146

Figure 5.7: Upper figure: Multi-colour graph represents 5 randomly selecteddatasets in which 4 datasets were used for training and 1 for testing (for eachM). Lower figure: Experimental results showing average accuracies of differentnumber of mixture density models
147

Figure 5.8: Upper figure: Multi-colour graph represents accuracies obtained using5 randomly selected datasets in which 4 datasets were used for training and 1for testing for each different type of kernel function. Lower figure: Experimentalresults showing average accuracies of different types of kernel functions including:1- Linear, 2- Polynomial, 3- Radial Basis Function and 4- Sigmoid Function
148

5.4 RACPC Clinical Case Study: RACPC Clin-
ical Dataset 3
The consultant cardiologist from Raigmore Hospital after the clinical review of
first series of results (provided in the comparative machine learning classification
section 5.2.8) specified a revised clinical requirement to break original patient
dataset down into clinical risk factors and lab test results and create two new
study groups. The key clinical objective of this demarcation amongst clinical risk
factors and lab results was to evaluate the impact of classification results using
these two new datasets. So two new study cohorts were created for this purpose
as shown in Figure 5.13, so that a comparison could be drawn among two study
groups. Another clinical requirement was to compare the clinical effectiveness
of two models separately and to classify chest pain patients (predicting risk of
cardiac or non cardiac chest pain) purely on the basis of the risk factors and test
results information independently.
For the comparative analysis, the original patient dataset was distributed into
two study sets as follows:
Study Group 1Risk Factors
Study Group 2Test Results
1 Smoker Pathway2 No of Cigarettes Initial Assessment3 Number of Years Smoking ETT Result4 Age CT Result5 Sex MPS Result6 Diabetes Type Angio Result7 Hypertension8 Raised Cholesterol
Table 5.13: Clinical Risk Factors and Test Results in two study groups.
A detailed comparative analysis of some of the most sophisticated machine
learning classifiers combined with state of the art feature selection techniques were
utilised for data classification purposes. Experimental setups comprises of the Lo-
gistic Regression (LR), Decision Tree (DT) and Support Vector Machine (SVM)
classifiers combined with Forward Selection (FS), Backward Selection (BS), Se-
149

quential Forward Floating Selection (SFFS), P-value feature selection, Minimum
Redundancy and Maximum Relevance Feature Selection (mRMR) techniques
were utilised. The expert driven (ED) feature selection i.e. pre-selected clini-
cal variables by the clinical domain expert is compared with the state of the art
feature selection techniques.
5.4.1 Study Group 1: Clinical Risk Factors
In the study group 1, patient demographics including clinical risk factors are
included for the comparative analysis purpose. In the first stage (in line with the
proposed prognostic development process described in chapter 3), state of the
art machine learning classifiers and feature selection techniques are utilised. The
experimental setups used for this purpose are shown in the Table 5.14. Candidate
clinical variables preselected by the clinical domain expert were classified using
the LR, DT and SVM classifiers and results were compared with the state of the
art feature selection methods as shown in our experimental setups. The purpose
of expert-driven (ED) data classification was to develop a baseline model using
the LR classifier.
As it can be seen in Table 5.14, the LR based classification setups combined
with backward feature selection method (smoker,number of years smoking, age,
diabetes type and Raised Cholesterol) were able to classify the RACPC patient
dataset with a classification accuracy of 68.99% . Also, it is interesting to find
out that the DT combined with BS feature selection method classified the patient
dataset with a classification accuracy of 65.05% using just one feature, which is
patient’s age. The SVM combined with FS, classified the patient dataset with
a classification accuracy of 70.07% using patient’s age, sex and hypertension. In
the case of SVM (Linear Kernel Function), similar clinical variables were picked
up by the BS wrapping technique.
SFFS, is classed as a refined forward selection method, is also utilised in
all of our clinical case studies. Results of SFFS combined with LR, DT and
SVM, were compared with the BS, FS, P-value and mRMR methods to analyse
its effectiveness. The results of SVM+SFFS with a more transparent logistic
150

regression based model combined with BS, demonstrate that using three clinical
variables, patient’s cardiac chest pain can be distinguished (whether it’s cardiac
or non-cardiac). So performance complexity trade-offs can be considered if the
clinical support decision function requires higher degree of accuracy by comprising
on transparency of a clinical prognostic model.
Experimental Setup Selected Features Accuracy1. LR+FS 4,5,6,2,1,3 68.452. LR+BS 1, 3, 4, 5, 6, 8 68.993. LR+ED ALL 66.124. LR+SFFS 4, 5 ,6 67.925. LR+P-Value 4,5,7,8,6,3,1,2 66.126. LR+mRMR 4,5,7,6,8,3,1,2 66.12
7. DT+FS 4, 7, 8, 6, 2 65.418. DT+BS 4 65.059. DT+ED All 62.3610. DT+SFFS 4 65.0511. DT+P-Value 4,5,7,8,6,3,1,2 62.3612. DT+mRMR 4,5,7,6,8,3,1,2 62.36
14. SVM+FS 4,5,1 70.0715. SVM+BS 4,5,7 69.7116. SVM+ED All 68.4517. SVM+SFFS 4,5,1 70.0718. SVM+P-Value 4,5,7,8,6,3,1,2 68.4519. SVM+mRMR 4,5,7,6,8,3,1,2 68.45
Table 5.14: Study group 1 (Risk Factors)- Feature Selection
5.4.2 Evaluation
After extracting features and identifying those with most discriminative power
for each classifier, k -fold cross validation, leave-one-out validation (LOOCV) is
performed in order to assess the performance of these classifiers. The experimen-
tal results reported in confusion matrices show that the LR+BS, DT+FS and
SVM+SFFS are the best classification setups given the imbalanced nature of the
patient dataset. Because our two classes (cardiac and non cardiac) are not equally
distributed, different evaluation measurements are reported, namely weighted ac-
curacy, unweighted accuracy, precision, recall,F-measure and Matthew’s correla-
151

tion are reported in Table 5.16. The confusion matrices for LR, DT and SVM
based classification setups and weighted classification accuracies are reported in
Tables 5.15, 5.17 and 5.18. True Positive (TP), False Negative (FN), False Pos-
itive (FP), True Negative (TN) rates are provided for the actual and predicted
outputs (classification outputs).
Predicted Output
Actual
LR+FS LR+BS LR+ED LR+SFFS LR+P LR+mRMRA 197 87 193 91 188 96 194 90 188 96 188 96B 89 185 82 192 93 181 89 185 93 181 93 181Accuracy 68.45 68.99 66.12 67.92 66.12 66.12
Table 5.15: The confusion matrix of LR and feature selection based classificationsetups, study group 1.
LR+BS DT+FS SVM+SFFSWeighted Accuracy 68.99% 65.41% 70.07%Unweighted Accuracy 69.01% 65.38% 70.18%Precision 67.96% 66.90% 63.73%Recall 70.18% 65.74% 73.88%Fmeasure 69.05% 66.32% 68.43%Matthew’s correlation 38.03% 30.78% 40.67%
Table 5.16: Experiment results in terms of different evaluation measurements.
Predicted Output
Actual
DT+FS DT+BS DT+ED DT+SFFS DT+P DT+mRMRA 190 94 170 114 169 115 170 114 169 115 169 115B 99 175 81 193 95 179 81 193 95 179 95 179Accuracy 65.41 65.14 62.3656 65.05 62.36 62.36
Table 5.17: Confusion Matrix of DT and feature selection based classificationsetups, study group 1.
In order to quantify performances of the best classification setups, the Re-
ceiver Operating Characteristic (ROC) curves are used as shown in Figure 5.9
(evaluating the underlying area), which compare the specificity and sensitivity of
experimental setups. In clinical domain, ROC curve analysis is used to determine
the cut off value for a clinical test. The ROC curve is a graph of sensitivity (y-
axis) vs. 1- specificity (x-axis). Maximizing sensitivity corresponds to some large
152

Predicted Output
Actual
SVM+FS SVM+BS SVM+ED SVM+SFFS SVM+P SVM+mRMRA 181 103 183 101 179 105 181 103 179 105 179 105B 64 210 68 206 71 203 64 210 71 203 71 203Accuracy 70.07 69.71 68.45 70.07 68.45 64.45
Table 5.18: Confusion Matrix of SVM and feature selection based classificationsetups, study group 1.
y value on the ROC curve. Maximizing specificity corresponds to a small x value
on the ROC curve. Thus a good first choice for a test cut-off value is that value
which corresponds to a point on the ROC curve nearest to the upper left corner of
the ROC graph.This is not always true however. For example, in the cardiac risk
assessment it is important not to miss detecting a patient with cardiac chest pain
therefore it is more important to maximize sensitivity (minimize false negatives)
than to maximize specificity. In this case the optimal cut-off point on the ROC
curve will move from the vicinity of the upper left corner over toward the upper
right corner.
5.4.3 Performance evaluation of experimental setups
In addition to the ROC curve analysis which is used to evaluate the performance
of best classification setups. A one way ANOVA (analysis of variance) is also
employed to compare means of classification accuracies obtained in three ex-
perimental setups to establish whether the difference in classification accuracies
within groups and among other classifiers is significant or they are statistically
equal. Table 5.19 shows detailed analysis of the one-way ANOVA test which is
performed using LR, DT and SVM experimental setups.
In the summary section, it shows the average classification accuracies of the
LR,DT and SVM classification groups.
For the single factor Anova test, the Null Hypothesis is defined as follows:
H0 : µ1 = µ2 = µ3 (the means are all equal, hence the difference in means in
all of three experimental setups are all the same)
H1 :At least two of the means are different
153

0 0.1 0.2 0.3 0.4 0.5 0.6 0.7 0.8 0.9 10
0.1
0.2
0.3
0.4
0.5
0.6
0.7
0.8
0.9
1
False positive Rate
Tru
e P
ositi
ve R
ate
SVM+SFFSLR+BSDT+FSSVM+BS
Figure 5.9: ROC curves of various experimental setups utilised in the study group1 for comparison purpose.
α = 0.05
In the ANOVA section in Table 5.19, sum of squares (SS), degree of freedom
(df) and mean square values are provided. As it can be seen that the F statistic
value (28.34) is greater than the critical value of F (8.02). Also the p-value is
<0.05, so on this basis the null hypothesis is rejected and it is now established
that the difference in the classification accuracies within groups and among other
classifiers is statistically significant.
154

Anova: Single Factor
SUMMARY
Groups Count Sum Average Variance
Logistic Regression 6 403.72 67.28 1.7478
Decision Tree 6 382.59 63.765 2.38611
Support Vector Machine 6 415.2 69.2 0.69228
ANOVA
Source of Variation SS df MS F P-value F crit
Between Groups 91.20 2 45.60 28.34 8.02793E-06 3.68
Within Groups 24.13 15 1.6087
Total 115.3354944 17
Table 5.19: One-way ANOVA Test for the performance evaluation of LR, DTand SVM based classification setups.
155

5.4.4 Study Group 2: Test Results
In this study group, clinical variables representing various test results are included
for the comparative analysis purpose. The statistical p-values for the clinical vari-
ables involved in this study group are provided in Table 5.20. It shows that the
“Pathway”, “Initial Assessment”, “ETT” and “CT result” are the most signif-
icant clinical variables in the list. The state of the art feature selection and
machine learning techniques are applied. Details of the LR, DT and SVM based
machine learning setups are provided in the Table 5.21. As it can be seen, that
18 experimental setups are employed to classify the patient data in study group
2. An expert driven ( pre-selection by clinical domain expert) feature selection
and LR based baseline model was developed which was then compared with state
of the art machine learning and feature selection techniques.
As it can be seen in the Table 5.21, “initial assessment” is a common clinical
variable amongst the majority classification groups. It is interesting to notice that
LR+FS and LR+SFFS based experimental setups attained the best classification
accuracy using only one variable (initial assessment). The best classification se-
tups are DT+FS, DT+BS, DT+SFFS. All of these setups handled the data spar-
sity issue with a classification accuracy of 82.97%. “CT scan result” is also found
to be common among the majority classification groups. These findings corrob-
orate the high statistical p-values of “Initial Assessment and CT scan result”
and re-iterate their significance in the clinical decision making. The performance
complexity trade-offs in this case could be considered to limit the amount of tests
(by focussing on the most significant tests picked up in the classification setups),
needed to diagnose a patient with cardiac chest pain.
5.4.5 Evaluation
After the feature extraction stage, a k-fold cross validation based leave-one-out
validation (LOOCV) technique is used for performance evaluation of the classi-
fication methods. The confusion matrices of LR, DT and SVM combined with
state of the art feature selection techniques are shown in Tables 5.23, 5.17 and
156

5.18.
Clinical variablesTest Results
P-value
1. Pathway 1.93 e-27 <0.000002. Initial Assessment 1.48 e-21 <0.000003. ETT Result 0.04 <0.054. CT Result 0.05 <0.15. MPS Result 0.176. Angio Result 0.9
Table 5.20: P-values of the clinical variables (study group 2).
Experimental Setup Selected Features Accuracy1. LR+FS 2 69.892. LR+BS 1 ,4 ,5, 6 72.583. LR+ED ALL 67.924. LR+SFFS 2 69.895. LR+P-Value 6,2,5,1,4,3 67.926. LR+mRMR 2,6,1,5,4,3 67.927. DT+FS 2, 6, 4, 3 82.978. DT+BS 2, 3, 4, 6 82.979. DT+ED All 81.8910. DT+SFFS 2, 6, 4, 3 82.9711. DT+P-Value 6,2,5,1,4,3 81.8912. DT+mRMR 2,6,1,5,4,3 81.8914. SVM+FS 2,3 70.9615. SVM+BS 2,4,5 70.9616. SVM+ED ALL 68.6317. SVM+SFFS 2,3 70.9618. SVM+P-Value 6,2,5,1,4,3 68.6319. SVM+mRMR 2,6,1,5,4,3 68.63
Table 5.21: Feature Selection results, Study group 2 (Test Results).
The DT+FS, DT+SFFS, DT+BS and DT+mRMR classification groups are
selected for analysis. In Table 5.22, different evaluation measurements are pro-
vided. As our two classes (cardiac and non cardiac) are not equally distributed
which is why weighted accuracies and other measurements are reported. The
confusion matrices of LR, DT and SVM based classification setups and weighted
classification accuracies are provided in Tables 5.23, 5.24 and 5.25. True Positive
(TP), False Negative (FN), False Positive (FP), True Negative (TN) rates are
157

DT+FS DT+SFFS DT+BS DT+mRMRWeighted Accuracy 82.97 % 81.89% 82.97% 82.97%Unweighted Accuracy 83.09% 81.98% 83.09% 83.09%Precision 76.41% 77.46% 76.41% 76.41%Recall 88.57% 85.60% 88.57% 88.57%Fmeasure 82.04% 81.33% 82.04% 82.04%Matthew’s Correlation 66.68% 64.15% 66.68% 66.68%
Table 5.22: Experiment results in terms of different evaluation measurements.
provided for the actual and predicted outputs.
Predicted Output
Actual
LR+FS LR+BS LR+ED LR+SFFS LR+P LR+mRMRA 142 142 248 36 206 78 142 142 206 78 208 78B 26 248 117 157 101 173 26 248 101 173 101 173Accuracy 69.89 72.58 67.92 69.89 67.92 67.92
Table 5.23: Confusion matrix obtained using LR based classification setups.
Predicted
Actual
DT+FS DT+BS DT+ED DT+SFFS DT+P DT+mRMRA 217 67 217 67 220 64 217 67 220 64 220 64B 28 246 28 246 37 237 28 246 37 237 37 237Accuracy 82.97 82.97 81.89 82.97 81.89 81.89
Table 5.24: Confusion matrix obtained using DT based classification setups.
The Receiver Operating Characteristic (ROC)curves are used to quantify per-
formances of the best classification groups. In Figure 5.10, performances of DT
and LR based setups are plotted which compare the specificity and sensitivity in
our experimental setups.
5.4.6 Performance evaluation of experimental setups
In addition to the ROC curve analysis, a one way ANOVA test is also utilised
for the performance evaluation of the best classification groups. The one-way
ANOVA test is used to compare means of classification accuracies obtained in
three experimental setups. This test is used to ascertain whether the differ-
ence/improvement in classification accuracies within different classification groups
158

Predicted Output
Actual
SVM+FS SVM+BS SVM+ED SVM+SFFS SVM+PValue SVM+mRMRA 142 142 142 142 214 70 142 142 214 70 214 70B 20 254 20 254 105 169 20 254 105 169 105 169Accuracy 70.96 70.96 68.63 70.96 68.63 68.63
Table 5.25: Confusion matrix obtained using SVM based classification setups.
and other classifiers (across different classification methods) is significant or they
all are equal.
Table 5.26 provides detailed analysis of the one-way ANOVA. In the summary
section, the average classification accuracies are calculated based on LR, DT and
SVM classification setups.
For the single factor ANOVA test, the Null Hypothesis is declared as follows:
H0 : µ1 = µ2 = µ3 (the means are all equal, hence the difference in means in
all of three experimental setups are all the same)
H1 :At least two of the means are different
α = 0.05
In the ANOVA section in Table 5.26, sum of squares (SS), degree of freedom
(df) and mean square values are provided. As it can be seen that the F statistic
value (183.50) is greater than the critical value of F (3.682). Also the p-value is
<0.05, so on this basis the null hypothesis is rejected and it is now established
that the difference in the classification accuracies within groups and among other
classifiers (across LR, DT and SVM classification groups) is statistically signifi-
cant.
5.4.7 Implementation of online Clinical Prognostic Mod-
els
In the RACPC clinical case study, three datasets are utilised for the development
of machine learning prognostic models for Raigmore Hospital’s RACPC clini-
cians. The results obtained through three patient datasets were analysed by the
consultant cardiologist from Raigmore Hospital. It was decided to develop on-
159
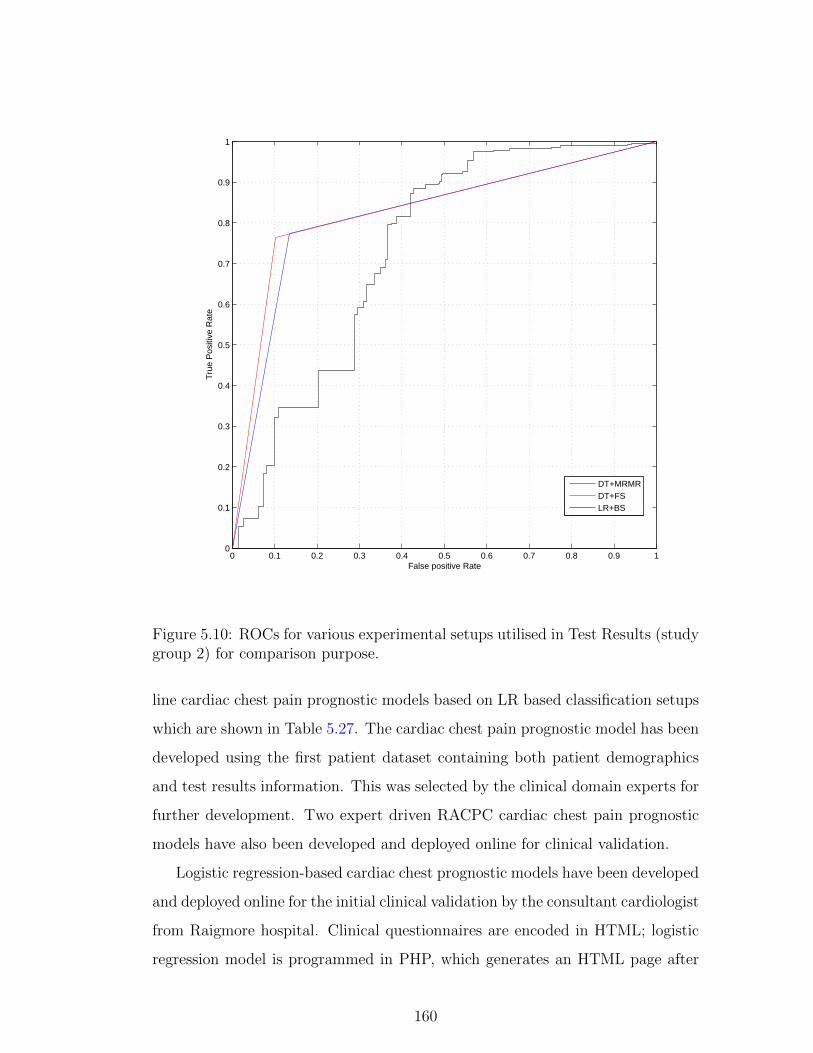
0 0.1 0.2 0.3 0.4 0.5 0.6 0.7 0.8 0.9 10
0.1
0.2
0.3
0.4
0.5
0.6
0.7
0.8
0.9
1
False positive Rate
Tru
e P
ositi
ve R
ate
DT+MRMRDT+FSLR+BS
Figure 5.10: ROCs for various experimental setups utilised in Test Results (studygroup 2) for comparison purpose.
line cardiac chest pain prognostic models based on LR based classification setups
which are shown in Table 5.27. The cardiac chest pain prognostic model has been
developed using the first patient dataset containing both patient demographics
and test results information. This was selected by the clinical domain experts for
further development. Two expert driven RACPC cardiac chest pain prognostic
models have also been developed and deployed online for clinical validation.
Logistic regression-based cardiac chest prognostic models have been developed
and deployed online for the initial clinical validation by the consultant cardiologist
from Raigmore hospital. Clinical questionnaires are encoded in HTML; logistic
regression model is programmed in PHP, which generates an HTML page after
160

Anova: Single Factor
SUMMARY
Groups Count Sum Average Variance
Logistic Regression 6 416.12 69.35 3.4301
Decision Tree 6 494.58 82.43 0.34992
Support Vector Machine 6 418.77 69.795 1.62867
ANOVA
Source of Variation SS df MS F P-value F crit
Between Groups 661.6750111 2 330.83 183.50 2.8522E-11 3.682
Within Groups 27.04368333 15 1.802912222
Total 688.7186944 17
Table 5.26: One-way ANOVA Test for the performance evaluation of LR, DTand SVM based classification setups (Study group 2- Test Results).
Best Classification Setups
Risk Factors and Test Results
ExperimentalSetups
SelectedFeatures
WeightedClassificationAccuracy
LR+FS INA, AGE, ANG, SEX, MPS, YOS, NOC, HPT, PWY, ETT, CT, SMR 74.68%
LR+BS SMR, YOS, AGE, PWY, SEX, HPT, INA, CT, MPS, ANG 74.68%
DT+SFFS ANG, INA, CTT, ETT 78.63%
DT+FS ANG, INA,CT, ETT, DAB, SEX 77.84%
SVM+FS ANG, INA, CT, SEX, ETT, PWY, AGE, MPS, CHL,YOS 78.16%
SVM+BS YOS, AGE, PWY, SEX, HPT, CHL, INA, CT, MPS, ANG 78.32%
Table 5.27: Classification setups considered for the development of machine learn-ing driven cardiac chest pain prognostic model.
data is collected from an HTML input form. The probability of cardiac chest
pain risk score is calculated when user presses the “Calculate Score” button.
The machine learning cardiac chest pain prognostic model is intended to be
used by RACPC clinicians. The user is asked to provide patient demographics
information and details of CT, ETT and MPS test results. The cardiac chest
pain risk score is calculated using the formula as shown below:
SCORE = 100.(1 + e−M)−1
where
M = co-efficients of each clinical variable used in the model.
161

Figure 5.11: Cardiac Chest Pain Prognostic Model’s front end.
The logistic regression model calculates the probability of cardiac chest pain
using series of inputs as shown in Figure 5.12.
The initial cardiac chest pain prognostic model as in Figure 5.11 was validated
by clinical domain expert from Raigmore Hospital. In the developed cardiac
chest pain prognostic model, we first determined the optimal number of variables,
after applying k -fold cross-validation strategy, as recommended in section 3.4.5,
followed by development of prognostic model keeping in view clinical requirements
of RACPC. The developed model calculates probability of cardiac chest pain.
Two additional cardiac chest pain prognostic models have also been developed
as per the clinical needs of Raigmore hospital’s RACPC. In the second cardiac
chest pain prognostic model, it was suggested to include additional two clinical
variables, “Initial Assessment” and “Angio Result”. LR classifier is used in the
development of these expert driven prognostic models shown in Figure 5.13.
162

Figure 5.12: Output example of the Cardiac Chest Pain Prognostic Model.
Figure 5.14 shows the third cardiac chest pain prognostic model which is
developed to calculate cardiac chest pain risk score using minimal set of variables.
This cardiac chest pain prognostic model provides a cost effective cardiac chest
pain risk assessment mechanism by using patient demographics and minimal test
results, thereby reducing cost and dependency on CT scan and initial assessment
procedures.
163

Figure 5.13: Output example of the Cardiac Chest Pain Prognostic Model.
5.4.8 Machine Learning Driven Cardiac chest pain prog-
nostic model’s integration with the recommendation
system
After the validation of three of the cardiac chest pain prognostic models, the
heart disease prognostic model shown in the Figure 5.11 was selected by the
clinicians for further clinical trials. This prognostic model was integrated with the
ODCRARS for further system level validation by the clinical domain experts. It is
integrated in the “Risk Assessment” section of the ODCRARS which is developed
for clinicians to carry out the cardiac risk assessment. This provides a holistic and
effective cardiac risk assessment based on evidence based risk score calculation
through machine learning driven cardiac chest pain prognostic model along with
164

Figure 5.14: Output example of the Cardiac Chest Pain Prognostic Model.
rules based cardiac risk scores provided by the ODCRARS. This holistic view of
patient’s cardiac risk assessment can be utilised in doctor-patient consultations.
The patient data utilised in the testing of the ODCRARS was used for testing of
these cardiac chest pain prognostic models, details of which will be provided in
the validation section.
5.5 Case Study 2: Heart Disease
5.5.1 Background
The heart disease clinical case study is carried out for the development and val-
idation of the proposed MLDPS. The patient dataset in this clinical case study
was manually collected in the European StatLog project. The patient dataset
is shared by data mining experts from the University of Cleveland in US. The
European StatLog project focused on comparing performances of the machine
learning, statistical and neural network algorithms on real patient datasets in the
165

heart disease and other clinical domains. This clinical case study was carried out
in close collaboration with primary care clinicians with a view to develop heart
disease specific prognostic models for cardiovascular patients. The heart disease
database contains 76 attributes, but all published experiments refer to using a
subset of 14 of them. Experiments with the Cleveland database (based on 13
clinical features of 270 patients) have concentrated on attempting to distinguish
presence of heart disease (1) from absence (0). This patient dataset was selected
due to its clinical relevance in the cardiac domain, also a number of clinical vari-
ables which are required to carry out cardiac risk assessment using Framingham
Heart Study (FHS) are found common in this dataset.
5.5.2 Aims
The heart disease patient dataset was selected for the development and validation
of the MLDPS which was initially validated in the RACPC clinical case study
through utilisation of three RACPC patient datasets. The other key aim of the
heart disease case study is to develop evidence based/data driven heart disease
prognostic models which could build on cardiac risk assessment mechanism pro-
vided by the ontology driven clinical risk assessment and recommendation system
(ODCRARS). The development details of ODCRARS are provided in chapter 4.
The heart disease clinical case study was carried out under the supervision of clin-
ical domain experts from UK and bespoke heart disease prognostic models are
developed, keeping in view clinical needs of the primary and secondary care clin-
icians. A number of web-based heart disease prognostic models are put through
clinical trial and validation through primary and secondary care clinicians in UK.
The final validated heart disease prognostic model (amongst other heart disease
prognostic models) is integrated with the ODCRARS to provide a cost effective,
efficient cardiac risk assessment mechanism for clinicians in the UK and US. The
heart disease prognostic models are also made available online for its utilisation
by patients who wish to calculate their heart disease risk score as a preventative
care measure.
166

5.5.3 Data Preparation
Clinical evidence is extrapolated through the heart disease patient dataset con-
taining 13 clinical variables. Table 5.28 shows a list of variables along with their
respective data types before the pre-processing stage. The categorical variables
are pre-processed using the“Effect Coding Scheme” to alleviate collinearity prob-
lem in the given dataset. Categorical variables are encoded into a series of n - 1
binary variables where n is the number of categories to be represented. As a re-
sult of pre-processing of categorical additional independent variables are created,
the final list of candidate clinical variables are shown in Table 5.29. Also the
z-score normalisation (zero mean normalisation) method is applied, it converts
all variables to a common scale with an average of zero and standard deviation
of one. There are no missing data in the selected dataset which is why missing
data handling is not required in this clinical case study.
167

Features Data Value1 Age Numeric2 Sex Male/Female
3 Chest Pain Type
AnginaAtypical AnginaNon Anginal PainNo Chest Pain
4 Exercise induced Angina Yes/No5 Resting BP in mm Hg Numeric6 Serum Cholesterol in mmol/L Numeric7 Fasting Blood Sugar Yes/No
8Resting ElectrocardiographiesResults
0: Normal1: Having ST-T wave abnormality(T wave inversions and/or ST elevationor depression of >0.05 mV)2: Showing probable or definite leftventricular hypertrophy by Estes’ criteria
9 STDepression Numeric
10 ST SegmentUp SlopingFlatDownsloping
11Number of Major Vesselscoloured by Fluoroscopy
0,1,2,3
12Thallium TreadmillStress Test: Maximum Heart Rate Achieved
Numeric
13 Thallium Heart ScanNormalFixed DefectReversible Defect
Table 5.28: Clinical Variables extracted from the UCI heart disease dataset.
168

Features Data Value1 Age Numeric2 Sex Male/Female3 Angina Yes/No4 Atypical Angina Yes/No5 Non Anginal Pain Yes/No6 Asymptomatic Yes/No7 Exercise induced Angina Yes/No8 Resting BP in mm Hg Numeric9 Serum Cholesterol in mmol/L Numeric10 Fasting Blood Sugar Yes/No
11 Electrocardiographic Result
Results0: Normal1: Having ST-Twave abnormality(T wave inversions and/orST elevation or depression of >0.05 mV)2: Showing probable ordefinite leftventricular hypertrophy by Estes criteria
12 STDepression Numeric13 ST Segment- Up-Sloping Yes/No14 St Segment - Flat Yes/No15 ST Segment- Downsloping Yes/No16 Fluoroscopy 0,1,2,3
17Thallium Treadmill StressTestMaximum Heart Rate
Numeric
18 Thallium Normal Yes/No19 Thallium Fixed Defect Yes/No20 Thallium Heart Scan -Reversible Defect Yes/No
Table 5.29: Final list of clinical variables after the effects coding scheme.
169

5.5.4 Feature Selection
The statistical p-values are calculated for each of the clinical variables to find
out the clinical significance of each clinical variable. As it can be seen in the
Table 5.30, most of the variables are statistically significant. The Expert Driven
(ED) (without feature selection, based on original variables) and P-value feature
selection methods are also employed for comparison with state of the art feature
selection techniques. Details of various experimental setups based on machine
learning classification and feature selection methods are shown in 5.31.
Clinical Variables P-value1 Age 1E-18 <0.00012 Sex 1E-13 <0.00013 Angina 3E-12 <0.00014 Atypical Angina 6E-12 <0.00015 Non Anginal Pain 2E-11 <0.00016 Asymptomatic 3E-07 <0.00017 Exercise induced Angina 3E-07 <0.00018 Resting Blood Pressure 3E-05 <0.00019 Serum Cholesterol in mg/dl 4E-04 <0.000110 Fasting Blood Sugar 3E-03 <0.00111 Electrocardiographic Result 1E-02 <0.00112 ST Depression 5E-02 <0.00113 ST Segment Up-sloping 6E-02 <0.00114 St Segment Flat 2E-01 <0.0515 St Segment Downsloping 4E-01 <0.0516 Fluoroscopy 5E-01 <0.05
17Thallium Treadmill Stress Test:Maximum Heart Rate
5E-01 <0.05
18 Thallium Normal 6E-01 <0.0519 Thallium Fixed Defect 7E-01 <0.0520 Thallium Reversible Defect 8E-01 <0.05
Table 5.30: P-values of the clinical variables selected in the heart disease clinicalcase study.
5.5.5 Prognostic Model Development
After dataset preparation, a number of clinical variables are extracted through
the legacy patient data for the prognostic model development. Table 5.31 shows,
classification accuracies along with selected feature in each of the experimental
170

setups utilised in this case study. It can be seen that more transparent models
based on LR combined with FS and BS had a considerable difference in terms of
features utilised in each setup. LR+FS provides more optimum solution in terms
of classification accuracy and less number of features are utilised to classify the
heart disease patient dataset with a classification accuracy of 83.70%.
The best classification accuracy was achieved based on trial and error. The
SVM ( Linear Kernel Function) and FS wrapping technique provided the best
classification accuracy . In comparison to the baseline LR model, the SVM+BS
experimental setup utilised 8 clinical variables to classify the patient dataset with
the lowest standard error. The classification accuracies of various LR, DT and
SVM based experimental setups, along with selected features in each setup are
provided in the Table 5.31.
The confusion matrices for all of the experimental setups in this clinical case
study are provided. The accuracy of these experimental setups (based on the
threshold of 0.5) is evaluated using the Leave one out cross (LOOCV) validation
technique. Also, should the best accuracy be reached in models with different
number of variables, the one with the smallest number of variables will be con-
sidered, assuming that collecting less variables provides a more time and cost
efficient approach.
5.5.6 Prognostic Model Validation and Evaluation
The confusion matrices of various experimental setups for LR, DT and SVM
based experimental setups are shown in Tables 5.32, 5.33 and 5.34 and the best
classification accuracies are highlighted in each classification group. True Positive
(TP), False Negative (FN), False Positive (FP), True Negative (TN) rates are
provided for the actual and predicted outputs (classification outputs). As our two
classes are not equally distributed which is why Weighted accuracies and other
measurements including Unweighted Accuracy, Precision, Recall, Fmeasure and
Matthew’s correlation are reported in Table 5.35.
The ROC curve analysis is also used to quantify the performances of various
classification setups shown in Figure 5.15. The ROC curve is a graphical plot of
171

Experimental Setup Selected Features AccuracyLR+FS 6,16,12,2,11 83.70LR+BS 2,4,5,6,7,11,12,13,14,15,16,18,19,20 83.33LR+ED All 81.85LR+SFFS 6,16,12,2,11 83.70LR+P-Value 6,16,17,7,12,5,2,4,1,11,8,9,3,20,18,19,14,15,13,10 81.85LR+mRMR 6,2,16,12,7,1,17,11,5,9,4,3,8,20,14,19,15,18,10,13, 81.85DT+FS 6,16,7,19 81.85DT+BS 2,6,8,9,12,15,16,17,18,19,20 80.74DT+ED All 78.88DT+SFFS 6,16,7,19 81.85DT+P-Value 1,2,3,4,5,6,7,8,9,10,11,12 73.70DT+mRMR 6,2,16,1217,1,17,11,5,9,4,3,8,20,14,19,15,18,10,13 79.62SVM+FS 6,1,2,12,11,16,3,5,13,14 84.44SVM+BS 2,5,6,7,9,12,16,17 84.81SVM+ED All 77.05SVM+SFFS 14,10,12 77.37SVM+P-Value 14,4,10,6,8,13,7,9,5,1,12,2,3,,11 77.05SVM+mRMR 14,4,10,5,6,8,13,7,12,9,,11,,1,2,3 77.05
Table 5.31: Experimental setups based on the machine learning classification andfeature selection methods.
Predicted Output
Actual
LR+FS LR+BS LR+ED LR+SFFS LR+P LR+mRMRA 128 22 134 16 131 19 128 22 131 19 131 19B 22 98 29 91 30 90 22 98 30 90 30 90Accuracy 83.70 83.33 81.85 83.70 81.85 81.85
Table 5.32: The confusion matrix of LR based classification setups.
the True Positive (TP) rate (along the vertical axis) against 1 minus the False
Positive rate (along the horizontal axis). ROC curve comes from the idea that,
given the curve, the receivers of the information, can use (or operate at) any
point on the curve by using the appropriate cut point. The ROC curve can be
used to determine the optimal threshold cut-off value between sensitivity and
specificity. The ROC curve lets users see the trade-off between sensitivity and
specificity for all possible thresholds rather than just the one that was chosen by
the modeling technique. Different classification objectives might make one point
on the curve more suitable for one task and another more suitable for a different
task, so looking at the ROC curve is a way to assess the model independent of
172

Predicted Output
Actual
DT+FS DT+BS DT+ED DT+SFFS DT+P DT+mRMRA 133 17 125 25 125 25 132 17 111 39 126 24B 32 88 27 93 32 88 32 88 32 88 31 89Accuracy 81.85 80.74 78.88 81.85 73.70 79.62
Table 5.33: The confusion matrix of DT based classification setups.
Predicted Output
Actual
SVM+FS SVM+BS SVM+ED SVM+SFFS SVM+P SVM+mRMRA 134 16 137 13 133 17 112 38 133 17 132 17B 26 94 28 92 32 88 29 91 32 88 32 88Accuracy 84.44 84.81 81.85 75.18 81.85 81.85
Table 5.34: The confusion matrix of SVM based classification setups.
the choice of a threshold.
5.5.7 Performance evaluation of experimental setups
A one way ANOVA test is also utilised for the performance evaluation of the best
classification groups. The one-way ANOVA test is used to compare means of
classification accuracies obtained in three experimental setups. This test is used to
ascertain whether the difference/improvement in classification accuracies within
different classification groups and other classifiers (across different classification
methods) is significant or they all are equal.
Table 5.36 provides detailed analysis of the one-way ANOVA. In the summary
section, the average classification accuracies are calculated based on LR, DT and
SVM classification setups.
For the single factor ANOVA test, the Null Hypothesis is declared as follows:
H0 : µ1 = µ2 = µ3 (the means are all equal, hence the difference in means in
all of three experimental setups are all the same)
H1 :At least two of the means are different
α = 0.05
In the ANOVA section in Table 5.37, sum of squares (SS), degree of freedom
(df) and mean square values are provided. The F statistic value (1.55) is less
173

LR+FS LR+BS SVM+BS SVM+FS
Weighted Accuracy 83.70% 83.33% 84.81% 84.44%
Unweighted 83.50% 82.58% 84.00% 83.83%
Precision 85.33% 89.3% 91.33% 89.3%
Recall 85.33% 82.2 83.03% 83.70%
Fmeasure 85.33% 85.6% 86.98% 86.4%
Matthew’s Correlation 67.00% 66.2% 69.31% 68.4
Table 5.35: Experiment results in terms of different evaluation measurements.
than the critical value of F (3.682). Also the p-value is >0.05, so on this basis the
null hypothesis is accepted. This shows that the difference in the classification
accuracies within groups and among other classifiers (across LR, DT and SVM
classification groups) is statistically not significant.
SUMMARY ANOVA Single Factor TestGroups Count Sum Average VarianceLogistic Regression 6 496.28 82.71333333 0.912666667Decision Tree 6 482.94 80.49 1.47016Support Vector Machine 6 489.982 81.66366667 11.94472067
Table 5.36: Performance Analysis of different classification techniques.
ANOVA
Source of Variation SS df MS F P-value F crit
Between Groups 14.84500933 2 7.422504667 1.554174869 0.243552667 3.682320344
Within Groups 71.63773667 15 4.775849111
Total 86.482746 17
Table 5.37: ANOVA Test Results.
5.5.8 Implementation of online Clinical Prognostic Mod-
els
In the heart disease clinical case study, a real patient dataset was utilised for
the development of machine learning driven prognostic models for primary and
secondary care clinicians. The results obtained through the patient dataset were
analysed by the consultant cardiologist and a general medical practitioner from
UK. It was decided to develop online heart disease prognostic models based on
LR based classification setups, as shown in the Table 5.35 for clinical validation
174

0 0.1 0.2 0.3 0.4 0.5 0.6 0.7 0.8 0.9 10
0.1
0.2
0.3
0.4
0.5
0.6
0.7
0.8
0.9
1
LR+EDSVM+BSSVM+FSLR+FS
Figure 5.15: ROC curves of the best classification setups for comparison purpose.
through primary and secondary care clinicians. The machine learning driven
heart disease prognostic model was developed for the clinical validation. Two
expert driven heart disease prognostic models were also developed and deployed
online for the clinical validation.
Logistic regression-based heart disease prognostic models have been developed
and deployed online for the initial clinical validation. Clinical questionnaires
are encoded in HTML; logistic regression model is programmed in PHP, which
generates an HTML page after data is collected from an HTML input form. The
probability of cardiac chest pain risk score is calculated when user presses the
175

“Calculate Score” button.
The machine learning driven heart disease prognostic models are intended
to be used by the general medical practitioners in primary care and cardiolo-
gists in the secondary care. The user is asked to provide patient demographics
information and details of cardiac tests which are carried out for patients’ risk
assessment at the cardiology clinics. The heart disease risk score is calculated
using the formula as shown below:
SCORE = 100.(1 + e−M)−1
where
M = co-efficients of each clinical variable used in the model.
The logistic regression model calculates the probability of heart disease using
series of inputs as shown in Figure 5.16.
The initial machine learning driven heart disease prognostic model (as in
Figure 5.16) was validated by clinical domain experts from a general practice
in Edinburgh, Scotland. In the developed heart disease prognostic model, we
first determined the optimal number of variables, after applying k -fold cross-
validation strategy, as recommended in section 3.4.5, followed by development of
prognostic model keeping in view clinical requirements of primary and secondary
care clinicians. The developed model, calculates the probability of heart disease
as shown in Figure 5.17. Two additional heart disease prognostic models have also
been developed and deployed online as per the clinical needs of a general medical
practitioner from Scotland, UK. The second heart disease prognostic model was
developed by excluding some of the clinical variables like “Electrocardiography,
Serum Cholesterol and Thallium Scan” results as shown in Figure 5.18. The third
cardiac chest pain model was developed using the expert driven clinical variables
which are “Asymptomatic chest pain”, “Fluoroscopy” and “Thallium reversible
defect”. The purpose of this prognostic model was to calculate the probability
of the heart disease in situations where test results information is not available.
The screen shot of this prognostic model is shown in Figure 5.19. Further clinical
validation and their utilisation is discussed in the section 5.7.
After the validation of three of the heart disease prognostic models, the heart
176

Figure 5.16: Machine Learning Driven Heart Disease Prognostic Model’s frontend, is available at http://www.cs.stir.ac.uk/ kfa/HDP/hd3/hd3.html.
disease prognostic model shown in Figure 5.17 was selected by the clinicians for
further clinical trials which is why it was integrated with the ODCRARS for fur-
ther validation. It is integrated as an add on for the primary and secondary care
clinicians so that the heart disease risk score (based on evidence based risk score
calculation) along with rules based cardiac risk scores (provided by ODCRARS)
are calculated at the time of patient risk assessment. The patient data utilised in
the testing of ODCRARS was used for testing of these online prognostic models,
details of which will be provided in the validation section.
177

Figure 5.17: Output example of the Machine Learning driven Heart Disease Prog-nostic Model.
Figure 5.18: Machine Learning Driven Heart Disease Prognostic Model’s frontend, is available at http://www.cs.stir.ac.uk/ kfa/HD1/hd1/hd1.html.
178

Figure 5.19: Output example of the Cardiac Chest Pain Prognostic Model, isavailable at http://www.cs.stir.ac.uk/ kfa/HDP/hd2/hd2.html.
179

5.6 Case Study 3: Breast Cancer Prognostic
Modelling
5.6.1 Background
This section describes the third clinical case study which is exploited in the
development and validation of the machine learning driven prognostic system
(MLDPS). The MLDPS is validated in the cardiovascular domain using the
RACPC and Heart Disease clinical case studies described in previous sections.
The aim of this clinical case study is to validate the MLDPS in another clinical
areas to demonstrate clinical effectiveness of our approach. For the purpose of
this clinical case study, a UCI breast cancer patient dataset is utilised for the
development and validation of the MLDPS. This patient dataset was shared by
the researchers from University of Wisconsin in US. Clinical domain and compu-
tational intelligence experts were involved in the feature extraction work through
the breast cancer images data.
5.6.2 Aims
The key aim is to utilise the breast cancer patient data in the development and
validation of the proposed MLDPS. This clinical case study was carried out in
close collaboration with clinical domain experts. Another key objective is to
develop machine learning driven breast cancer prognostic models which could help
pathologists distinguish malignant patients from those with a benign condition.
5.6.3 Candidate Clinical Variable Selection
Clinical experts finalised 9 clinical variables which are utilised in the development
of prognostic models. The details of these features along with p-values of each of
the variables are provided in Table 5.38. It can be seen that all of the variables
picked up by the clinical domain experts are statistically highly significant due
to their low p-values. It is therefore decided to develop a baseline model using
clinical variables selected by clinical domain experts and then compare its results
180

with the state of the art feature selection and machine learning techniques.
Clinical Variables P-value1. Clump Thickness 9E-89 <0.00012. Uniformity of Cell Size 4E-88 <0.00013. Uniformity of Cell Shape 2E-84 <0.00014. Marginal Adhesion 2E-76 <0.00015. Single Epithelial Cell Size 1E-74 <0.00016. Bare Nuclei 5E-57 <0.00017. Bland Chromatin 1E-54 <0.00018. Normal Nucleoli 3E-54 <0.00019. Mitoses 2E-17 <0.0001
Table 5.38: P-values of the clinical variables used in the breast cancer clinicalcase study.
Table 5.39 provides a detailed overview of various experimental setups along
with feature selection techniques which are employed for data classification. As it
can be seen that state of the art feature selection and machine learning classifica-
tion techniques are exploited to find the best model with the highest classification
accuracy. As stated earlier a LR based model using expert driven feature selec-
tion is developed which is compared with DT and SVM based experimental setups
using FS, BS, SFFS, P-value and mRMR feature selection techniques.
5.6.4 Prognostic Model Development
In table 5.39, a number of experimental setups based on LR, DT and SVM along
with selected features in each classification group are presented. The LR com-
bined with backward feature selection utilised 6 features to classify the patient
data with a classification accuracy of 97.21 %. Another LR experimental setup
based on SFFS feature selection only utilised 5 features to distinguish malignant
patients from others with a benign condition. Sequential Floating Forward Selec-
tion (SFFS) is one of the most effective wrapping methods for feature selection.
This works in an iterative manner and starts with empty set of features. However,
the features selected after each iteration are removed one by one. If the removal
of any feature results in increasing the classification accuracy, then the corre-
sponding feature is permanently discarded from the feature set. This approach
guarantees that the final set doesn’t contain any correlated features.
181
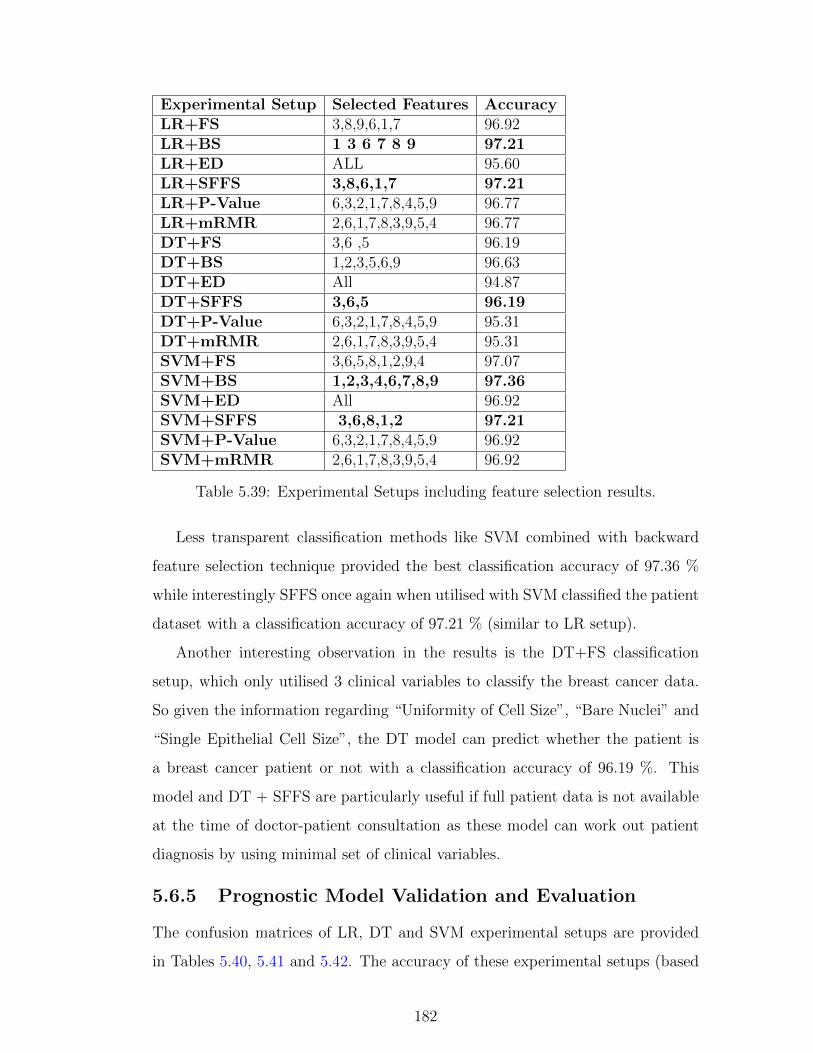
Experimental Setup Selected Features AccuracyLR+FS 3,8,9,6,1,7 96.92LR+BS 1 3 6 7 8 9 97.21LR+ED ALL 95.60LR+SFFS 3,8,6,1,7 97.21LR+P-Value 6,3,2,1,7,8,4,5,9 96.77LR+mRMR 2,6,1,7,8,3,9,5,4 96.77DT+FS 3,6 ,5 96.19DT+BS 1,2,3,5,6,9 96.63DT+ED All 94.87DT+SFFS 3,6,5 96.19DT+P-Value 6,3,2,1,7,8,4,5,9 95.31DT+mRMR 2,6,1,7,8,3,9,5,4 95.31SVM+FS 3,6,5,8,1,2,9,4 97.07SVM+BS 1,2,3,4,6,7,8,9 97.36SVM+ED All 96.92SVM+SFFS 3,6,8,1,2 97.21SVM+P-Value 6,3,2,1,7,8,4,5,9 96.92SVM+mRMR 2,6,1,7,8,3,9,5,4 96.92
Table 5.39: Experimental Setups including feature selection results.
Less transparent classification methods like SVM combined with backward
feature selection technique provided the best classification accuracy of 97.36 %
while interestingly SFFS once again when utilised with SVM classified the patient
dataset with a classification accuracy of 97.21 % (similar to LR setup).
Another interesting observation in the results is the DT+FS classification
setup, which only utilised 3 clinical variables to classify the breast cancer data.
So given the information regarding “Uniformity of Cell Size”, “Bare Nuclei” and
“Single Epithelial Cell Size”, the DT model can predict whether the patient is
a breast cancer patient or not with a classification accuracy of 96.19 %. This
model and DT + SFFS are particularly useful if full patient data is not available
at the time of doctor-patient consultation as these model can work out patient
diagnosis by using minimal set of clinical variables.
5.6.5 Prognostic Model Validation and Evaluation
The confusion matrices of LR, DT and SVM experimental setups are provided
in Tables 5.40, 5.41 and 5.42. The accuracy of these experimental setups (based
182

on the threshold of 0.5) is evaluated using the Leave one out cross (LOOCV)
validation technique.The best classification accuracies are highlighted in each
classification group. True Positive (TP) or sensitivity, False Negative (FN) or
1- sensitivity, False Positive (FP), True Negative (TN) or specificity rates are
provided for the actual and predicted outputs (classification outputs). As our
two classes are not equally distributed which is why Weighted accuracies and
other measurements including Unweighted Accuracy, Precision (positive predic-
tive value), Recall, Fmeasure and Matthew’s correlation are reported in Table
5.43.
Predicted Output
Actual
LR+FS LR+BS LR+ED LR+SFFS LR+P LR+mRMRA 435 9 435 9 431 13 435 9 434 10 434 10B 12 227 10 229 17 222 10 229 12 227 12 227Accuracy 96.82 97.21 95.60 97.21 96.77 96.77
Table 5.40: The confusion matrix of different experimental setups based on Lo-gistic Regression and Feature Selection Methods.
Predicted Output
Actual
DT+FS DT+BS DT+ED DT+SFFS DT+P-value DT+MRMR424 20 428 16 424 20 424 20 425 19 425 196 233 7 232 15 22 6 233 13 226 13 22696.19 96.63 94.87 96.19 95.31 95.31
Table 5.41: The confusion matrix of different experimental setups based on De-cision Tree and Feature Selection Methods.
Actual
Predicted OutputSVM+FS SVM+BS SVM+ED SVM+SFFS SVM+P-value SVM+MRMR
A 430 14 432 12 430 14 431 13 430 14 430 14B 6 233 6 233 7 232 6 233 7 232 7 232Accuracy 97.07 % 97.36% 96.92% 97.21% 96.92% 96.92%
Table 5.42: The confusion matrix of different experimental setups based on Sup-port Vector Machine and Feature Selection Methods.
The ROC curve analysis is also used to quantify the performances of various
classification setups shown in Figure 5.20. The ROC curve is a graphical plot of
the True Positive (TP) rate (along the vertical axis) against 1 minus the False
Positive rate (along the horizontal axis). Using an ROC curve of a classifier, the
183

LR+BS LR+SFFS DT+SFFS SVM+BS SVM+SFFSWeighted Accuracy 97.21% 97.21% 96.19% 97.36% 97.21%Unweighted Accuracy 96.89% 96.89% 96.49% 97.39% 97.28%Precision 97.97% 97.97% 95.50% 97.30% 97.07%Recall 97.75% 97.75% 98.60% 97.96% 98.63%Fmeasure 97.86% 97.86% 97.03% 97.96% 97.84%Matthew’s Correlation 93.88% 93.88% 91.84% 94.26% 93.95%
Table 5.43: Experiment results in terms of different evaluation measurements.
evaluation metric will be the area under the ROC curve. The larger the area
under the curve (the more closely the curve follows the left-hand border and the
top border of the ROC space), the more accurate the test. Thus, the ROC curve
for a perfect classifier has an area of 1. The expected curve for a classifier making
random predictions will be a line on the 45 degree diagonal and its expected area
is 0.5.
5.6.6 Performance Evaluation of Experimental Setups
A one way ANOVA test is also performed for the performance evaluation of the
best classification groups. The one-way ANOVA test is used to compare means of
classification accuracies obtained in three experimental setups. This test is used
to check whether the difference/improvement in classification accuracies within
different classification groups and other classifiers (across different classification
methods) is significant or they all are equal. Table 5.44 shows the summary of
ANOVA test, it provides average classification accuracies of LR, DT and SVM
classification groups.
Anova: Single FactorSUMMARYGroups Count Sum Average VarianceLogistic Regression 6 580.48 96.74666667 0.355066667Decision Tree 6 574.5 95.75 0.46464Support Vector Machine 6 582.4 97.06666667 0.034226667
Table 5.44: Performance Analysis of different classification techniques using One-Way ANOVA.
184

0 0.1 0.2 0.3 0.4 0.5 0.6 0.7 0.8 0.9 10
0.1
0.2
0.3
0.4
0.5
0.6
0.7
0.8
0.9
1
False positive Rate
Tru
e P
ositi
ve R
ate
LR+EDSVM+BSDT+MRMRSVM+SFFS
Figure 5.20: ROC curves of the best classification setups for comparison with theexpert driven LR experimental setup.
Declaration of the Null Hypothesis
For the single factor ANOVA test, the Null Hypothesis is declared as follows:
H0 : µ1 = µ2 = µ3 (the means are all equal, hence the difference in means in
all of three experimental setups are all the same)
H1 :At least two of the means are different
α = 0.05
In the ANOVA section in Table 5.45, sum of squares (SS), degree of freedom
(df) and mean square values are provided. As it can be seen that the F statistic
185

value (9.93) is greater than the critical value of F (3.682). Also the p-value is
<0.05, so on this basis the null hypothesis is rejected and it is now established
that the difference in the classification accuracies within groups and among other
classifiers (across LR, DT and SVM classification groups) is statistically signif-
icant. This means that the different classification groups which were deployed
to classify the breast cancer patient data performed well within their own cor-
responding groups. The performance improvements amongst other classification
groups is also found to be statistically significant and in comparison to other
classification groups.
ANOVA
Source of Variation SS df MS F P-value F crit
Between Groups 5.658711111 2 2.829355556 9.939964088 0.001783888 3.682320344
Within Groups 4.269666667 15 0.284644444
Total 9.928377778 17
Table 5.45: ANOVA Test Results.
186

5.6.7 Online Clinical Prognostic Model
The results obtained in LR, DT and SVM experiential setups were analysed
by the clinical domain experts. The best classification setups as shown in 5.43
were critically assessed and presented in e-health workshops and symposiums. A
logistic regression based clinical prognostic model was developed and deployed
online as shown in Figure 5.21 for clinical validation through the oncologist and
pathologist from the West of Scotland. Clinical questionnaires are encoded in
HTML; logistic regression model is programmed in PHP, which generates an
HTML page after data is collected from an HTML input form. The final diagnosis
(whether malignant or benign breast cancer) score is calculated when user presses
the “Calculate Score” button.
Figure 5.21: The machine learning driven Breast Cancer Prognsotic Model’s frontend, is available at http://www.cs.stir.ac.uk/ kfa/bc/bc1.html.
.
The machine learning driven breast cancer prognostic model is intended to
be used by pathologists. The user is asked to provide details about different
parameters which are collated by pathologists through MRI images data. The
breast cancer predication/diagnosis is worked out using the formula as shown
187

below:
SCORE = 100.(1 + e−M)−1
where
M = co-efficients of each clinical variable used in the model.
The oncologist from the Beatson cancer centre carried out the initial clini-
cal validation of the breast cancer Prognostic model. The key objective of this
clinical assessment was to validate the breast cancer prognostic model using the
real patient data to assess its utilisation in predicting the breast cancer outcome
through a set of clinical variables collated by pathologists. After the initial as-
sessment, the clinical prognostic model was clinically assessed by the head of
pathology in the West of Scotland. Details of clinical validation will be provided
in the validation section.
5.7 Verification and Validation of the Clinical
Prototypes
This section discusses the verification and validation of the clinical prototypes
which have been developed to provide evidence based (MLDPS) and expert driven
(ODCRARS) cardiac risk scores calculation. The machine learning driven car-
diac chest pain, heart disease and breast cancer prognostic models have been
deployed online for clinical validation purposes. Several clinical experts in the
primary and secondary care took part in the verification and validation of the
proposed prototypes. The cardiac chest pain and heart disease prognostic models
after their initial validation were integrated with the ontology driven clinical risk
assessment and recommendation system (ODCRARS) to provide a cardiovascular
preventative care solution. The integration testing was carried out using clinical
use cases to ensure the end system’s functionality.
The Clinical domain expert from Raigmore Hospital in Inverness, UK carried
out the initial verification and validation of the cardiac chest pain prognostic
models, see feedback of Professor Stephen Leslie in Appendix A.1. The heart
disease prognostic models were validated by primary and secondary care clinicians
188

in the UK. Clinical validation was carried out in close collaboration with a general
medical practitioner from UK. Clinical use cases were derived from real patient
scenarios, provided by primary care clinicians. A Clinical trial case study for the
machine learning driven cardiac chest pain and heart disease prognostic models
was conducted through a GP practice.
5.7.1 Validation of the Machine Learning Driven System
(MLDPS) and Ontology Driven Clinical Risk As-
sessment and Recommendation System (ODCRARS)
Clinical validation of the MLDPS involved testing of the web based prognostic
models for cardiac chest pain, heart disease and breast cancer. Breast cancer
prognostic models are not part of the ODCRARS and validation of these clinical
models was carried out by an oncologist from the Beatson cancer centre in Glas-
gow. The cardiac chest pain and heart disease prognostic models were validated
by a consultant cardiologist and a general medical practitioner from UK.
The machine learning driven cardiac chest pain prognostic model was devel-
oped under the supervision of a consultant cardiologist from Raigmore Hospital.
This clinical model is developed using clinical features extracted in the RACPC
clinical case study. The model was tested using clinical use cases for non-cardiac
and known cardiac chest pain patients for clinical validation and sanity checking
purposes.
The patient data was generated using the ODCRARS’s web front end. Pa-
tient demographics and past medical history were collated during patient’s review
of the system which has been conducted using the patient’s interface. The pa-
tient data required for the cardiac chest pain risk score calculation was populated
through the ODCRARS. As it can be seen in Figure 5.22, system calculates car-
diac risk scores for the selected patient for various cardiovascular diseases. The
outcome risk scores over 4 and 10 year period, calculated using Framingham
Heart Study (FHS) are provided in the doctor’s module. The ODCRARS pro-
vides dedicated graphical user interface for the clinicians and patients to record
their interactions with the system. Cardiologist using the doctor’s interface re-
189

views patient data which was provided during the patient interview, conducted
through an ontology driven intelligent context-aware information collection com-
ponent. After reviewing patient’s summary data, the clinician carries out clinical
risk assessment by clicking on the “Risk Assessment” button. System brings up
information on the front end as shown in Figure 5.23, which shows details of
cardiovascular risk assessment carried out through ODCRARS. System provides
details of cardiac risk scores for CHD, MI, CHD Death and Stroke conditions
as shown in Figure 5.24. It also brings up patient demographics information
as shown in the Figure 5.22, this information was provided during the patient
registration procedure. The cardiologist also carries out cardiac chest pain risk
assessment by clicking on the “Calculate Score” button. The machine learning
driven cardiac chest pain prognostic model calculates the cardiac chest pain risk
score which is shown in Figure 5.23. The ODCRARS provides a complete car-
diac risk assessment profile for the patient selected by the clinician. In the ”Risk
Assessment” module, cardiologist launches the machine learning driven heart dis-
ease prognostic model by clicking on the ”Heart Disease Prognostic Model” link
to verify information populated on the screen. Clinician then clicks on the “Cal-
culate button to generate the heart disease risk score as shown in Figure 5.25.
The cardiac chest pain and heart disease prognostic models are also evaluated
by a cardiac thoracic surgeon from the Kings College Hospital in London, see the
evaluation statement provided in the Appendix A.3. In light of feedback received
from the cardiologist, a case study for the evaluation of the clinical prototypes
was identified through a GP surgery in Edinburgh, Scotland.
Clinical validation of the machine learning driven cardiac chest pain and heart
disease prognostic models was carried out in a limited case study by a general
medical practitioner from Edinburgh, Scotland. The focus of this clinical case
study was to detect high-risk patients with ischaemic heart disease by carrying out
cardiac risk assessment of patients using the machine learning driven prognostic
models incorporated in the ‘Risk Assessment module of the ODCRARS. Clinical
trials were conducted using the in-house patient data to assess clinical prototypes
suitability for general medical practitioners. At the end of this case study, clinical
190

Figure 5.22: Clinical use case for the validation of ontology driven clinical riskassessment and recommendation system.
assessment feedback was provided, which has been referenced in the Appendix
section A.2.
The ODCRARS, especially machine learning driven cardiac chest pain and
heart disease prognostic models were presented at various e-health workshops and
symposiums, details of these demonstrations are provided in section 1.4. The look
and feel of these clinical prototypes was refined to incorporate users’ feedback,
and adherence to usability guidelines for web browsers and mobile phone users.
Also, clinical prototypes were demonstrated in an invited speaker talk at the
Beth Israel Deaconess Medical Centre of Harvard Medical School, see feedback
in Appendix A.4.
The machine learning driven breast cancer prognostic model was evaluated
by an oncologist from the Beatson, West of Scotland cancer centre in Glasgow
see clinician’s feedback in Appendix A.5. The head of pathology from the West
191

Figure 5.23: Clinical use case for the validation of Ontology Driven Clinical RiskAssessment and Recommendation System.
of Scotland took part in the initial evaluation of the developed prognostic model.
Clinical oncologists and pathologists showed interest in the proposed prognostic
model. They also expressed great interest in the further development and clinical
trials of the proposed prototype with a view to get this rolled out as a clinical
decision support tool for pathologists in the West of Scotland area. The cardiac
risk scores calcification mechanism in ODCRARS is also clinically validated using
known cardiac patient data collated in the RACPC and heart disease clinic case
studies. The cardiac risk scores calculated through ODCRARS is compared with
cardiac risk scores calculation carried out through the MLDPS (cardiac chest pain
and heart disease prognostic models) for clinical validation and sanity checking
purposes.
192

Figure 5.24: Clinical validation of the Ontology Driven Clinical Risk Assessmentand Recommendation system (ODCRARS).
193

Figure 5.25: Cardiac Chest Pain Risk Score Calculation as part of the IntegratedODCRARS.
194

5.8 Summary and Conclusion
In this chapter, we have demonstrated the design, development and validation of
the machine learning driven prognostic system (MLDPS). We have demonstrated
its clinical effectiveness through clinical use cases in the clinical validation sec-
tion. The proposed ontology and machine learning driven hybrid clinical decision
support framework exploits functionality provided by each of its key components.
Moreover, it brings/integrate them together in an intelligent manner to deliver a
cost effective, holistic and efficient cardiovascular clinical risk assessment mecha-
nism. We have also proved MLDPs’ effectiveness in other application areas like
breast cancer. The proposed clinical decision support framework could also be
utilised in the clinical risk assessment of other chronic illnesses.
We have also explained the functionality of a comparative machine learning
and feature selection techniques, used in the development of the prognostic sys-
tem. The MLDPS is validated by clinical domain experts in the RACPC, heart
disease and breast cancer domains. We have also proposed a mechanism for
learning from missing clinical data and its validation using Raigmore Hospital’s
RACPC dataset containing missing values. The machine learning driven prog-
nostic models have been validated using clinical domain experts from Raigmore
Hospital, primary care practice in Edinburgh and the Beatson cancer care centre
in Scotland, UK.
Our proposed MLDPS provides prognostic models for the RACPC clinicians
to distinguish cardiac chest pain patients from those with non-cardiac symptoms.
The machine learning driven breast cancer prognostic model is developed to help
clinicians efficiently distinguish malignant breast cancer patients from others with
a benign condition. It also provides an evidence-based heart disease prognostic
model for heart disease risk score calculation which compliments the cardiac risk
score calculation mechanism supplied by the ODCRARS.
Our proposed clinical decision support framework provides a foundation for
future clinical decision support systems to follow a multi-layered clinical decision
support framework approach by learning from evidence-based/data driven legacy
195

clinical data. Learning from legacy clinical data activity, provides an opportunity
to reverse engineer existing clinical workflows, in order to remove redundant clini-
cal pathways thereby providing clinicians recommendations/suggestions to refine
clinical workflows.
The proposed clinical decision support framework utilises clinical expert’s
knowledge, which is encoded in the form of clinical rules for clinical recommenda-
tion purposes. Also, it makes use of clinical rules (encoded in the form of look-up
tables, statistical equations) provided in the Framingham Heart Study (FHS) for
the cardiac risk score calculation for various cardiovascular diseases.
196

Chapter 6
CONCLUSIONS AND FUTUREWORK
6.1 Conclusions
This thesis presented a novel ontology and machine learning driven hybrid clin-
ical decision support framework for cardiovascular preventative care. The pro-
posed clinical decision support framework provides an efficient clinical risk assess-
ment mechanism by way of combining evidence extrapolated from legacy patient
datasets and clinical experts knowledge encoded in the form of clinical rules.
The proposed framework comprises of a non-knowledge /evidence based machine
learning prognostic system (MLDPS) and a knowledge-based/expert driven on-
tology driven clinical risk assessment and recommendation system (ODCRARS).
The key components are developed and validated in the cardiovascular domain
using clinical case studies in the RACPC and Heart disease domains. An addi-
tional case study in the breast cancer is also utilised for the development and
validation purposes.
We have demonstrated through the clinical case studies (RACPC, Univer-
sity of Cleveland’s Heart Disease and University of Wisconsin’s Breast Cancer
datasets) that more efficient, cost effective clinical decision support systems could
be built by learning from existing clinical workflows (through retrospective data
analysis), utilisation of missing clinical data which is often ignored by clinical in-
formatics experts and efficient prognostic modelling (based on machine learning
197

and feature selection techniques).
The design, development and validation stages of the key components of the
proposed ontology driven clinical risk assessment and recommendation system
(ODCRARS) are explained in detail. The key components of the ODCRARS
are: (1) ontology driven intelligent context-aware information collection which is
driven through the adaptive clinical questionnaire. (2) Ontology driven patient
semantic profile which is developed through the answers collated in patient in-
terviews. The conventional patient medical records are then transformed into
patient semantic profile through a domain specific ontology to give this data
intrinsic meaning and alleviate interoperability issues. (3) Ontology driven clini-
cal decision support comprises of a recommendation ontology and NICE/Expert
driven clinical rules engine. The recommendation ontology is developed (based
on clinical expert’s rules for lab tests and medication) to provide a recommen-
dation of lab tests and medications keeping in view patient’s current and past
medical history. The NICE/Expert clinical rules engine is developed based on
clinical expert’s rules and Framingham Heart Study (look up tables, statistical
equations) to calculate cardiac risk scores for various cardiovascular diseases.
6.2 Discussion and Summary of Contributions
1. In chapter 2, a detailed state of the art review of clinical decision support
systems and techniques utilised in modern clinical decision support systems
were considered. We discussed state of the art review of the most recent
techniques which attempted to address these research issues in the past
and their research outcomes. The analysis of different techniques, including
merits and demerits were provided. Also a hybrid approach of combining
an ontology driven and machine learning techniques was also presented in
the end, we later exploited this hybrid approach to propose a novel ontology
and machine learning driving hybrid clinical decision support framework to
meet our research challenges.
2. In chapter 3, we proposed a novel ontology and machine learning driven hy-
198

brid clinical decision support framework to address our research challenges.
We described our research methodology; system design and development of
the key components of the proposed clinical decision support framework.
The key components of the proposed framework are ontology driven clinical
risk assessment and recommendation system (ODCRARS) and the machine
learning driven prognostic system (MLDPS) which are developed in close
collaboration with primary and secondary care clinicians.
3. In Chapter 4, we discussed in detail the development stages of various key
components of the ontology driven clinical risk assessment and recommen-
dation system (ODCRARS). We demonstrated that ontology driven ap-
proach is well suited to handle complexities involved in developing cost effec-
tive and efficient clinical decision support solutions. Ontology driven design
methodology facilitate clinical informatics experts to overcome knowledge
representation issues by providing flexible, reusable and cost effective solu-
tions. Ontology driven components are capable of modelling complex clin-
ical knowledge which is often difficult to achieve using conventional knowl-
edge representation tools. The proposed Clinical decision Support frame-
work is capable of handling multiple cardiovascular conditions. We briefly
discussed different interfaces for doctor, patients and clinicians (nurses, lab
assistants) and decision support operations which can be performed de-
pending on their access rights. The decision support operations were also
described with a focus on the cardiac risk score calculation using FHS,
global risk score calculation as well as absolute and relative cardiac risk
scores were presented as part of triage system. The integration of cardiac
chest pain and heart disease prognostic models with the ODCRARS is also
discussed in the end. The proposed novel clinical decision support is built
using modularised ontology driven and machine learning driven components
which makes the proposed clinical decision support framework reusable in
other application areas like breast cancer etc. The ODCRARS is clinically
validated using clinical patient gathered in the RACPC and heart disease
199

clinical case studies. The cardiac risk assessment mechanism in ODCRARS
is clinically validated using known cardiac patient data. The cardiac risk
scores calculated through the ODCRARS is compared with cardiac risk
scores calculation carried out through the MLDPS (cardiac chest pain and
heart disease prognostic models) for clinical validation and sanity checking
purposes.
4. In chapter 5, we discussed in detail about the design, development and val-
idation of the machine learning driven prognostic system (MLDPS). Three
clinical case studies in the development and validation of the MLDPS are
discussed in detail. The RACPC and Heart Disease clinical case studies are
carried out in the cardiovascular domain. The breast cancer clinical case
study was carried out to demonstrate utilisation of the MLDPS in other
clinical areas. The MLDPS is developed based on the state of the art ma-
chine learning and feature selection techniques. A comparative analysis of
various experimental setups based on LR, DT and SVM are discussed in de-
tail. A missing data handling mechanism was introduced which exploited
mixture density models and EM (Expectation Maximisation) techniques
based on RACPC legacy dataset containing missing information. We also
carried out data classification work on the estimated missing data using
state of the art statistical machine learning techniques. Various bespoke
novel cardiac chest pain heart disease and breast cancer prognostic models
(based on logistic regression) were developed under the close supervision
of primary and secondary care clinicians. The RACPC, Heart Disease and
Breast Cancer prognostic models are deployed online. These models were
clinically validated through the primary and secondary care clinicians in
UK. Clinical trials and validation statements of the clinicians are provided
in the Appendix section.
5. The proposed framework will pave the way for the development of next-
generation clinical decision support systems through the utilisation of ret-
rospective data analysis strategies based on legacy patient data which is
200

often ignored by clinical domain experts. We discussed prognostic mod-
elling mechanism in detail and provided a comparative view of various ma-
chine learning and feature selection techniques. This approach will enable
clinical informatics experts to deploy optimised clinical workflows by learn-
ing from existing workflows through legacy clinical data and could help
build efficient data-driven prospective clinical systems. The next genera-
tion prospective systems could incorporate evidence-based refined clinical
workflows (by identifying loopholes in the redundant clinical workflows)
and could help suggest improvements to the healthcare governing bodies
like NICE, UK and ACC in the US.
6. In case of ODCRARS, we demonstrated that a holistic cardiovascular risk
assessment mechanism could be built by combining knowledge from two
disparate sources. We can benefit from clinical domain experts knowledge
to build a knowledge base to carry out clinical decision support operations
(risk scores calculation, lab tests, medication recommendations) as we have
demonstrated in this thesis. At the same time, we can make efficient use
of the legacy real patient data to use this as a clinical evidence to build
data driven/evidence based prognostic models as a preventative care so-
lution. We combined expert driven clinical decision making (ODCRARS)
and evidence-based (MLDPS) clinical decision making to provide a holistic
cardiovascular decision support framework for clinicians. Patients can also
benefit from this preventative care solution by utilising patient interface to
build their medical histories as part of the patient interviewing mechanism.
Our novel clinical decision support framework could be utilised as a triage
system in the cardiovascular preventative care.
As part of building a context-sensitive information collection component for
the ODCRARS, we noticed that in the conventional questionnaire based in-
terviewing systems, existing clinical questionnaires are normally encoded in
the database as static/adjacency lists. Clinical informatics experts should
consider/review results of our designed context-sensitive information collec-
201

tion component as this has potential to be utilised at a commercial level,
which would also enhance clinical decision support system’s computational
performance by way of reducing frequent access requests, insertions and
updates to its central database/repository.
7. As part of developing MLDPS, we have developed benchmark cardiac chest
pain prognostic models. Also, novel heart disease and breast cancer specific
prognostic models have been developed and validated by clinical domain
experts. These prognostic models have been made available online to be
utilised by clinicians and patients as a preventative care measure. The new
clinical models have been evaluated in clinical practices, resulted in very
good predictive power and demonstrating general performance improve-
ment. In this research, we have demonstrated a novel approach to build a
hybrid clinical decision support framework by combining ontology and ma-
chine learning techniques to provide effective clinical decision making. Our
ultimate goal is to integrate the whole framework using a multi-layered ap-
proach and develop this as a commercial clinical system for further clinical
trials by clinicians in the UK and US. We also aim to utilise the proposed
clinical decision support framework for the risk assessment of other chronic
illnesses through the utilisation of disease-specific clinical risk assessment
questionnaires from Harvard Medical School. The proposed clinical decision
support framework is built using modularised ontology driven and machine
learning driven components which makes the proposed clinical decision sup-
port framework reusable in other application areas like breast cancer etc.
8. In the current system heart disease and cardiac chest pain prognostic models
learn from retrospective data. Patient logs into the system and build their
medical history through context aware information collection system. Data
for cardiac risk assessment is extracted through patient answers for the
cardiac risk assessment. Clinical variables for the heart disease and cardiac
chest pain risk scores calculation are pre-populated on the front end which
clinicians can adjust for the cardiac risk scores calculation.
202

6.3 Future Work
In future the proposed framework will be complimented with an online learning
mechanism for machine learning. The machine learning inputs in each of the
prognostic models will be optimised (through online learning) for each patient.
A collaborative care mechanism will be built in which patient and clinician could
interact with the ODCRARS in an interactive manner. The interactive collab-
orative clinical decision making platform in ODCRARS will be driven through
multi-modal interfaces. Patient care could be co-ordinated securely through dig-
ital avatars, smart phones, televisions and computers so that support could be
provided in real time instead of through inconvenient doctor’s office visits. A
lifestyle recommendations mechanism, to lower cardiac risk, BMI, etc. will be
driven by clinical expert rules, which will be encoded in the ODCRARS. The
ODCRARS could be linked with third party applications like “CollaboRhythm”
developed by John Moore from MIT new medicine lab in [105]. The Doctor
and patient interfaces in the ODCRARS will be studied from HCI perspective.
Doctor-patient collaborative platform will be analysed from the usability and
optimisation purposes.
The ontology and machine learning driven hybrid clinical decision support
framework will be integrated with the multi-modal affective conversational agent,
proposed by Cambria et al [106]. The multi-modal conversational agent/affective
avatar will be capable of perceiving and expressing emotions in a doctor-patient
collaborative platform which will be developed as an additional module for the
ODCRARS. The affective analysis is carried out through extraction of emotions
from textual, vocal and video inputs. The Sentic Avatar will be used to infer
patient’s affective state and could be useful for the diagnosis of patients with
psychiatric disorders and learning disabilities. The facial extraction analyser
shown in Figure 6.1 will be used for extracting affective information from video
consultations (doctor-patient interactions). The affective integrator will be used
for integrating information coming from different modalities which will feed into
the proposed clinical decision support framework for the overall clinical decision
203

Figure 6.1: The Architecture of Sentic Avatar proposed by Cambria et al.
making. The affective conversational agent will be optimised (clinical question-
naire part will be adjusted) keeping in view results of affective analysis which will
be carried out by studying doctor-patient interactions.
The proposed machine learning driven Prognostic system (MLDPS) will also
be validated in the GHD (growth hormone deficiency) and breast cancer domains.
Two COSIPRA lab PhD researchers are working in close collaboration with clin-
ical domain experts in Scotland, UK to collate real patient data for the GHD
and breast cancer patients (MRI images of breast cancer patients). These real
clinical patient datasets will be utilised for the clinical validation of the machine
learning driven prognostic system (MLDPS).
6.3.1 Utilisation of Fuzzy Cognitive Maps for Collabora-
tive Care
Fuzzy Cognitive Maps (FCM) were developed by R. Kosko [107] as an extension of
cognitive maps, to represent the cognitive relationships between concepts. FCM
represent knowledge in a symbolic manner, encoding the relationships between
the elements of a mental landscape so that the impact of these elements can
be assessed. FCM applies fuzzy logic to cognitive maps, making it possible to
predict changes in the concepts represented in cognitive maps. The graphical
illustration of FCM is a signed, directed graph with feedback, consisting of nodes
and weighted interconnections. Nodes correspond to concepts: variables and
states used to describe the behaviour of the system. Nodes are connected by
weighted arrows representing cognitive relationships between nodes [7].
204

Figure 6.2: Representation of an FCM Model as in [7].
Figure 6.2 illustrates an example of FCM model that is used to perform med-
ical diagnosis. Here, the concepts of the FCM and the causal relations among
them that influence concepts and determine the value of diagnosis concepts in-
dicating the final diagnosis are illustrated. In the FCM model each diagnosis
concept represents a single diagnosis, which means that these concepts must be
mutually exclusive so that an accumulative final diagnosis could be worked out.
Future work involves exploiting Fuzzy Cognitive Maps (FCM) based to handle
clinical uncertainties in modelling complex situations. The proposed framework
will be extended using FCM for exploiting and combining knowledge and expe-
riences of clinical domain experts along with patient demographics data. The
knowledge-based ODCRARS is more suited for the FCM implementation pur-
poses. The development and design of an appropriate FCM requires contribution
of clinical experts. A hierarchical architecture will be developed in which FCM
will be used to model the interaction of various stakeholders like clinicians, pa-
205

tients careers etc. The FCM will consist of concepts representing each one of the
subsystems of FCM for modeling patient records, laboratory tests etc. The FCM
hierarchical model will be an integrated model which will represent the relation-
ships among the subsystems and their models while inferring the final diagnosis
by evaluating all of the information collated through various sub systems. FCMs
could be a useful tool for capturing physicians’ understanding of the system and
their perceptions of the medical requirements of the infectious disease manage-
ment. The main advantage of the proposed FCM tool in clinical decision support
is the sufficient simplicity and interpretability for clinicians in decision making
process, which makes it a convenient consulting tool in predicting the risk of
chronic diseases.
6.3.2 Active Manifold Learning Strategy in Machine Learn-
ing Driven Prognsotic Modelling based on Big Data
In future, the proposed machine learning driven prognostic system (MLDPS) will
be validated using clinical big datasets comprised of genomics and patient demo-
graphics data. The aim of this amalgamated big data is to provide personalised
holistic care through development of bespoke treatments for individuals. We are
aiming to utilise this approach in the breast cancer domain. The focus of research
would be on DNA of an individual’s cancer cells, rather than the ”germlin” - that
is, the patient’s original, inherited DNA for the stratification. This requires the
genetic sequencing of the three billion components of the cancer’s DNA. Com-
putational techniques have paved the way for researchers to analyse this massive
pile of data. Working with human genomic sequences of three billion items gen-
erates specific challenges, in order to overcome these research challenges various
feature reduction techniques will be exploited in dealing with big data to improve
classification problems.
Reduction in big data usually falls in one of two main categories : (i) reduce
the dimensionality by pruning or reformulating the feature set ; (ii) reduce the
sample size by selecting the most relevant examples. The proposed MLDPS will
be complimented with a manifold learning approach to reduce dimensionality and
206

active learning SVM-based strategy to reduce the size of labelled clinical samples.
We will deploy various manifold learning strategies e.g. Isomap (Isometric
Mapping) for the extraction of non-linear structures from high-dimensional data.
The outcome of such a mapping, results in defining a structure that can represent
the data with visualisation capabilities. The manifold methods assume that data
lies on a statistical manifold, or a manifold of probabilistic generative models,
i.e. one uses a supervised learning method. The manifold learning can be used
with both the traditionally associated algorithms, such as K-Nearest Neighbors(
K-NN) and state of the art kernel based machines like SVM [108].
Isomap falls in the pre-processing stages for learning, by performing trans-
formation from a high dimensional input data space into a lower dimensional
feature space [109]. Then, a classifier can be applied to the resulting data. Yet,
Isomap does not explicitly define a mapping function between original data and
prep-processed data. Hence, that mapping has to be learned, namely with a su-
pervised approach, such as generalized regression neural networks [110], which
can then transform the new test data into the reduced feature space before pre-
diction. Besides reducing dimensionality, other possibly is to reduce the size ( or
dimension) of the dataset. Different approaches have been followed, e.g. trans-
ductive learning, co-training and active learning. In most techniques, the training
samples are defined by a random section but, often active learning strategies can
also be employed. In active learning, supervised approach can actively choose
the training data in such a way that it could reduce the learner’s need for large
volumes of labelled data, thus reducing training time.
An active learning algorithm selects from a pool of examples which should be
used (usually after being classified) to create the learning model [111]. Hence,
to actively learn we aim at selecting those examples that, when labelled and
incorporated into training, will minimize classification errors over the distribution
of future examples. Feature space reduction will be achieved by generating a
statistical manifold to suit the data through a supervised version of Isometric
Mapping. This reduction will make it possible to visualize the decision space using
the manifold reduced feature space, giving end users a real sense of confidence in
207

the results.
6.4 Limitations
In this thesis, several clinical case studies conducted in the development and
clinical validation of the MLDPS. In the RACPC clinical case study, we have de-
veloped benchmark prognostic models after pre-processing of missing data values.
The RACPC patient data was manually collected during on-site visits using dis-
tributed clinical repositories at the Raigmore Hospital. The majority of RACPC
patient data had missing values, so going ahead, future evaluation with much
larger datasets (less missing data anomalies) is required to confirm the prelimi-
nary experimental findings.
The comparison provided in the review chapter is a non-exhaustive comparison
due to the wide range of technologies used in this PhD. The ultimate goal is to
develop this framework at the enterprise level for its commercial deployment at
hospital sites for the overall clinical validation through clinicians in the UK and
US.
208

Appendices
209

Appendix A
Clinical Experts Validation Feed-
back
210

Chair: Mr Garry Coutts NHS Highland, Assynt House, Beechwood Park, INVERNESS IV2 3BW
Highland NHS Board is the common name of Highland Health Board
Re: Chest Pain Assessment Decision Support I am writing a statement of support for the work comprising the PhD thesis of Mr Kamran Farooq. One aspect of his work investigated the possibility of developing a novel decision support for the assessment of patients presenting to hospital with chest pain. Several prototypes were developed and prototype 3 was of particular relevance. This was an exciting work and there is significant potential for further development of a clinically relevant tool to aid clinicians. Yours sincerely,
Prof Stephen Leslie Consultant Cardiologist Honorary Professor of Cardiology
01/12/2014
Professor Stephen Leslie Consultant Cardiologist Raigmore Hospital Old Perth Road INVERNESS IV2 3UJ Tel: 01463 705462 Fax: 01463 888252
Figure A.1: Consultant Cardiologist, Professor Stephen Leslie’s Feedback onRACPC Clinical Prototypes.
211

Linda McKay Practice Manager
26 December 2014,
Chest Pain and Heart Disease Risk Clinical Decision Support
It is to confirm that I was involved in the clinical validation of the cardiovascular and
chest pain risk assessment prototypes related to primary care at my clinic. We have
carried out clinical trials (in a limited case study) of the aforementioned prototypes
using real patient data. These prototypes demonstrated clinical potential to be used
as a decision support tool for General Practitioners, specifically for detecting high
risk patients with ischemic heart disease. These risk assessment calculators could
help GPs to prioritise cardiology referrals and further management of suspected
cardiac chest pain patients in secondary care. These clinical risk assessment
prototypes could be made part of the clinical work flows after further clinical trials
and validation.
Dr Wasim Haider
Dr. Ian McKay FRCGP
GMC No. 2819253
Dr. Elizabeth Morton
GMC No. 2842752
Dr. Wasim Haider MRCGP
GMC No. 6055699
Krista Clubb
Practice Nurse
Leith CTC
12 Junction Place
Edinburgh EH6 5JA
Tel. 0131 465 2950
Figure A.2: Clinical validation report issued by General Medical Practitionerfrom a GP practice in Edinburgh, Scotland.
212
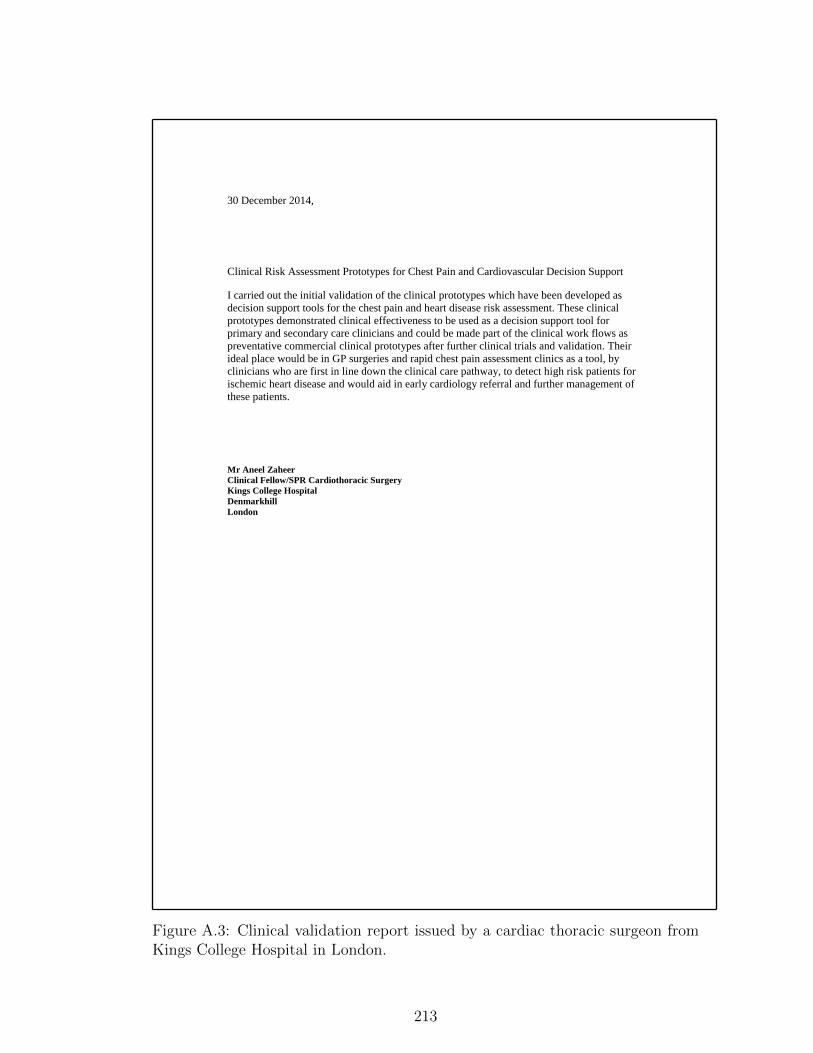
30 December 2014,
Clinical Risk Assessment Prototypes for Chest Pain and Cardiovascular Decision Support
I carried out the initial validation of the clinical prototypes which have been developed as
decision support tools for the chest pain and heart disease risk assessment. These clinical
prototypes demonstrated clinical effectiveness to be used as a decision support tool for
primary and secondary care clinicians and could be made part of the clinical work flows as
preventative commercial clinical prototypes after further clinical trials and validation. Their
ideal place would be in GP surgeries and rapid chest pain assessment clinics as a tool, by
clinicians who are first in line down the clinical care pathway, to detect high risk patients for
ischemic heart disease and would aid in early cardiology referral and further management of
these patients.
Mr Aneel Zaheer
Clinical Fellow/SPR Cardiothoracic Surgery
Kings College Hospital
Denmarkhill
London
Figure A.3: Clinical validation report issued by a cardiac thoracic surgeon fromKings College Hospital in London.
213

Figure A.4: Clinical assessment by clinical informatics expert, Professor WarnerSlack from Harvard Medical School, US.
214

30 December 2014,
Breast Cancer Prognostic Model
I am working with the Breast Cancer team at Beatson West of Scotland Cancer Centre in
Glasgow, involved in the initial assessment, treatment and follow-up of the Breast Cancer
patients. We use different modules to assess the prognosis and clinical outcome using
multiple parameters. In my view clinical prognostic model would be a useful tool for the
pathologists to detect and predict breast cancer at early stages.
I am quite keen to be involved in the future development and clinical trials of this clinical
decision support tool, with a view to roll this out to cancer care specialists and pathologists in
the West of Scotland.
Dr Adnan Masood Siddiqui
Speciality Doctor Medical Oncology
Beatson Oncology Centre
Gartnavel General Hospital
1053 Great Western Road
GLASGOW, G12 0YN
Scotland, UK
….
….
Figure A.5: Clinical validation report issued by the oncologist from The Beatson,Cancer Centre, West of Scotland, UK.
215

Appendix B
RACPC Clinical Case Study: Clin-
ical dataset 3 detailed analysis
216

1 FS + DT 65.41222 BS+DT 65.05383 SFFS+DT 65.0538
4 MRMR+DT65.0538, 57.7061, 58.9606, 61.6487,60.5735, 61.1111, 60.3943
5 FQ+DT 65.0538, the best is using 1 feature6 Pval+DT 65.05387 ALL+DT 62.36568 FS+LR 68.45889 BS+LR 68.996410 SFFS+LR 67.9211
11 MRMR+LR65.233, 67.7419, 66.8459, 67.5627,66.129, 66.6667, 66.3082
12 FQ+LR65.233, 67.7419, 66.8459, 66.3082,66.129, 66.6667, 66.3082
13 Pval+ LR 65.233, 67.7419, 66.8459, 66.845914 ALL+LR 66.12915 FS+GMM 68.817216 BS+GMM 68.63817 SFFS+GMM 68.8172
18 MRMR+GMM64.5161, 67.3835, 67.2043, 66.129,66.6667, 66.129,
19 FQ+ GMM64.5161, 67.3835, 67.2043, 65.0538,66.6667, 66.129, 66.129
20 Pval+ GMM64.5161, 67.3835, 67.2043, 65.0538,66.6667, 66.129, 66.129, 65.7706
21 ALL+ GMM 65.770622 FS+SVM RBF 70.15323 BS+ SVM RBF 69.713324 SFFS+ SVM RBF 70.0717
25 MRMR+ SVM RBF64.8746, 66.8459, 69.7133, 67.3835,68.4588, 69.5341, 68.8172
26 FQ+ SVM RBF64.8746, 66.8459, 69.7133, 68.9964,68.4588, 69.5341, 68.8172
27 Pval+ SVM RBF64.8746, 66.8459, 69.7133, 68.9964,68.4588, 69.5341, 68.8172, 68.4588
28 ALL+ SVM RBF 68.458829 FS+knn (3) 63.620130 BS+ knn (3) 65.23331 SFFS+ knn (3) 65.233
32 MRMR+ knn (3)56.6308, 60.2151, 56.4516,58.9606, 63.9785, 63.9785, 61.6487,
33 FQ+ knn (3)56.6308, 60.2151, 56.4516, 63.6201,63.9785, 63.9785, 61.6487, 63.0824
34 Pval+ knn (3)56.6308, 60.2151, 56.4516, 63.6201,63.9785, 63.9785, 61.6487, 63.0824
217

35 ALL+ knn (3) 63.082436 FS+SVM Lin 68.458837 BS+ SVM Lin 68.996438 SFFS+ SVM Lin 67.9211
39 MRMR+ SVM Lin65.233, 67.3835, 67.3835,67.7419, 67.2043, 67.2043, 66.8459
40 FQ+ SVM Lin65.233, 67.3835, 67.3835,67.5627, 67.2043, 67.2043, 66.8459
41 Pval+ SVM Lin65.7706, 67.3835, 67.3835,67.5627, 67.5627, 67.2043, 66.8459, 66.6667
42 ALL+ SVM Lin 66.6667
Table B.1: Risk Factors and two Classes (Weighted)
1 FS + DT 82.97492 BS+DT 82.97493 SFFS+DT 82.9749
4 MRMR+DT70.7885, 77.7778, 80.1075,79.7491, 80.8244
5 FQ+DT69.7133, 77.7778, 75.9857,79.5699, 80.8244
6 Pval+DT69.7133, 77.7778, 75.9857,79.5699, 80.8244, 81.8996,
7 ALL+DT 81.89968 FS+LR 69.89259 BS+LR 72.580610 SFFS+LR 69.8925
11 MRMR+LR69.8925, 64.8746, 68.9964,62.9032, 68.4588, 67.9211
12 FQ+LR69.7133, 64.8746, 65.7706,62.9032, 68.4588, 67.9211
13 Pval+ LR69.7133, 64.8746, 65.7706,62.9032, 68.4588, 67.9211
14 ALL+LR 67.921115 FS+GMM 72.939116 BS+GMM 74.193517 SFFS+GMM 69.8925
18 MRMR+GMM69.8925 , 69.8925, 67.5627,70.7885, 73.4767, 72.9391
19 FQ+ GMM69.7133, 69.7133, 70.7885,70.7885, 73.4767, 72.9391
20 Pval+ GMM69.8925, 70.7885, 70.7885,73.4767, 72.9391, :72.9391
21 ALL+ GMM 72.9391
Table B.2: Test Results and Two Classes (Weighted)
218

Appendix C
Breast Cancer Clinical Case Study:
Comparative Machine Learning Anal-
ysis
C.1 Kernel Models Implementation with Logis-
tic Regression
C.1.1 Performance Vector
219

DOT Kernel ModelAccuracy 94.02%
true M true B class precisionpred. M 197 19 91.20%pred. B 15 338 95.75%class recall 92.92% 94.68%
POLYNOMIAL Kernel ModelAccuracy 86.82%
true M true B class precisionpred. M 149 12 92.55%pred. B 63 345 84.56%class recall 70.28% 96.64%
ANOVA Kernel ModelAccuracy 98.95%
true M true B class precisionpred. M 206 0 100.00%pred. B 6 357 98.35%class recall 97.17% 100.00%
Gaussian Combination Kernel ModelAccuracy 27.07%
true M true B class precisionpred. M 5 208 2.35%pred. B 207 149 41.85%class recall 2.36% 41.74%
220

RADIAL Kernel ModelAccuracy 97.72%
true M true B class precisionpred. M 201 2 99.01%pred. B 11 355 96.99%class recall 84.81% 99.44%
NEURAL Kernel ModelAccuracy 83.30%
true M true B class precisionpred. M 164 47 77.73%pred. B 48 310 86.59%class recall 77.36% 86.83%
EPACHNENIKOV Kernel ModelAccuracy 98.24%
true M true B class precisionpred. M 202 0 100.00%pred. B 10 357 97.28%class recall 95.28% 100.00%
Multiquadric Kernel ModelAccuracy 26.54%
true M true B class precisionpred. M 3 209 1.42%pred. B 209 148 41.46%class recall 1.42% 41.46%
Table C.1: Logistic Regression - Performance Vector
k = 1Accuracy 100.00%
true M true B Class Precisionpred. M 212 0 100.00%pred. B 0 357 100.00%class recall 100.00% 100.00%
Table C.2: Performance Vector kNN.
221

Figure C.1: Comparison ROCs.
Figure C.2: Comparative ROCs after applying various classification techniques
222

C.2 Random Forest Classification Results
The Random Forest operator generates a set of random trees. The random trees
are generated in exactly the same way as the Random Tree operator generates a
tree. The resulting forest model contains a specified number of random tree mod-
els. The number of trees parameter specifies the required number of trees. The
resulting model is a voting model of all the random trees. For more information
about random trees please study the Random Tree operator.
The representation of the data in form of a tree has the advantage compared
with other approaches of being meaningful and easy to interpret. The goal is to
create a classification model that predicts the value of a target attribute (often
called class or label) based on several input attributes of the Example Set. Each
interior node of the tree corresponds to one of the input attributes. The number
of edges of a nominal interior node is equal to the number of possible values
of the corresponding input attribute. Outgoing edges of numerical attributes
are labelled with disjoint ranges. Each leaf node represents a value of the label
attribute given the values of the input attributes represented by the path from
the root to the leaf. For better understanding of the structure of a tree please
study the Example Process of the Decision Tree operator.
Pruning is a technique in which leaf nodes that do not add to the discrimi-
native power of the tree are removed. This is done to convert an over-specific or
over-fitted tree to a more general form in order to enhance its predictive power on
unseen datasets. Pre-pruning is a type of pruning performed parallel to the tree
creation process. Post-pruning, on the other hand, is done after the tree creation
process is complete.
This parameter specifies the number of random trees to generate. Range:
integer The rest of parameters is same as in Decision Trees.
223

Figure C.3: Comparative ROCs Decision Trees
224

Settings 1 Number of Trees 10Criterion information gainMinimal size for split 4Minimal leaf size 2Minimal gain 0.1Maximal depth 20Confidence 0.25
Settings 2 Number of Trees 50Criterion information gainMinimal size for split 4Minimal leaf size 2Minimal gain 0.1Maximal depth 20Confidence 0.25
Settings 3 Number of Trees 100Criterion information gainMinimal size for split 4Minimal leaf size 2Minimal gain 0.1Maximal depth 20Confidence 0.25
Settings 4 Number of Trees 500Criterion information gainMinimal size for split 4Minimal leaf size 2Minimal gain 0.1Maximal depth 20Confidence 0.25
Table C.3: Random Forests Decision Trees.
225

10 treesAccuracy 96.13%
true M true B class precisionpred. M 195 5 97.50%pred. B 17 352 95.39%class recall 91.98% 98.60%
50 treesAccuracy 97.72%
true M true B class precisionpred. M 203 4 98.07%pred. B 9 353 97.51%class recall 95.75% 98.88%
100 treesAccuracy 96.66%
true M true B class precisionpred. M 202 9 95.73%pred. B 10 348 97.21%class recall 95.28% 97.48%
500 treesAccuracy 96.84%
true M true B class precisionpred. M 201 7 96.63%pred. B 11 350 96.95%class recall 94.81% 98.04%
Table C.4: Performance Vector Random Forest
226

Bibliography
[1] M. A. Musen, B. Middleton, and R. A. Greenes, “Clinical decision-support
systems,” in Biomedical informatics, pp. 643–674, Springer, 2014.
[2] M.-M. Bouamrane, A. Rector, and M. Hurrell, “A hybrid architecture for
a preoperative decision support system using a rule engine and a reasoner
on a clinical ontology,” in Web Reasoning and Rule Systems, pp. 242–253,
Springer, 2009.
[3] S. R. Abidi, S. Hussain, M. Shepherd, and S. S. R. Abidi, “Ontology-based
modeling of clinical practice guidelines: a clinical decision support system
for breast cancer follow-up interventions at primary care settings,” in Med-
info 2007: Proceedings of the 12th World Congress on Health (Medical)
Informatics; Building Sustainable Health Systems, p. 845, IOS Press, 2007.
[4] A. Khan, J. Doucette, and R. Cohen, “A framework for practical medical
decision support systems using structured knowledge & machine learning,”
2012.
[5] L. C. Santelices, Y. Wang, D. Severyn, M. J. Druzdzel, R. L. Kormos, and
J. F. Antaki, “Development of a hybrid decision support model for optimal
ventricular assist device weaning,” The Annals of thoracic surgery, vol. 90,
no. 3, pp. 713–720, 2010.
[6] J. Bowie and G. O. Barnett, “Mumpsan economical and efficient time-
sharing system for information management,” Computer programs in
biomedicine, vol. 6, no. 1, pp. 11–22, 1976.
227
[7] N. Douali, E. I. Papageorgiou, J. De Roo, H. Cools, and M.-C. Jaulent,
“Clinical decision support system based on fuzzy cognitive maps,” Journal
of Computer Science & Systems Biology, vol. 8, no. 2, p. 112, 2015.
[8] M. McGinnis, L. Olsen, A. W. Goodby, et al., Clinical Data as the Basic
Staple of Health Learning:: Creating and Protecting a Public Good: Work-
shop Summary. National Academies Press, 2010.
[9] W. Raghupathi and V. Raghupathi, “Big data analytics in healthcare:
promise and potential,” Health Information Science and Systems, vol. 2,
no. 1, p. 3, 2014.
[10] P. Groves, B. Kayyali, D. Knott, and S. Van Kuiken, “The big datarevolu-
tion in healthcare,” McKinsey Quarterly, 2013.
[11] R. R. Faden, N. E. Kass, S. N. Goodman, P. Pronovost, S. Tunis, and
T. L. Beauchamp, “An ethics framework for a learning health care system:
a departure from traditional research ethics and clinical ethics,” Hastings
Center Report, vol. 43, no. s1, pp. S16–S27, 2013.
[12] G. LoBiondo-Wood and J. Haber, Nursing research: Methods and critical
appraisal for evidence-based practice. Elsevier Health Sciences, 2013.
[13] R. Ledley and L. B. Lusted, “The use of electronic computers to aid in
medical diagnosis,” Proceedings of the IRE, vol. 47, no. 11, pp. 1970–1977,
1959.
[14] C. A. Nugent, H. R. Warner, J. T. Dunn, and F. H. Tyler, “Probability
theory in the diagnosis of cushing’s syndrome,” The Journal of Clinical
Endocrinology & Metabolism, vol. 24, no. 7, pp. 621–627, 1964.
[15] W. J. Clancey, E. H. Shortliffe, and B. G. Buchanan, “Intelligent computer-
aided instruction for medical diagnosis,” in Proceedings of the Annual Sym-
posium on Computer Application in Medical Care, p. 175, American Medical
Informatics Association, 1979.
228

[16] G. J. Kuperman, R. M. Gardner, and T. A. Pryor, “The pharmacy ap-
plication of the help system,” in HELP: A Dynamic Hospital Information
System, pp. 168–172, Springer, 1991.
[17] H. R. Warner, Computer–Assisted Medical Decision-Making. Academic
Press, Inc., 1979.
[18] H. Lindgren, “Integrating clinical decision support system development into
a development process of clinical practice–experiences from dementia care,”
in Artificial Intelligence in Medicine, pp. 129–138, Springer, 2011.
[19] S. B. Clauser, E. H. Wagner, E. J. Aiello Bowles, L. Tuzzio, and S. M.
Greene, “Improving modern cancer care through information technology,”
American journal of preventive medicine, vol. 40, no. 5, pp. S198–S207,
2011.
[20] P. J. OConnor, J. M. Sperl-Hillen, W. A. Rush, P. E. Johnson, G. H.
Amundson, S. E. Asche, H. L. Ekstrom, and T. P. Gilmer, “Impact of
electronic health record clinical decision support on diabetes care: a ran-
domized trial,” The Annals of Family Medicine, vol. 9, no. 1, pp. 12–21,
2011.
[21] S. H. Luitjes, M. G. Wouters, A. Franx, H. C. Scheepers, V. M. Coupe,
H. Wollersheim, E. A. Steegers, M. P. Heringa, R. P. Hermens, and M. W.
van Tulder, “Study protocol open access,” 2010.
[22] R. F. DeBusk, N. Houston-Miller, and L. Raby, “Clinical validation of a de-
cision support system for acute coronary syndromes,” Journal of the Amer-
ican College of Cardiology, vol. 55, no. 10, pp. A132–E1240, 2010.
[23] P. Khong and R. Ren, “Healthcare information system: building a cy-
ber database for educated decision making,” International Journal of Mod-
elling, Identification and Control, vol. 12, no. 1, pp. 133–140, 2011.
[24] A. Wright, D. F. Sittig, J. S. Ash, D. W. Bates, J. Feblowitz, G. Fraser,
S. M. Maviglia, C. McMullen, W. P. Nichol, J. E. Pang, et al., “Governance
229

for clinical decision support: case studies and recommended practices from
leading institutions,” Journal of the American Medical Informatics Associ-
ation, pp. jamia–2009, 2011.
[25] S. Eslami, N. F. d. Keizer, and A. Abu-Hanna, “The impact of comput-
erized physician medication order entry in hospitalized patientsa system-
atic review,” International journal of medical informatics, vol. 77, no. 6,
pp. 365–376, 2008.
[26] D. L. Hunt, R. B. Haynes, S. E. Hanna, and K. Smith, “Effects of computer-
based clinical decision support systems on physician performance and pa-
tient outcomes: a systematic review,” Jama, vol. 280, no. 15, pp. 1339–1346,
1998.
[27] G. Zuccotti, F. Maloney, J. Feblowitz, L. Samal, L. Sato, A. Wright, et al.,
“Reducing risk with clinical decision support,” Appl Clin Inform, vol. 5,
no. 3, pp. 746–756, 2014.
[28] M. A. Steinman, S. M. Handler, J. H. Gurwitz, G. D. Schiff, and K. E.
Covinsky, “Beyond the prescription: medication monitoring and adverse
drug events in older adults,” Journal of the American Geriatrics Society,
vol. 59, no. 8, pp. 1513–1520, 2011.
[29] M. W. Jaspers, M. Smeulers, H. Vermeulen, and L. W. Peute, “Effects of
clinical decision-support systems on practitioner performance and patient
outcomes: a synthesis of high-quality systematic review findings,” Journal
of the American Medical Informatics Association, vol. 18, no. 3, pp. 327–
334, 2011.
[30] T. J. Bright, A. Wong, R. Dhurjati, E. Bristow, L. Bastian, R. R. Coeytaux,
G. Samsa, V. Hasselblad, J. W. Williams, M. D. Musty, et al., “Effect of
clinical decision-support systemsa systematic review,” Annals of internal
medicine, vol. 157, no. 1, pp. 29–43, 2012.
230

[31] L. Ahmadian, M. van Engen-Verheul, F. Bakhshi-Raiez, N. Peek, R. Cornet,
and N. F. de Keizer, “The role of standardized data and terminological
systems in computerized clinical decision support systems: literature review
and survey,” International journal of medical informatics, vol. 80, no. 2,
pp. 81–93, 2011.
[32] R. B. Haynes, N. L. Wilczynski, et al., “Effects of computerized clinical de-
cision support systems on practitioner performance and patient outcomes:
methods of a decision-maker-researcher partnership systematic review,” Im-
plement Sci, vol. 5, no. 1, p. 12, 2010.
[33] K. Kawamoto, G. Del Fiol, C. Orton, and D. F. Lobach, “System-agnostic
clinical decision support services: benefits and challenges for scalable deci-
sion support,” The open medical informatics journal, vol. 4, p. 245, 2010.
[34] G. Ivbijaro, L. Kolkiewicz, L. McGee, and M. Gikunoo, “Addressing long-
term physical healthcare needs in a forensic mental health inpatient pop-
ulation using the uk primary care quality and outcomes framework (qof):
an audit,” Mental health in family medicine, vol. 5, no. 1, p. 51, 2008.
[35] F. Burstein, P. Brezillon, and A. Zaslavsky, Supporting real time decision-
making. Springer, 2011.
[36] S. G. Mohiuddin, Enabling health, independence and wellbeing for patients
with bipolar disorder through Personalised Ambient Monitoring. PhD thesis,
University of Southampton, 2011.
[37] D. C. Classen, S. Phansalkar, and D. W. Bates, “Critical drug-drug in-
teractions for use in electronic health records systems with computerized
physician order entry: review of leading approaches,” Journal of patient
safety, vol. 7, no. 2, pp. 61–65, 2011.
[38] G. J. Kuperman, A. Bobb, T. H. Payne, A. J. Avery, T. K. Gandhi,
G. Burns, D. C. Classen, and D. W. Bates, “Medication-related clinical
decision support in computerized provider order entry systems: a review,”
231

Journal of the American Medical Informatics Association, vol. 14, no. 1,
pp. 29–40, 2007.
[39] E. H. Shortliffe, “Update on oncocin: a chemotherapy advisor for clinical
oncology,” Informatics for Health and Social Care, vol. 11, no. 1, pp. 19–21,
1986.
[40] V. Yu, P. Hewson, and E. Hollingsworth, “Iatrogenic hazards of neonatal
intensive care in extremely low birthweight infants,” Journal of Paediatrics
and Child Health, vol. 15, no. 4, pp. 233–237, 1979.
[41] F. Hayes-Roth, D. A. Waterman, and D. B. Lenat, “Building expert sys-
tem,” 1983.
[42] T. Gruber, “What is an ontology,” 1993.
[43] B. E. Herbert and A. Enderton, “mathematical introduction to logic,” 1972.
[44] J. M. Mortensen, E. P. Minty, M. Januszyk, T. E. Sweeney, A. L. Rector,
N. F. Noy, and M. A. Musen, “Using the wisdom of the crowds to find
critical errors in biomedical ontologies: a study of snomed ct,” Journal of
the American Medical Informatics Association, pp. amiajnl–2014, 2014.
[45] M. Bouamrane, A. Rector, and M. Hurrell, “Gathering precise patient med-
ical history with an ontology-driven adaptive questionnaire,” in Computer-
Based Medical Systems, 2008. CBMS’08. 21st IEEE International Sympo-
sium on, pp. 539–541, IEEE, 2008.
[46] M.-M. Bouamrane, A. Rector, and M. Hurrell, “Experience of using owl
ontologies for automated inference of routine pre-operative screening tests,”
in The Semantic Web–ISWC 2010, pp. 50–65, Springer, 2010.
[47] X. Zhang, B. Hu, X. Ma, P. Moore, and J. Chen, “Ontology driven decision
support for the diagnosis of mild cognitive impairment,” Computer methods
and programs in biomedicine, vol. 113, no. 3, pp. 781–791, 2014.
232

[48] S. Abidi, J. Cox, S. S. R. Abidi, and M. Shepherd, “Using owl ontologies
for clinical guidelines based comorbid decision support,” in System Science
(HICSS), 2012 45th Hawaii International Conference on, pp. 3030–3038,
IEEE, 2012.
[49] B. Yuan and J. Herbert, “Context-aware hybrid reasoning framework for
pervasive healthcare,” Personal and ubiquitous computing, vol. 18, no. 4,
pp. 865–881, 2014.
[50] M. B. Sesen, R. Banares-Alcantara, J. Fox, T. Kadir, and J. Brady, “Lung
cancer assistant: An ontology-driven, online decision support prototype
for lung cancer treatment selection,” in OWL: Experiences and Directions
Workshop (OWLED), 2012.
[51] M. B. Sesen, E. Jimenez-Ruiz, R. Banares-Alcantara, and M. Brady, “Eval-
uating owl 2 reasoners in the context of clinical decision support in lung
cancer treatment selection.,” in ORE, pp. 121–127, 2013.
[52] S. Capewell and H. Graham, “Will cardiovascular disease prevention widen
health inequalities?,” PLoS medicine, vol. 7, no. 8, p. e1000320, 2010.
[53] C. Q. Commission et al., “Closing the gap. tackling cardiovascular disease
and health inequalities by prescribing statins and stop smoking services,”
CQC: London, 2009.
[54] T. Thom, N. Haase, W. Rosamond, V. Howard, J. Rumsfeld, T. Manolio,
Z. Zheng, K. Flegal, C. Odonnell, S. Kittner, et al., “Heart disease and
stroke statistics2006 update,” Circulation, vol. 113, no. 6, pp. e85–e151,
2006.
[55] A. S. Go, D. Mozaffarian, V. L. Roger, E. J. Benjamin, J. D. Berry, M. J.
Blaha, S. Dai, E. S. Ford, C. S. Fox, S. Franco, et al., “Heart disease and
stroke statistics–2014 update: a report from the american heart associa-
tion.,” Circulation, vol. 129, no. 3, p. e28, 2014.
233

[56] K. Farooq, A. Hussain, S. Leslie, C. Eckl, and W. Slack, “Ontology-driven
cardiovascular decision support system,” in Pervasive Computing Technolo-
gies for Healthcare (PervasiveHealth), 2011 5th International Conference
on, pp. 283–286, IEEE, 2011.
[57] K. Farooq, A. Hussain, S. Leslie, C. Eckl, C. MacRae, and W. Slack, “An
ontology driven and bayesian network based cardiovascular decision support
framework,”
[58] K. Farooq, A. Hussain, S. Leslie, C. Eckl, C. MacRae, and W. Slack, “Se-
mantically inspired electronic healthcare records,” Advances in Brain In-
spired Cognitive Systems, pp. 42–51, 2012.
[59] K. Farooq, P. Yang, A. Hussain, K. Huang, C. MacRae, C. Eckl, and
W. Slack, “Efficient clinical decision making by learning from missing clin-
ical data,” in Computational Intelligence in Healthcare and e-health (CI-
CARE), 2013 IEEE Symposium on, pp. 27–33, IEEE, 2013.
[60] K. Farooq, A. Hussain, H. Atassi, S. Leslie, C. Eckl, C. MacRae, and
W. Slack, “A novel clinical expert system for chest pain risk assessment,”
in Advances in Brain Inspired Cognitive Systems, pp. 296–307, Springer,
2013.
[61] K. Farooq, J. Karasek, H. Atassi, A. Hussain, P. Yang, C. MacRae, M. Mah-
mud, B. Luo, and W. Slack, “A novel cardiovascular decision support frame-
work for effective clinical risk assessment,” in Computational Intelligence
in Healthcare and e-health (CICARE), 2014 IEEE Symposium on, pp. 117–
124, IEEE, 2014.
[62] I. U. Haq, L. E. Ramsay, W. W. Yeo, P. R. Jackson, and E. J. Wallis, “Is
the framingham risk function valid for northern european populations? a
comparison of methods for estimating absolute coronary risk in high risk
men,” Heart, vol. 81, no. 1, pp. 40–46, 1999.
234
[63] T. Tillin, A. D. Hughes, P. Whincup, J. Mayet, N. Sattar, P. M. McKeigue,
N. Chaturvedi, M. Baker, N. Beauchamp, E. Coady, et al., “Ethnicity and
prediction of cardiovascular disease: performance of qrisk2 and framingham
scores in a uk tri-ethnic prospective cohort study (sabresouthall and brent
revisited),” Heart, vol. 100, no. 1, pp. 60–67, 2014.
[64] T. van der Weijden, A. H. Pieterse, M. S. Koelewijn-van Loon, L. Knaapen,
F. Legare, A. Boivin, J. S. Burgers, A. M. Stiggelbout, M. Faber, and
G. Elwyn, “How can clinical practice guidelines be adapted to facilitate
shared decision making? a qualitative key-informant study,” BMJ quality
& safety, vol. 22, no. 10, pp. 855–863, 2013.
[65] A. Diederichsen, A. Mahabadi, N. Lehmann, N. Sand, S. Moebus, J. Lam-
brecthsen, H. Munkholm, K.-H. Joeckel, R. Erbel, and H. Mickley, “Ability
of heartscore to identify coronary calcifications: Results from the danrisk
study and the heinz nixdorf recall study,” European Heart Journal, vol. 34,
no. suppl 1, p. P1541, 2013.
[66] H. Støvring, C. G. Harmsen, T. Wisløff, D. E. Jarbøl, J. Nexøe, J. B.
Nielsen, and I. S. Kristiansen, “A competing risk approach for the euro-
pean heart score model based on cause-specific and all-cause mortality,”
European journal of preventive cardiology, vol. 20, no. 5, pp. 827–836, 2013.
[67] M. Willems, D. van de Wijngaart, H. Bergman, A. Adiyaman, D. Telting,
and F. Willems, “Addition of heart score to high-sensitivity troponin t
versus conventional troponin t in risk stratification of patients with chest
pain at the coronary emergency rooms,” Netherlands Heart Journal, pp. 1–
5, 2014.
[68] D. Ali, M. Fokkert, R. Slingerland, R. Tolsma, M. Ishak, F. Van Eenen-
naam, K. Bruheim, J. Ten Berg, A. Hoes, and A. Van ’T Hof, “Feasibility
of pre-hospital chest pain triage at home or in the ambulance by paramedics
using the heart score based upon a single high-sensitive troponin t analysis,”
vol. 34, no. suppl 1, 2013.
235

[69] C.-L. Chi, “Medical decision support systems based on machine learning,”
Theses and Dissertations, p. 283, 2009.
[70] C. Zhang and Y. Ma, Ensemble Machine Learning. Springer, 2012.
[71] J. Nahar, T. Imam, K. S. Tickle, and Y.-P. P. Chen, “Computational intel-
ligence for heart disease diagnosis: A medical knowledge driven approach,”
Expert Systems with Applications, vol. 40, no. 1, pp. 96–104, 2013.
[72] C. F. Aliferis, A. Statnikov, I. Tsamardinos, S. Mani, and X. D. Koutsoukos,
“Local causal and markov blanket induction for causal discovery and feature
selection for classification part i: Algorithms and empirical evaluation,” The
Journal of Machine Learning Research, vol. 11, pp. 171–234, 2010.
[73] M. A. Hall and G. Holmes, “Benchmarking attribute selection techniques
for discrete class data mining,” Knowledge and Data Engineering, IEEE
Transactions on, vol. 15, no. 6, pp. 1437–1447, 2003.
[74] A. Bellaachia and E. Guven, “Predicting breast cancer survivability using
data mining techniques,” Age, vol. 58, no. 13, pp. 10–110, 2006.
[75] L. J. Lancashire, D. Powe, J. Reis-Filho, E. Rakha, C. Lemetre, B. Weigelt,
T. Abdel-Fatah, A. R. Green, R. Mukta, R. Blamey, et al., “A validated
gene expression profile for detecting clinical outcome in breast cancer using
artificial neural networks,” Breast cancer research and treatment, vol. 120,
no. 1, pp. 83–93, 2010.
[76] N. Nnamoko, F. Arshad, D. England, J. Vora, and J. Norman, “Evaluation
of filter and wrapper methods for feature selection in supervised machine
learning,” Age, vol. 21, no. 81, pp. 33–2.
[77] P. Pudil, F. Ferri, J. Novovicova, and J. Kittler, “Floating search methods
for feature selection with nonmonotonic criterion functions,” in In Pro-
ceedings of the Twelveth International Conference on Pattern Recognition,
IAPR, Citeseer, 1994.
236

[78] M. C. Baker, A. S. Kerr, E. Hames, and K. Akrofi, “An sffs technique
for eeg feature classification to identify sub-groups,” in Computer-Based
Medical Systems (CBMS), 2012 25th International Symposium on, pp. 1–4,
IEEE, 2012.
[79] H. Peng, F. Long, and C. Ding, “Feature selection based on mutual infor-
mation criteria of max-dependency, max-relevance, and min-redundancy,”
Pattern Analysis and Machine Intelligence, IEEE Transactions on, vol. 27,
no. 8, pp. 1226–1238, 2005.
[80] M.-M. Bouamrane, A. Rector, and M. Hurrell, “Semi-automatic generation
of a patient preoperative knowledge-base from a legacy clinical database,”
in On the Move to Meaningful Internet Systems: OTM 2009, pp. 1224–1237,
Springer, 2009.
[81] M.-M. Bouamrane, A. Rector, and M. Hurrell, “Using owl ontologies for
adaptive patient information modelling and preoperative clinical decision
support,” Knowledge and information systems, vol. 29, no. 2, pp. 405–418,
2011.
[82] D. A. Ludwick and J. Doucette, “Adopting electronic medical records in pri-
mary care: lessons learned from health information systems implementation
experience in seven countries,” International journal of medical informatics,
vol. 78, no. 1, pp. 22–31, 2009.
[83] D. B. Suits, “Use of dummy variables in regression equations,” Journal of
the American Statistical Association, vol. 52, no. 280, pp. 548–551, 1957.
[84] T. Mazzocco, A. Hussain, S. Hussain, and A. A. Shah, “A novel mortality
model for acute alcoholic hepatitis including variables recorded after admis-
sion to hospital,” Computers in biology and medicine, vol. 44, pp. 132–135,
2014.
[85] A. Field, Discovering statistics using IBM SPSS statistics. Sage, 2013.
237

[86] A. R. Feinstein, Multivariable analysis: an introduction. Yale University
Press, 1996.
[87] T. Mazzocco and A. Hussain, “Novel logistic regression models to aid the
diagnosis of dementia,” Expert Systems with Applications, vol. 39, no. 3,
pp. 3356–3361, 2012.
[88] R. L. Ott, M. Longnecker, and L. Ott, A first course in statistical methods.
Thomson-Brooks/Cole, 2004.
[89] S. Menard, Applied logistic regression analysis, vol. 106. Sage, 2002.
[90] J. A. Cornell, “Classical and modern regression with applications,” Tech-
nometrics, vol. 29, no. 3, pp. 377–378, 1987.
[91] P. S. Bradley, U. M. Fayyad, and O. L. Mangasarian, “Mathematical pro-
gramming for data mining: formulations and challenges,” INFORMS Jour-
nal on Computing, vol. 11, no. 3, pp. 217–238, 1999.
[92] I. H. Witten and E. Frank, Data Mining: Practical machine learning tools
and techniques. Morgan Kaufmann, 2005.
[93] J. A. Jacko, Human Computer Interaction Handbook: Fundamentals, Evolv-
ing Technologies, and Emerging Applications. CRC press, 2012.
[94] M.-O. Houziaux and P. J. Lefebvre, “Historical and methodological aspects
of computer-assisted medical history-taking,” Informatics for Health and
Social Care, vol. 11, no. 2, pp. 129–143, 1986.
[95] A. van Ginneken, M. de Wilde, and C. Blok, “Generic computer-based
questionnaires: an extension to opensde,” in Proceedings of 11th World
Congress on Medical Informatics, MEDINFO, pp. 688–692, 2004.
[96] M. Vahabzadeh, D. Epstein, M. Mezghanni, J.-L. Lin, and K. Preston,
“An electronic diary software for ecological momentary assessment (ema)
in clinical trials,” in Computer-Based Medical Systems, 2004. CBMS 2004.
Proceedings. 17th IEEE Symposium on, pp. 167–172, IEEE, 2004.
238

[97] I. Horrocks, P. F. Patel-Schneider, and F. Van Harmelen, “From shiq and
rdf to owl: The making of a web ontology language,” Web semantics: sci-
ence, services and agents on the World Wide Web, vol. 1, no. 1, pp. 7–26,
2003.
[98] V. A. Palda and A. S. Detsky, “Perioperative assessment and management
of risk from coronary artery disease,” Annals of internal medicine, vol. 127,
no. 4, pp. 313–328, 1997.
[99] F. McArthur-Rouse, “Critical care outreach services and early warning scor-
ing systems: a review of the literature,” Journal of Advanced Nursing,
vol. 36, no. 5, pp. 696–704, 2001.
[100] J. Tenkorang, K. Fox, T. Collier, and D. Wood, “A rapid access cardiology
service for chest pain, heart failure and arrhythmias accurately diagnoses
cardiac disease and identifies patients at high risk: a prospective cohort
study,” Heart, vol. 92, no. 8, pp. 1084–1090, 2006.
[101] A. Cooper, A. Timmis, and J. Skinner, “Assessment of recent onset chest
pain or discomfort of suspected cardiac origin: summary of nice guidance,”
BMJ, vol. 340, 2010.
[102] R. G. Miller Jr, Beyond ANOVA: basics of applied statistics. CRC Press,
1997.
[103] C. Feied, J. Handler, M. Smith, M. Gillam, M. Kanhouwa, T. Rothenhaus,
K. Conover, and T. Shannon, “Clinical information systems: instant ubiq-
uitous clinical data for error reduction and improved clinical outcomes,”
Academic emergency medicine, vol. 11, no. 11, pp. 1162–1169, 2004.
[104] Z. Ghahramani and M. Jordan, “Supervised learning from incomplete data
via an em approach,” in Advances in Neural Information Processing Sys-
tems 6, Citeseer, 1994.
239

[105] J. O. Moore, CollaboRhythm: new paradigms in doctor-patient interaction
applied to HIV medication adherence. PhD thesis, Massachusetts Institute
of Technology, 2009.
[106] E. Cambria, A. Hussain, T. Durrani, C. Havasi, C. Eckl, and J. Munro,
“Sentic computing for patient centered applications,” in Signal Process-
ing (ICSP), 2010 IEEE 10th International Conference on, pp. 1279–1282,
IEEE, 2010.
[107] B. Kosko, “Fuzzy cognitive maps,” International Journal of man-machine
studies, vol. 24, no. 1, pp. 65–75, 1986.
[108] C. Silva, M. Antunes, J. Costa, and B. Ribeiro, “Active manifold learning
with twitter big data,” Procedia Computer Science, vol. 53, pp. 208–215,
2015.
[109] J. B. Tenenbaum, V. De Silva, and J. C. Langford, “A global geomet-
ric framework for nonlinear dimensionality reduction,” Science, vol. 290,
no. 5500, pp. 2319–2323, 2000.
[110] D. F. Specht, “A general regression neural network,” Neural Networks,
IEEE Transactions on, vol. 2, no. 6, pp. 568–576, 1991.
[111] T.-Y. Liu, “Learning to rank for information retrieval,” Foundations and
Trends in Information Retrieval, vol. 3, no. 3, pp. 225–331, 2009.
240