a novel two-disc machine for high precision friction
TRANSCRIPT

Research ArticleA Novel Two-Disc Machine for High PrecisionFriction Assessment
JakobModer, Florian Grün, Michael Stoschka, and István Gódor
Chair of Mechanical Engineering, Montanuniversitat Leoben, Franz-Josef-Straße 18, 8700 Leoben, Austria
Correspondence should be addressed to Jakob Moder; [email protected]
Received 13 March 2017; Revised 18 May 2017; Accepted 25 May 2017; Published 28 June 2017
Academic Editor: Michael M. Khonsari
Copyright © 2017 Jakob Moder et al. This is an open access article distributed under the Creative Commons Attribution License,which permits unrestricted use, distribution, and reproduction in any medium, provided the original work is properly cited.
The concept of two-disc model testing has proven to deliver valuable information for the applicability of new technologies, suchas surface structuring, coatings, alternative fluids, or advanced materials, in actual machine elements. In this article an advancedtwo-disc machine with sophisticated control technology for dry and lubricated setup is presented. (i) All involved components arecontrolled via a powerful PLC unit leading to the possibility of realising extremely accurate SRRs down to 0.1%. (ii) High-speeddata acquisition allows local insight into tribological phenomena by providing 72 data points along one shaft rotation. (iii) Severallubrication scenarios such as fluid, mixed, and starved lubrication, as well as dry contacts, can be considered. (iv) Raw-data of allsensors, including normal force, friction force, vibration speed, stiffness (wear), infrared temperature, contact potential, and motorspeed, is presented. Some example results of dry polymer-steel tribosystems and lubricated experiments are shown to elucidate thecapabilities of the novel test rig.
1. Introduction
Thehistory of two-discmodel testing goes back to 1935, when[1] introduced an apparatus for a simplified testing of wormgears. Ever since then this type of machines has becomemorepopular among researchers, due to easy usage and compa-rability of test results to actual machine components. Thesimple cylindrical geometry enables a precise measurementof the friction force in the contact. Also, operating conditions,such as rolling velocity, slide-to-roll ratio, or contact pressure,in terms of normal force, can be adjusted easily. Furthermore,the machining of discs is more effective from an economicpoint of view in contrast to the complicated manufacturingprocess of gears. The tribological behaviour of machineelements, as for instance gears, is depending on operatingconditions, lubrication (especially viscosity and additives ofthe oil), and surface structure [2]. The latter two factors canbe depicted equivalently with a two-disc machine; howevergears generally operate under transient conditions, due tothe continuously changing normal force, sliding velocity,and contact radii, along the line of action [3]. A two-discexperiment typically depicts the operating states of a gearcontact which are of greatest interest stationarily.
On the one hand such tests are carried out for a specificservicing point to determine the rolling contact fatigue (RCF)of certain tribological systems. Lifetime results of discs can betransferred to actual gears under certain conditions, as, forinstance, explained in [4] or [5]. However, one has to keep inmind that transient phenomena seen in gears are impossibleto reproduce with discs. Due to the high contact stresses, of atleast 3GPa, required for RCF testing, test-rigs are typically bigand have to operate under severe loads, which requires highmaintenance efforts and makes an accurate measurement offriction forces not feasible.
On the other hand, two-disc machines are employedfor friction measurements of tribological contacts. It hasbeen shown on numerous occasions [6, 7] that two-discexperiments can indicate how different aspects, such as fluid,surface finishing, surface texturing, or coatings, will affect thefriction in gear systems.
With time machines have become more sophisticated,especially the advent of modern control technology openedthe way to new testing concepts. While the older test-rigswere restricted to certain slide-to-roll ratios (SRR), typicallydetermined by disc diameter or mechanical gear ratios, the
HindawiAdvances in TribologyVolume 2017, Article ID 8901907, 16 pageshttps://doi.org/10.1155/2017/8901907

2 Advances in Tribology
Disc 1Disc 2FNFN
FR1
FR2
n1n2
Figure 1: Basic principle of a two-disc machine.
usage of electrical drives allows a more precise setting ofarbitrary SRRs. Nowadays numerous research facilities haveengineered two-disc machines [8–12], which basically differin type of frictional force measurement.
In contrast to other machines the presented test rig inte-grates several components in a programmable logic controller(PLC). This permits the evaluation and setting of parametersin real-time, enabling, for instance, a control loop betweenboth motors leading to extremely accurate SRRs down to0.1%. Furthermore, the option to perform fully automatedtests and data evaluation procedures is implemented. Due tothe high computational power of the PLC a high-speed dataevaluation, allowing detailed insight into local phenomena oftribological systems, becomes feasible. Also,multiple sensors,for the analysis of vibrations, stiffness, wear, temperatures,and contact potential, are integrated in order to gain aprofound understanding of the tested tribosystems. Raw-dataof all sensors is presented, while other papers typically onlypublish postprocessed traction curves.
2. Machine Setup
The basic principle of a two-disc machine is depicted inFigure 1.
The discs are loaded with a normal force 𝐹𝑁and rotating
with speeds 𝑛1and 𝑛
2. When the speeds of the discs are
not equal, a friction force vector, with equal norm butdifferent direction, results on the surfaces of both discs. Thisforce ultimately determines the frictional performance of thetribological system and is therefore the desired quantity to bemeasured. In the case of cylindrical specimens, the directionof the friction force vector is time independent, contrary togears, where the friction vector is changing with time alongthe line of action, which makes it difficult to diagnose.
Several methods exist in order to measure the frictionforce in two-disc machines. One way is the usage of torquetransducers, which are applied to a shaft on which themachine element of interest is mounted. Papers [11, 12] are,for example, employing this technique for friction forcedetermination in their test-rigs. However, one has to considerthat parasitic influences, such as losses of roller bearingsof the shaft, or sealing losses, are measured as well bythis setup. Depending on the type of roller bearings andsealings in the machine, it can therefore be very difficult todetermine the actual friction force accurately in the contact.Another possibility is the usage of a force transducer, whichis positioned in line to measure the friction directly, as, for
FTD
a
A
Oil
Disc 1Disc 2
FN
FL
n1n2
Figure 2: Measurement concept of the presented two-disc test rig.
instance, described in [9]. This way, the measurement ofparasitic forces can basically be avoided.
The direct friction force measurement principle via forcetransducer is employed in the presented test rig, which isbased on previous developments at the Chair of MechanicalEngineering, Montanuniversitat Leoben [13, 14], as illustratedin Figure 2.
The shaft of disc 2 is mounted in a housing, which canrotate with respect to point 𝐴; therefore any friction forceappearing on disc 2 is directed to the force transducer viashaft, bearings, and housing. The force measured is denotedas 𝐹𝐿, whereby it has to be taken into account that the weight
force of the housing and its components is measured as well.This force is quantified by a highly precise force transducer,in our case a uniaxial, laterally compensated force transducerof type HBM U10M.
Figure 3 displays a cut through the fluid chamber, of thecomputer-aided-design (CAD) assembly, and a photographof the actual test rig, which has been taken during anexperiment with grease lubrication. Note that the view of thephotograph is rotated ninety degrees clockwise with respectto the CAD image.
The disc specimens, which have a diameter of 50mm,are mounted onto the respective shaft with a spring key andfixed axially by a screw. The normal force is induced into thesystem by a Norgren pneumatic cylinder via the rear of thehousing, which also mounts shaft 1. On the left of Figure 3the initiation of the normal force is illustrated by the vector𝐹𝑁. The mechanism for the application of the normal force ispresented in Figure 4. To make sure that the desired amountof force is applied, a force transducer is placed directly in theloading path next to the cylinder. A roller is used to transferthe load into the system in order to eliminate disturbanceswhich can affect the friction measurement.
Flywheels can be mounted on the shafts optionally toincrease the moment of inertia of the system in orderto prevent motor control issues when high friction forcesspontaneously (e.g., seizure) occur in the contact. For theresults presented in this article no flywheels are used. Eachshaft is connected to a motor by employing a coupling.

Advances in Tribology 3
Lubrication foam
Oil supply for foam Infrared temperature sensor
Hole for heating elementDisc specimens
Injection nozzle
Lubrication chamber
Thermocouple holder Contact potential ground
Force transducer
Vibration sensor
Heating element
LVDT sensor
1
2
FN
(a) (b)
Figure 3: Cut through the lubrication chamber (a) and photograph of the machine (b).
Coupling
Flywheel (optional)
FN
(a)
Roller
(b)
Figure 4: Application of the normal force by a pneumatic cylinder. Rear view (a) and force application via a roller (b).

4 Advances in Tribology
Spacer plates
Housing adjustment
Figure 5: Options for contact alignment.
In order to adjust the alignment of the disc specimens,which is paramount for performing high quality measure-ments, several options are available, which are highlighted inFigure 5.
The horizontal position of the housing, which mountsshaft 2, can be adjusted via screws and the vertical positionof shaft 1 is precisely set by utilising spacer plates with athickness of 0.1 mm. The alignment is considered successfulwhen an application of the normal force is not alteringthe friction force (±1 N), whereby the motors are switchedoff. Furthermore, a pressure foil (Fujifilm), which locallydetermines the pressure by colouring, is utilised in order toguarantee an optimal contact pattern.
A piezoelectric vibration sensor is integrated into themachine for the detection of wear phenomena or specimenwith intolerable eccentricity.
Several lubrication scenarios, from dry to fully floodedconditions, can be realised with this test rig. In the case ofsplash lubrication, the chamber is filled with a volume ofabout 250ml fluid. This ensures that both discs are dipped11mm into the fluid. There is a small gap between thelubrication chamber and the shaft of disc 2, which can causeminor leakage when the machine is operating under highspeed. However, additional fluid can be provided via theinjection nozzle in this case. The primary field of use for theinjection nozzle is the analysis of starved lubrication systems;therefore a LECHLER pneumatic nebuliser is installed in thetest machine. The amount of injected fluid is controlled by aFESTO LR DB pneumatic control unit, which permits a finedosage of fluid air mixture to be injected directly into thecontact line of the discs. To investigate even severe starvedlubrication conditions, a foam holder, which is pressing anoil soaked foam unit onto disc 2, is available as well.
Another important issue is the control of the lubricationchamber temperature. Hence, the machine is equipped withfour heating elements with a power of 150W each, which aremounted directly in the aluminium lubrication chamber foroptimal heat transfer to the fluid. The agile control loop can
Disc pair
U
I
U1
U2 R2 R3
R1
Figure 6: Electrical circuit for contact potential measurement.
Table 1: Set variables for the two-disc machine.
Name (abbreviation) Value rangeSlide-to-roll ratio (𝑠, SRR) 0–200%Normal force (𝐹
𝑁) 100–2000N
Speed (𝑛1, 𝑛2) 0–4500 rpm
Temperature (𝑇0) RT–150∘C
Fluid injection (��in) 20ml/min–300ml/min
heat the lubricant from room temperature to about 65∘C inonly forty seconds.
A linear variable differential transformer (LVDT) sensoris integrated into the machine for stiffness and wear mea-surements. This transducer can resolve length scales in rangeof microns and is therefore suitable for wear investigations.This sensor is positioned on the housing, which can rotatewith respect to point 𝐴, as illustrated in Figure 2. Therefore,any wear or changes of stiffness, which can for instanceoccur temperature dependently, are directly translated intothe housing and measured via the displacement sensor.
Three different temperature sensors are mounted aroundthe chamber and a thermocouple holder is fixed in thechamber directly, allowing for Type-K thermoelements tomeasure the temperature of the oil.
Furthermore, an infrared sensor ismeasuring the temper-ature on the surface of disc 2 at an angle of 135∘ next to thecontact line.
Housing and shaft of disc 1 are electrically isolatedwith respect to disc 2 which allows a contact resistancemeasurement of the tribological system and therefore binaryjudgement of the state of friction. A sketch explainingthe contact potential measurement system is provided inFigure 6.
All set variables, as well as measured properties, aredepicted in Tables 1 and 2, respectively.
Advances in Tribology 5
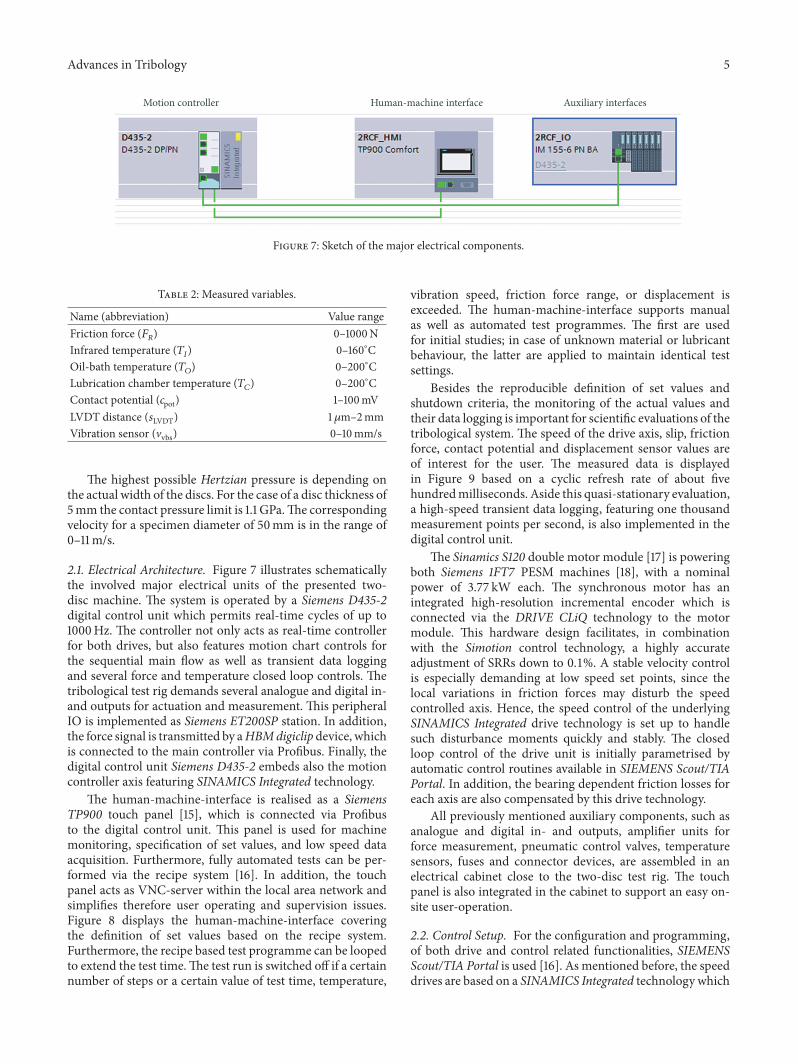
Motion controller Human-machine interface Auxiliary interfaces
Figure 7: Sketch of the major electrical components.
Table 2: Measured variables.
Name (abbreviation) Value rangeFriction force (𝐹
𝑅) 0–1000N
Infrared temperature (𝑇𝐼) 0–160∘C
Oil-bath temperature (𝑇𝑂) 0–200∘C
Lubrication chamber temperature (𝑇𝐶) 0–200∘C
Contact potential (𝑐pot) 1–100mVLVDT distance (𝑠LVDT) 1 𝜇m–2mmVibration sensor (Vvbs) 0–10mm/s
The highest possible Hertzian pressure is depending onthe actual width of the discs. For the case of a disc thickness of5mm the contact pressure limit is 1.1 GPa.The correspondingvelocity for a specimen diameter of 50mm is in the range of0–11m/s.
2.1. Electrical Architecture. Figure 7 illustrates schematicallythe involved major electrical units of the presented two-disc machine. The system is operated by a Siemens D435-2digital control unit which permits real-time cycles of up to1000Hz. The controller not only acts as real-time controllerfor both drives, but also features motion chart controls forthe sequential main flow as well as transient data loggingand several force and temperature closed loop controls. Thetribological test rig demands several analogue and digital in-and outputs for actuation and measurement. This peripheralIO is implemented as Siemens ET200SP station. In addition,the force signal is transmitted by aHBMdigiclip device, whichis connected to the main controller via Profibus. Finally, thedigital control unit Siemens D435-2 embeds also the motioncontroller axis featuring SINAMICS Integrated technology.
The human-machine-interface is realised as a SiemensTP900 touch panel [15], which is connected via Profibusto the digital control unit. This panel is used for machinemonitoring, specification of set values, and low speed dataacquisition. Furthermore, fully automated tests can be per-formed via the recipe system [16]. In addition, the touchpanel acts as VNC-server within the local area network andsimplifies therefore user operating and supervision issues.Figure 8 displays the human-machine-interface coveringthe definition of set values based on the recipe system.Furthermore, the recipe based test programme can be loopedto extend the test time.The test run is switched off if a certainnumber of steps or a certain value of test time, temperature,
vibration speed, friction force range, or displacement isexceeded. The human-machine-interface supports manualas well as automated test programmes. The first are usedfor initial studies; in case of unknown material or lubricantbehaviour, the latter are applied to maintain identical testsettings.
Besides the reproducible definition of set values andshutdown criteria, the monitoring of the actual values andtheir data logging is important for scientific evaluations of thetribological system. The speed of the drive axis, slip, frictionforce, contact potential and displacement sensor values areof interest for the user. The measured data is displayedin Figure 9 based on a cyclic refresh rate of about fivehundredmilliseconds. Aside this quasi-stationary evaluation,a high-speed transient data logging, featuring one thousandmeasurement points per second, is also implemented in thedigital control unit.
The Sinamics S120 double motor module [17] is poweringboth Siemens 1FT7 PESM machines [18], with a nominalpower of 3.77 kW each. The synchronous motor has anintegrated high-resolution incremental encoder which isconnected via the DRIVE CLiQ technology to the motormodule. This hardware design facilitates, in combinationwith the Simotion control technology, a highly accurateadjustment of SRRs down to 0.1%. A stable velocity controlis especially demanding at low speed set points, since thelocal variations in friction forces may disturb the speedcontrolled axis. Hence, the speed control of the underlyingSINAMICS Integrated drive technology is set up to handlesuch disturbance moments quickly and stably. The closedloop control of the drive unit is initially parametrised byautomatic control routines available in SIEMENS Scout/TIAPortal. In addition, the bearing dependent friction losses foreach axis are also compensated by this drive technology.
All previously mentioned auxiliary components, such asanalogue and digital in- and outputs, amplifier units forforce measurement, pneumatic control valves, temperaturesensors, fuses and connector devices, are assembled in anelectrical cabinet close to the two-disc test rig. The touchpanel is also integrated in the cabinet to support an easy on-site user-operation.
2.2. Control Setup. For the configuration and programming,of both drive and control related functionalities, SIEMENSScout/TIA Portal is used [16]. As mentioned before, the speeddrives are based on a SINAMICS Integrated technology which

6 Advances in Tribology
Figure 8: Recipe based set value interface including test limits settings.
Figure 9: Actual value human-machine-interface.

Advances in Tribology 7
Figure 10: Motion control chart enabling speed synchronisation for varying slip set values by virtual master axis and incorporated geartransmission for each drive axis.
Figure 11: Task profiler of D435-2 real-time control system of two-disc tester.
utilises an internal control clock frequency of eight thousandHertz. The position control of the D435-2 defines the motionof both axes by implementation of a virtual master axis.A common synchronism is guaranteed as the speed of thisvirtual master axis is modified by the given slip set valuefor each drive axis. The implemented programme sectionis shown in Figure 10. The speed set value for each axis isgenerated by the interpolator clock. To ensure a high dynamicresponse of the system, the interpolator clock is set equalto the servo clock pulse of one millisecond. To fasten theservo control further, the option Dynamic Servo Control isactivated, which causes the superimposed position controllerto be run in the clock pulse of the Simotion speed controlunit. The speed set value is interpolated based on the dataobtained from the virtual master axis. This guarantees a highbandwidth for the drive control of both test rig axes.
The real-time drive control system utilises therefore theservo task, the interpolator synchronous task, and finallythe interpolator task with an identical clock pulse of onemillisecond. The control programme is split up into motiontasks, which are processed on the basis of a certain motionrequirement or started by other tasks; servo-synchronoustasks for the conversion of IO-devices related data: cyclichigh-speed logging and evaluation of transient changes, forexample, in angular position and friction force values, is takeninto account by interpolator synchronous processing; timer-based interrupt tasks with decreased sample rates facilitatereal-time processing of closed force or temperature controlloops and logging issues; and finally, the background taskhandles the start and stop procedure of the overall test rig.Figure 11 exhibits the task profile of the D435-2 control unit.

8 Advances in Tribology
Slip
Normalforce
Running in
Time
Slip cycles
Speedmotors
Settemperature
Setfluid injection
0 10000 20000 30000 40000
Figure 12: Test programme for presented experiments.
Utmost priority has the servo task, which handles theposition control of each axis. The corresponding speedset value is continuously derived in interpolator task. Theinterpolator task covers several time-critical user-definedprocesses; hence it necessitates already about one-quarter ofthe overall available clock pulse for itself. Motion tasks arecarried out on demand; the background task is processeddependent on the free time slot between each cycle. Astransient data logging is implemented in the fast interpolatortask, it is possible to gather transient values of friction force,vibration velocity, and others within a 4k-buffer.These buffervalues are then periodically evaluated and mapped onto aresult matrix covering steps of five degree angles. This real-time based, transient data evaluation enables an improvedhigh-speed data measurement and gains additional insightinto local changes of the tribological system.
3. Experimental Results and Discussion
In this section exemplary results are presented to emphasisefunctionalities of the developed two-disc machine.
3.1. Test Programme. The term test programme is used for thedescription of all available set values as a function of time.For the experiments presented in this article, a cyclic slipprogrammewith running-in phase, as illustrated in Figure 12,is applied.
Firstly, typically one hour is spent for a running-in proce-dure of the systemand also in order to reach a thermally stable
state of the machine. Then, slip and therefore motor speedare increased (or decreased in case of the other axis) stepwiseuntil the maximum slip is reached. After the maximum slip ismaintained, an incremental decrease of the slip is performedin order to return to the initial state. Those slip cycles arerepeated throughout the experiment, whereby total time forthe test is typically in the range of four to twelve hours,depending on the number of slip cycles actually performed.The set parameters, including temperature, fluid injectionrate, and normal force, are kept constant throughout thetests presented in this paper. The slide-to-roll ratio is definedaccording to
SRR = 𝑠 = 𝑢1 − 𝑢2𝑢𝑚
(1)
whereby the mean velocity is kept constant throughout eachtest:
𝑢𝑚=𝑢1+ 𝑢2
2. (2)
3.2. Lubricated Steel-Steel Experiment. In this subsectionexperiments that are carried out with discs made of hardened42CrMo4 and super-finished surface, with a roughness of𝑅𝑎0.03 𝜇m, using a mineral oil under splash lubrication, are
presented. The thickness of one disc has been reduced from11mm to 5mm to improve contact alignment and enablethe testing of increased contact pressures. The respectiveoperating and material parameters are given in Table 3.

Advances in Tribology 9Fr
ictio
n fo
rce (
N)
S006_B5_multiple_step_GS_1000 LJG
s(%
)
Tem
pera
ture(∘
C)
Nor
mal
forc
e (N
)
Vibr
atio
n sp
eed
(mm
/s)
Spee
d (r
pm)
Time (s)Friction forceContact potentialT infraredT oil-bathSlip
Speed engine 1Speed engine 2Normal forceVibration speed
50
45
40
35
30
25
20
15
10
5
0
−5
−10
−15
−20
0 900 1800 2700 3600 4500 5400 6300 7200 8100 9000 9900 10800
30
25
20
15
10
5
0
100
95
90
85
80
75
70
65
60
55
50
2200
2000
1800
1600
1400
1200
1000
800
600
400
200
0
2000
1800
1600
1400
1200
1000
800
600
400
200
0
10095908580757065605550454035302520151050
15
14
13
12
11
10
9
8
7
6
5
4
3
2
1
0
c JIN
(%)
Figure 13: Results for a steel-steel experiment under splash lubrication.
Table 3: Operating and material parameters for lubricated steel-steel experiment.
𝑢𝑚= 2.6m/s 𝑠 = 0–25%𝑟1= 25mm 𝑟
2= 25mm
𝐸1= 210GPa 𝐸
2= 210GPa
]1= 0.3 ]
2= 0.3
𝑏1= 5mm 𝑏
2= 11mm
𝑅𝑎= 0.03 𝜇m 𝜂(𝑇 = 40∘C) = 95.52mm2/s𝑇0= 64∘C 𝑝max = 0.5GPa
A graph of selected measured variables, depending ontime, is shown in Figure 13. The test programme is startedwith a running-in phase, which lasts for one hour, followedby four slip increase-decrease cycles. It takes about 2,700 sfor the temperature control loop to reach a steady state,during this time the whole machine, including the electricmotors, is experiencing temperature changes, which lead toan elongation of components and therefore a continuouschange of the measured friction force during this phase.However, afterwards a steady state of the measured frictionforce is reached, which indicates a thermally stable system.
During each cycle, the slip is increased stepwise to itsmaximum value and then decreased to zero again. Thefriction force is, at very low slip values, increasing linearly;however shear-thinning and thermal effects cause nonlineareffects at high slip rates [19]. The oil-bath temperature isconstantly in the range of 64∘C throughout the experiment;however the infrared temperature, which is actually measur-ing the fluid film on disc 2, is experiencing more pronounced
changes, especially when slip is high. With increasing slipthe frictional power of the system is raised; consequentlyhigher temperatures can be expected. Small fluctuations,which occur independently of slip, are caused by the heatingcontrol loop. Also note that the contact potential is holdingits maximum value throughout the experiment, indicating acontinuous operation in the fluid friction regime.
The friction force measurements from Figure 13 are thenpostprocessed to derive traction curves, which show thecoefficient of friction (COF) as a function of slip, as illustratedin Figure 14. Average values for each slip-step are calculatedin order to generate these graphs. The vertical bars indicatethe standard deviation occurring along one slip-step.
The excellent reproducibility of the traction curves indi-cates stable machine conditions and the absence of wear inthe tribological system, which is also confirmed by the verylow vibration speed values seen in Figure 13. The behaviourof the fluid is therefore Newtonian below a slip rate of 0.5%;thereafter thermal effects and viscosity dependence on shearrate significantly reduce the slope of the traction curve [19].
3.3. Validation. In this part of the article the influences ofpressure, speed, and oil-bath temperature on traction curvesare investigated and compared to state-of-the-art results as,for instance, presented in [6]. Assuming that all tests areoperated under fluid lubrication, the following main findingshave been concluded in [6].
(i) Finding 1.With increasing pressure the COF is shiftingtowards higher values for all slip values.This is due tothe increasing viscosity at elevated pressure and the

10 Advances in Tribology
0 1 2 3 4 5 6 7 8 9 10 11 12 13 14 15 16 17 18 19 20 21 22 23 24 250
0.01
0.02
0.03
0.04
0.05
0.06CO
F (—
)
s (%)
c1c2
c3c4
2RCF; cycle 1 to 4; MIN1; 42CrMo4 GS vs 42CrMo4 GS; avg temp: 63.34∘C; 500-0;; 1000 20-;
Figure 14: Traction curve for a steel-steel experiment under splash lubrication.
0 1 2 3 4 5 6 7 8 9 10 11 12 13 14 15 16 17 18 19 20 21 22 23 24 250
0.01
0.02
0.03
0.04
0.05
0.06
COF
(—)
s (%)
2RCF; MIN1; 42CrMo4 GS vs 42CrMo4 GS; avg temp: 64.00∘C; 2.6 G/s;
500.0 -0;770.0-0;
Figure 15: Influence of pressure on traction.
limiting shear stress of lubricants is known to linearlyrise with pressure, which has been shown in [20].
(ii) Finding 2. A higher velocity (𝑢𝑚) is linearly raising the
frictional power at constant slip (SRR > 0). The filmthickness is increasing as well when the entrainmentspeed is raised. Experiments have shown that a higherspeed leads to a lower COF.This effect is growingwithslip since the frictional power increases with slip.
(iii) Finding 3. The oil-bath temperature is a highly influ-ential parameter since it strongly affects the lubricant’sviscosity.Therefore an elevated temperature decreasesthe COF unless the mixed lubrication regime isreached.
Results of experiments, carried out with parameters aslisted in Table 3, with exception of the currently investigatedinfluence, are presented and compared with the findingsmade by other authors.
In comparison to Figure 14 only the rising traction curveof the third cycle of the respective experiment is illustrated inthe graphs in order to improve readability.
3.3.1. Pressure Influence. Figure 15 investigates the influenceof pressure on traction. Values of 500MPa and 770MPa arecompared under otherwise same conditions.
Conclusions drawn in Finding 1 can be confirmed bythis test. Also note that the 770MPa traction curve has a

Advances in Tribology 11
0 1 2 3 4 5 6 7 8 9 10 11 12 13 14 15 16 17 18 19 20 21 22 23 24 250
0.01
0.02
0.03
0.04
0.05
0.06CO
F (—
)
s (%)
2RCF; MIN1; 42CrMo4 GS vs 42CrMo4 GS; avg temp: 64.00∘C; 500-0;;
2.6 G/s4.7G/s
Figure 16: Influence of speed on traction.
0 2.5 5 7.5 10 12.5 15 17.5 20 22.5 25 27.5 30 32.5 35 37.5 400
0.01
0.02
0.03
0.04
0.05
0.06
COF
(—)
s (%)
2RCF; MIN1; 42CrMo4 GS vs 42CrMo4 GS; 770-0;; 2.6 m/s
44.0∘C64.0∘C
Figure 17: Influence of temperature on traction.
maximumat SRR = 18%due to the increased viscosity, whichleads to a higher frictional power, while the 500MPa curve issteadily increasing throughout the investigated slip range.
3.3.2. Speed Influence. Two different velocities (𝑢𝑚), 2.6m/sand 4.7m/s, are examined in Figure 16.
The curve representing a speed of 4.7m/s yields a lowerCOF, whereby this effect is more pronounced at higher SRRs.This is corresponding well to Finding 2.
3.3.3. Temperature Influence. Finally, experiments with twodifferent oil-bath temperatures are compared in Figure 17.
Note that these experiments are carried out with a Hertzianpressure of 0.77GPa and an increased slip range up to SRR =40%, in order to raise the frictional power of the system.
One can note that in both cases a COF maximum isreached, indicating a transition into the thermal area, wherethe COF is lowered predominantly by thermal effects. Asexpected an oil-bath temperature of 44∘C increases the COFwhich confirms the statements made in Finding 3.
Since a mineral oil with higher viscosity (ISO VG-150)has been used in [6] a direct comparison of COF values isnot possible. However, qualitative trends obtained are very

12 Advances in Tribology
s(%
)
Tem
pera
ture(∘
C)
Nor
mal
forc
e (N
)
Spee
d (r
pm)
Time (s)0 10000 20000 30000 40000
Fric
tion
forc
e (N
)
45
40
35
30
25
20
15
10
5
0
−5
−10
Vibr
atio
n sp
eed
(mm
/s)
15
14
13
12
11
10
9
8
7
6
5
4
3
2
1
0
10095908580757065605550454035302520151050
Multiple_step_polymer-nickel_470 LJG
LVD
T di
stan
ce(
G)
2001901801701601501401301201101009080706050403020100
180
170
160
150
140
130
120
110
100
90
80
70
60
50
40
30
1000
900
800
700
600
500
400
300
200
100
0
−100
−200
−300
−400
−500
200019001800170016001500140013001200110010009008007006005004003002001000
1000
800
600
400
200
0
−200
−400
Friction forceContact potentialT infrared
Slip
Speed engine 1Speed engine 2Normal forceLVDT distanceVibration speed
c JIN
(%)
T oil-bath
Figure 18: Results for a polymer-nickel coated experiment under dry conditions.
Table 4: Operating and material parameters for dry polymer-steelexperiment.
𝑢𝑚= 1.23m/s 𝑠 = 0–190%𝑟1= 25mm 𝑟
2= 25mm
𝐸1= 210GPa 𝐸
2= 3GPa
]1= 0.3 ]
2= 0.3
𝑏1= 11mm 𝑏
2= 11mm
𝑅𝑎1= 1.3 𝜇m 𝑅
𝑎2= 1.8 𝜇m
𝑇0= RT 𝑝max = 30MPa
similar. Also, the same trends are, for instance, observed in[21] even though a ball-on-disc tribotester was used.
3.4. Dry Polymer-Steel Experiments. High performance poly-mers, in combination with a metal counterpart, nowadaysrepresent promising solutions formoderately loaded contactsunder high sliding speed, whereby fully dry systems can berealised under certain conditions. Here, we present results ofa polymerwith polytetrafluoroethylene (PTFE)modification,rubbing against a 42CrMo4 disc, which has been coated witha nickel-phosphor layer, performed under room temperature(RT). The corresponding material and operating parametersare listed in Table 4.
After an one-hour-lasting running-in phase eight slipcycles are carried out, which results in a total test time oftwelve hours. Main findings are shown in Figure 18. Com-pared to the lubricated experiment high dependency of theinfrared temperature, which reaches values of up to 135∘C, onthe sliding speed can be examined. Due to the absence of oil,
all heat has to be transferred through the discs. Furthermore,the signal of the LVDT distance sensor is correlating directlyto the temperature signal; since the polymer suffers under astiffness reduction at higher temperatures, deformations ofup to 200𝜇m can be measured.
Since polymers are electrically resistant, the contactpotential is at its maximum value throughout the test.
The last three cycles of this experiment are depicted inFigure 19. One can note that at a temperature of 120∘C theinfrared temperature signal shows discontinuities at eachcycle. After this event the friction is slightly decreasing,even though slip is raised further. The examined behaviourcould be linked to phase changes of the polymer, most likelypartial melting of PTFE. Also, due to thermal inertia, atime gap between the maximum of slip, which correspondsto maximum frictional power, and infrared temperature isdetected in the graph.
Again, friction force and slip are postprocessed to atraction curve, which is depicted in Figure 20. Cycles five toeight are shown in this diagram.
Compared to the results shown in Figure 14 a hysteresisbetween the slip increase and decrease steps can be detected.
During the slip increase period local phase changes dooccur, as indicated in Figure 19, leading to a self-lubricatedsystem which reduces the COF during the slip decreasesteps. Overall excellent reproducibility can be found again bycomparison of the traction curves.
For a dry system, the measured friction is low, which canbe attributed to the PTFE filling and also, the applied electro-less nickel-phosphor coatings are known to have beneficialtribological effects when used with polymers [22, 23].

Advances in Tribology 13
s(%
)
Tem
pera
ture(∘
C)
Nor
mal
forc
e (N
)
Spee
d (r
pm)
Time (s)
Fric
tion
forc
e (N
)
45
40
35
30
25
20
15
10
5
0
−5
−10
Vibr
atio
n sp
eed
(mm
/s)
15
14
13
12
11
10
9
8
7
6
5
4
3
2
1
0
10095908580757065605550454035302520151050
Multiple_step_polymer-nickel_470 LJG
LVD
T di
stan
ce(
G)
2001901801701601501401301201101009080706050403020100
180
170
160
150
140
130
120
110
100
90
80
70
60
50
40
30
1000
900
800
700
600
500
400
300
200
100
0
−100
−200
−300
−400
−500
200019001800170016001500140013001200110010009008007006005004003002001000
1000
800
600
400
200
0
−200
−400
Friction forceContact potentialT infrared
Slip
Speed engine 1Speed engine 2Normal forceLVDT distanceVibration speed
30600 32400 34200 36000 37800 39600 41400 43200 45000
c JIN
(%)
T oil-bath
Figure 19: Results for a polymer-nickel coated experiment under dry conditions. Last three cycles.
0
0.05
0.1
0.15
COF
(—)
s (%)
c5c6
c7c8
2RCF; cycle 5 to 8; dry; 42CrMo4 vs polymer; avg temp: 36.81∘C; pmax: 30-0;; 470 20-
0 10 20 30 40 50 60 70 80 90 100 110 120 130 140 150 160 170 180 190 200
s ↑
s ↓
Figure 20: Traction curve for a polymer-nickel coated experiment under dry conditions.
3.5. High-Speed Data Measurements. To conclude this dem-onstration section, polar plots of measured signals are pre-sented as a function of rotation angle. These measurementsare transiently performed and logged periodically through-out the test at certain time steps. During one rotation of shaft1, positions and velocities of motors, friction force, contactpotential, and vibration velocity are evaluated continuouslyin an array with 72 entries each, which means that data is
available in steps of five degrees independent of the currentspeed and slip values. Figure 21 presents polar plots of frictionforce and vibration velocity for a polymer-steel experimentwith conditions reported in Table 4 at a slip rate of sevenpercent.
An evenly distributed friction force along rotation anglecan be concluded from this high-speed measurement, whichindicates stationary friction conditions and therefore a good

14 Advances in Tribology
Friction force
F = 40.
F = 30.
F = 20.
F = 10.
F = 0
F = −10.
90
60
30
0
330
300
270
240
210
180
150
120
(a)
Vibration speed
P<M = 5GG/M
P<M = 4GG/M
P<M = 3GG/M
P<M = 2GG/M
P<M = 1GG/M
P<M = 0
90
60
30
0
330
300
270
240
210
180
150
120
(b)
Figure 21: Friction force (a) and vibration velocity (b) along one rotation of shaft 1 for 𝑠 = 7%.
Friction force
F = 40.
F = 30.
F = 20.
F = 10.
F = 0
F = −10.
90
60
30
0
330
300
270
240
210
180
150
120
(a)
Vibration speed
P<M = 5GG/M
P<M = 4GG/M
P<M = 3GG/M
P<M = 2GG/M
P<M = 1GG/M
P<M = 0
90
60
30
0
330
300
270
240
210
180
150
120
(b)
Figure 22: Friction force (a) and vibration velocity (b) along one rotation of shaft 1 for 𝑠 = 0%.
manufacturing quality of the specimens.The vibration veloc-ity is close to zero, which indicates smooth test conditions aswell.
Figure 22 depicts results of a polymer-steel high-speedmeasurement, whereby the polymer disc has experiencedsignificant heat loads through high friction.
The damaged surface triggers significant vibrations of upto 3mm/s and the data is less homogeneously distributedalong the rotating angle compared to Figure 21. Note that thisdamage is hardly detectable by just considering the friction
force, which emphasises the importance of vibration sensorsand subsequent transient evaluation in two-disc machines.
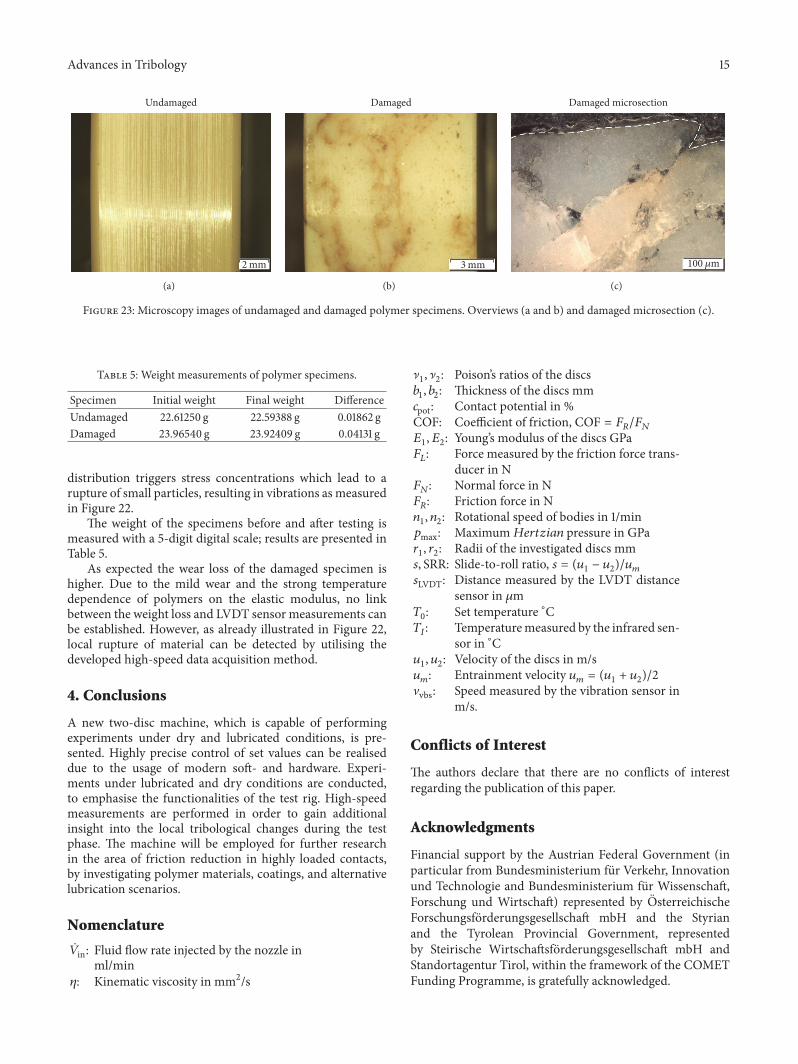
Figure 23 shows images, obtained by an Olympus SZX12light microscope, of the undamaged and damaged polymerspecimens, used in the experiments shown in Figures 21 and22. While in the undamaged case only very mild wear, whichoccurs evenly distributed along the surface, can be detected,the damaged specimen shows localised loss of material. Notethat the area above the white dashed line is filled withinvestmentmaterial. In this case the inhomogeneousmaterial
Advances in Tribology 15
Undamaged
2GG
(a)
Damaged
3GG
(b)
Damaged microsection
100 G
(c)
Figure 23: Microscopy images of undamaged and damaged polymer specimens. Overviews (a and b) and damaged microsection (c).
Table 5: Weight measurements of polymer specimens.
Specimen Initial weight Final weight DifferenceUndamaged 22.61250 g 22.59388 g 0.01862 gDamaged 23.96540 g 23.92409 g 0.04131 g
distribution triggers stress concentrations which lead to arupture of small particles, resulting in vibrations as measuredin Figure 22.
The weight of the specimens before and after testing ismeasured with a 5-digit digital scale; results are presented inTable 5.
As expected the wear loss of the damaged specimen ishigher. Due to the mild wear and the strong temperaturedependence of polymers on the elastic modulus, no linkbetween the weight loss and LVDT sensor measurements canbe established. However, as already illustrated in Figure 22,local rupture of material can be detected by utilising thedeveloped high-speed data acquisition method.
4. Conclusions
A new two-disc machine, which is capable of performingexperiments under dry and lubricated conditions, is pre-sented. Highly precise control of set values can be realiseddue to the usage of modern soft- and hardware. Experi-ments under lubricated and dry conditions are conducted,to emphasise the functionalities of the test rig. High-speedmeasurements are performed in order to gain additionalinsight into the local tribological changes during the testphase. The machine will be employed for further researchin the area of friction reduction in highly loaded contacts,by investigating polymer materials, coatings, and alternativelubrication scenarios.
Nomenclature
��in: Fluid flow rate injected by the nozzle inml/min
𝜂: Kinematic viscosity in mm2/s
]1, ]2: Poison’s ratios of the discs𝑏1, 𝑏2: Thickness of the discs mm
𝑐pot: Contact potential in %COF: Coefficient of friction, COF = 𝐹
𝑅/𝐹𝑁
𝐸1, 𝐸2: Young’s modulus of the discs GPa𝐹𝐿: Force measured by the friction force trans-
ducer in N𝐹𝑁: Normal force in N𝐹𝑅: Friction force in N𝑛1, 𝑛2: Rotational speed of bodies in 1/min
𝑝max: Maximum𝐻𝑒𝑟𝑡𝑧𝑖𝑎𝑛 pressure in GPa𝑟1, 𝑟2: Radii of the investigated discs mm
𝑠, SRR: Slide-to-roll ratio, 𝑠 = (𝑢1 − 𝑢2)/𝑢𝑚𝑠LVDT: Distance measured by the LVDT distance
sensor in 𝜇m𝑇0: Set temperature ∘C𝑇𝐼: Temperaturemeasured by the infrared sen-
sor in ∘C𝑢1, 𝑢2: Velocity of the discs in m/s𝑢𝑚: Entrainment velocity 𝑢
𝑚= (𝑢1+ 𝑢2)/2
Vvbs: Speed measured by the vibration sensor inm/s.
Conflicts of Interest
The authors declare that there are no conflicts of interestregarding the publication of this paper.
Acknowledgments
Financial support by the Austrian Federal Government (inparticular from Bundesministerium fur Verkehr, Innovationund Technologie and Bundesministerium fur Wissenschaft,Forschung und Wirtschaft) represented by OsterreichischeForschungsforderungsgesellschaft mbH and the Styrianand the Tyrolean Provincial Government, representedby Steirische Wirtschaftsforderungsgesellschaft mbH andStandortagentur Tirol, within the framework of the COMETFunding Programme, is gratefully acknowledged.

16 Advances in Tribology
References
[1] H. E. Merritt, “Worm gear performance,” Proceedings of theInstitution of Mechanical Engineers, vol. 129, no. 1, pp. 127–194,1935.
[2] Deutsches Institut fur Normung, Din 3990-1, 1987, https://shop.austrian-standards.at/action/en/public/details/111662/DIN_3990-1_1987_12.
[3] H. Wittel, D. Muhs, D. Jannasch, and J. Voßiek, Roloff/MatekMaschinenelemente, Normung, Berechnung, Gestaltung; 21.vollstandig uberbearbeitete Auflage, Springer, 2013.
[4] A. Trausmuth, I. Godor, M. Stoschka, A. Dietrich, and W.Eichlseder, “Load-carrying capacity prediction of differentplasma nitrided, case hardened and quenched specimens underrolling contact loading,” in Proceedings of the European Confer-ence on Tribology, 2011.
[5] A. Trausmuth, Rolling contact fatigue of nitrided, case-hardenedand quenched specimens [Ph.D. thesis], MontanuniversitatLeoben, 2012.
[6] A. Doleschel, Wirkungsgradberechnung von Zahnradgetriebenin Abhangigkeit vom Schmierstoff [Ph.D. thesis], TechnischeUniversitat Munchen, 2003.
[7] K. Bobzin, T. Brogelmann, K. Stahl, K. Michaelis, J. Mayer,and M. Hinterstoißer, “Friction reduction of highly-loadedrolling-sliding contacts by surface modifications under elasto-hydrodynamic lubrication,” Wear, vol. 328-329, pp. 217–228,2015.
[8] G.Meneghetti, A. Terrin, and S. Giacometti, “A twin disc test rigfor contact fatigue characterization of gear materials,” ProcediaStructural Integrity, vol. 2, pp. 3185–3193, 2016.
[9] O. Kreil, Einfluss der Oberflachenstruktur auf Druckverteilungund Schmierfilmdicke im EHD-Kontakt [Ph.D. thesis], Technis-che Universitat Munchen, 2008.
[10] S. Akbarzadeh and M. M. Khonsari, “Experimental and theo-retical investigation of running-in,” Tribology International, vol.44, no. 2, pp. 92–100, 2011.
[11] M.Masjedi andM.M. Khonsari, “Theoretical and experimentalinvestigation of traction coefficient in line-contact EHL ofrough surfaces,” Tribology International, vol. 70, pp. 179–189,2014.
[12] J. Kleemola and A. Lehtovaara, “Experimental evaluation offriction between contacting discs for the simulation of gearcontact,” Lubrication Science, vol. 13, no. 1, pp. 13–20, 2007.
[13] H.Krampl, F. Grun, and I. Godor, “Numerical and experimentalinvestigation of non-conformal lubricated contacts,” in Proceed-ings of the Nordic Symposium on Tribology, 2012.
[14] J. Moder, H. Krampl, and F. Grun, “Tribological analysis oflubricated non-conforming contacts,” in Proceedings of the OTGSymposium, 2014.
[15] SIEMENS, “SIMATIC HMI Devices, Operating Instructions,”2015.
[16] SIEMENS, “Simotion Scout TIA Configuration Manual,” 2014.[17] SIEMENS, “S120 Drive Functions Manual,” 2015.[18] SIEMENS, “1FT7 SynchronousMotorsOperating Instructions,”
2015.[19] R. Gohar, Elastohydrodynamics, World Scientific, 2001.[20] W. Habchi, P. Vergne, S. Bair, O. Andersson, D. Eyheramendy,
and G. E. Morales-Espejel, “Influence of pressure and temper-ature dependence of thermal properties of a lubricant on thebehaviour of circular TEHD contacts,” Tribology International,vol. 43, no. 10, pp. 1842–1850, 2010.
[21] M. Bjorling, Friction in elastohydrodynamic lubrication [Ph.D.thesis], Lulea Tekniska Universitet, 2014.
[22] R. Parkinson, “Properties and applications of electroless nickel,”2001.
[23] P. Sahoo and S. K. Das, “Tribology of electroless nickelcoatings—a review,” Materials and Design, vol. 32, no. 4, pp.1760–1775, 2011.

RoboticsJournal of
Hindawi Publishing Corporationhttp://www.hindawi.com Volume 2014
Hindawi Publishing Corporationhttp://www.hindawi.com Volume 2014
Active and Passive Electronic Components
Control Scienceand Engineering
Journal of
Hindawi Publishing Corporationhttp://www.hindawi.com Volume 2014
International Journal of
RotatingMachinery
Hindawi Publishing Corporationhttp://www.hindawi.com Volume 2014
Hindawi Publishing Corporation http://www.hindawi.com
Journal of
Volume 201
Submit your manuscripts athttps://www.hindawi.com
VLSI Design
Hindawi Publishing Corporationhttp://www.hindawi.com Volume 201
Hindawi Publishing Corporationhttp://www.hindawi.com Volume 2014
Shock and Vibration
Hindawi Publishing Corporationhttp://www.hindawi.com Volume 2014
Civil EngineeringAdvances in
Acoustics and VibrationAdvances in
Hindawi Publishing Corporationhttp://www.hindawi.com Volume 2014
Hindawi Publishing Corporationhttp://www.hindawi.com Volume 2014
Electrical and Computer Engineering
Journal of
Advances inOptoElectronics
Hindawi Publishing Corporation http://www.hindawi.com
Volume 2014
The Scientific World JournalHindawi Publishing Corporation http://www.hindawi.com Volume 2014
SensorsJournal of
Hindawi Publishing Corporationhttp://www.hindawi.com Volume 2014
Modelling & Simulation in EngineeringHindawi Publishing Corporation http://www.hindawi.com Volume 2014
Hindawi Publishing Corporationhttp://www.hindawi.com Volume 2014
Chemical EngineeringInternational Journal of Antennas and
Propagation
International Journal of
Hindawi Publishing Corporationhttp://www.hindawi.com Volume 2014
Hindawi Publishing Corporationhttp://www.hindawi.com Volume 2014
Navigation and Observation
International Journal of
Hindawi Publishing Corporationhttp://www.hindawi.com Volume 2014
DistributedSensor Networks
International Journal of