a novel way to represent the 32 crystallographic point groups
TRANSCRIPT

A NOVEL WAY TO REPRESENT THE 32CRYSTALLOGRAPHIC POINT GROUPS
Marc De GraefDepartment of Materials Science and Engineering,
Carnegie Mellon, 5000 Forbes Avenue,Pittsburgh PA 15213
Phone: (412) 268-8527Fax: (412) 268-3113
Email: [email protected]
Published in the Journal of Materials EducationVol. 20, 31-42 (1998).
1

A NOVEL WAY TO REPRESENT THE 32 CRYSTALLOGRAPHICPOINT GROUPS
Marc De Graef
Department of Materials Science and Engineering, Carnegie Mellon, 5000 Forbes Avenue, PittsburghPA 15213; [email protected].
ABSTRACT
This paper describes a novel way to represent the 32 crystallographic point groups for use in a class-room environment. The groups are rendered using a 3D ray-tracing package and a variety of movieand still image formats are made available in the public domain.
Keywords: point groups; freeware; animation; stereographic projection; ray-tracing
INTRODUCTION
Crystal structures are commonly described bystating the lattice parameters, the space groupsymbol or number, and the atom positions in theasymmetric unit (often by means of the Wyck-off symbols) [1]. This is standard practice, ac-cepted across a wide range of scientific disci-plines (physics, geology, materials science, toname just a few), and the International Tablesfor Crystallography (Volume A) provide all in-ternational conventions in the form of detailedspace group tables [1].
When teaching a crystallography course toa group of students, in particular at the under-graduate level, it is often a daunting task to ex-plain what space groups are and how they work.Let us consider the case of space group # 63:Cmcm. It is generally not too difficult to ex-plain the meaning of the first letter of the space
group symbol, the centering of the Bravais lat-tice. There are only six possible centering sym-bols (P, I, F, A, B, C), and one can readily draw aunit cell on the blackboard and illustrate the dif-ferences between these cases. That is the easypart. The difficulties begin when one attemptsto explain the remainder of the space group sym-bol, the point group symbol.
The point group symbol is derived from thespace group symbol by replacing all glide planesby regular mirror planes (in the example abovethis would result in the point group mmm), andall screw axes by regular rotation axes of thesame order. An experienced crystallographercan then immediately name the crystal systemto which the space group belongs (orthorhombicfor the example above), but this is by no meansobvious to the novice. An additional source ofconfusion lies in the fact that many of the pointgroup symbols are commonly used in abbrevi-

ated form (mmm actually stands for 2m
2m
2m )
and unless the student memorizes these abbre-viations and the crystal systems to which theybelong, there is little or no hope that he or shewill be able to associate a point group with theappropriate crystal system.
A further difficulty lies in the representationof the actual point groups. Individual symme-try elements can readily be represented by sim-ple drawings, and many textbooks offer veryclear drawings of rotation axes, mirror planesand so on (e.g. [2, 3]). When these elementsare then combined to generate the 32 crystallo-graphic point groups, most texts rely on a repre-sentation in terms of stereographic projections.This is where the problems begin. The stereo-graphic projection, introduced by William Hal-lowes Miller in 1839 [4], is an important toolfor the representation of three-dimensional ob-jects in a two-dimensional drawing. While it isan accepted research tool, as standard as, for in-stance, a parallel projection or a Mercator pro-jection, the difficulty from the student’s perspec-tive lies in the fact that many students have ahard time visualizing a three-dimensional ob-ject. When this object is then reduced to twodimensions it becomes even more difficult forthem to reconstruct, in their mind, the origi-nal three-dimensional object. And now we areasking them to reconstruct from a stereographicprojection an object – a point group – which isitself abstract and difficult to visualize. Shouldwe be surprised, then, to find that students havea difficult time with stereographic projections ofpoint groups? They are asked to visualize andunderstand a rather abstract 3D object, repre-sented in a 2D projection, and to re-create intheir mind the original 3D object.
Not everyone has the ability to performmental operations, such as rotations, on 3D ob-jects without actually touching them or observ-ing them in 3D. And yet, the very definitionof symmetry operations involves the concept ofmotion of an object: an object has a symme-try property when it can be brought into self-coincidence by an isometric motion (i.e., by a
translation, rotation, mirror, or inversion opera-tion). It is not a trivial matter to execute suchmotions by pure thought alone. Research intothe way the brain interprets 3D visual cues indi-cates that there are two different levels at whichthis information can be processed. If 3D infor-mation is presented in 2D, then the brain has toperform a cognitive effort to convert the infor-mation to a 3D representation. Different peo-ple have different approaches to this conversion,and not everyone can easily perform this task.On the other hand, if the information is pre-sented in true 3D form, then the brain, which ishighly capable of 3D perception, does not needto use its congnitive centers to convert the in-formation; all cognitive efforts can go towardsinterpreting and understanding the meaning ofthe 3D object itself, rather than its 3D structure.
We would substantially simplify the stu-dent’s task if we could eliminate one or moreintermediate steps in the representation of pointgroups. Since a point group represents a 3D ob-ject, why not directly visualize the point groupin 3D, using computer graphics and animation?Once the 3D representation is understood, thecorresponding stereographic projection shouldpose no substantial problems; indeed, an under-standing of the 3D nature of point groups mayeven help to understand the stereographic pro-jection itself!
In this paper we present a novel way to rep-resent a point group. The method uses a 3Dray-tracing package to create animations of a“world” which contains two types of objects:
1. symmetry elements, represented by theirappropriate 3D symbols (i.e. a mirrorplane is represented by a plane whose sur-face properties include the appropriate re-flectivity),
2. a “general point”, to represent the equiva-lent positions of the point group.
The general point should itself have minimalsymmetry; in particular, it should have a hand-edness so that the action of improper symme-try operators (in the nomenclature of [3]) is cor-

rectly represented1. In the standard representa-tion of point groups by means of stereographicprojections one does not usually distinguish be-tween points with opposite handedness. Theonly distinction taken into account is the lo-cation of the point above or below the stere-ographic projection plane (usually representedby a closed or open circle, respectively). Thelack of handedness information on the standardprojections of point groups is an important defi-ciency, since the true symmetry is not fully rep-resented in the drawing; the student must inferthe change of handedness from the presence ofthe symmetry elements.
The animations discussed in this paper useas general point either a sphere (for low resolu-tion animations), or a right-handed helix, con-sisting of 20 small spheres. The nature of theray-tracing process is such that if objects are as-signed the proper surface properties, then a raywill bounce off of each of the surfaces accordingto the proper laws of physics, in this case Snell’sLaw. The resulting renderings are realistic rep-resentations of all symmetry operators, as willbe illustrated in the remainder of this paper.
The structure of the paper is then as fol-lows: first we discuss the technical aspects ofthe definition of the “symmetry worlds” and thesubsequent conversion of the individual anima-tion frames into a movie. Then we discuss thevarious movies and stills, which can be down-loaded from a dedicated website. We concludethis paper with a few suggestions for the class-room use of the animations and for additionalanimations which can be generated from theray-tracing world definitions.
TECHNICAL DESCRIPTION
Overview
Several programs, sets of animations, and stillimages have been created for a variety of uses.
All software and animation files are available inthe public domain and can be accessed throughthe author’s website [5]. The following filearchives are available:
• The point group and Bravais latticebrowser; both Macintosh (Quicktime)and Windows (AVI) versions are avail-able;
• 32 high resolution (640×480 pixels) ani-mated GIF-files using the helix as generalpoint;
• 32 high resolution rendered drawings ofthe point groups (1200× 1200 pixels,JPEG-format), again with the helix asgeneral point;
• all input files for the raytracing computa-tions, including a README file detailingthe entire procedure.
All rendered images and animations werecreated using the public domain ray tracingpackage Rayshade (version 4.0) [6]. This pro-gram creates a rendered image based on the defi-nition of a scene containing various objects (i.e.,a “world”). The objects are constructed fromprimitive shapes, such as cylinders, spheres, andso on. An example input file for the pointgroup2m is shown below. The file consists of a vari-able definition section, surface properties defini-tions, object definitions, and scene descriptions(viewing point, light sources, and so on). Theentire scene is instantiated by the last commandin the file.
/*********************//* define parameters *//*********************/define px 0.85define py 0.15define pz 0.40define mpx (-px)define mpy (-py)define mpz (-pz)define pp 0.005define mp -0.005
/*****************************//* define surface properties *//*****************************/surface mirrorambient 0.14 0.14 0.14 diffuse 0.01 0.01 0.01specular .8 .8 .8 specpow 60
1Improper operators include mirrors and the inversion operator; they change the handedness of an object.

Figure 1: Screen dump of the graphical user interface for the point group and Bravais lattice browser.
reflect 1.
surface whiteambient 0.06 0.06 0.06 diffuse 0.50 0.50 0.50specular 0.7 0.7 0.7 specpow 38reflect 0.5
surface blackambient 0.00 0.00 0.00 diffuse 0.0 0.0 0.0specular 0.2 0.2 0.2 specpow 3reflect 0.4
surface blumirrorambient 0.00 0.00 0.32 diffuse 0.00 0.00 0.15specular .9 .9 .9 specpow 60reflect 1.0
surface ylwmirrorambient 0.25 0.25 0.12 diffuse 0.25 0.25 0.12specular .8 .8 .8 specpow 60reflect 0.75
surface bluflatambient 0.04 0.06 0.22 diffuse 0.05 0.08 0.25specular .4 .4 .4 specpow 20reflect 0.2
surface ylwflatambient 0.25 0.25 0.12 diffuse 0.25 0.25 0.12specular .4 .4 .4 specpow 20reflect 0.2
/**********************//* object definitions *//**********************//* locate a white plane 10 units below horizontal */plane white 0 0 -10 0 0 1
name mirrorplanelist
poly mirror 1 1 (pp) 1 -1 (pp) -1 -1 (pp) -1 1 (pp)poly mirror 1 1 (mp) 1 -1 (mp) -1 -1 (mp) -1 1 (mp)poly black 1 1 (pp) 1 1 (mp) 1 -1 (mp) 1 -1 (pp)poly black 1 -1 (pp) 1 -1 (mp) -1 -1 (mp) -1 -1 (pp)poly black -1 -1 (pp) -1 -1 (mp) -1 1 (mp) -1 1 (pp)
poly black -1 1 (pp) -1 1 (mp) 1 1 (mp) 1 1 (pp)end
name disc_twolist
cylinder ylwflat 1 0 0 (mp) 0 0 (pp)disc ylwflat 1 0 0 (mp) 0 0 -1disc ylwflat 1 0 0 (pp) 0 0 1
end
name axis_two /* define two-fold rotation axis */list
cylinder mirror 0.02 0 0 -1.2 0 0 1.2object disc_two scale 0.15 0.07 1
translate 0 0 1.210object disc_two scale 0.15 0.07 1
translate 0 0 -1.210end
name sympoint /* inversion symmetry element */list
sphere ylwmirror 0.075 0 0 0end
name blupoint /* general sphere */list
sphere blumirror 0.075 0 0 0end
name refaxis /* reference axis */list
cylinder bluflat 0.01 0 0 -1.4 0 0 1.4end
name point_group /* point group 2/m */list
object axis_twoobject mirrorplaneobject sympointobject blupoint translate ( px) ( py) ( pz)object blupoint translate (mpx) (mpy) ( pz)object blupoint translate (mpx) (mpy) (mpz)object blupoint translate ( px) ( py) (mpz)object refaxis
end

Figure 2: Rendered representations of the point group 2m , for a) a sphere as general point, and b) a
right-handed helix.
/********************************//* set the rendering parameters *//********************************/screen 1200 1200 /* image size (pixels) */maxdepth 20 /* max number of reflections */eyep 2.5 3.0 2.0 /* eye position */lookp 0 0 0 /* point at which the eye looks */up 0 0 1 /* vertical direction (z-axis) */fov 45 /* field of view angle */sample 4 /* square root of number of rays per pixel */light 1.5 point -6 3 6 /* main light source */light 0.5 extended 2.0 6 -4 1 /* secondary source */background 0.3 0.3 0.3 /* overall background intensity */
/******************************//* and instantiate the object *//******************************/object point_group
Running this scene description file throughRayshade results in the image shown in Fig. 2a.When the viewing point is systematicallychanged along a predefined trajectory, or, equiv-alently, the entire object is rotated around one ormore axes, one can easily obtain a sequence ofimages which can then be merged into a singlemovie (QuickTime, AVI, or animated GIF for-mat). Generating a sequence of frames is sim-plified by the frames command of the Rayshadepackage. For more information we refer to theRayshade documentation [6].
The general point in Fig. 2a is a singlesphere; as discussed in the Introduction oneshould actually use an object which itself doesnot have a high order symmetry. A sphere is thus
not the best general point. It has only been usedto produce the low-resolution animations. Forall high resolution animations and still imagesthe general point was taken to be a right-handedhelix consisting of 20 spheres. The general po-sitions of all spheres in the helix were computedusing the symmetry transformation matrices foreach point group. We refer the reader to the In-ternational Tables for Crystallography, VolumeA [1], for more details and for tables of symme-try matrices. The sphere coordinates for eachhelix are stored in ∗.pos files, one for each pointgroup, and are included in the raytracing de-scription files. The resulting rendered image forthe point group 2
m is shown in Fig. 2b.One single Rayshade run then requires the
following set of input files:
(main file) pg name.ray includes↓
preface.ray (defines primitives and surfaces)name.pos (atom positions for all helices)tail.ray (defines rendering parameters)
where name is the international point groupsymbol. All input files needed to reproduce thehigh resolution animations are available fromthe author’s website [5]. The reader shouldbe aware that a complete run for the 32 point

groups takes about 24 hours on a 600 MHz pro-cessor, and produces 757 Mb of RGB output.Various UNIX tools must then be used to con-vert this output into animated GIF, Quicktime,or AVI formatted movies. This can all be done
with public domain and shareware software, anda detailed description of the procedure is avail-able in a README file.
Figure 3: Rendered representations of all point groups, using a single sphere as general point.

Figure 3: Rendered representations of all point groups, using a single sphere as general point (con-tinued).
The Point Group Browser
To facilitate the teaching of the crystallo-graphic point groups we have developed an in-teractive module, which can be used by theteacher for classroom demonstrations and by thestudent for individual study. The program al-lows the user to select one of the 14 Bravaislattices or one of the 32 crystallographic point
groups for display. A screen dump of the mainuser interface is shown in Fig. 1 (gray-scale ver-sion; all renderings are performed in full 24-bitcolor, and were converted to grayscale imagesfor reproduction in this paper). By clicking onthe crystal systems, the program will display thevarious centering options available for the se-lected crystal system. The user can then selecta centering symbol to display a low resolution

rendered animation of a representative unit cellof the selected Bravais lattice. The internationalsymbol for the Bravais lattice is displayed nearthe center of the screen. The animation loopsonce and can be restarted with the control but-tons.
The 32 crystallographic point groups areranked according to the crystal system to whichthey belong. The program uses the standardinternational (or Hermann-Mauguin) notation.The Schonflies notation is also displayed nearthe center of the display. When the user selectsone of the point groups, the program displays alow resolution (240× 180 pixels) rendered ani-mation of the symmetry elements of the group,along with a set of equivalent point positionsrepresented by blue spheres. The point groupobjects rotate around two axes simultaneously,so that the 3D nature of the object is empha-sized. The first frame of each of the 32 moviesis shown in Fig. 3.
Supported Platforms
The point group module is written in cT,a multi-platform programming language devel-oped at the Center for Innovation in Learning(CIL) at CMU and distributed by Physics Aca-demic Software [7]. The cT programming en-vironment is available in forms executable onMacintosh, Windows and UNIX platforms. Thecurrent version of the point group browser waswritten using cT version 2.5, on the Macintoshplatform, and then converted to the Windows95 environment. For compatibility with stan-dard graphics screens on both Macintosh andPC platforms, the program is designed to workon a display with 640×480 pixels with only 256colors (8-bit), but it will also function on ma-chines with a higher resolution screen and/orlarger color palette. On the Macintosh, the an-imations are stored in compressed QuickTimeformat, while the Windows 95 version uses AVIformat. A UNIX version will also be madeavailable.
Program Availability
The point group module and associated stillimages and high resolution animated GIF’s aremade available in freeware form. Both Macin-tosh and Windows versions may be downloadedvia the Internet from the author’s website [5].Detailed instructions for installation and use ofthe program are included in the archived files.After installation, the complete set of files, in-cluding the cT-Executor, occupies 46.6 Mbytesof diskspace on the Macintosh platform, and123.4 MBytes on the Windows 95 platform (ver-sion 2.5 of the cT environment does not recog-nize compressed AVI format, hence the differ-ence in required diskspace).
The fileset consists of the binary file, thebackground image (PICT or BMP), the cT Ex-ecutor, 14 Bravais lattice animations, 32 pointgroup animations numbered according to the In-ternational Tables for Crystallography, VolumeA [1], and a brief README file. To facili-tate the teaching of point groups in an environ-ment where computer projection is difficult orunavailable, a set of 32 still images (the firstframe of each of the animations) is also in-cluded. These images are computed at highresolution (1200 × 1200 pixels) and stored incompressed, 24-bit JPEG format. They can beprinted onto transparencies on a high qualitycolor printer and used in a more conventionalclassroom setting. An example of a high resolu-tion rendering of point group m3m is shown inFig. 4.
The last fileset available from the web-site contains animated GIF movies of the pointgroups, rendered at 640×480 pixels, using thehelix as the special object. Animated GIFmovies can be downloaded directly into a webbrowser, without the need for additional soft-ware. The 32 movies can be downloaded in-dividually, for real-time display in a classroomsetting, or as an archive.
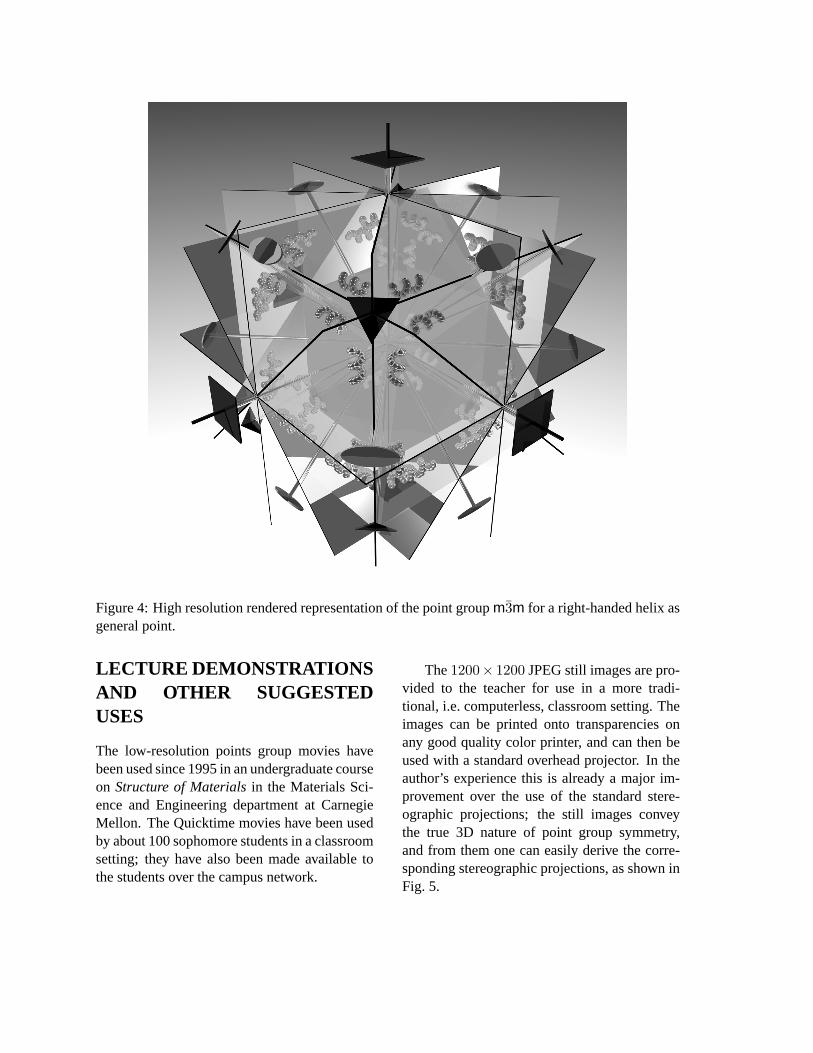
Figure 4: High resolution rendered representation of the point group m3m for a right-handed helix asgeneral point.
LECTURE DEMONSTRATIONSAND OTHER SUGGESTEDUSES
The low-resolution points group movies havebeen used since 1995 in an undergraduate courseon Structure of Materials in the Materials Sci-ence and Engineering department at CarnegieMellon. The Quicktime movies have been usedby about 100 sophomore students in a classroomsetting; they have also been made available tothe students over the campus network.
The 1200× 1200 JPEG still images are pro-vided to the teacher for use in a more tradi-tional, i.e. computerless, classroom setting. Theimages can be printed onto transparencies onany good quality color printer, and can then beused with a standard overhead projector. In theauthor’s experience this is already a major im-provement over the use of the standard stere-ographic projections; the still images conveythe true 3D nature of point group symmetry,and from them one can easily derive the corre-sponding stereographic projections, as shown inFig. 5.

Ideally the teacher would have two surfacesavailable in the classroom: a traditional black-(or white-) board, and a computer projectionscreen. The point group module would be pro-jected on this screen, and from the movies stere-ographic projections and other point group in-formation (such as the order and the interna-tional symbol) could be derived on the otherboard. This method works well and all 32 pointgroups can be derived in this way in a regularlecture period (about 1 hour). Alternatively, onecould provide the students with the point groupmodule and have them explore the point groupsoutside of class, as preparation for the lecture.This has the advantage that every student canapproach the module at his/her own pace, andthe lecture would then serve to clarify remain-ing problems, if any. If the classroom computeris hooked up to the Internet, then the teacher canmake use of the animated GIF movies, provideda fast network connection is available. If this isnot the case, then the animated GIF file archivecan be downloaded from the author’s website[5], and shown as local files through a browser.Both methods work fine, and have the advantagethat the movies offer a higher resolution than theones making up the point group module.
One may now ask the question: What aboutspace groups? Can one use similar graphicstools to illustrate the structure of space groups?In principle the answer is of course positive, butthere are several practical problems associatedwith renderings of space groups. First of all,space groups are groups of infinite order, so onewould have to restrict the renderings to the fun-damental unit cell, or perhaps a small number ofunit cells (say 2 × 2 × 2);
Second, one would have to create semi-transparent mirror planes, especially when mir-ror planes bound the unit cell faces (otherwiseone could never see inside the cell). While thisis certainly possible within the framework of theRayshade program, the computational times in-volved become prohibitively long, even for asingle image.
Finally, instead of rotating the entire space
group, as is done for the point group objects, onewould ideally give the observer control over eyepoint and view point locations. The Rayshaderay tracer is a batch program, normally runningin background, so this is not the proper plat-form for real-time image renderings. Perhapsone could use VRML concepts and structures topermit the user to observe space group symme-try from an arbitrary direction, or, indeed, evenmove inside the fundamental unit cell and lookaround. This would require a substantial timeand programming investment and is outside thescope of the author’s expertise.
Conclusion
A new representation of point groups has beencreated. Using ray-tracing techniques, rendereddrawings and movies of the 32 crystallographicpoint groups have been created; they are avail-able to the public from a dedicated website.Four years of teaching using this new represen-tation have shown that students acquire a betterunderstanding of the 3D nature of point groups.They also have a better understanding of themore standard stereographic projection repre-sentations of the point groups, since they canalways compare the projection with the original3D representation.
Acknowledgments
This work has been supported by an NSF CA-REER grant (DMR-9501017) under the super-vision of Program Director Dr. Bruce A. Mac-Donald. The author would like to thank Prof.Patricia Carpenter for stimulating discussions.The author would also like to acknowledge theCenter for Innovation and Learning at CarnegieMellon University for a Faculty Fellowship(Spring 1998) during which the software wascompleted. The author would welcome anyform of feedback about the contents of this pa-per.

References
[1] Theo Hahn, editor. The International Ta-bles for Crystallography: Volume A:SpaceGroup Symmetry. Kluwer Academic Pub-lishers, 3rd, revised edition, 1992.
[2] D. McKie and C. McKie. Essentials ofCrystallography. Blackwell, 1986.
[3] G. Burns and A.M. Glazer. Space Groupsfor Solid State Scientists. Academic Press,Inc., 2nd edition, 1990.
[4] W.H. Miller. A Treatise on Crystallography.Deighton, 1839.
[5] http://neon.mems.cmu.edu/degraef/pointgroups,1998.
[6] http://www-graphics.stanford.edu/˜cek/rayshade/
rayshade.html, 1995.
[7] B.A. Sherwood and J.N. Sherwood. cT Lan-guage Manual, Physics Academic Software,North Carolina State University, 1989.

List of Figures
1 Screen dump of the graphical user interface for the point group and Bravais latticebrowser. . . . . . . . . . . . . . . . . . . . . . . . . . . . . . . . . . . . . . . . . . 5
2 Rendered representations of the point group 2m , for a) a sphere as general point, and
b) a right-handed helix. . . . . . . . . . . . . . . . . . . . . . . . . . . . . . . . . . 63 Rendered representations of all point groups, using a single sphere as general point. . 73 Rendered representations of all point groups, using a single sphere as general point
(continued). . . . . . . . . . . . . . . . . . . . . . . . . . . . . . . . . . . . . . . . 84 High resolution rendered representation of the point group m3m for a right-handed
helix as general point. . . . . . . . . . . . . . . . . . . . . . . . . . . . . . . . . . . 105 Illustration of the conversion of a rendered point group image to the corresponding
stereographic projection. On the original point group drawing (a) a projection sphereis superimposed (b); the general points are connected with North or South pole, de-pending on their location the intersections of those connection lines with the equato-rial plane mark the stereographic projections (c). The standard representation is thenshown in (d). . . . . . . . . . . . . . . . . . . . . . . . . . . . . . . . . . . . . . . 14

Figure 5: Illustration of the conversion of a rendered point group image to the corresponding stereo-graphic projection. On the original point group drawing (a) a projection sphere is superimposed (b);the general points are connected with North or South pole, depending on their location the intersec-tions of those connection lines with the equatorial plane mark the stereographic projections (c). Thestandard representation is then shown in (d).