a 'p' $. z)1 (u 's n i ' ., jyys hm. ,, ['(m.-> p a
TRANSCRIPT

a
NUREG/CR.2276EGG-2120
-
_
., . nw
. a 'p' $. z)1 (u 's n.~ n . -g
I ' ., Jyys
hm. ,, ['(M.-> p" A <d',%,h..:mxy } p.
.a.% j,:,( s#.'i 9:+ f .M
c.a u ,1,.. w [a vj.khs.,<.-%t,y
.
#. u r .. s n ~ m~, .. .
.~~ ' ,* ; ,A? \
- -.
a, p.~ ,egy t| --n-e y-h ..n ...,, ,_Q 971 Eg gggy (i S WEE* j-
.= e .:> - .:.<.n w.m;. -x -== p~ ~ w +a.,n. ,,_ ,,,, cs ,_ e m* e p - m un s + :l.,
ET + ex .. .-- +- ,- miij [hini cs mi, _. _ r-sme wr =s,r==r ===% W ' -,a yce,,.~s . , w,, , - ~~~m y --. -. - u ~. n:.:w ~
. x., m L., .r- - w.--:. . ,8+* ^ %' ' ~ ft M 'W ^^ ^
n.. a-e- _- - - ~ af g ;%
- 4e e+ ' * -'
s ~ - -._
u ~ g+u s. -M g7
- g:,J % V%h.. -
... :: ww.g~h,-j+.. ni sg;.g .- . _=,_.a-
99 ._ ; ws<
b e p t w# p f w e n c e awwmm:+cs:. 'w m %gw3gw.e t- <r .w--P;.%, ';twQpw ~.3g%ah
,TWj g- m . , x%c1:h.n % a
K .-g - 2mm wp* w-e 3. c3 , x~ .s's - %*-
w%e,L, f %%e%se%m. Lie %%'^QW 7 x~w:<e:f&~.~,?M Mc & urd% 9 W + m~n 9 6:=nm n:,a .% W-
w . . es .a m%e%y ,,
QQ%y3f&?: eg~ amannw;w::.r.- Wenrmnv+ w ..s m .m m;r re w ; _. n.m: . :p -
. M%.:6- . - . - a - ~ 1. . 4. :.
U.S. Department of EnergyIdaho Operations Office * Idaho National Engineering Laboratory
,
2
A Study of the Cavitation Process in aTwo-Dimensional Nozzle Using Pulsed Ruby
- - .
Holography gt 'I her t c
fi[.uc ,\ [, Jf r %9 -
L_
C OCT 9 1981"
j. u.1,r>a m m"O n !% 3CA 3 ,~s 'J
Vance A. Deason G cy '\ '/s
James R. Fincke jN..
V/ o-
41/,a,\.''. x ., -
August 1981;
--
0111090002 811031 |PDR NUREG |CP-2276 R pDR I
Prepared for the y |U.S. Nuclear Regulatory Commission { $ g Q idaho !hUnder DOE Contract No. DE-AC07-76tDO1570 +

e.
NOTICE.-.
This report was prepared as an account of work sponsored by an agency of the United
States Govern.nent. Neither the United States Governrnent nor any agency thereof,nor any of their employees, makes any warranty, expressed or implied, or assumes anylegalliability or responsibility for any third part/s use, or 'he results of such use, of anyinformation apparatus product or process disclosed in this report or represents that, , ,
its use by such third pai ry would not irdnnge privately owned rights-
i
i.
.
t
I
|
!
l!
| Available from
GPO Sales Program
Division of Technical Information and Document ControlU.S. Nuclear Regulatory Commission $
Washington, D.C. 20555!
and! .
National Technicallnformation ServiceSpringfield, Virginia 22161
It
&
It
r
f
, , - - - , ,- - . _ - . .w . , , -- - . . - - , , . - - - . , - - , ,, - - - . . . . , - . , ~ , , ., , - - . - , , - ...
.__ - _ _ _ _ _ _ _ _ _ _ _ _ _ _ _ _ _ .
.
NUREG/CR-2276EGG-2120
Distribution Category: H2
.
.
A STUDY OF THE CAVITATION PROCESS IN ATWO-DIMENSIONAL NOZZLE USING PULSED RUBY
HOLOGRAPHY
Vance A. Deason,
James R. Fincke
'.
i
Published August 1981
EG&G Idaho, Inc.Idaho Falls, Idaho 83415
.
Prepared for the* U.S. Nuclear Regulatory Commission
Washington, D.C. 20565Under DOE Contract No. DE-AC07-761Do1570
FIN No. A6043
. . - - _ - _ _

.
*
ABSTRACT
The choking process in short nozzles with sub- tion rate is not large enough to fill the cavitycooled upstream conditions is dominated by between liquid jet and the diverging diffuser chan-nonequilibrium vapor generation. This situation is . 3.nel, the jet expands, resulting in pressure rise and
s
characteriEd by miriimum ~ hroat press' tiles, whicli ' apor casity collapse.' For higher 'flowirat'es, thet v -
-jet extends further downstream and rapidly grow-are less than;the; vapor pressure corresponding to' ing vapor bubbles begin t'o appear: The'explosiv'ethe IIquid tdmperature'.~ Pulsed h'olo'grapli nsgrowth of~these bubbles eventually breaks up theused to obtain detailed, three-dimensionali tges; 2
of the phase change process in a two-dimens al liquid jet. As the jet breaks up the flow reattaches,converging-diverging nozzle. The flow pat resulting in pressure recovery and vapor collapse.consists of a central liquid jet surrounded Thus, pressure recovery and vapor collapse,
vapor extending into the diffuser. In this regio depend heavily on the nature of the vapor genera-vapor generation is confined to the vapor-liqu tion process Details of the vapor generating inter-interface and is limited by the turbulent transpo face are shown in holographic reconstructions.of thermal energy in the jet if the vapor genera
n ..Q ,
*?
, .,1,
.
~ 3,
''t c.-, 4;
[. . I ( ,, i
e
*1
.
FIN No. A6043
ii

.
.
*
SUMMARY
An understanding of the discharge flow rate thus recorded, and velocities of the structures werethrough a short nozzle is of importance in subsequently determined. A series of hologramsunderstanding ho* loss-of-coolant accidents may of the nozzle for various flow rates and wateraffect nuclear reactor core temperature and temperatures was taken and analyzed.depressurization rate. The details of the phase
| change process in the nozzle strongly affects the The details of the growth and collapse of the
| discharge rate and hence is of interest. cavitation bubbles are shown in photographs of; the holographic image. It can be seen that the
A two-dimensional, converging-diverging noz- steam-water interface starts at the nozzle throatzie with a constant area throat similar to those entrance and moves toward the axis of the nozzleused in small-scale, loss-of-coolant experiments as vapor is generated. No evidence of steam gener-
;
was built to facilitate making holograms. This ation in the bulk liquid near the throat was observ-'
nozzle was installed and tested in a low-pressure, ed. For some high flow rates, rapidly growinghot-water-flow loop. These holograms were made vapor bubbles were found near the steam-waterusing a pulsed ruby laser (pulse duration of 20 ns), interface. The rapidly growing bubbles break upwhich permitted stop-action imaging of even the central jet and influence the pressure recovery
rapidly moving events. Some double exposure process. The maximum discharge flow rate, how-,
holograms were also made with an interval ever, is determined by the fluid behavior in thebetween pulses of 50 s. Moument of steam- near throat region and is independent of thewater interface structures during this interval were phenomena occurring downstream.
.
|
|
.
*
iii
_ _ _ _ _ _ _ _ _ _ _ . _ _ _ _ _ _ _ _ _

~
F
CONTENTS
ABSTRACT..........................................................,....... ii
SUMMARY..................................................................... iii ,
l .: I NT R O DU CT I O N . .. . . . . . . . . . . . . . . . . . . . . . . . . . . . . . . . . . . . . . . . . . . . . . . . . . . . . , l'
*2. . EXPERIMENTAL TECHNIQUES 7-........ .. ..... . ..... . .......... ..... ..
2.1 Flow Loop '7... ... ... ........ . ... . ............ ......... ... ...
' 2.2 ' Test Section . . . 7.... ... ..... ....... ..... ... .......... . ........
2.3 ExperimentalInstrumentation 8.... ...... ... ......... .. . ............... .
2.4 - H olography . . . . . . . . . . . . . . . . . . . . . . . . . 8 |.. . .. .. .... ... ...... ....
...... .133. R ESU LTS A N D DISCUSSION . . . . . . . . . . . . . . . . . . . . . . . . . . . . . . . . . . . . . . . . .
4. CONCLUSIONS 23.. .... .. ...... ............ ... .......... ............. ...
245. REFERENCES.. .. ..... .. .... .. ...... . ... .............. ............
FIGURES.
1. An inverted annular cavitation bubble, with bubble collapse near diffuser exit 2.. ......... ,
2. Axial pressure distribution in a conical converging-diverging nonle . . . . . . . . .. . . 3. .....
*
3. A typical representation of isothermal flashing on the pressure. temperature diagram . . . . . . . 4
4. Convergent-divergent nonle geometry 5. ... ....... . .......... .. ...... . ....
5. Vapor genera:ior on the top and bottom nonle contour surfaces 6-.. .. ....... ........ ..
7 i6. Schematic of flow loop .. .... .. ...... . . .......... . . . . . ........
!
7. Test section geometry . . . . . . . . . . . . . . 8-..... ........ . . ....... . .. ... . .
1
98. Hologram construction and reconstruction ..... .. ... . ..... ... ....... ...
i
- 9. Experimental ai rangement for holography 11. .. ...... .. . . . . ... .... . .....
1210. Experimental arrangement for two-dimensional nonle holography ... . ..... . .. .
*
11. A cavitation bubble extending to first diffuser pressure tap 13.... .... . . . .... . ......
12. A photograph of a holographic reconstruction of flow configuration in Figure 11 14.... .. .
.
13. Details of Figure 12 showing three-dimensional nature of the hologram . . . . . . . . . . . . . . . . . 13
1614. - A cavitation bubble extending the fulllength of the nonle . . ..... . . ....... ...
iv

1715. A cavitation bubble with breakup . . .
16. The full nozzle showing details of the cavitation bubble . . 18
17. Various views of the collapse of cavitation babbles 19.
,
18. A double-exposed hologram for time-of.flicht velocity measurements . 20
* 19. Nozzle diagram showing location of velocity measer c.ents . . . 21
20. Velocity as a function of distance from the nozzle throat entrance . . 22
TABLES
. . . 161. Test Parameters for Figures 12,14, and 15
. . . . . . 212. Interface Velocity
--
O
e
e
|
v
i
_ . _ _ _ _ _ _ . . _ _ _ _

A STUDY OF THE CAVITATION PROCESS IN ATWO-DIMENSIONAL NOZZLE USING PULSED RUBY
HOLOGRAPHY.
1. INTRODUCTION,
The maximum discharge Dow rate of subcooled uniformly at the throat entrance. The flow patternfluid in a shcrt nazzle is stroney deperdent upon is that of a liquid jet surrounded by a vaporthe manner and rate a; which the fluid changes annulus extending into the nozzle diffuser. Atphase or flaches to vapor during the acceleration approximately the di'fuser midpoint, the pressureand subsequent pressure drop imposed by the noz- rises and the vapor cavity collapses. The axialzle. Becr.ise the discharge flow rate affects the pressure distribution is shown in Figure 2. Themaximum : ore temperature and depressurization major feature of interest is that in the regionrate of a nuclear reactor under less-of-coolant between the throat and the vapor cavity collapse,exreriment conditions, the understanding of this the pressure is constant and less than vaporphenomenon i- important to reactor safety analy- pressure corresponding to the upstream tempera-sis. A number of theoretical models have been ture. The region of pressure increase correspondsproposed and computer codes developed to pre- to the region of cavity collapse. 't he fact that thedict critical or maximum flow rates and their pressure is higher than the vapor pressure near thedependence on upstream conditions. Currently, throat entrance is mdicative of the two-however, the chding process, particularly in dimensionality of the flow field in this region.those cases where nonequilibrium vapor genera-tion dominates is not completely understood. This The isothermal expansion of a liquid may bereport presents the results of an investigation into represented in the pressure-temperature plane by athe phase char.ge process in a tao-dimensional vertical line Figure 3. Point A defines the nozzle*
nozzl: using pt. sed holography. The use of pulsed inlet condition, and Point B defines the conditionholography enables one to obtain sharp, three- at the throat. The distance A-B is related to thedimensional images of the flow in a nozzle. These mass flux through the nozzle. For a given inlet*
images have led to a mcre complete understanding condition, the saturation line may be crossed inof the phase change mechanism in short nozzics. the expansion for some values of mass flux. If the
mixture were in equilibrium, the throat pressure BThe maximum flow rate of a fluid, generally would be equal to the vapor pressure. In real
referred to as choked flow or critical flow, is a w ell nonles, howeser, minimum pressures less thauuaderstoM phenomenon in gases. Experiments the vapor pressure are routinely observed. Thenave show n that some s;milarities exist between :esult is a metastable liquid core surrour.ded bycritical two-phase flow and critical gas flow. As in saturated sapor.gas flow for a given upstream nressure andtemperature, a ch nge in the downstream pressure For the application of pulsed holography to theleaves the two-phase flow rate unchanged and thus imaging of noneqmCbrium vapor generation inat the maximum. An additional feature of two- nozzle flow, it was decided to build a two-phase flows is that the phase velocities at the dimensional nonle (shown in Figure 4) with acritical flow condition can be much lower than the conwur simi'ar to the conical nozzles alreadycritial s etocities of each phase considered tested. This was necessary for two reasons: First,separately. Thus che sapor generation process and the conical nozzle geometry tends to degrade the.
vapor distribution in a nozzle controls the hologram quality due to lensing effects andmaximum flow rate. second the presence of the vapor-liquid interface
obscuru the liquid core. By using a two-~
The eisential features characteristic of the non- dimensional norrie, it was hoped that vaporequilibrium vapor generation process in short generation would be confined to the upper and
i nozzles appear in Figures I and 2 taken from lower contour surfaces, leaving the liquid core
| Reference 1. In Figuie 1, vapor generation begins clearly visible. As shown in Figure 5, this was
l1
_ _ _ - - - _ _ - _ _ _ - _ _ _ _ - - - _ - - _ _ _ _ _ _ _ _ - - _ _

.
indeed the case. Vapor generation is initiated at the holographic camera system and a brief theorythe relatively sharp corner at the throat entrance, of operation are presented. Then, a comparisonprobably due to flow sepaiation at this point. The between the holograms and photographs obtainedside walls, on the other hand, are smooth, and, by conventional techniques is made. The observedeven though the liquid core is superheated, it phenomena are discussed along with various
*remains in a metastable state to the point of pres- aspects of the flow field. Special attention is paidsure rise and vapor bubble collapse in the diffuser. to details of the vapor-liquid interface and inter-
face velocity. Finally, the importance of the obser-In the first sectica of this report, the flow loop vation with respect to current vapor generation e
is discussed along with a description of the test models is briefly examined.
g section and experiuental instrumentation. Next,:
.- * ..' - - ' -
.,,
||7: -
| .e b|
e- Tne / $* '
|>
"ar
- * . ,. 3 -, . .e_
y:$""
, N ap . . s;
.f . , . . . b''
,
. .. ., .. -
|' ki;
.. @ . <'
.,
' D % 2 . ,s_ ,,3
'y, , . ; :- 3 W ~".. . . . . ;.
.
-a n, ,e . .
; q 3.. '
,- ., - ,.
, . 2 . ~iy;.y1e
i ,r . Sy; . 4:a
,
' 'M6 ''
f.,,..'$ y', m. * . - ..
1, ,
: j.r . . .
. .
..,-'
.-, . s , ,
d , e ' '
4. *.,
''.. ,
,,- ' **
,. .
e>- - <,-
.
,.
.
,
- v. . .
_
... ;.,
'
* - *g f ,
-...a <.~ #- -_ t
- \ .. , . e *
g .'q *
-
> . - - -.'A -e. 2 . 2 - * ,
|
Figure 1. An ins erted annular cavitation bubble, with bubble collapse near diffuser eut.
.
I
l||
|

. . . . .. .. . . ._ - - _ _ _ _ _ - _ _ _ _ _ . _ _ . _ . _ _ _ _
lr
.
1.5' ' I I [ g g
'
- . - .~
Nozzle contour
- _
1.0 -e~.N* -
oc.%o.6= *225$&
C0.5 - ,,
.
\. e-. g p
53.37 kPa '. . ..e
' ' ' f I L i i , ,04
0 2 4 6 8 10 12 14 16 ;8 20 22
Axiai nc27Je coordinate (cm) INEL A-18 733
Figure 2. Asial pressure distribution in a evnical conserging4iserging non e.
.
w
C
3.
. - . _ _ _ - - - _ - _ _ - _

200 , , ,
*oA
o Ups' ream ,
a First throat tap
16C - c Minimum throat -
pressure
120 - -
%c. Liquid6E5m8c.
80 - / -.
oe
oB
40 - -
Vapor
Saturation line
!
' ' '040 60 80 100 120
INEL-A 18 731Temperature ('C) ,
Figure 3. A typical representation ofisothermal flashing on the pressure-temperattae diavam.
.
4
. - __._

_
e
.
. = 215.9 =
== = 42.0 = = - 2 135.9 =
$12.7 25.02
.\ -L 17.3 \\ d3.65*
'n
44.4 18 OG 34.93" 57.15
"y
1 F
6.35 W#
19.05 ~
-+- 31.75 -+-- 44.45 -
57.15 :-
= 69.85 =
= 82.55 =
-= 107.95- =.
133.35 =+ - -'
m 158.75 =
* = 184.15 =
'
All dimensions in mmINEL A 16 736
1
Figure 4. Convergent. divergent nozz!e geometry.i
|
,
i
|'
|
i
.
S
|,
t.-- - , --. . . - - , . . - . - , . , , .--.-..m, - %, , - - .y- e, .. ,,-,- , . . - . .

11
i
|
|
e
W, A'p ' ,' ',, - ' '. . - --. , . . -.> ;. ! : . ,.
2 . , . .- .e . ,. ** '
.. . . . '*
. - .
_v .g.:- ,K ' & q.-. - _' ., : : ; ...? !~ . . '%{ "|~ h
;;h.. .,,
-. e' .,,. ." , ; yy .. . .a. - ,
r
y.. "; f -; 7_ ' - . sf ' V- , '' :: 3'|'.>.- ~..- -.-| -. = . . . -- :
-
.,
c.. ;,. 4.;.g c
3.
. , . - ' .n p p-_
. ; . ;,. q:q , ', , .5 _ g6
*
.-i
, ;, 7 . %. ..+ -: - : ' . s -*+
3 _ . ? x. . . , ._. . , - =. . .:.~ . a ;, ,
-
;} $y.k f, %.,i ,{g.,wg y ..v. y .
, , .
- ~~ * '#. fi{
- % .J -*
[ .L _ . - '
' ' f |g - ' '
i
> < y . - - e
[h. b'..--7 .. 4, . > n. p r. .
I.f.
- )-* b I W/'W ',l' ,T} ? ; - h --
, .
, [ye y%. _..- - -
( ,g. 37_; ;; y,4 . ,, y.y ,g. , ; . .w ev.y 3 - v . - -
, .,,,,
. 7,.9 .g; y-
.,,...,.y y - 3 . . . - , , . . . . . . .~ ^ -
.
,
1 .:'> ' ., : . .P . , - :. m-
u'
'_"
' - '
7. .-
-- . s ]% . . .; ' ''
. .,
5i 8 4 . .
.
. ;f-V : - '_ Q,,, . . 3[ i,;. ' ypyy [ +' :: _.
n'1 ::s _y. _ .-- :
. ... -p' _
. yh.,m .
y f -?!, ; . ", 7 ?, ''"f"j**', ,. it - '.?..'-, 4m'g .. 1 * ,;> f. . ,,,e,',_? p. ., .. .' 'y- 3_ _ . y .. 3 '+- .
\ .
'
.g i } | ,'
4..
Qr, h .., 4''
@. . , ~ . . .; .# E .-.m
; . .v ...-.s s4 c.-p.,
.a. * '- *W 3.1
,. .
..'-.g+4.4 - i/ ti* -. ,p '' ; . Y. - * ci, t 7.
..,g' - .-)\i
V , y ".-:._ t. ' ., ;4.-"3-''s ' - .
?* x**
?<: f, . . I.p , '. ,.',3
, ;..,.''v. . . . . ,s
.,
4.-
e %., , .[ .e's'.''[g'( [: ' ~. - ~ ,#- .g.
-- w .1'y^
,.
3 .-.
h. %* . L j'* .'. 6 g , .;. , ,""..,,r- .
,
h ' . )...'. .. . *
. , -,n. h ~* ...?~ ..- ' . . , . .' .'' <,
.' - .
'
' 1.
l. .,. .
...
' ''
.- . ; p . ,; : p.,.4 . ' " 'i
- ,.a . .- g-
< f,p 4 ~g, ,:_:,,- r
, . m .. - ., , . . . x, .,-f : ./ s . -;
. ,. -
s,,f <m;. .
. - :e'. , . _
? . . -j ~
,..*
1
.; . . ' , ;-_'&. v , . , -,. _ .p; -'g. ; 4. . ..>4. ;gi ,. - (. Q . ,. . ,. 5 , . r . ,. ~ . ' 'Q .g * ..;
. _ . ...-
..
.
I mure 5 \ apor generation on the top a.id bottom no//le contour urf acet
.
- ___ _ _ _ - . . __ _ _ . . _ _ . _ _ _ _ _ _ _ _ _ - _ _ _ _ - _ - . . . _ _ . _ _ _ _ _ _ _ _ _ _ _ _

2. EXPERIMENTAL TECHNIQUES
in this report, we will deal primarily with contrelled by a variable-speed motor, was used toqualitative rather than quantitative results. With set the flow rate. The flow control valve immedi-
o respect to this, we will only briefly examine the ately downstream of the pump was kept in theinstrumentation used to obtain quantitative results open position. The back pres <ure on the testand concentrate on the flow loop, test section, and system could be adjusted by closing the backholographic camera. pressure control valve until the desired back,
pressure was obtained. in this operational modethe flow is critical if for the same flow rate,
2.1 Flow Loop (upstream temperature and two different down-stream pressures), the inlet pressure remains the
The flow loop is shown sc!vmatically in Fig- same. No flow limitations were observed in theure 6. Tap water was circulated through three- loop, except those imposed by the pump.inch-nominal-diameter piping by a centrifugalpump capable of 5.5 Ils at a head of 300 kPt 2.2 Test SectioriThe tap water was degassed by heating to the boil-ing point, then the free water surface in the calm-ing tank was covered by a plastic fi'm to reduce A diagram of the test section, including the.
reabsorption of gas from the atmosphere. upstream geometry, convergent-divergent nozzle,and receiver appear in Figure 7. The entire test
Following the direction of the flow, the main section was fabricated from tran< parent Lexan socomponents are: the circulation pump, a flow Inat 'sual observation of the flow phenomenacontrol valve, a standard three-inch-diameter tur- could te made. The upstream run consisted of abine flowmeter, the test section, a back pressure 1.8-m section of 4.44-em 10 Le$an tubing, thecontrol valve, and the water supply tank, contniu- length to diameter ratio was gproximately 41.
5 6ing an 8-kW heater. Hydraulically, the upstream For the Reynolds number range '.ested,10 to 10 ,pressure is set by the flow rate. The pump speed, this should rewit in a fully developed turbulent-
2300-L gstorage Back pressuretank control valve
8kWheater Test
section
O Mainpump
Flow control Turbine flovevalve meter
*
-- -
*
INEL.A-15 024
rigure 6. Schematic of flow loop.
7
_ _ _ _ _ _ _ _ _ _ _ - _ - _ _ _ _ _ _ _ _ - _ _ - - - _ _ _ - _ _ _ .

-- __-
Upstream run Convergent - Downstreamdivergent receiver
__
nozzle- - _
e
Flow = 4.44 cm ID 3.49 cm ID
4-
_ _ _ _
_-
= 18v cm = + 21.6 cm *- = 43 cm =
INEL-A-15 025
Figur- 7. T est section geometry.
How field. The nozzle dimensions and pressure tap with a grounded junction. The thermocouple waslocations are shown in Figure 4. The transition calibrated and found to read within 0.l*C of stan-from the round upstream piping to the rectangular dard Type K calibration values,nozzle was accomplished through a well-roundedinlet. Each pressure tap had a diameter of The upstream pressure was measured at the first
0.76 mm. Care was taken to polish all inside sur- nozzle pressure tap located upstream of the con-faces to remove any burrs resulting from the vergent section (Figure 4). The pressure trans-fabrication process. During the polishing process, ducer used for this measurement as well as thethe throat entrance was slightly rounded. The dif- throat pressure was a Validyne Model DPISTL
'
fuser terminated in a constant-area, downstream differential pressure transducer referenced to thesection of 3.49-cm diameter and 43-cm length atmosphere. The accuracy of the pressure meas-resulting in a length-to-diameter ratio of 12. One urements, including pressure tap errors, vias 1.4%
*should note that baause the nozzle channel height of range. The local barometric pressure wasis identical to the conical nozzle diameter, the con- obtained at the beginning of each test from atraction and expansion ratios for the two. mercury barometer.
dimensional nozzle are not the same as for theconical nozzle. 2.4 Holography
2.3 Experimental In this scetion, holography, m.cluding typicalInStrumentat.lOn construction and reconstruction techniques for
holograms, is discussed. The general laycut of aThe variables of interest in the study of initially holographic camera using a ruby laser is given and
subcooled, choked flow were the flow rate, characteristics of the ruby laser specified. Holo-;
I upstream temperature and pressure, and mini- graphy is compared with ordinary photography,mum throat pressure. The experimental instru- and firally the experimental arrangement is shownmentation was chosen to provide these and discussed.measurements.
Holography is a technique for recording and .
The flow rate was measured by a standard 3-in. later reconstructing the complete structure of thewavef ont of light scattered by an object. Ai ITT Barton flowmeter calibrated in the range of t
O.3 to 10 L/s. The accuracy of this flowmeter, typical optical arrangement for holography is',
ebtained by calibration, is better than 1% of shown in Figure 8. A laser output is divided intorange. The upstream temperature is measured in two equal beams which are then usually expanded
! the 3-in. loop piping by a 1.45-mm-diameter, and collimated by lenses. One beam, the reference
( Type K Chromel alumel-sheathed thermocouple beam, is made to shine directly on the recording
8
e
'. - - - - . - - - - - _ -_. -_ _ _ - - _ _ _ _ _ _ _ _ - -

d object ObjectMirror e
' I( ,
.) f )[[. / Scattered
wave/ jfront
atial'
Beam Lens /~
SplitterHologram
p \ \.\\~ '
-
Laser Collimated reference beamLensMirror
'
(a) Production of a hologram,
>
A
O
i4
l_
Referencebeam 7
Lens
iter 3)Hologram
Laser Reconstructed'
|replica of originalscattered object wave front
4
''(b) Reconstruction of a hologram-
Figure 8. Ilologram construction and reconstruction.
.
I 9,
= m . _ _ _ _ - _ _ _ _ . _ . _ _ . . _ _ _ _ _ - _ _ _ _ _ _ . _ _ _ . _ . - _ _ . . _
- ;'r
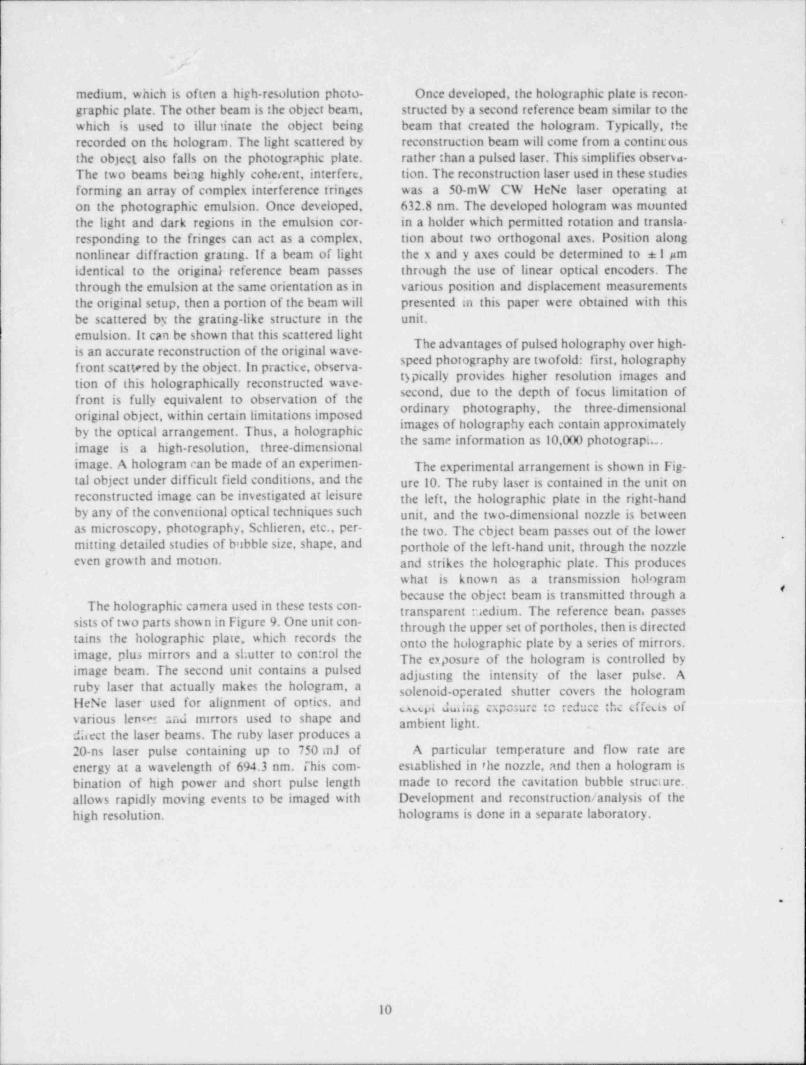
medium, which is often a high-resolution photo- Once developed, the holographic plate is recon-graphic plate. The other beam is the object beam, structed by a second reference beam similar to thewhich is used to illut tinate the object being beam that created the hologram. Typically, therecorded on the hologram. The light scattered by reconstruction beam will come from a contincousthe object also falls on the photographic plate. rather than a pulsed laser. This simplifies observa-The two beams being highly coherent, interfere, tion. The reconstruction laser used in these studiesforming an array of complex interference fringes was a 50-mW CW HeNe laser operating aton the photographic emulsion. Once developed, 632.8 nm. The developed hologram was mountedthe light and dark regions in the emulsion cor- in a holder which permitted rotation and transla. <
responding to the fringes can act as a complex, tion about two orthogonal axes. Position alongnonlinear diffraction grating ~.-if a beam of light the x and y axes could be determined to A1 midentical to the original reference beam passes through the use of linear optical encoders. Thethrough the emulsion at the same orientation as in various position and displacement measurementsthe original setup, then a portion of the beam will presented in this paper were obtained with thisbe scattered by the grating-like structure in the unit.emulsion. It can be shown that this scattered light
The advantages of pulsed holography over high-is an accurate reconstruction of the original wave-speed photography are twofold: first, holographyftont scattered by the object. In practice, observa-typically provides higher resolution images andtion of this holographically reconstructed wave-second, due to the depth of focus limitation offront is fully equivalent to observation of the rdinary photography, the three-dimensional
original object, within certain limitations imposedimages f holography each contain approximately
by the optical arrangement. Thus, a holographicthe same mformation as 10,000 photograpt. .image is a high-resolution, three-dimensional
image. A hologram can be made of an experimen. The experimental arrangement is shown in Fig-tal object under difficult field conditions, and the ure 10. The ruby laser is contained in the unit onreconstructed image can be investigated at leisure the left, the holographic plate in the right-handby any of the conventional optical techniques such unit, and the two-dimensional nozzle is betweenas microscopy, photography, Schlieren, etc., per- the two. The cbject beam passes out of the lower
'
mitting detailed studies of bubble size, shape, and porthole of the left-hand unit, through the nozzleeven growth and monon. and strikes the holographic plate. This produces
what is known as a transmission hologram#
because the object beam is transmitted through aThe holographic camera used in these tests con- transparent raedium. The reference bean, passes
sists of two parts shown in Figure 9. One unit con- through the upper set of portholes, then is directedtains the holographic plate, which records the onto the holographic plate by a series of mirrors.image, plus mirrors and a shutter to control the The exposure of the hologram is controlled byimage beam. The second unit contains a pulsed adjusting the intensity of the laser pulse. Aruby laser that actually makes the hologram, a solenoid-operated shutter covers the hologramHeNe laser' used for alignment of optics. and pt dwing cxpmure to reduce the cffest3 ofvarious lene and rmtrors used to shape and ambient light.dhect the laser beams. The ruby laser produces a
'
20-ns laser pulse containing up to 750 mJ of A particular temperature and flow rate areenergy at a wavelength of 694.3 nm. This com- established in the nozzle, and then a hologram isbination of high power and short pulse length made to record the cavitation bubble structure.allows rapidly moving events to be imaged with Development and reconstruction / analysis of thehigh resolution. holograms is done in a separate laboratory.
.
10

. . . .
_ _ _ _ _ _ _ _ _ _ _ _ _ _ _ - _ _ _ _ _ _ _ _ _ _ _ _
--~1 Hologram platep- holder
\^ Receiver-
-'' N-/
\/~
' %,N
p
d ~
'. Collecting8lens
%m
1 ^ Scattered objectbeami
^ Transparentm test section
/^
7 Flow=
Collimated (reference fbeam-parallelwave front gObject beam
.Collimating lens
i
-
_
_
-
Spatial/ eam splitterBfilter
f~'' Collimating
\He Ne lens - --
alignment s
Ry ubylaserlaser,
N
N\
'
__
y Transmitter\
-:..
M' 'M INEL A 18 732
Figure 9. Experimental arrangement for holography.
1I
. .. . .. . _ _ _ _ _ - - _ _ - _ - - - _ _ . _

.__ . . . . - ~ _ . . . . - - - _ _ _ _ _ _ - - . _ . _ - _ - . - . - - - - - - _ - . _ - - - . _ - - - - _ _ -_
|
|
I
I
*2
!*
|
'
I
.
IJ,:
, ,
Ip.~ '
t
|'
| ,
!~~ %
|',
.
I
,
-..
.
'%
- N e,
P
{
m .
Figure 10. Experimental arrangement for two-dimensional nozzle holography. -
f
.
h
|.
|*
,
12
- - _ - . _ -.. _ _ _ _ _ . -__._... _- -_ ____.-.- - ___ - __ - _ _ .

_ _ . . _ - - - _ . __- . _ - - - - _ _ _ _ - _ _ _ - - _ - . - - _ - _ _ _ _ . - - -- - _ _ _ _ . . _ - - -
|
!
3. RESULTS AND DISCUSSION
in this section, the results of the holographic film. The photographs presented here were |
study of nonequilibrium vapor in a tw o- printed from these negatives. There is an approx- ,
dimensional nozzle are piesented. First, the imately 1.1 linear magnification factor introduced o
technique by which the holograms are recon- by reconstructing the hologram at a wavelength'
structed and photographed is described. Then, diff erent than that used to form it. This effect canholagraphy and photographv are directly corr be corrected by using objects of known size in the ,
,'pared and some of the advanuges of holograph > image to compute a correction factor.are denaenstrated. Next, reconstructions of the !steam-water interface are presented and discussed. Figures 11 and 12 show a conventional photo-In particular, the detans of the collapse of the graph and a photograph of a reconstruction of a !cautation bubble are shown with hologram recon- hologram of flow in the nozzle. The major dif- istructions. Finally, double-exposure holograms Iference between these images lies in theare used to determue the axial velocity of certain hologram's far better resolution of rapidly movingfeatures on the interface. wases and bubbles at the water-steam mterface. f
The holographic camera was used to make a This arises in part, from the 20-s pulse length of jnumber of holograms of choked flow in a two- the ruby laser compared with a flash duration of (dimensional nozzle for various flow rates. In addi- about 0.1 ms for the photograph. A further dif- !
tion, photographs were made using a still camera ference is apparent in Figure 13 taken from the |and electronic flash for illumination. The holo- same hologram as Figure 12. liere, the recon- I
grams were reconstructed with a lieNe laser and struction camera has been focused at various |
the reconstructed image recorded on photographic planes in the holographic image to illustrate the i|
. ~ -
;..
/ -
-
-
-
|,.
..
4 e j
"ya 7 - 'C m.- - , .
) .x -
Q g. ,T' ' -f. . g t.
.; .
-. <f
"
i'g
~
h -d 4 .- .. e L ..
,,. . ,
.
$ W.._W* V;:- -- r. ,.
E
Figure i1. A cavitation bubble extending to first diffuser pressure tap.
13
- __ _ - . - _ . - . - _ _ _ - _ _ - _ _ . - - - - - - - - - - _ - -

_ _ _ . _ _ _ _ _ _ _ _ _ _ _ _ _ _ _ _ _ _ _ _ _ _ _ _ _ _ _ ._ _ _ _ _ _ _ _
~
|
s
t
''' QG;.; Q ,: m n " hs * .-
,
% ,, ,; .pY' i e+ n'- >, , . ., ,.
g Q', y , '' ' ~y~3s a'
{ ~. _
ig f '* #js , b* *p -
y'
'
c i''
.
,. .., ,
(fQs,,.' ' ,p A* ' , ,
'
be,& w; , 't .,
%y.
- .,
. *h.*.,. ---
?4 -i- - -e,4 ; ,
- .,
. . .()7. ' '~
,
-. 3. k'. > ' ~ g%,..
, ,,-
"*w
K.x, > s -
',s'' --
- ; ce,s - il. ^.
. , , , .- ,. , ' ' yq q, , , , , ,- ,
.~s . _,v .. .i 1; ..
...
,
-,
,
..k1.>/* As +
& ..k ? |, .i^~
*,
-- -<-s
.
*
[, *. . ,r- =-,g. o .* \ p :$ c, c.~ w| W 4
\ Yy ,
f s;4.,' ~ e',/.'.,,v. ,,1
. . .
, . .y_ u , n , ~ f,U' *v* .a ~
' . .'q c 7. ,,-.w..
$r. ' '
t j ..t.p. -
,.
*f| . _ ,, ee
w. . . ' | _ ' . .,c |+'~.
L tWETA;.. . . * % . %; .- .. . . .f
s1. , m %, p , :;. ryw; ., c.
,?- t ~ r-y: [. i ~ . . ,-+' '~
; +,,'
u,-
>L ,4
+ :N... .
i
.
._
Figure 12. A photograph of a holographic reconstruction of flow configuration in Iigure 11.
14
_ _ _ _ - - _ _ _ _ _ _ _ _ _ _ _ _ _ _ .

- .._______ - - . _- -. _ - - _ _ _ . - _ _ - _ - - _ _ _ _ _ _ . _ _ _ _ . . - - _ _ _ _ _ _ _ . -
1i
~ .,m
,- . _, -,,-- --..p yq
'' q,
,
. .. ]! rwN. ,'i , w ;. ; - - %
,. pg. y f'' , ~'
. .
,
* 1. neg "
wi,,
^ ~''~
'
Nji i>ya .
. .
.
, .
!i ,
:. c+ ,
-> _- |,
' M
'
|
1
;
Figure 13. Details of Figure 12 showing three-dimensional nature of the hologram.
| three-dimensionality of the holographic image. In In Figures 14 and 15, the flow rate is increased,.
each photograph, a different set of features is in causing the central liquid jet and vapor layers tofocus. No conventional photograph could simul- extend past the diffuser into the piping down-taneously resolve all these details, stream of the nozzle. The test parameters appear
,
in Table 1. As was observed in Figure 12, theIn Figure 12, vapor generation starts at the phase change process is confined to the vapor-
throat entrance. The phase change process is con- liquid interface. At this flow rate a second phe-fined to the interfacial region between the liquid nomenon begins to appear, namely the break upcore and the upper and lower vapor layers. The of the jet near the diffuser exit (Figure 15). The
'
vapor generation rate is limited by the turbulent appearance of the separating piece of fluid in this
transport of thermal energy in the jet. In the dif- picture differs markedly from that observed infuser, slightly downstream of the throat, the Reference 2. It is felt that the breakup process
pressure rises and the vapor cavity collapses. The observed here is caused by the rapid growth oflocation of pressure recovery depends on the back vapor bubbles. The evolution of vapor bubblespressure imposed on the system and the momen- growing in a superheated liquid is characterized by
tum carried in the vapor phase. The momentum an initial time period during which the bubble site
flux of the vapor phase is primarily determined by changes only slightly, followed by a period ofthe rate at which vapor is generated. Downstream extremely rapid growth. Thus, unstable bubbleof the abrupt collapse there is a considerable nuclei are swept well downstream of the nozzleamount of fine debris, consisting of either vapor throat before exploding. The explosive growth of
remnants or dissolved gases driven from solution these bubbles eventually breaks up the jet. As the,
!during vapor generation. Due to the time required jet breaks up the flow reattaches, generally well e
| . for air to dissolve in water, the latter seems most downstream of the diffuser. Ultimately this results |
| likely despite the attempt to degas the water before in pressure recovery and vapor collapse. The |'
testing. The flow rates, temperatures, and pres- process of jet breakup by the rapid growth ofsures corresponding to this test point appear in vapor bubbles has been observed in free jets by
Table 1. Lienhard and Stephenson.3
15
- - - - - _ _ _ . _ _ _ _ . __ _ . _ _ - _ _ _ _ ,

- _ . . . _ _ _ _ _ _ _ _ _ _ _ _ _ _ _ _ _ _ _ _ _ _ _ . _
Table 1. Test parameters for Figures 12, coefficient is dependent on the vapor generation14, and 15 process, which is in turn dep(ndent on the trans-
_.port of thermal energy in the liquid jet and thethermodynamic properties of * . fluid.
FiguresFigure 12 14 and 15 In Figure 16, a view of the entire nozzle appears g
with enlargements of certain seatures. All of thesewere photographed from the same hologram and
Stagnationshow the great resolutiott present in the hologram. 1temperature 75.6'C 75.9'C View I shows the gradual growth of wavy struc-ture as the casitation bubble itself grows. View 2
Stagt.ation pressure 107 LPa 150 kPa shows a water drop almost separated from the'
bulk liquid. In View 3, a droplet appears to be, 58 L/s 3.34 IJsFlow rate entrained .m the vapor phase while other droplets
are in the process of formation. Another droplet isThroat pressure 3.73 kPa 37.8 kPa
shown m. View 4.
Difference between 1.16'C 1.15 C Figure 17 contains several views of cavitationstagnation bubbles collapsing. These were photographedtemperatures and from different holograms. In most cases, the col-
.
vapor temperatures in lapse is abrupt. Howeser, there is usually a largethe throat amount of fine debris carried downstream from
the collapse point. These vapor remnants areeither steam or dissolved gases driven from solu-
An additional feature of generalinterest, which tion during vapor generation and which have notcan be observed in Figures 12,14, and 15 is the had time to redissolve. The latter case seems mostdecrease in effective throat area by the presence of likely despite the attempt described earlier tovapor. This f act suggests that the nozzle discharge degas the water prior to testing.
.
h)j*y
Q :' ' y p ,. ; ,,, , ' '$'_'," . ,'$,[[1 h[(I Yh,s ,g +#{h , . . '* <f .
f,,
.*3 .-
. - , , .% s. .
.q, y . . . , , , ,
n -
>p { *,: t % % O}.%g, M ' 'l . ' -' -
;e [7'
,.''g ,,<,e, j,- e a ;;,
N ,I } ;4 1. [ '' - '' 'k~ **~
) ~
*,
; ;' Wyf ' ff, ,y,-y ; =-w s,. ,,;
. M.* - > o. uo- ..u j6-Hi y g : y _u .( .
'' q ,;.| | f je;y -
"'~
2%m(ib ?;,4L . : ".,We u-s
Q| N* 1
?- : ,
,
bN+" '
4 ; .a , ,,
s.
f ' E' hfd. *i Y,'
.
,.e ao. - .
gg_ g k-g %Wg~
Figure 14. A cavitation bubble extending the fulllength of the nonle.
16
. _ _ .

.[.fbN .i *~*'s? 'T; p,,;, [ !L*|.. ty; p&kWt* E* N 20 ,. '.x &' Y
'
, -m .
. p ;a.. .. r a . . . . . * . ... . . ) . ,n - ?-
- , U % d "'*; 5 & .b 5 %. 7 h g .'4 g. w.UYQ & N '3 -
*
J .
j-"_ ., , ,s -
. a ,,,, t ems y . ,.
y-- . e
,
* 4 ,
' '|s ,' , .~'. p. .
.
t,~
e. , n:..
L[__ ::1
':
Figure 15. A casitation bubble with breakt p.
A series of double-pulsed holograms with a time shows the results of these measurements. Theintersal of 50 s between pulses was made. One of accuracy of these measurements is limited ' y theo
these is show n in Figure 18. The result is s ery sim- precision with which a particular point can beilar to a double-exposure photograph where mov- relocated on the two images and by how accur-ing objects produce two distinct images separated ately the reference beams hase been collimated.by a distance determined by the speed of the This error is estimated to be 0.07 mm, whichobject and the interval between exposures. For our corresponds to *8% in the selocity determina-
*
purposes, interface selocity means the selocity tion. The s elocity data are plotted in Figure 20 as a
with which distinctise features of the interface are function of position in the riozzle. There is nocarried axially down the nozzle. No attempt was significant variation in selochy.
' made to measure the transverse component ofvelocity, which is composed of a combination of Such time-of-flight ,elocity determinationsbubble growth or collapse and complex motion of from double-pulsed holograms can prosidesurface features such as wases. The axial velocity detailed local selocities throughout a solume of
; data presented here come from .neasurements on a space at a particular instant in time. This is in con-representatise hologram for the following flow trast to laser doppler anemometry (LDA), which,
j conditions: pressure 3.0 psi, flow rate prosides continuot* s elocity information at a par-=
| = 41 gpm, temperature = 75"C, intersal between ticular point in spa.e. Velocities at other locationspulses = 50 83. must be obtained by traversing the LDA probe or
by using sescral LDA systems simultaneously.Figure 19 shows the points along the nozzle at Double-exposure holography and LDA therefore
which distinctise features on the interface per- can be complementary techniques for selocitymitted velocity measurements to be made. Table 2 determination in certain situations.
.
I
I,
1 17
!t
(_ - - . _ . .
_ , . _ _ _ _ - - _ .- .. . .__ _ - - _ _

aw n
f
- . . . . .
1
(m t: %.
#' ..#< * - - r_
. , ~ +,. s .- - +.r .e a.. ix . . , - e, .. .. a. >
Fully formed droplets
ngy wr: m ,a . . . ..:. - --
cc .. *# * 7 . y Y'J;; y ,, '* 1 y/173v. k - ;'#.n.s,.* ,e t fA ;s;., d.,Jt
7,. , [ :'+
'',,
'
2^ ' Flow.,
'
|p'.|- ~5|,F'''^
^ :, -,
t --} ' - direction' 'Liquid + s
=
Vapor ~
(
Suriace wave developrnent
r .wpw, x ~;; , , , ., . ~. +.: pe,;;,7_; z~ - ., ,,
m( N Initial stages ofdroplet formation
Figure 16. The futi nozzle showing details of the casitation bubble..
9
18
1
- - _ - _ _ _ _ _ _ _ _ - _ _ _ - _ _
j

_
_ . _ . . - ~ . -. .
( , . /, j 4 .
>-
. . 4 ';-
-~ % y,'4.:",,
1
~J,*k | -. ~ s) .- _,
._d , f J, _h kWN1 ' I. , ,
m..
.
f-Yh ffbN;97:i(7"?*"%'Tr?.mpqm
k c. .| %u , , m,|||..^' '.#*
~
.: $,;.,v.A V,;,e i- %,1
'p. .. .gu
6
y K :.;m.-g
L M n r ; :s$,, s t'' .j
~ ~ . .. . ;s
* .3-
.
. . .
.
} MCM Q W . Q;T "% .';r% T R 7 Q:TDT 797%,-|t|j *Y
p''s ,% :q;:.m 1,%g g r g:vga x/y., n .r.p-q? y.;v9 7: er. c,- w . .?,;;;-
.
.e-:y; q_~u?m -p a ,,- ~;;yu ,e g,p p;4 - pe*- L L iv ~ n m. .
hyN:digigf b j~ ~Zp1.p/+n. .,'-}!!'4_
~ ,
.W 2w
.
,.
. 3, + yW , g,, A &%n _.. g,3 .,wr, - % e, c,p;y, .'..,%, G _( l ,y . 4 -
. . , . y &, c .1 .c-w -
.
sL i' gilJfk'
& yc e. . , ' ', 3 , ._ .3| ., . . s . ..;e-
. g. M;* '|f u'y: rd's. ..,f t 1
,o *5 * i'a w :p 's
.
o,+
>\
|.t,r o rs.e
. . % t - ) $h, , , ,Mi
I,
Q g,:, ,
.y ,; ,
.
,,
|
|
.
. .
*
Figure 17. Various views of the collapse of cavitation bubbles.
19
. -._ _ _ _ _ _ _ _ . _ _ _ . _ . _ _ . . _ . . - _ . . . _ _ _ _ _ _ . , _ _ _ _ _ _ _ _ _ _ _ _ _ _ _ _ _ _ _ . _ _ _ . .

. . _ _ _ . . . . _- -. . .. ._ _ __.__ .__ , _ _ . _ _
.
$
i
i
( ,
,
I
|
l
|
|,
r|
#I
I ,.s ,
>
# -$ ,[g , ''
, ,9 . . ' :. Y Mu. _.
| " ''" ' s er "v - ,, swg' .
! :o; q:,4 %p,,
.+ f," [ . f.: 'Idi.i~ [ ,''
.a. , a' .,.
s y,'
,, .. .;, , - + * C.p - +e- .
.,
[! , . 4< '''
9[ ' *M . '
'
...
--
.
!
Cf .1* p
.
.
'TN !
* & 'R 'W' f'~'$ f;l, J. ,'s:, C . \. '4._,e*ip j v '+. i_
.' -
-AE, , n '
% ; ,r49m?[2x . . g4&:Q,.%'c. . w:s ,>
.,,~f'h*<4 j$.Y;g MI4fiy# M, y .i AO .. .,
fA *! kh .,h A k ,~[' p M 4 '
<' ' Y^ *? ~ ' '-
9tA .A* ., i. ,
* p 't y'1% ..', j ~ . . - - . .- , ". J.,./,
|*
% -% .
# ..s ,V .
t. - ,/}r ,=p
.
' +
.t*' .. . . .' ,. .. ./ . ..
..<
..'. ) ..v. . ,
v%'".,''*^
|) ,-* ,
,|.'?r 'r. i
,,
f
Figure 18. A double-exposed hologram for time-of-flight velocity measurements. I
l;
;
i
I
,
|'i-
20
. _ _ _ . . _ _ ____ . _ _ _ . . _ _ _._

- _ _ _ _ _ - _ _ _ _ _ _ _ _ _ _ _ _ - _ . .__ _.
= 215.9 =
- - 42.0 = = = = 135.9 =12.7 25.02
~
1 _ \ n
h 17.3* 1> ( 3.65' "
d44.4 18.28 34.93
"3 57.15'
su s ses 3 , ,, , q,
\f L ')Velocity measurements e
All dimension:. oi mm INEL-A 18 734
Figure 19. Noizie diagram showing location of velocity measurements.
Table 2. Interface velocity
Distance fromEntrance of Nozzle Velocity
(mm) (m/s)
54.700 Throat entrance
62.770 8.7.4
64.640 13.3,
66.284 15.6
''68.5G8 10.4
69.500 16.3
70.596 14.8
82.274 14.8
84.586 16.3
94.548 14.9
101.472 13.8
104.134 17.3
123.830 15.2'
Mean Velocity = 14.88 m/s,
Standard Desiation = 1.89 m/s
21
- _ - - _ _ _ _ - - - - _ _ _ _ _ _ _ _ - - _ _ .

.. . _ _ _ _ _ _
v
2.0 (iI i. i i
3,1.8 //_-
* * -1.6 -
e- e Mean
e e, e_ *
~
e f egT 1.2 - -
m
1.0 -*
# Error for velocity --
measurement == 8% of value_o. 0.8 - -
$0.6 - _
0.4 - Nozzle -
entrance
0.2 - (54.7 mm) _,
I I tO0.4 0.6 0.8 1.0 1.2 - 1.4 (-
,
* E'^48 #30'2Axial distance (mm 10 )
Figure 20. Velocity as a function of distance from the nozzle throat entrance.
i
t
?
22
..-.
. . .

4. CONCLUSIONS
It has been seen that bologr:phy has certain consisted of a central liquid jet surrounded byadsantages over conventional photography. Spec. vapor.
J ifically, the major advantages are the sery shortimage formation time possible with a pulsed ruby Near the nozzle throat, the sapor generationlaser as the light source, and the fact that hola. precess is confined to the jet-sapor interface and
g graphy produces three-dimensional images, is limited by the transport of thermal energy in thejet. While the location of pressure recosery and
The pulsed holographic images of the phase the pressure recovery process are dependent on the
change process in a two-di,mensional, con erging- vapor generation rate, back pressure, and pres-diserging nozzle showed the details of vap6r cia or absence of rapidly growing sapor bubblef,generation and collapse, as well a the location of the critical mass flux is determined by the behaviorthese events within the nozzle for various tem. of the liquid jet and the sapor generation processperatures and flow rates. The flow in the nozzle in the near throat region.
4
}
(
I 4
23

5, REFERENCES
I. ;. Fincke and D. R. Collins, The Correlation of TweDimensio,:r! arid Nonequihbrium Kffectst . Subcooled ChoAed No::le Flow, NUREG/CR-1907. EGG-2081, March 1981,
2. J. W. Hoyt, J. J. Taylor, C. D. Runge, "The Structure of Jets of Water and Polymer Solution inAir," Journal of Fluid Afechanics, 63,4,1974, p. 635.
I3. J. II. Lienhard and J. M. Stephenson, " Temperature and Scale Effects Upon Cavitation and
Flashing in Frec and Submerged Jets," Journal ofBasic Engineering, Transactions of the ASSIE, 88,June 1966, p. 525.
>
(
>
9
24
- - _ _ . _

.
.. - _ _ _ _ _ _ _
|
i
t.
|
|
t
r.
.
.-
EG&G Idaho, Inc.P.O. Box 1625Idaho Falls, Idaho 83415
-
- - _ - _ - _ _ - - _ _ _ _ _ _ _ _ _ ._ ___ b