a parallel patient treatment time prediction algorithm and its applications in hospital
TRANSCRIPT
SPECIAL SECTION ON THEORETICAL FOUNDATIONS FOR BIG DATA APPLICATIONS:CHALLENGES AND OPPORTUNITIES
Received March 8, 2016, accepted April 12, 2016, date of publication April 25, 2016, date of current version May 9, 2016.
Digital Object Identifier 10.1109/ACCESS.2016.2558199
A Parallel Patient Treatment Time PredictionAlgorithm and Its Applications in HospitalQueuing-Recommendation in aBig Data EnvironmentJIANGUO CHEN1,2, (Student Member, IEEE), KENLI LI1,2, (Senior Member, IEEE),ZHUO TANG1,2, (Member, IEEE), KASHIF BILAL3,4, AND KEQIN LI1,2,5, (Fellow, IEEE)1College of Computer Science and Electronic Engineering, Hunan University, Hunan, Changsha, 410082, China2National Supercomputing Center in Changsha, Hunan, Changsha, 410082, China3COMSATS Institute of Information Technology, Islamabad 45550, Pakistan4Qatar University, Doha 2713, Qatar5Department of Computer Science, State University of New York, New Paltz, NY 12561, USA
Corresponding author: Kenli Li ([email protected])
This work was supported in part by the Key Program of the National Natural Science Foundation of China under Grant 61133005 andGrant 61432005, in part by the National Natural Science Foundation of China under Grant 61370095 and Grant 61472124, in part by theInternational Science and Technology Cooperation Program of China under Grant 2015DFA11240, in part by the National ResearchFoundation of Qatar under Grant 8-519-1-108, and in part by the Natural Science Foundation of Hunan Province of China under Grant2016JJ4002.
ABSTRACT Effective patient queue management to minimize patient wait delays and patient overcrowdingis one of the major challenges faced by hospitals. Unnecessary and annoying waits for long periods resultin substantial human resource and time wastage and increase the frustration endured by patients. For eachpatient in the queue, the total treatment time of all the patients before him is the time that he must wait.It would be convenient and preferable if the patients could receive the most efficient treatment plan and knowthe predicted waiting time through a mobile application that updates in real time. Therefore, we propose aPatient Treatment Time Prediction (PTTP) algorithm to predict the waiting time for each treatment task fora patient. We use realistic patient data from various hospitals to obtain a patient treatment time model foreach task. Based on this large-scale, realistic dataset, the treatment time for each patient in the current queueof each task is predicted. Based on the predicted waiting time, a Hospital Queuing-Recommendation (HQR)system is developed. HQR calculates and predicts an efficient and convenient treatment plan recommendedfor the patient. Because of the large-scale, realistic dataset and the requirement for real-time response,the PTTP algorithm and HQR system mandate efficiency and low-latency response. We use an ApacheSpark-based cloud implementation at the National Supercomputing Center in Changsha to achieve theaforementioned goals. Extensive experimentation and simulation results demonstrate the effectiveness andapplicability of our proposed model to recommend an effective treatment plan for patients to minimize theirwait times in hospitals.
INDEX TERMS Apache spark, big data, cloud computing, hospital queuing recommendation, patienttreatment time prediction.
I. INTRODUCTIONA. MOTIVATIONCurrently, most hospitals are overcrowded and lack effectivepatient queue management. Patient queue management andwait time prediction form a challenging and complicatedjob because each patient might require different phases/operations, such as a checkup, various tests, e.g., a sugarlevel or blood test, X-rays or a CT scan, minor surgeries,
during treatment. We call each of these phases /operationsas treatment tasks or tasks in this paper. Each treatmenttask can have varying time requirements for each patient,which makes time prediction and recommendation highlycomplicated. A patient is usually required to undergoexaminations, inspections or tests (refereed as tasks)according to his condition. In such a case, more than onetask might be required for each patient. Some of the tasks
VOLUME 4, 20162169-3536 2016 IEEE. Translations and content mining are permitted for academic research only.
Personal use is also permitted, but republication/redistribution requires IEEE permission.See http://www.ieee.org/publications_standards/publications/rights/index.html for more information.
1767
www.redpel.com +917620593389
www.redpel.com +917620593389
J. Chen et al.: Parallel PTTP Algorithm and Its Applications in HQR
are independent, whereas others might have to wait for thecompletion of dependent tasks. Most patients must wait forunpredictable but long periods in queues, waiting for theirturn to accomplish each treatment task.
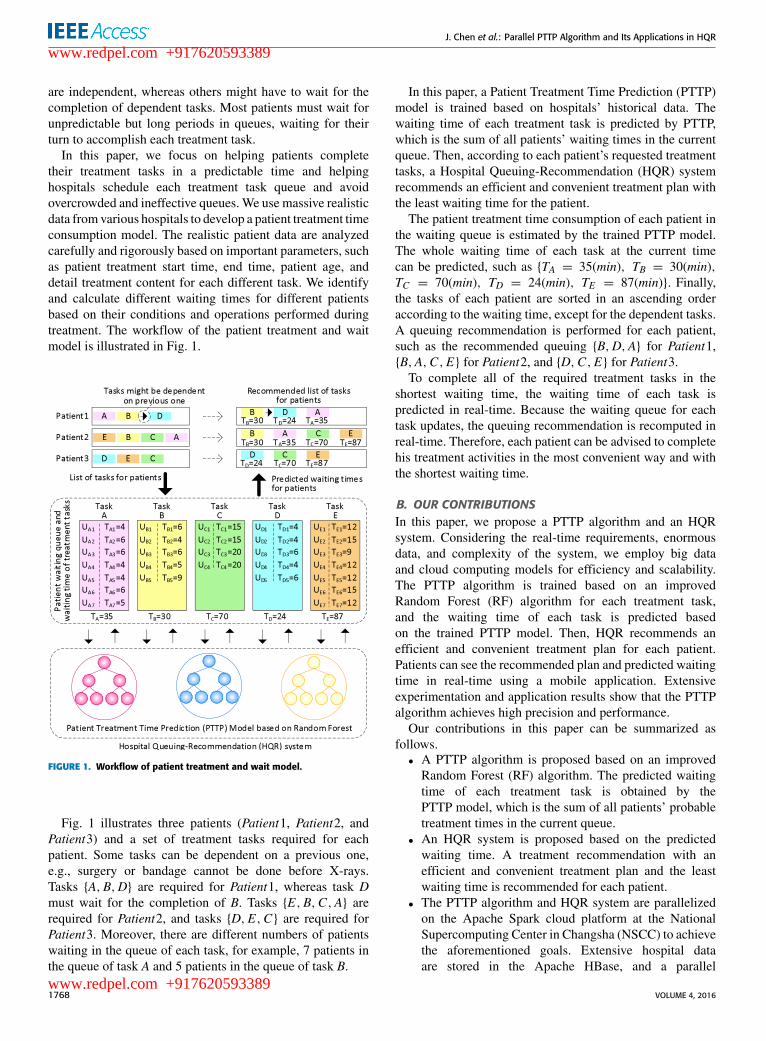
In this paper, we focus on helping patients completetheir treatment tasks in a predictable time and helpinghospitals schedule each treatment task queue and avoidovercrowded and ineffective queues. We use massive realisticdata from various hospitals to develop a patient treatment timeconsumption model. The realistic patient data are analyzedcarefully and rigorously based on important parameters, suchas patient treatment start time, end time, patient age, anddetail treatment content for each different task. We identifyand calculate different waiting times for different patientsbased on their conditions and operations performed duringtreatment. The workflow of the patient treatment and waitmodel is illustrated in Fig. 1.
FIGURE 1. Workflow of patient treatment and wait model.
Fig. 1 illustrates three patients (Patient1, Patient2, andPatient3) and a set of treatment tasks required for eachpatient. Some tasks can be dependent on a previous one,e.g., surgery or bandage cannot be done before X-rays.Tasks {A,B,D} are required for Patient1, whereas task Dmust wait for the completion of B. Tasks {E,B,C,A} arerequired for Patient2, and tasks {D,E,C} are required forPatient3. Moreover, there are different numbers of patientswaiting in the queue of each task, for example, 7 patients inthe queue of task A and 5 patients in the queue of task B.
In this paper, a Patient Treatment Time Prediction (PTTP)model is trained based on hospitals’ historical data. Thewaiting time of each treatment task is predicted by PTTP,which is the sum of all patients’ waiting times in the currentqueue. Then, according to each patient’s requested treatmenttasks, a Hospital Queuing-Recommendation (HQR) systemrecommends an efficient and convenient treatment plan withthe least waiting time for the patient.
The patient treatment time consumption of each patient inthe waiting queue is estimated by the trained PTTP model.The whole waiting time of each task at the current timecan be predicted, such as {TA = 35(min), TB = 30(min),TC = 70(min), TD = 24(min), TE = 87(min)}. Finally,the tasks of each patient are sorted in an ascending orderaccording to the waiting time, except for the dependent tasks.A queuing recommendation is performed for each patient,such as the recommended queuing {B,D,A} for Patient1,{B,A,C,E} for Patient2, and {D,C,E} for Patient3.
To complete all of the required treatment tasks in theshortest waiting time, the waiting time of each task ispredicted in real-time. Because the waiting queue for eachtask updates, the queuing recommendation is recomputed inreal-time. Therefore, each patient can be advised to completehis treatment activities in the most convenient way and withthe shortest waiting time.
B. OUR CONTRIBUTIONSIn this paper, we propose a PTTP algorithm and an HQRsystem. Considering the real-time requirements, enormousdata, and complexity of the system, we employ big dataand cloud computing models for efficiency and scalability.The PTTP algorithm is trained based on an improvedRandom Forest (RF) algorithm for each treatment task,and the waiting time of each task is predicted basedon the trained PTTP model. Then, HQR recommends anefficient and convenient treatment plan for each patient.Patients can see the recommended plan and predicted waitingtime in real-time using a mobile application. Extensiveexperimentation and application results show that the PTTPalgorithm achieves high precision and performance.
Our contributions in this paper can be summarized asfollows.• A PTTP algorithm is proposed based on an improvedRandom Forest (RF) algorithm. The predicted waitingtime of each treatment task is obtained by thePTTP model, which is the sum of all patients’ probabletreatment times in the current queue.
• An HQR system is proposed based on the predictedwaiting time. A treatment recommendation with anefficient and convenient treatment plan and the leastwaiting time is recommended for each patient.
• The PTTP algorithm and HQR system are parallelizedon the Apache Spark cloud platform at the NationalSupercomputing Center in Changsha (NSCC) to achievethe aforementioned goals. Extensive hospital dataare stored in the Apache HBase, and a parallel
1768 VOLUME 4, 2016
www.redpel.com +917620593389
www.redpel.com +917620593389
J. Chen et al.: Parallel PTTP Algorithm and Its Applications in HQR
solution is employed with the MapReduce and ResilientDistributed Datasets (RDD) programming model.
The remainder of the paper is organized as follows.Section 2 reviews related work. Section 3 details a PTTPalgorithm and an HQR system. The parallel implementationof the PTTP algorithm and HQR system on the Apache Sparkcloud environment is detailed in Section 4. Experimentalresults and evaluations are presented in Section 5 withrespect to the recommendation accuracy and performance.Finally, Section 6 concludes the paper with future work anddirections.
II. RELATED WORKTo improve the accuracy of the data analysis with continuousfeatures, various optimization methods of classificationand regression algorithms are proposed. A self-adaptiveinduction algorithm for the incremental construction ofbinary regression trees was presented in [1]. Tyree et al. [2]introduced a parallel boosted regression tree algorithm forweb search ranking. In [3], a multi-branch decision treealgorithm was proposed based on a correlation-splittingcriterion. Other improved classification and regression treemethods were proposed in [4]–[6].
The random forest algorithm [7] is an ensemble classifieralgorithm based on a decision tree, which is a suitabledata-mining algorithm for big data. The random forestalgorithm is widely used in many fields such as fast actiondetection via discriminative random forest voting and Top-Ksubvolume search [8], robust and accurate shape modelmatching using random forest regression voting [9], and abig data analytic framework for peer-to-peer botnet detectionusing random forests [10]. The experimental results in thesepapers demonstrate the effectiveness and applicability of therandom forest algorithm. Bernard [11] proposed a dynamictraining method to improve the accuracy of the randomforest algorithm. In [12], a random forest method based onweighted trees was proposed to classify high-dimensionalnoisy data. However, the original random forest algorithmuses a traditional direct voting method in the voting process.In such a case, the random forest containing noisy decisiontrees would likely lead to an incorrect predicted value for thetesting dataset [13].
Various recommendation algorithms have been presentedand applied in related fields. Meng et al. [14] proposeda keyword-aware service recommendation method onMapReduce for big data applications. A travel recommen-dation algorithm that mines people’s attributes andtravel-group types was proposed in [15]. Yang et. al. [16]introduced a Bayesian-inference-based recommendationsystem for online social networks, in which a user propagatesa content rating query along the social network to hisdirect and indirect friends. Adomavicius and Kwon [17]introduced new recommendation techniques formulti-criteriarating systems. Adomavicius and Tuzhilin [18] introducedan overview of the current generation of recommendationmethods, such as content-based, collaborative, and hybrid
recommendation approaches. However, there is no effectiveprediction algorithm for patient treatment time consumptionin the existing studies.
The speed of data mining and analysis for big data isa very important factor [19]. Cloud computing, distributedcomputing, and supercomputers offer high-speed computingpower. Both the Apache Hadoop [20] and Spark [21]are famous cloud platforms that are widely used inparallel computing and data analysis. Numerous paralleldata-mining algorithms have been implemented based onthe MapReduce [22] and RDD [23] models. In [24]–[27],various data-mining algorithms were proposed based onthe MapReduce programming model. Apache Spark is anefficient cloud platform that is suitable for data mining andmachine learning. In the Spark, data are cached in memory,and iterations for the same data come directly from memory.Zaharia et al. [28] presented a fast and interactive analyticsover Hadoop data with Spark.
To predict the waiting time for each treatment task,we use the random forest algorithm to train the patienttreatment time consumption based on both patient and timecharacteristics and then build the PTTP model. Becausepatient treatment time consumption is a continuous variable,a Classification And Regression Tree (CART) model isused as a meta-classifier in the RF algorithm. Becauseof the shortcomings of the original RF algorithm andthe characteristics of the patient data, in this paper, theRF algorithm is improved in 4 aspects to obtain an effectiveresult from large-scale, high dimensional, continuous, andnoisy patient data. Compared with the original RF algorithm,our PTTP algorithm based on an improved RF algorithm hassignificant advantages in terms of accuracy and performance.Moreover, there is no existing research on hospital queuingmanagement and recommendations. Therefore, we proposean HQR system based on the PTTP model. To the best ofour knowledge, this paper is the first attempt to solve theproblem of patient waiting time for hospital queuing servicecomputing. A treatment queuing recommendation with anefficient and convenient treatment plan and the least waitingtime is recommended for each patient.
III. PATIENT TREATMENT TIME PREDICTION ALGORITHMTo build the PTTP model based on both patient and timecharacteristics, a PTTP algorithm is proposed. The PTTPmodel is based on an improved RF algorithm and is trainedfrom themassive, complex, and noisy hospital treatment data.
A. PROBLEM DEFINITION AND DATA PREPROCESSING1) PROBLEM DEFINITIONPrediction based on analysis and processing of massive noisypatient data from various hospitals is a challenging task.Some of the major challenges are the following:
(1) Most of the data in hospitals are massive, unstructured,and high dimensional. Hospitals produce a huge amountof business data every day that contain a great deal
VOLUME 4, 2016 1769
www.redpel.com +917620593389
www.redpel.com +917620593389
J. Chen et al.: Parallel PTTP Algorithm and Its Applications in HQR
of information, such as patient information, medicalactivity information, time, treatment department, anddetailed information of the treatment task. Moreover, becauseof themanual operation and various unexpected events duringtreatments, a large amount of incomplete or inconsistentdata appears, such as a lack of patient gender and agedata, time inconsistencies caused by the time zone settingsof medical machines from different manufacturers, andtreatment records with only a start time but no end time.
(2) The time consumption of the treatment tasks in eachdepartment might not lie in the same range, which can varyaccording to the content of tasks and various circumstances,different periods, and different conditions of patients. Forexample, in the case of a CT scan task, the time required foran old man is generally longer than that required for a youngman.
(3) There are strict time requirements for hospital queuingmanagement and recommendation. The speed of executingthe PTTP model and HQR scheme is also critical.
2) DATA PREPROCESSINGIn the preprocessing phase, hospital treatment data fromdifferent treatment tasks are gathered. Substantial numbersof patients visit each hospital every day. Let S be a set ofpatients in a hospital, and a patient who has been registeredand his information is represented by si. Assume that thereare N patients in S:
S = {s1, s2, . . . , sN },
where each patient si can have specific unchangedparameters, e.g., name, ID, gender, age, and address. Someof these parameters are useful to our analysis, whereas othersare not.
Each patient can visit multiple treatment tasks accordingto his health condition. Let X |si be a set of treatment tasks forpatient si during a specific visit:
X |si = {x1, x2, . . . , xK },
where each treatment task record xi can consist of multipleinformation Y , e.g., task name, task location, department,start time, end time, doctor, and attending staff:
Y |xi = {y1, y2, . . . , yM },
where yj is a feature variable of the record of treatment task xi.Here, for a single visit, we have a single record for patientname, age, gender, and multiple records for treatment tasks,as shown in Table 1.
The workflow of the preprocessing task can be depicted bythe following steps.
a: GATHER DATA FROM DIFFERENT TREATMENT TASKSDepending on statistics, the number of patients in amedium-sized hospital lies between 8,000 and 12,000 per day,and the number of remedial treatment data records is between120,000 and 200,000. These data are gathered from different
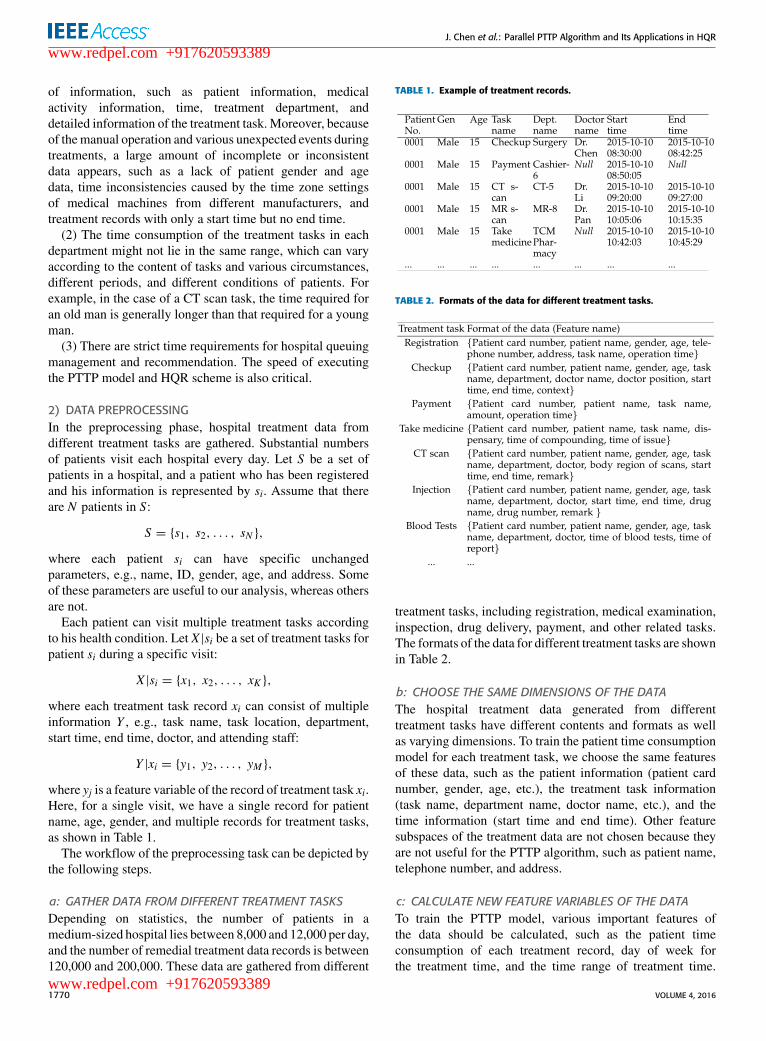
TABLE 1. Example of treatment records.
TABLE 2. Formats of the data for different treatment tasks.
treatment tasks, including registration, medical examination,inspection, drug delivery, payment, and other related tasks.The formats of the data for different treatment tasks are shownin Table 2.
b: CHOOSE THE SAME DIMENSIONS OF THE DATAThe hospital treatment data generated from differenttreatment tasks have different contents and formats as wellas varying dimensions. To train the patient time consumptionmodel for each treatment task, we choose the same featuresof these data, such as the patient information (patient cardnumber, gender, age, etc.), the treatment task information(task name, department name, doctor name, etc.), and thetime information (start time and end time). Other featuresubspaces of the treatment data are not chosen because theyare not useful for the PTTP algorithm, such as patient name,telephone number, and address.
c: CALCULATE NEW FEATURE VARIABLES OF THE DATATo train the PTTP model, various important features ofthe data should be calculated, such as the patient timeconsumption of each treatment record, day of week forthe treatment time, and the time range of treatment time.
1770 VOLUME 4, 2016
www.redpel.com +917620593389
www.redpel.com +917620593389
J. Chen et al.: Parallel PTTP Algorithm and Its Applications in HQR
For example, in the treatment record of the CT scan taskin Table 1, the start time is ‘‘2015-10-10 09:20:00’’ and theend time is ‘‘2015-10-10 09:27:00’’, the time consumptionfor this patient in the treatment is ‘‘420 (s)’’, the day of theweek is ‘‘Saturday’’, and the time range is ‘‘09’’.
d: REMOVE INCOMPLETE AND INCONSISTENT DATAAfter calculating new feature variables of treatment data,the error and noisy data need to be removed. The treatmentrecords with missing values for critical features are removedas incomplete data, such as patient gender, patient age, andtask name. The treatment records with negative values of timeconsumption are removed as inconsistent data, for instance,if the end time of the treatment operation is before the starttime, which can occur in cases when a start time is recordedby a human and an end time is shown by a machine. Thetypes of data shown above are considered as noisy data in thispaper. The features of the treatment data used in the processof employing the PTTP algorithm are presented in Table 3.
TABLE 3. Features of treatment data for the PTTP algorithm.
3) CONSTRUCTING TRAINING SUBSETSFOR THE PTTP MODELIn the process of employing the PTTP model, the treatmenttime consumption of patients with different conditions anddifferent environments in each treatment task are addressed.Due to the diverse nature of different medical tasks, the rangeof patient treatment time consumption cannot be measured byan absolute standard.
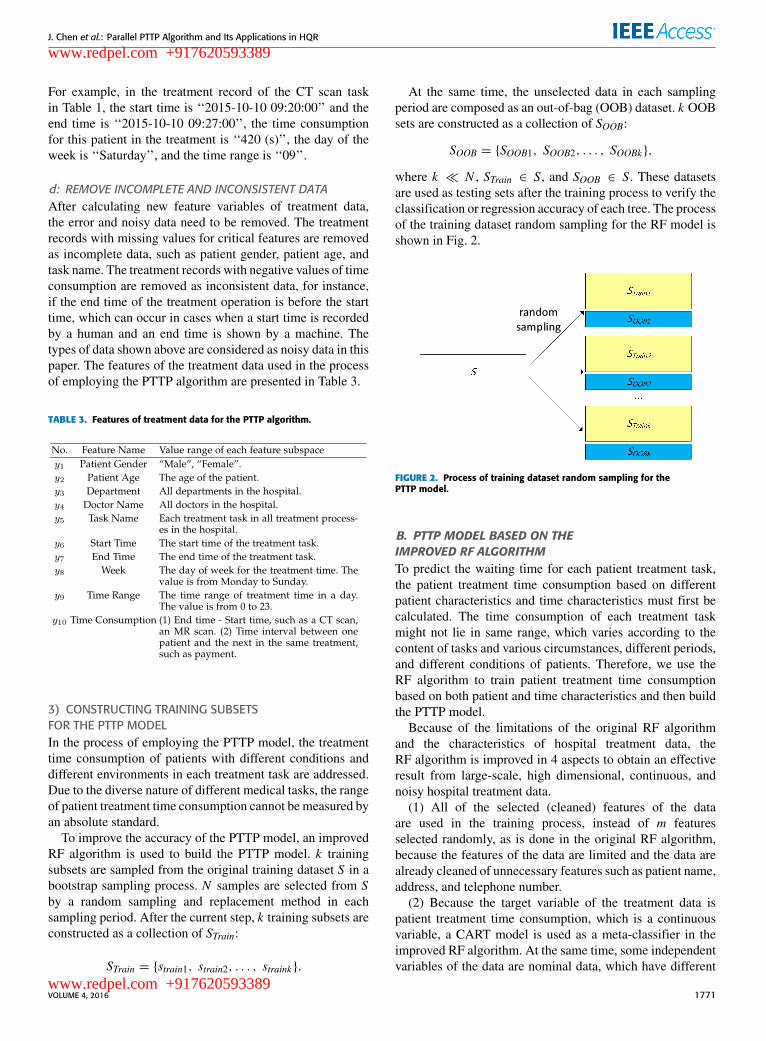
To improve the accuracy of the PTTP model, an improvedRF algorithm is used to build the PTTP model. k trainingsubsets are sampled from the original training dataset S in abootstrap sampling process. N samples are selected from Sby a random sampling and replacement method in eachsampling period. After the current step, k training subsets areconstructed as a collection of STrain:
STrain = {strain1, strain2, . . . , straink}.
At the same time, the unselected data in each samplingperiod are composed as an out-of-bag (OOB) dataset. k OOBsets are constructed as a collection of SOOB:
SOOB = {SOOB1, SOOB2, . . . , SOOBk},
where k � N , STrain ∈ S, and SOOB ∈ S. These datasetsare used as testing sets after the training process to verify theclassification or regression accuracy of each tree. The processof the training dataset random sampling for the RF model isshown in Fig. 2.
FIGURE 2. Process of training dataset random sampling for thePTTP model.
B. PTTP MODEL BASED ON THEIMPROVED RF ALGORITHMTo predict the waiting time for each patient treatment task,the patient treatment time consumption based on differentpatient characteristics and time characteristics must first becalculated. The time consumption of each treatment taskmight not lie in same range, which varies according to thecontent of tasks and various circumstances, different periods,and different conditions of patients. Therefore, we use theRF algorithm to train patient treatment time consumptionbased on both patient and time characteristics and then buildthe PTTP model.
Because of the limitations of the original RF algorithmand the characteristics of hospital treatment data, theRF algorithm is improved in 4 aspects to obtain an effectiveresult from large-scale, high dimensional, continuous, andnoisy hospital treatment data.
(1) All of the selected (cleaned) features of the dataare used in the training process, instead of m featuresselected randomly, as is done in the original RF algorithm,because the features of the data are limited and the data arealready cleaned of unnecessary features such as patient name,address, and telephone number.
(2) Because the target variable of the treatment data ispatient treatment time consumption, which is a continuousvariable, a CART model is used as a meta-classifier in theimproved RF algorithm. At the same time, some independentvariables of the data are nominal data, which have different
VOLUME 4, 2016 1771
www.redpel.com +917620593389
www.redpel.com +917620593389
J. Chen et al.: Parallel PTTP Algorithm and Its Applications in HQR
values such as time range (0 - 23) and day of week(Monday - Sunday). In such a case, the two-fork tree model ofthe traditional CART cannot fully reflect the analysis results.Therefore, to construct the regression tree model felicitously,a multi-branch model is proposed for the constructionprocess instead of the two-fork model of the traditionalCART algorithm.
(3) Although we have removed part of the error in thepreprocessing, other types of noisy data might also exist.In some treatment tasks, the time consumption is the timeinterval between one patient and the next in the sametreatment. For example, in a payment task, assume that theoperation time point of the last patient in the morning is‘‘12:00:00’’ and the operation time point of the first patientin the afternoon is ‘‘14:00:00’’. The time consumption ofthe former is ‘‘7200 (s)’’ and is considered as incorrect databecause it is larger than the normal value of ‘‘100 (s)’’.However, the value ‘‘7200 (s)’’ of time consumption has notalways been incorrect data, such as in a blood examinationtask. Therefore, we cannot simply designate one value oftime consumption as noisy data; each must be classifiedaccording to treatment data features. Then, we must identifyand remove the noisy data. In calculating the averagevalue of the data in each leaf node of the regressiontree, noisy data are removed to reduce their influence onaccuracy.
(4) The original RF algorithm uses a traditional directvoting method in the prediction process. In such a case,a RF containing noisy decision trees would likely lead to anincorrect predicted value for the testing dataset. Therefore,in this paper, a weighted voting method is employed in theprediction process of the RF model. Each tree classifiercorresponds to a specified reasonable weight for voting thetesting data. A tree classifier that has high accuracy inthe training process will have a high voting weight in theprediction process. Hence, the classifier improves the overallclassification accuracy of the RF algorithm, and reduces thegeneralization error.
Compared with the original RF algorithm, ourPTTP algorithm based on the improved RF algorithm,has significant advantages in terms of accuracy andperformance.
1) TRAINING CART REGRESSION TREES OF THE RF MODELBecause the patient treatment time consumption is the targetfeature variable of treatment data S, which is a continuousvalue, the type of the single decision tree in the RF modelis a regression tree. Thus, a CART regression tree model iscreated for each training subset straini.
The first optimization aspect of the RF algorithm isin the growing process of each CART tree. All of theM features of each training data straini are used in thetraining process instead of the m features selected randomlyas is done in the original RF algorithm. The main processof building the regression tree of CART is described asfollows.
a: CALCULATE THE BEST SPLITTING FEATURE VARIABLESAND THE BEST SPLIT POINTIn each tree node’s splitting process, each feature variablesubspace yj and each potential split point value vp of yj arechosen to calculate the loss function of (yj, vp), which isdefined as follows:
(yj, vp) = argmin[∑
x∈RL (yj,vp)
(yi − cL)2
+
∑x∈RR(yj,vp)
(yi − cR)2], (1)
where a summary of the elements in Eq. (1) is presentedin Table 4.
TABLE 4. Summary of the elements in eq. (1).
In such a case, the variable yj with the smallest value ofthe loss function is selected as the best split feature, and thevalue vp is used as the split point for yj at the current splittingtree node.
b: SPLIT THE DATA INTO TWO FORKSSplit the training dataset into two forks by vp in the featuresubspace yj. RL(yj, vp) denotes the first (left) data subset andRR(yj, vp) denotes the second (right) data subset. These subsetsare defined as follows:
RL(yj, vp) = {x|(yj ≤ vp)},
RR(yj, vp) = {x|(yj > vp)}. (2)
c: CONSTRUCT MULTI-BRANCH FOR THE CART MODELSome independent variables of data are nominal data, whichhave different values, such as the time range (0 - 23) andday of week (Monday - Sunday). Therefore, to construct theregression tree model felicitously, a multi-branch regressiontreemodel instead of two-fork treemodel is used constructingthe CART, which is the second optimization aspect of theRF algorithm. After the tree node split into two forks byvariable yj and value vp in step (2), the same variable yjcontinues to be selected to calculate the best split point vpLfor the data in the left branch and vpR for the data in the rightbranch. Taking the left branch as an example, the best splitpoint calculated for the current feature subspace is defined asfollows:
8(vpL |yj) = maxi
8(vi|y). (3)
1772 VOLUME 4, 2016
www.redpel.com +917620593389
www.redpel.com +917620593389
J. Chen et al.: Parallel PTTP Algorithm and Its Applications in HQR
The 8(vi|y) is defined as follows:
8(vi|y) = 2PLPRm∑j=1
|p(cj|yL)− p(cj|yR)|, (4)
wherePL andPR are the ratios of the amount of data in the leftbranch and in the right branch to the entire volume of trainingdata, respectively. p(cj|yL) is the ratio of the volume of datathat belong to class cj in the left branch to the volume of datain the left branch.
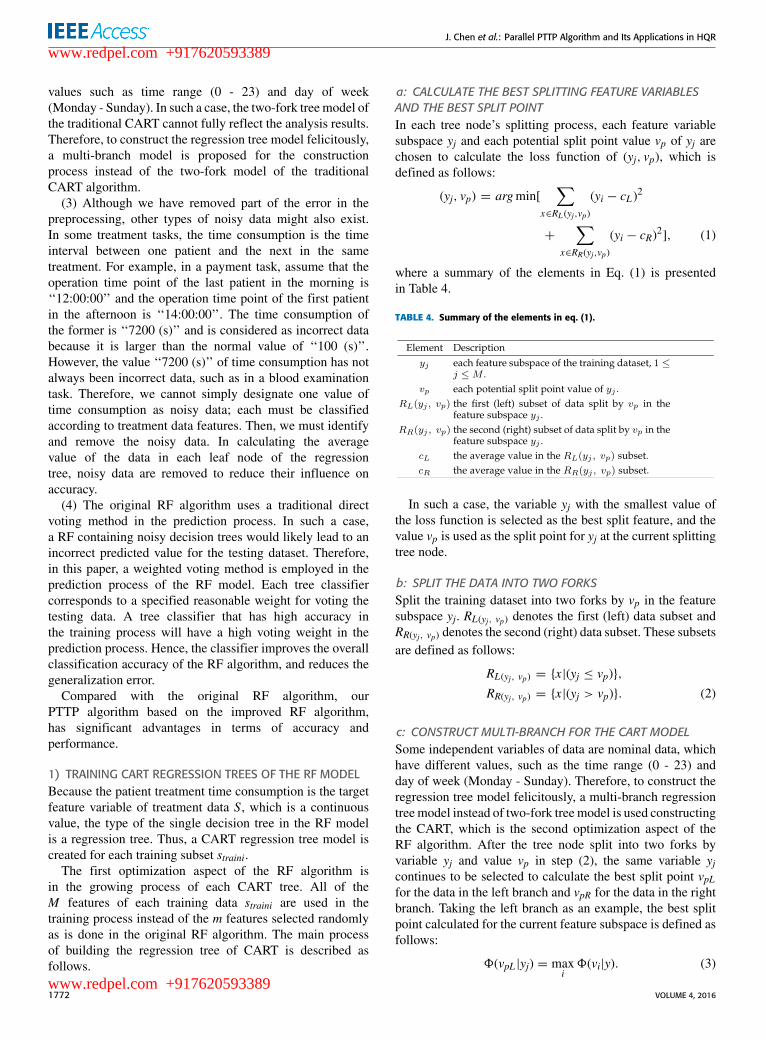
If the split value of 8(vpL |yj) is greater than the fathernode, namely 8(vpL |yj) ≥ 8(vp|yj), then the left branchcontinues to split by the variable yj and value vpL . Otherwise,the remaining feature variables continue to be computed.The right branch is calculated similarly. Then, each nodeand its two subnodes are calculated successively. If the samevariable split exists in both the parent node and the childnode, a node merger operation should be done. Consequently,a multi-branch node of the tree is constructed. An example ofmulti-branch splitting for the CARTmodel is shown in Fig. 3.
FIGURE 3. Example of multi-branch splitting for the CART model.
Repeat steps (1 - 3) until the data in each branch areclassified in one class as a leaf node.
d: CALCULATE MEAN VALUE OF LEAF NODES AFTERREMOVAL OF NOISY DATAAlthough we have removed part of the error data in thepreprocessing, other types of noisy data mentioned abovemight exist. Therefore, the third optimization aspect of theRF algorithm is to reduce the influence that the noisy datahave on the algorithm accuracy. A box-plot-based noiseremoval method is performed in the value calculation of eachCART leaf node.
The data in the current leaf node are sorted in ascendingorder. Then, the values of three data points Q1, Q2, Q3 of thebox-plot model are calculated, where Q2 is the median datapoint andQ1 andQ3 are the lower and upper four digits of thedata, respectively. The inner limit of the noisy data is definedas follows:
IL = Q1− 1.5(IQR) = Q1− 1.5(Q3− Q1). (5)
The outer limit of the noisy data is defined as follows:
OL = Q3+ 1.5(IQR) = Q3+ 1.5(Q3− Q1). (6)
The data outside the range of {IL,OL} are removed asnoisy data. After removing the noisy data, the average value cj
of the data yj is calculated in each leaf node of the regressiontree. The calculation formula is defined as follows:
cj =1k
∑yj, (IL ≤ yj ≤ OL), (7)
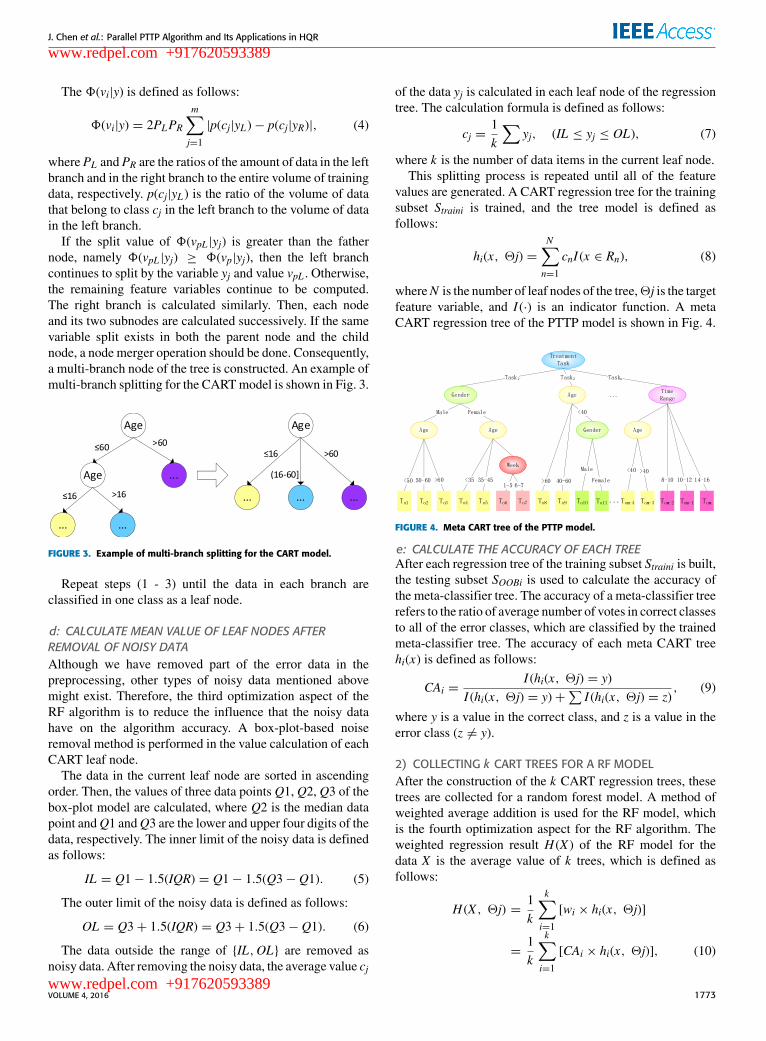
where k is the number of data items in the current leaf node.This splitting process is repeated until all of the feature
values are generated. A CART regression tree for the trainingsubset Straini is trained, and the tree model is defined asfollows:
hi(x, 2j) =N∑n=1
cnI (x ∈ Rn), (8)
whereN is the number of leaf nodes of the tree,2j is the targetfeature variable, and I (·) is an indicator function. A metaCART regression tree of the PTTP model is shown in Fig. 4.
FIGURE 4. Meta CART tree of the PTTP model.
e: CALCULATE THE ACCURACY OF EACH TREEAfter each regression tree of the training subset Straini is built,the testing subset SOOBi is used to calculate the accuracy ofthe meta-classifier tree. The accuracy of a meta-classifier treerefers to the ratio of average number of votes in correct classesto all of the error classes, which are classified by the trainedmeta-classifier tree. The accuracy of each meta CART treehi(x) is defined as follows:
CAi =I (hi(x, 2j) = y)
I (hi(x, 2j) = y)+∑I (hi(x, 2j) = z)
, (9)
where y is a value in the correct class, and z is a value in theerror class (z 6= y).
2) COLLECTING k CART TREES FOR A RF MODELAfter the construction of the k CART regression trees, thesetrees are collected for a random forest model. A method ofweighted average addition is used for the RF model, whichis the fourth optimization aspect for the RF algorithm. Theweighted regression result H (X ) of the RF model for thedata X is the average value of k trees, which is defined asfollows:
H (X , 2j) =1k
k∑i=1
[wi × hi(x, 2j)]
=1k
k∑i=1
[CAi × hi(x, 2j)], (10)
VOLUME 4, 2016 1773
www.redpel.com +917620593389
www.redpel.com +917620593389
J. Chen et al.: Parallel PTTP Algorithm and Its Applications in HQR
where wi is the weight of tree hi and hi(x, 2j) is ameta-classifier for a pruning regression tree constructed bythe CART algorithm. The PTTP model based on the randomforest algorithm is shown in Fig. 5.
FIGURE 5. PTTP model based on the RF algorithm.
The detailed steps of the PTTP model based on the randomforest algorithm are presented in Algorithm 1.
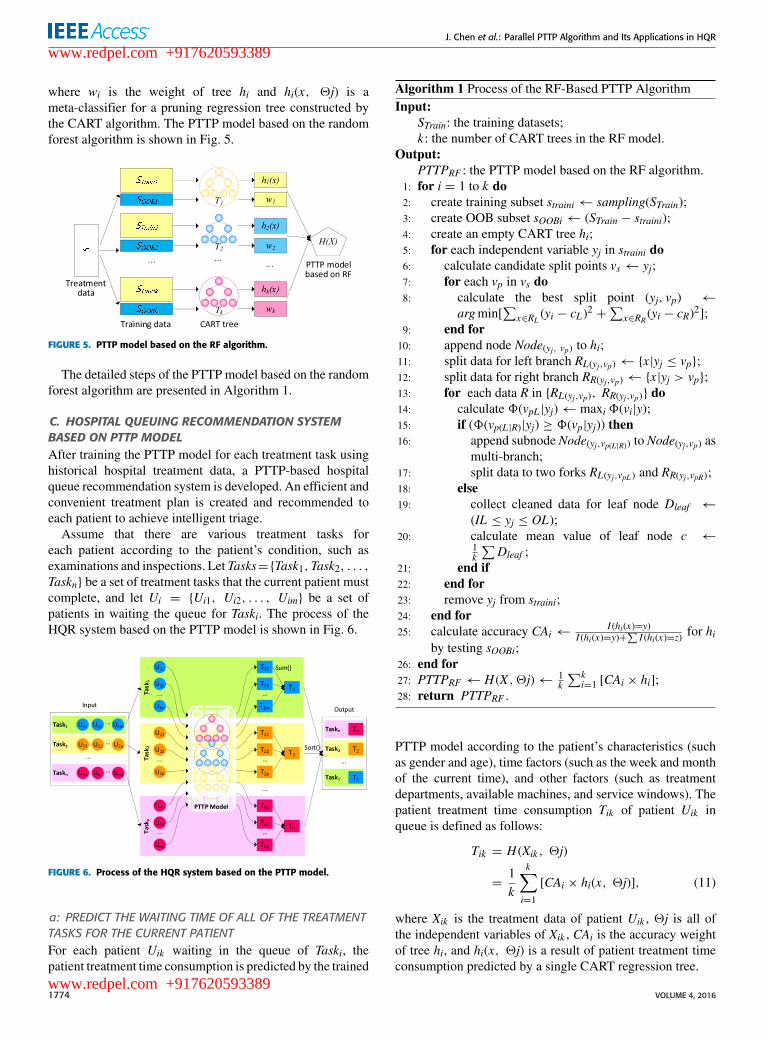
C. HOSPITAL QUEUING RECOMMENDATION SYSTEMBASED ON PTTP MODELAfter training the PTTP model for each treatment task usinghistorical hospital treatment data, a PTTP-based hospitalqueue recommendation system is developed. An efficient andconvenient treatment plan is created and recommended toeach patient to achieve intelligent triage.
Assume that there are various treatment tasks foreach patient according to the patient’s condition, such asexaminations and inspections. Let Tasks={Task1,Task2, . . . ,Taskn} be a set of treatment tasks that the current patient mustcomplete, and let Ui = {Ui1, Ui2, . . . , Uim} be a set ofpatients in waiting the queue for Taski. The process of theHQR system based on the PTTP model is shown in Fig. 6.
FIGURE 6. Process of the HQR system based on the PTTP model.
a: PREDICT THE WAITING TIME OF ALL OF THE TREATMENTTASKS FOR THE CURRENT PATIENTFor each patient Uik waiting in the queue of Taski, thepatient treatment time consumption is predicted by the trained
Algorithm 1 Process of the RF-Based PTTP AlgorithmInput:
STrain: the training datasets;k: the number of CART trees in the RF model.
Output:PTTPRF : the PTTP model based on the RF algorithm.
1: for i = 1 to k do2: create training subset straini← sampling(STrain);3: create OOB subset sOOBi← (STrain − straini);4: create an empty CART tree hi;5: for each independent variable yj in straini do6: calculate candidate split points vs← yj;7: for each vp in vs do8: calculate the best split point (yj, vp) ←
argmin[∑
x∈RL (yi − cL)2+
∑x∈RR (yi − cR)
2];9: end for10: append node Node(yj, vp) to hi;11: split data for left branch RL(yj,vp)← {x|yj ≤ vp};12: split data for right branch RR(yj,vp)← {x|yj > vp};13: for each data R in {RL(yj,vp), RR(yj,vp)} do14: calculate 8(vpL |yj)← maxi 8(vi|y);15: if (8(vp(L|R)|yj) ≥ 8(vp|yj)) then16: append subnode Node(yj,vp(L|R)) to Node(yj,vp) as
multi-branch;17: split data to two forks RL(yj,vpL ) and RR(yj,vpR);18: else19: collect cleaned data for leaf node Dleaf ←
(IL ≤ yj ≤ OL);20: calculate mean value of leaf node c ←
1k
∑Dleaf ;
21: end if22: end for23: remove yj from straini;24: end for25: calculate accuracy CAi ←
I (hi(x)=y)I (hi(x)=y)+
∑I (hi(x)=z)
for hiby testing sOOBi;
26: end for27: PTTPRF ← H (X , 2j)← 1
k
∑ki=1 [CAi × hi];
28: return PTTPRF .
PTTP model according to the patient’s characteristics (suchas gender and age), time factors (such as the week and monthof the current time), and other factors (such as treatmentdepartments, available machines, and service windows). Thepatient treatment time consumption Tik of patient Uik inqueue is defined as follows:
Tik = H (Xik , 2j)
=1k
k∑i=1
[CAi × hi(x, 2j)], (11)
where Xik is the treatment data of patient Uik , 2j is all ofthe independent variables of Xik , CAi is the accuracy weightof tree hi, and hi(x, 2j) is a result of patient treatment timeconsumption predicted by a single CART regression tree.
1774 VOLUME 4, 2016
www.redpel.com +917620593389
www.redpel.com +917620593389
J. Chen et al.: Parallel PTTP Algorithm and Its Applications in HQR
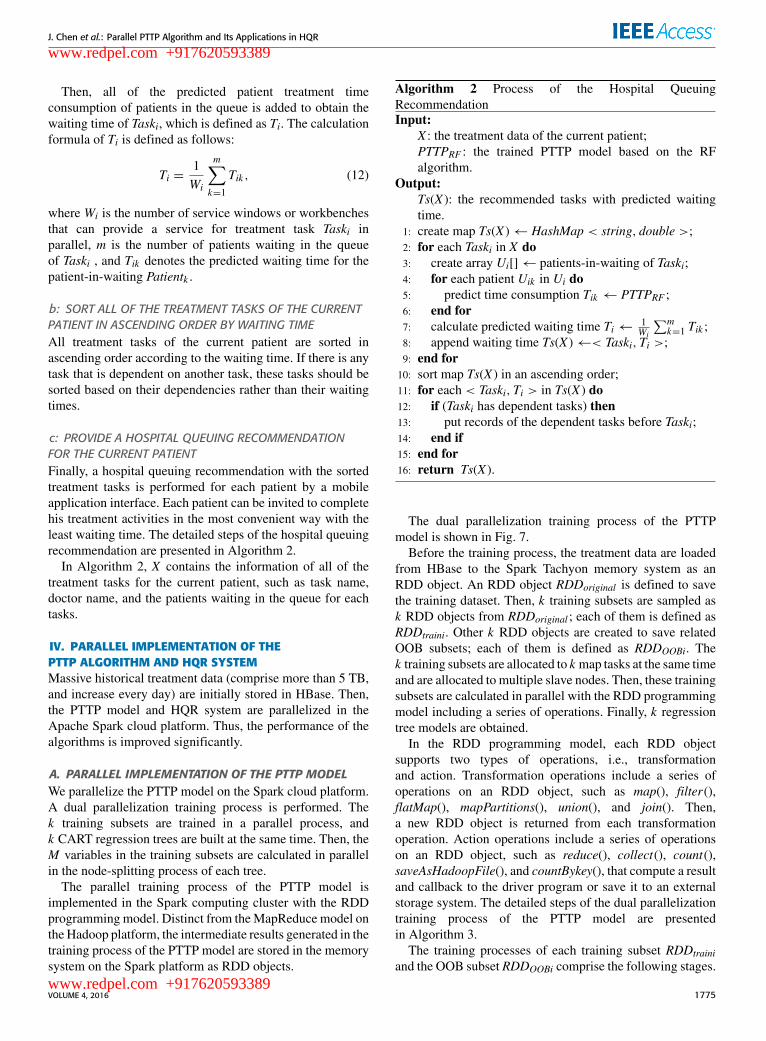
Then, all of the predicted patient treatment timeconsumption of patients in the queue is added to obtain thewaiting time of Taski, which is defined as Ti. The calculationformula of Ti is defined as follows:
Ti =1Wi
m∑k=1
Tik , (12)
where Wi is the number of service windows or workbenchesthat can provide a service for treatment task Taski inparallel, m is the number of patients waiting in the queueof Taski , and Tik denotes the predicted waiting time for thepatient-in-waiting Patientk .
b: SORT ALL OF THE TREATMENT TASKS OF THE CURRENTPATIENT IN ASCENDING ORDER BY WAITING TIMEAll treatment tasks of the current patient are sorted inascending order according to the waiting time. If there is anytask that is dependent on another task, these tasks should besorted based on their dependencies rather than their waitingtimes.
c: PROVIDE A HOSPITAL QUEUING RECOMMENDATIONFOR THE CURRENT PATIENTFinally, a hospital queuing recommendation with the sortedtreatment tasks is performed for each patient by a mobileapplication interface. Each patient can be invited to completehis treatment activities in the most convenient way with theleast waiting time. The detailed steps of the hospital queuingrecommendation are presented in Algorithm 2.
In Algorithm 2, X contains the information of all of thetreatment tasks for the current patient, such as task name,doctor name, and the patients waiting in the queue for eachtasks.
IV. PARALLEL IMPLEMENTATION OF THEPTTP ALGORITHM AND HQR SYSTEMMassive historical treatment data (comprise more than 5 TB,and increase every day) are initially stored in HBase. Then,the PTTP model and HQR system are parallelized in theApache Spark cloud platform. Thus, the performance of thealgorithms is improved significantly.
A. PARALLEL IMPLEMENTATION OF THE PTTP MODELWe parallelize the PTTP model on the Spark cloud platform.A dual parallelization training process is performed. Thek training subsets are trained in a parallel process, andk CART regression trees are built at the same time. Then, theM variables in the training subsets are calculated in parallelin the node-splitting process of each tree.
The parallel training process of the PTTP model isimplemented in the Spark computing cluster with the RDDprogramming model. Distinct from theMapReduce model onthe Hadoop platform, the intermediate results generated in thetraining process of the PTTP model are stored in the memorysystem on the Spark platform as RDD objects.
Algorithm 2 Process of the Hospital QueuingRecommendationInput:
X : the treatment data of the current patient;PTTPRF : the trained PTTP model based on the RFalgorithm.
Output:Ts(X ): the recommended tasks with predicted waitingtime.
1: create map Ts(X )← HashMap < string, double >;2: for each Taski in X do3: create array Ui[]← patients-in-waiting of Taski;4: for each patient Uik in Ui do5: predict time consumption Tik ← PTTPRF ;6: end for7: calculate predicted waiting time Ti← 1
Wi
∑mk=1 Tik ;
8: append waiting time Ts(X )←< Taski,Ti >;9: end for10: sort map Ts(X ) in an ascending order;11: for each < Taski,Ti > in Ts(X ) do12: if (Taski has dependent tasks) then13: put records of the dependent tasks before Taski;14: end if15: end for16: return Ts(X ).
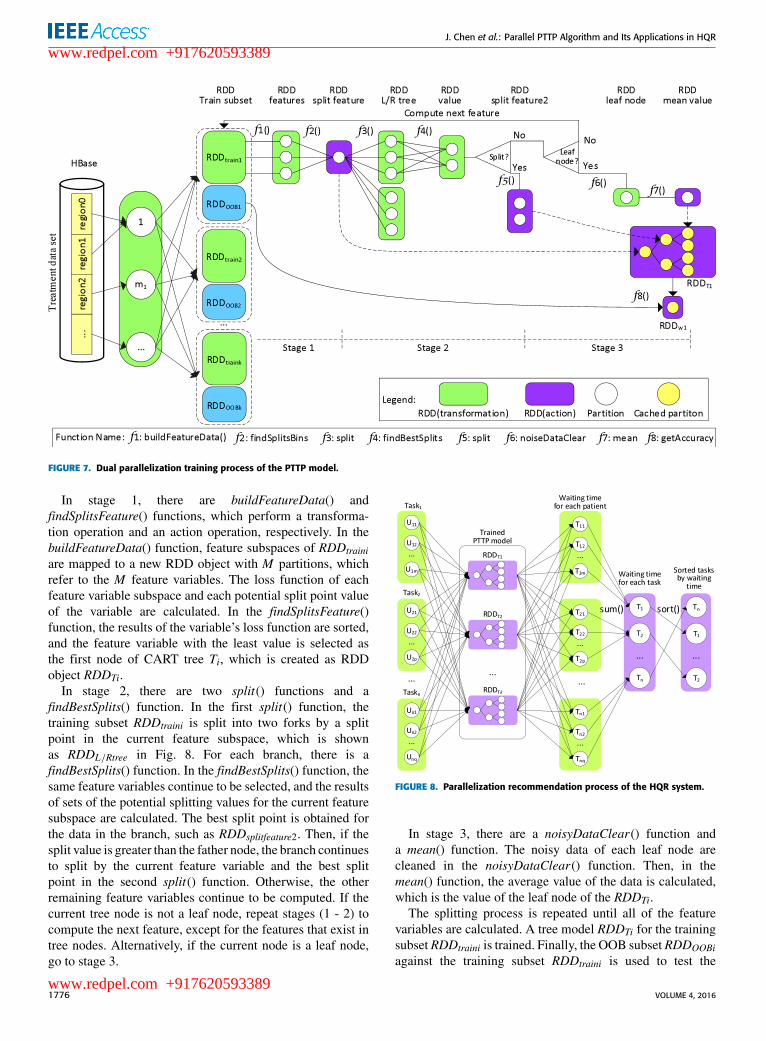
The dual parallelization training process of the PTTPmodel is shown in Fig. 7.
Before the training process, the treatment data are loadedfrom HBase to the Spark Tachyon memory system as anRDD object. An RDD object RDDoriginal is defined to savethe training dataset. Then, k training subsets are sampled ask RDD objects from RDDoriginal ; each of them is defined asRDDtraini. Other k RDD objects are created to save relatedOOB subsets; each of them is defined as RDDOOBi. Thek training subsets are allocated to k map tasks at the same timeand are allocated to multiple slave nodes. Then, these trainingsubsets are calculated in parallel with the RDD programmingmodel including a series of operations. Finally, k regressiontree models are obtained.
In the RDD programming model, each RDD objectsupports two types of operations, i.e., transformationand action. Transformation operations include a series ofoperations on an RDD object, such as map(), filter(),flatMap(), mapPartitions(), union(), and join(). Then,a new RDD object is returned from each transformationoperation. Action operations include a series of operationson an RDD object, such as reduce(), collect(), count(),saveAsHadoopFile(), and countBykey(), that compute a resultand callback to the driver program or save it to an externalstorage system. The detailed steps of the dual parallelizationtraining process of the PTTP model are presentedin Algorithm 3.
The training processes of each training subset RDDtrainiand the OOB subset RDDOOBi comprise the following stages.
VOLUME 4, 2016 1775
www.redpel.com +917620593389
www.redpel.com +917620593389
J. Chen et al.: Parallel PTTP Algorithm and Its Applications in HQR
FIGURE 7. Dual parallelization training process of the PTTP model.
In stage 1, there are buildFeatureData() andfindSplitsFeature() functions, which perform a transforma-tion operation and an action operation, respectively. In thebuildFeatureData() function, feature subspaces of RDDtrainiare mapped to a new RDD object with M partitions, whichrefer to the M feature variables. The loss function of eachfeature variable subspace and each potential split point valueof the variable are calculated. In the findSplitsFeature()function, the results of the variable’s loss function are sorted,and the feature variable with the least value is selected asthe first node of CART tree Ti, which is created as RDDobject RDDTi.
In stage 2, there are two split() functions and afindBestSplits() function. In the first split() function, thetraining subset RDDtraini is split into two forks by a splitpoint in the current feature subspace, which is shownas RDDL/Rtree in Fig. 8. For each branch, there is afindBestSplits() function. In the findBestSplits() function, thesame feature variables continue to be selected, and the resultsof sets of the potential splitting values for the current featuresubspace are calculated. The best split point is obtained forthe data in the branch, such as RDDsplitfeature2. Then, if thesplit value is greater than the father node, the branch continuesto split by the current feature variable and the best splitpoint in the second split() function. Otherwise, the otherremaining feature variables continue to be computed. If thecurrent tree node is not a leaf node, repeat stages (1 - 2) tocompute the next feature, except for the features that exist intree nodes. Alternatively, if the current node is a leaf node,go to stage 3.
FIGURE 8. Parallelization recommendation process of the HQR system.
In stage 3, there are a noisyDataClear() function anda mean() function. The noisy data of each leaf node arecleaned in the noisyDataClear() function. Then, in themean() function, the average value of the data is calculated,which is the value of the leaf node of the RDDTi.
The splitting process is repeated until all of the featurevariables are calculated. A tree model RDDTi for the trainingsubset RDDtraini is trained. Finally, the OOB subset RDDOOBiagainst the training subset RDDtraini is used to test the
1776 VOLUME 4, 2016
www.redpel.com +917620593389
www.redpel.com +917620593389
J. Chen et al.: Parallel PTTP Algorithm and Its Applications in HQR
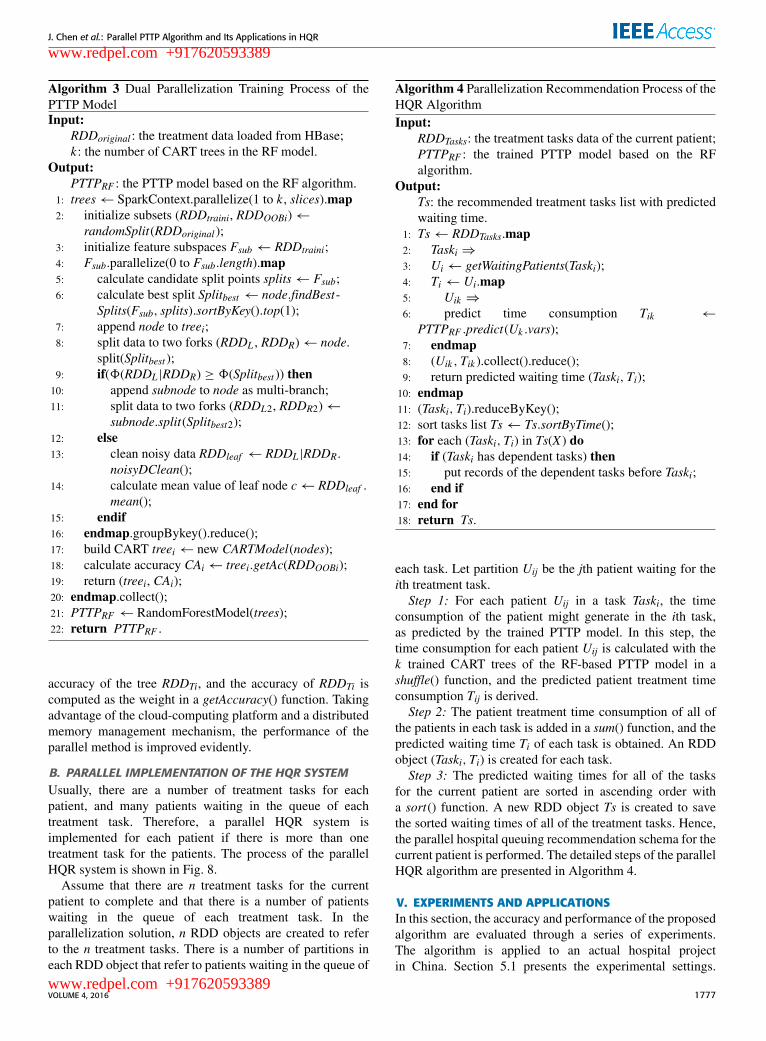
Algorithm 3 Dual Parallelization Training Process of thePTTP ModelInput:
RDDoriginal : the treatment data loaded from HBase;k: the number of CART trees in the RF model.
Output:PTTPRF : the PTTP model based on the RF algorithm.
1: trees← SparkContext.parallelize(1 to k , slices).map2: initialize subsets (RDDtraini, RDDOOBi)←
randomSplit(RDDoriginal);3: initialize feature subspaces Fsub← RDDtraini;4: Fsub.parallelize(0 to Fsub.length).map5: calculate candidate split points splits← Fsub;6: calculate best split Splitbest ← node.findBest-
Splits(Fsub, splits).sortByKey().top(1);7: append node to treei;8: split data to two forks (RDDL , RDDR)← node.
split(Splitbest );9: if(8(RDDL |RDDR) ≥ 8(Splitbest )) then10: append subnode to node as multi-branch;11: split data to two forks (RDDL2, RDDR2)←
subnode.split(Splitbest2);12: else13: clean noisy data RDDleaf ← RDDL |RDDR.
noisyDClean();14: calculate mean value of leaf node c← RDDleaf .
mean();15: endif16: endmap.groupBykey().reduce();17: build CART treei← new CARTModel(nodes);18: calculate accuracy CAi← treei.getAc(RDDOOBi);19: return (treei, CAi);20: endmap.collect();21: PTTPRF ← RandomForestModel(trees);22: return PTTPRF .
accuracy of the tree RDDTi, and the accuracy of RDDTi iscomputed as the weight in a getAccuracy() function. Takingadvantage of the cloud-computing platform and a distributedmemory management mechanism, the performance of theparallel method is improved evidently.
B. PARALLEL IMPLEMENTATION OF THE HQR SYSTEMUsually, there are a number of treatment tasks for eachpatient, and many patients waiting in the queue of eachtreatment task. Therefore, a parallel HQR system isimplemented for each patient if there is more than onetreatment task for the patients. The process of the parallelHQR system is shown in Fig. 8.
Assume that there are n treatment tasks for the currentpatient to complete and that there is a number of patientswaiting in the queue of each treatment task. In theparallelization solution, n RDD objects are created to referto the n treatment tasks. There is a number of partitions ineach RDD object that refer to patients waiting in the queue of
Algorithm 4 Parallelization Recommendation Process of theHQR AlgorithmInput:
RDDTasks: the treatment tasks data of the current patient;PTTPRF : the trained PTTP model based on the RFalgorithm.
Output:Ts: the recommended treatment tasks list with predictedwaiting time.
1: Ts← RDDTasks.map2: Taski ⇒3: Ui← getWaitingPatients(Taski);4: Ti← Ui.map5: Uik ⇒6: predict time consumption Tik ←
PTTPRF .predict(Uk .vars);7: endmap8: (Uik ,Tik ).collect().reduce();9: return predicted waiting time (Taski,Ti);10: endmap11: (Taski,Ti).reduceByKey();12: sort tasks list Ts← Ts.sortByTime();13: for each (Taski,Ti) in Ts(X ) do14: if (Taski has dependent tasks) then15: put records of the dependent tasks before Taski;16: end if17: end for18: return Ts.
each task. Let partition Uij be the jth patient waiting for theith treatment task.Step 1: For each patient Uij in a task Taski, the time
consumption of the patient might generate in the ith task,as predicted by the trained PTTP model. In this step, thetime consumption for each patient Uij is calculated with thek trained CART trees of the RF-based PTTP model in ashuffle() function, and the predicted patient treatment timeconsumption Tij is derived.Step 2: The patient treatment time consumption of all of
the patients in each task is added in a sum() function, and thepredicted waiting time Ti of each task is obtained. An RDDobject (Taski,Ti) is created for each task.Step 3: The predicted waiting times for all of the tasks
for the current patient are sorted in ascending order witha sort() function. A new RDD object Ts is created to savethe sorted waiting times of all of the treatment tasks. Hence,the parallel hospital queuing recommendation schema for thecurrent patient is performed. The detailed steps of the parallelHQR algorithm are presented in Algorithm 4.
V. EXPERIMENTS AND APPLICATIONSIn this section, the accuracy and performance of the proposedalgorithm are evaluated through a series of experiments.The algorithm is applied to an actual hospital projectin China. Section 5.1 presents the experimental settings.
VOLUME 4, 2016 1777
www.redpel.com +917620593389
www.redpel.com +917620593389
J. Chen et al.: Parallel PTTP Algorithm and Its Applications in HQR
The experiment result analysis of the PTTP algorithm andthe HQR system are presented in Section 5.2, Section 5.3presents the accuracy and robustness evaluation, andperformance evaluation is provided in Section 5.4.
A. EXPERIMENT AND APPLICATION SETUPThe HQR system consists of two main modules: a decisionmaker and recommendation module and a mobile applicationinterface module. In the decision maker and recommendationmodule, treatment data are transmitted to the HBase databasein NSCC from hospitals regularly.
The system and experiments are performed on a Sparkcloud platform, which is constructed at the NationalSupercomputing Center in Changsha to achieve theaforementioned goals. Each computing node runs Linuxoperating system Ubuntu 12.04.4, with 2 Intel XeonWestmere EP CPUs, 6 cores, 2.93GHZ, and 48GB memory.All of the nodes are connected by a high-speed Gigabitnetwork and are configured with Hadoop 2.6.0 andSpark 1.6.0. The algorithm is implemented in Java 1.7.0and Scala 2.11.7. In our experiments, datasets covering threeyears (2012 - 2014) are chosen from an actual hospitalapplication, as shown in Table 5.
TABLE 5. Datasets from an actual hospital application.
In Table 5, the departments of the hospital include thefinancial room, the Emergency Department (ED), CT scan,MR scan, B-model ultrasound, color Doppler ultrasound,nuclear medicine, and the pharmacy. There are varioustreatment tasks in each department.
B. EXPERIMENT RESULT ANALYSISWe analyze the patient treatment time consumption of theCT scan task with time factors and patient characteristics.Because of the content of the activities and variouscircumstances, the patient treatment time consumption oftreatment tasks in each department can vary. At the sametime, the time consumption in the same department mightbe different due to the different treatment tasks, differentperiods, and different conditions of patients.
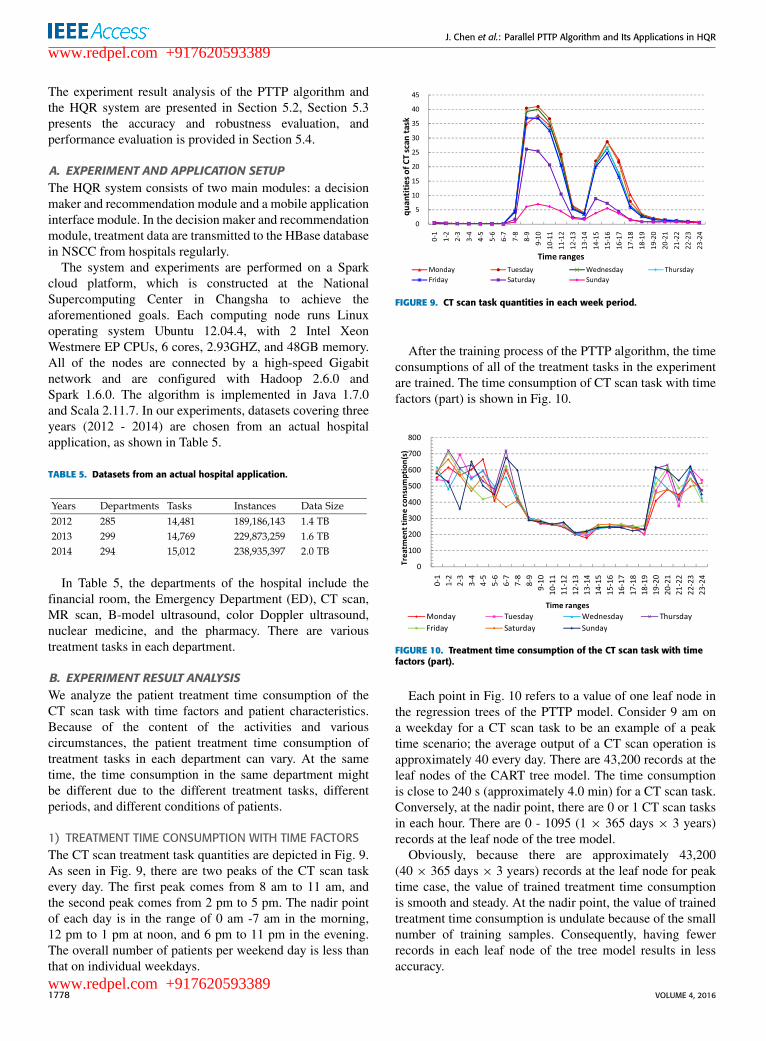
1) TREATMENT TIME CONSUMPTION WITH TIME FACTORSThe CT scan treatment task quantities are depicted in Fig. 9.As seen in Fig. 9, there are two peaks of the CT scan taskevery day. The first peak comes from 8 am to 11 am, andthe second peak comes from 2 pm to 5 pm. The nadir pointof each day is in the range of 0 am -7 am in the morning,12 pm to 1 pm at noon, and 6 pm to 11 pm in the evening.The overall number of patients per weekend day is less thanthat on individual weekdays.
FIGURE 9. CT scan task quantities in each week period.
After the training process of the PTTP algorithm, the timeconsumptions of all of the treatment tasks in the experimentare trained. The time consumption of CT scan task with timefactors (part) is shown in Fig. 10.
FIGURE 10. Treatment time consumption of the CT scan task with timefactors (part).
Each point in Fig. 10 refers to a value of one leaf node inthe regression trees of the PTTP model. Consider 9 am ona weekday for a CT scan task to be an example of a peaktime scenario; the average output of a CT scan operation isapproximately 40 every day. There are 43,200 records at theleaf nodes of the CART tree model. The time consumptionis close to 240 s (approximately 4.0 min) for a CT scan task.Conversely, at the nadir point, there are 0 or 1 CT scan tasksin each hour. There are 0 - 1095 (1 × 365 days × 3 years)records at the leaf node of the tree model.
Obviously, because there are approximately 43,200(40 × 365 days × 3 years) records at the leaf node for peaktime case, the value of trained treatment time consumptionis smooth and steady. At the nadir point, the value of trainedtreatment time consumption is undulate because of the smallnumber of training samples. Consequently, having fewerrecords in each leaf node of the tree model results in lessaccuracy.
1778 VOLUME 4, 2016
www.redpel.com +917620593389
www.redpel.com +917620593389
J. Chen et al.: Parallel PTTP Algorithm and Its Applications in HQR
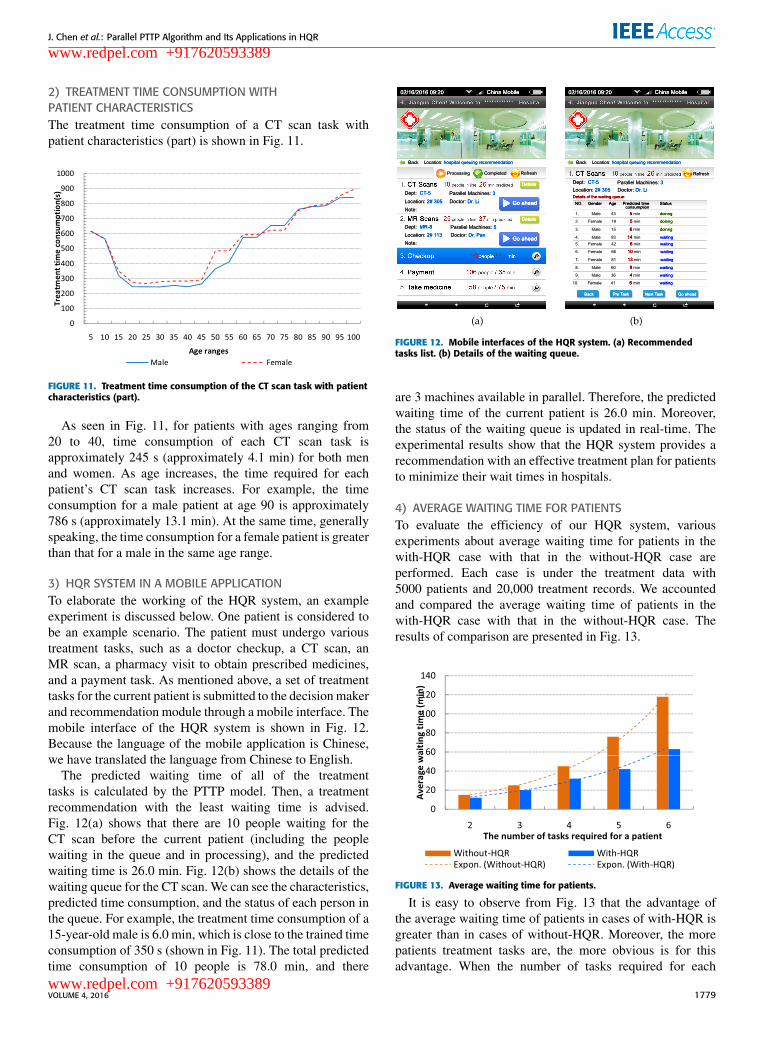
2) TREATMENT TIME CONSUMPTION WITHPATIENT CHARACTERISTICSThe treatment time consumption of a CT scan task withpatient characteristics (part) is shown in Fig. 11.
FIGURE 11. Treatment time consumption of the CT scan task with patientcharacteristics (part).
As seen in Fig. 11, for patients with ages ranging from20 to 40, time consumption of each CT scan task isapproximately 245 s (approximately 4.1 min) for both menand women. As age increases, the time required for eachpatient’s CT scan task increases. For example, the timeconsumption for a male patient at age 90 is approximately786 s (approximately 13.1 min). At the same time, generallyspeaking, the time consumption for a female patient is greaterthan that for a male in the same age range.
3) HQR SYSTEM IN A MOBILE APPLICATIONTo elaborate the working of the HQR system, an exampleexperiment is discussed below. One patient is considered tobe an example scenario. The patient must undergo varioustreatment tasks, such as a doctor checkup, a CT scan, anMR scan, a pharmacy visit to obtain prescribed medicines,and a payment task. As mentioned above, a set of treatmenttasks for the current patient is submitted to the decisionmakerand recommendation module through a mobile interface. Themobile interface of the HQR system is shown in Fig. 12.Because the language of the mobile application is Chinese,we have translated the language from Chinese to English.
The predicted waiting time of all of the treatmenttasks is calculated by the PTTP model. Then, a treatmentrecommendation with the least waiting time is advised.Fig. 12(a) shows that there are 10 people waiting for theCT scan before the current patient (including the peoplewaiting in the queue and in processing), and the predictedwaiting time is 26.0 min. Fig. 12(b) shows the details of thewaiting queue for the CT scan. We can see the characteristics,predicted time consumption, and the status of each person inthe queue. For example, the treatment time consumption of a15-year-old male is 6.0 min, which is close to the trained timeconsumption of 350 s (shown in Fig. 11). The total predictedtime consumption of 10 people is 78.0 min, and there
FIGURE 12. Mobile interfaces of the HQR system. (a) Recommendedtasks list. (b) Details of the waiting queue.
are 3 machines available in parallel. Therefore, the predictedwaiting time of the current patient is 26.0 min. Moreover,the status of the waiting queue is updated in real-time. Theexperimental results show that the HQR system provides arecommendation with an effective treatment plan for patientsto minimize their wait times in hospitals.
4) AVERAGE WAITING TIME FOR PATIENTSTo evaluate the efficiency of our HQR system, variousexperiments about average waiting time for patients in thewith-HQR case with that in the without-HQR case areperformed. Each case is under the treatment data with5000 patients and 20,000 treatment records. We accountedand compared the average waiting time of patients in thewith-HQR case with that in the without-HQR case. Theresults of comparison are presented in Fig. 13.
FIGURE 13. Average waiting time for patients.
It is easy to observe from Fig. 13 that the advantage ofthe average waiting time of patients in cases of with-HQR isgreater than in cases of without-HQR. Moreover, the morepatients treatment tasks are, the more obvious is for thisadvantage. When the number of tasks required for each
VOLUME 4, 2016 1779
www.redpel.com +917620593389
www.redpel.com +917620593389
J. Chen et al.: Parallel PTTP Algorithm and Its Applications in HQR
patient is equal to 2, the average waiting time of eachpatient is approximately 15 min in the without-HQR case (theoriginal case), while 12 min in the with-HQR case. Whenthere are 6 treatment tasks required for each patient, theaverage waiting time is approximately 118 min in the formercase, while 63 min in the latter case.
C. ACCURACY AND ROBUSTNESS ANALYSISTo evaluate the accuracy and robustness of our improved-RF-based PTTP algorithm, we implemented the PTTP algorithmbased on the original random forest (refereed as PTTP-ORF).The accuracies of the PTTP algorithm and PTTP-ORFalgorithm are analyzed under different ratios of noisy data.
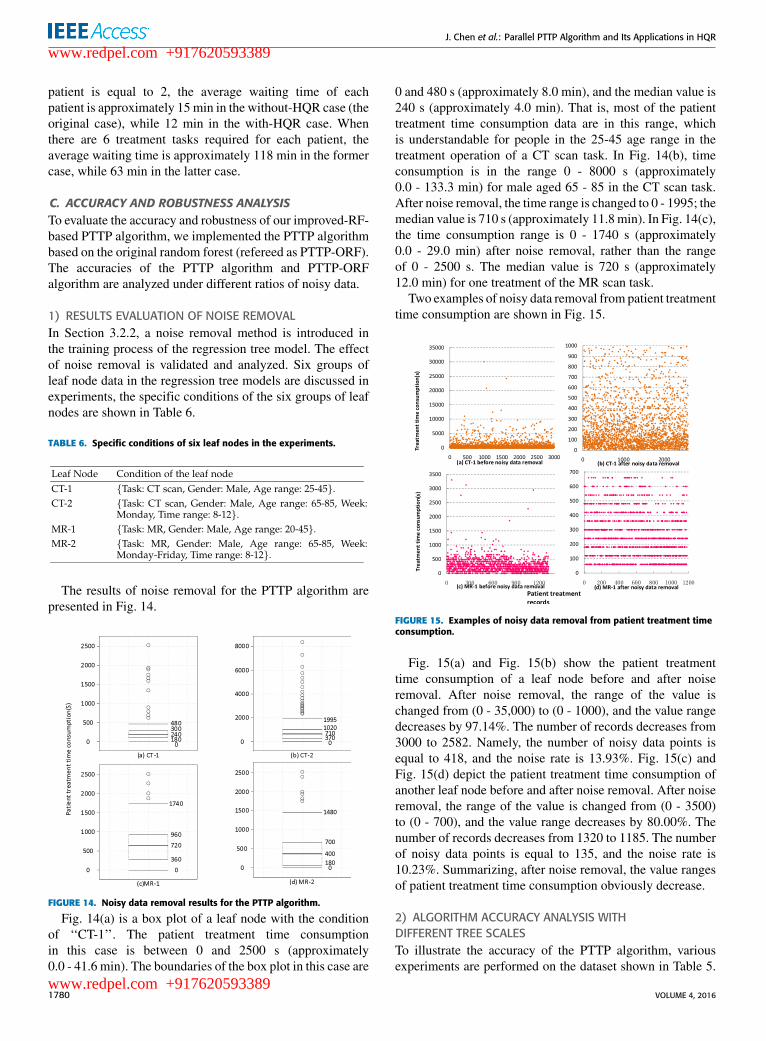
1) RESULTS EVALUATION OF NOISE REMOVALIn Section 3.2.2, a noise removal method is introduced inthe training process of the regression tree model. The effectof noise removal is validated and analyzed. Six groups ofleaf node data in the regression tree models are discussed inexperiments, the specific conditions of the six groups of leafnodes are shown in Table 6.
TABLE 6. Specific conditions of six leaf nodes in the experiments.
The results of noise removal for the PTTP algorithm arepresented in Fig. 14.
FIGURE 14. Noisy data removal results for the PTTP algorithm.
Fig. 14(a) is a box plot of a leaf node with the conditionof ‘‘CT-1’’. The patient treatment time consumptionin this case is between 0 and 2500 s (approximately0.0 - 41.6 min). The boundaries of the box plot in this case are
0 and 480 s (approximately 8.0 min), and the median value is240 s (approximately 4.0 min). That is, most of the patienttreatment time consumption data are in this range, whichis understandable for people in the 25-45 age range in thetreatment operation of a CT scan task. In Fig. 14(b), timeconsumption is in the range 0 - 8000 s (approximately0.0 - 133.3 min) for male aged 65 - 85 in the CT scan task.After noise removal, the time range is changed to 0 - 1995; themedian value is 710 s (approximately 11.8min). In Fig. 14(c),the time consumption range is 0 - 1740 s (approximately0.0 - 29.0 min) after noise removal, rather than the rangeof 0 - 2500 s. The median value is 720 s (approximately12.0 min) for one treatment of the MR scan task.
Two examples of noisy data removal from patient treatmenttime consumption are shown in Fig. 15.
FIGURE 15. Examples of noisy data removal from patient treatment timeconsumption.
Fig. 15(a) and Fig. 15(b) show the patient treatmenttime consumption of a leaf node before and after noiseremoval. After noise removal, the range of the value ischanged from (0 - 35,000) to (0 - 1000), and the value rangedecreases by 97.14%. The number of records decreases from3000 to 2582. Namely, the number of noisy data points isequal to 418, and the noise rate is 13.93%. Fig. 15(c) andFig. 15(d) depict the patient treatment time consumption ofanother leaf node before and after noise removal. After noiseremoval, the range of the value is changed from (0 - 3500)to (0 - 700), and the value range decreases by 80.00%. Thenumber of records decreases from 1320 to 1185. The numberof noisy data points is equal to 135, and the noise rate is10.23%. Summarizing, after noise removal, the value rangesof patient treatment time consumption obviously decrease.
2) ALGORITHM ACCURACY ANALYSIS WITHDIFFERENT TREE SCALESTo illustrate the accuracy of the PTTP algorithm, variousexperiments are performed on the dataset shown in Table 5.
1780 VOLUME 4, 2016
www.redpel.com +917620593389
www.redpel.com +917620593389
J. Chen et al.: Parallel PTTP Algorithm and Its Applications in HQR
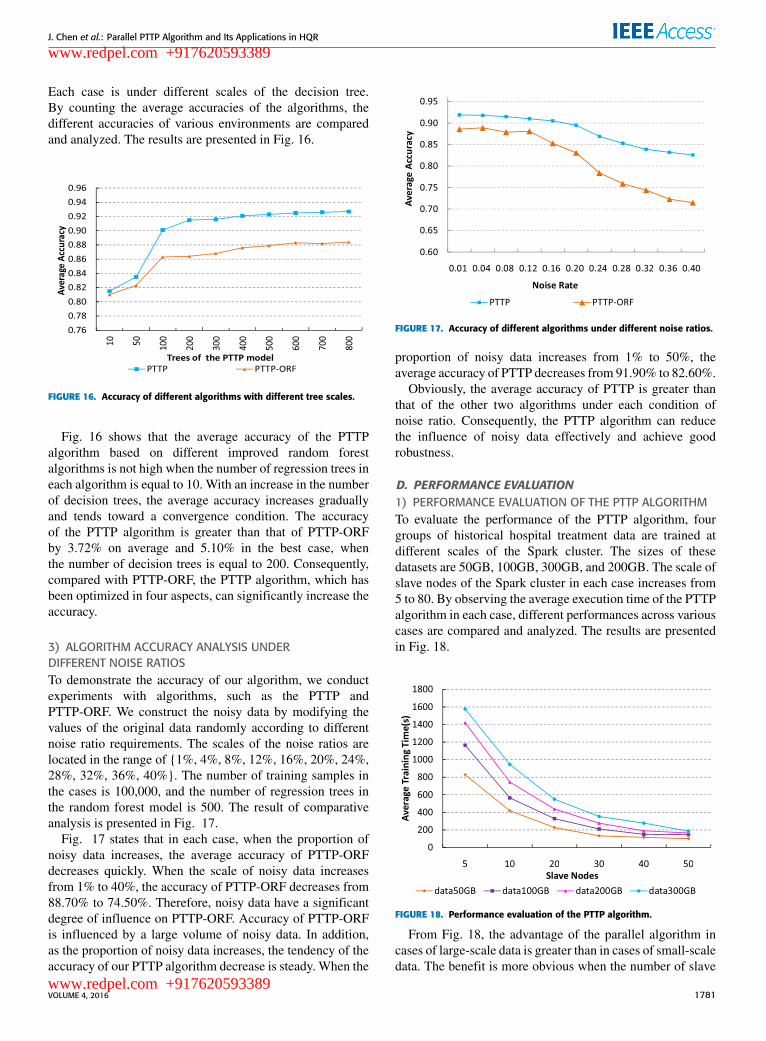
Each case is under different scales of the decision tree.By counting the average accuracies of the algorithms, thedifferent accuracies of various environments are comparedand analyzed. The results are presented in Fig. 16.
FIGURE 16. Accuracy of different algorithms with different tree scales.
Fig. 16 shows that the average accuracy of the PTTPalgorithm based on different improved random forestalgorithms is not high when the number of regression trees ineach algorithm is equal to 10. With an increase in the numberof decision trees, the average accuracy increases graduallyand tends toward a convergence condition. The accuracyof the PTTP algorithm is greater than that of PTTP-ORFby 3.72% on average and 5.10% in the best case, whenthe number of decision trees is equal to 200. Consequently,compared with PTTP-ORF, the PTTP algorithm, which hasbeen optimized in four aspects, can significantly increase theaccuracy.
3) ALGORITHM ACCURACY ANALYSIS UNDERDIFFERENT NOISE RATIOSTo demonstrate the accuracy of our algorithm, we conductexperiments with algorithms, such as the PTTP andPTTP-ORF. We construct the noisy data by modifying thevalues of the original data randomly according to differentnoise ratio requirements. The scales of the noise ratios arelocated in the range of {1%, 4%, 8%, 12%, 16%, 20%, 24%,28%, 32%, 36%, 40%}. The number of training samples inthe cases is 100,000, and the number of regression trees inthe random forest model is 500. The result of comparativeanalysis is presented in Fig. 17.
Fig. 17 states that in each case, when the proportion ofnoisy data increases, the average accuracy of PTTP-ORFdecreases quickly. When the scale of noisy data increasesfrom 1% to 40%, the accuracy of PTTP-ORF decreases from88.70% to 74.50%. Therefore, noisy data have a significantdegree of influence on PTTP-ORF. Accuracy of PTTP-ORFis influenced by a large volume of noisy data. In addition,as the proportion of noisy data increases, the tendency of theaccuracy of our PTTP algorithm decrease is steady. When the
FIGURE 17. Accuracy of different algorithms under different noise ratios.
proportion of noisy data increases from 1% to 50%, theaverage accuracy of PTTP decreases from 91.90% to 82.60%.
Obviously, the average accuracy of PTTP is greater thanthat of the other two algorithms under each condition ofnoise ratio. Consequently, the PTTP algorithm can reducethe influence of noisy data effectively and achieve goodrobustness.
D. PERFORMANCE EVALUATION1) PERFORMANCE EVALUATION OF THE PTTP ALGORITHMTo evaluate the performance of the PTTP algorithm, fourgroups of historical hospital treatment data are trained atdifferent scales of the Spark cluster. The sizes of thesedatasets are 50GB, 100GB, 300GB, and 200GB. The scale ofslave nodes of the Spark cluster in each case increases from5 to 80. By observing the average execution time of the PTTPalgorithm in each case, different performances across variouscases are compared and analyzed. The results are presentedin Fig. 18.
FIGURE 18. Performance evaluation of the PTTP algorithm.
From Fig. 18, the advantage of the parallel algorithm incases of large-scale data is greater than in cases of small-scaledata. The benefit is more obvious when the number of slave
VOLUME 4, 2016 1781
www.redpel.com +917620593389
www.redpel.com +917620593389
J. Chen et al.: Parallel PTTP Algorithm and Its Applications in HQR
nodes increases. As the number of cluster nodes increasesfrom 5 to 80, the average execution time of the PTTP modeldecreases from 879 to 285 s for 300GB of data, and decreasesfrom 328 to 81 s for 50GB of data.
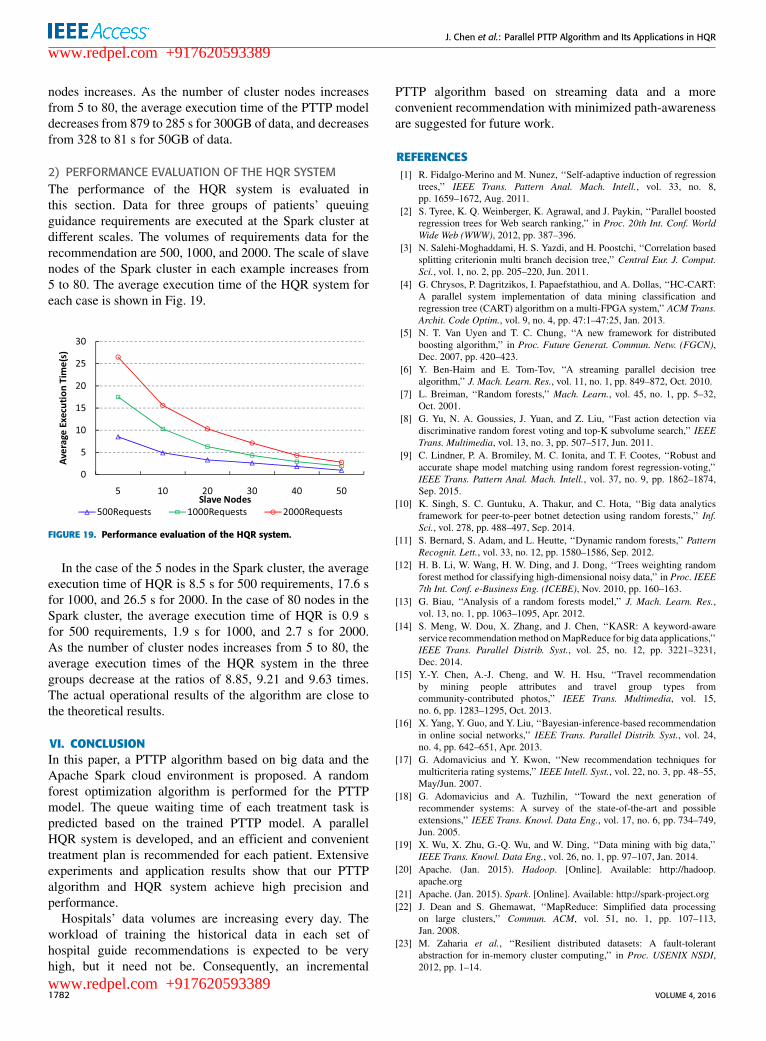
2) PERFORMANCE EVALUATION OF THE HQR SYSTEMThe performance of the HQR system is evaluated inthis section. Data for three groups of patients’ queuingguidance requirements are executed at the Spark cluster atdifferent scales. The volumes of requirements data for therecommendation are 500, 1000, and 2000. The scale of slavenodes of the Spark cluster in each example increases from5 to 80. The average execution time of the HQR system foreach case is shown in Fig. 19.
FIGURE 19. Performance evaluation of the HQR system.
In the case of the 5 nodes in the Spark cluster, the averageexecution time of HQR is 8.5 s for 500 requirements, 17.6 sfor 1000, and 26.5 s for 2000. In the case of 80 nodes in theSpark cluster, the average execution time of HQR is 0.9 sfor 500 requirements, 1.9 s for 1000, and 2.7 s for 2000.As the number of cluster nodes increases from 5 to 80, theaverage execution times of the HQR system in the threegroups decrease at the ratios of 8.85, 9.21 and 9.63 times.The actual operational results of the algorithm are close tothe theoretical results.
VI. CONCLUSIONIn this paper, a PTTP algorithm based on big data and theApache Spark cloud environment is proposed. A randomforest optimization algorithm is performed for the PTTPmodel. The queue waiting time of each treatment task ispredicted based on the trained PTTP model. A parallelHQR system is developed, and an efficient and convenienttreatment plan is recommended for each patient. Extensiveexperiments and application results show that our PTTPalgorithm and HQR system achieve high precision andperformance.
Hospitals’ data volumes are increasing every day. Theworkload of training the historical data in each set ofhospital guide recommendations is expected to be veryhigh, but it need not be. Consequently, an incremental
PTTP algorithm based on streaming data and a moreconvenient recommendation with minimized path-awarenessare suggested for future work.
REFERENCES[1] R. Fidalgo-Merino and M. Nunez, ‘‘Self-adaptive induction of regression
trees,’’ IEEE Trans. Pattern Anal. Mach. Intell., vol. 33, no. 8,pp. 1659–1672, Aug. 2011.
[2] S. Tyree, K. Q. Weinberger, K. Agrawal, and J. Paykin, ‘‘Parallel boostedregression trees for Web search ranking,’’ in Proc. 20th Int. Conf. WorldWide Web (WWW), 2012, pp. 387–396.
[3] N. Salehi-Moghaddami, H. S. Yazdi, and H. Poostchi, ‘‘Correlation basedsplitting criterionin multi branch decision tree,’’ Central Eur. J. Comput.Sci., vol. 1, no. 2, pp. 205–220, Jun. 2011.
[4] G. Chrysos, P. Dagritzikos, I. Papaefstathiou, and A. Dollas, ‘‘HC-CART:A parallel system implementation of data mining classification andregression tree (CART) algorithm on a multi-FPGA system,’’ ACM Trans.Archit. Code Optim., vol. 9, no. 4, pp. 47:1–47:25, Jan. 2013.
[5] N. T. Van Uyen and T. C. Chung, ‘‘A new framework for distributedboosting algorithm,’’ in Proc. Future Generat. Commun. Netw. (FGCN),Dec. 2007, pp. 420–423.
[6] Y. Ben-Haim and E. Tom-Tov, ‘‘A streaming parallel decision treealgorithm,’’ J. Mach. Learn. Res., vol. 11, no. 1, pp. 849–872, Oct. 2010.
[7] L. Breiman, ‘‘Random forests,’’ Mach. Learn., vol. 45, no. 1, pp. 5–32,Oct. 2001.
[8] G. Yu, N. A. Goussies, J. Yuan, and Z. Liu, ‘‘Fast action detection viadiscriminative random forest voting and top-K subvolume search,’’ IEEETrans. Multimedia, vol. 13, no. 3, pp. 507–517, Jun. 2011.
[9] C. Lindner, P. A. Bromiley, M. C. Ionita, and T. F. Cootes, ‘‘Robust andaccurate shape model matching using random forest regression-voting,’’IEEE Trans. Pattern Anal. Mach. Intell., vol. 37, no. 9, pp. 1862–1874,Sep. 2015.
[10] K. Singh, S. C. Guntuku, A. Thakur, and C. Hota, ‘‘Big data analyticsframework for peer-to-peer botnet detection using random forests,’’ Inf.Sci., vol. 278, pp. 488–497, Sep. 2014.
[11] S. Bernard, S. Adam, and L. Heutte, ‘‘Dynamic random forests,’’ PatternRecognit. Lett., vol. 33, no. 12, pp. 1580–1586, Sep. 2012.
[12] H. B. Li, W. Wang, H. W. Ding, and J. Dong, ‘‘Trees weighting randomforest method for classifying high-dimensional noisy data,’’ in Proc. IEEE7th Int. Conf. e-Business Eng. (ICEBE), Nov. 2010, pp. 160–163.
[13] G. Biau, ‘‘Analysis of a random forests model,’’ J. Mach. Learn. Res.,vol. 13, no. 1, pp. 1063–1095, Apr. 2012.
[14] S. Meng, W. Dou, X. Zhang, and J. Chen, ‘‘KASR: A keyword-awareservice recommendationmethod onMapReduce for big data applications,’’IEEE Trans. Parallel Distrib. Syst., vol. 25, no. 12, pp. 3221–3231,Dec. 2014.
[15] Y.-Y. Chen, A.-J. Cheng, and W. H. Hsu, ‘‘Travel recommendationby mining people attributes and travel group types fromcommunity-contributed photos,’’ IEEE Trans. Multimedia, vol. 15,no. 6, pp. 1283–1295, Oct. 2013.
[16] X. Yang, Y. Guo, and Y. Liu, ‘‘Bayesian-inference-based recommendationin online social networks,’’ IEEE Trans. Parallel Distrib. Syst., vol. 24,no. 4, pp. 642–651, Apr. 2013.
[17] G. Adomavicius and Y. Kwon, ‘‘New recommendation techniques formulticriteria rating systems,’’ IEEE Intell. Syst., vol. 22, no. 3, pp. 48–55,May/Jun. 2007.
[18] G. Adomavicius and A. Tuzhilin, ‘‘Toward the next generation ofrecommender systems: A survey of the state-of-the-art and possibleextensions,’’ IEEE Trans. Knowl. Data Eng., vol. 17, no. 6, pp. 734–749,Jun. 2005.
[19] X. Wu, X. Zhu, G.-Q. Wu, and W. Ding, ‘‘Data mining with big data,’’IEEE Trans. Knowl. Data Eng., vol. 26, no. 1, pp. 97–107, Jan. 2014.
[20] Apache. (Jan. 2015). Hadoop. [Online]. Available: http://hadoop.apache.org
[21] Apache. (Jan. 2015). Spark. [Online]. Available: http://spark-project.org[22] J. Dean and S. Ghemawat, ‘‘MapReduce: Simplified data processing
on large clusters,’’ Commun. ACM, vol. 51, no. 1, pp. 107–113,Jan. 2008.
[23] M. Zaharia et al., ‘‘Resilient distributed datasets: A fault-tolerantabstraction for in-memory cluster computing,’’ in Proc. USENIX NSDI,2012, pp. 1–14.
1782 VOLUME 4, 2016
www.redpel.com +917620593389
www.redpel.com +917620593389

J. Chen et al.: Parallel PTTP Algorithm and Its Applications in HQR
[24] Apache. (Jan. 2015). Mahout. [Online]. Available: http://mahout.apache.org
[25] Y. Xu, K. Li, L. He, L. Zhang, and K. Li, ‘‘A hybrid chemicalreaction optimization scheme for task scheduling on heterogeneouscomputing systems,’’ IEEE Trans. Parallel Distrib. Syst., vol. 26, no. 12,pp. 3208–3222, Dec. 2015.
[26] K. Li, X. Tang, B. Veeravalli, and K. Li, ‘‘Scheduling precedenceconstrained stochastic tasks on heterogeneous cluster systems,’’ IEEETrans. Comput., vol. 64, no. 1, pp. 191–204, Jan. 2015.
[27] D. Dahiphale et al., ‘‘An advanced MapReduce: Cloud MapReduce,enhancements and applications,’’ IEEE Trans. Netw. Service Manage.,vol. 11, no. 1, pp. 101–115, Mar. 2014.
[28] M. Zaharia et al., ‘‘Fast and interactive analytics over hadoop data withspark,’’ in Proc. USENIX NSDI, 2012, pp. 45–51.
JIANGUO CHEN is currently pursuing thePh.D. degree in the College of Computer Scienceand Electronic Engineering, Hunan University,China. His research interests include parallelcomputing, cloud computing, machine learning,data mining, and big data. He has publishedresearch articles in international conference andjournals of data-mining algorithms and parallelcomputing.
KENLI LI (M’11) received the Ph.D. degree incomputer science from the Huazhong Universityof Science and Technology, China, in 2003.He was a Visiting Scholar with the University ofIllinois at Urbana–Champaign from 2004 to 2005.He is currently a Full Professor of ComputerScience and Technology with Hunan Universityand the Deputy Director of the NationalSupercomputing Center in Changsha. His majorresearch areas include parallel computing,
high-performance computing, grid, and cloud computing. He has publishedmore than 130 research papers in international conferences and journals, suchas the IEEE-TC, the IEEE-TPDS, the IEEE-TSP, JPDC, ICPP, and CCGrid.He is an Outstanding Member of CCF. He serves on the Editorial Board ofthe IEEE TRANSACTIONS ON COMPUTERS.
ZHUO TANG received the Ph.D. degree incomputer science from the Huazhong Universityof Science and Technology, China, in 2008. He iscurrently an Associate Professor with the Collegeof Computer Science and Electronic Engineering,Hunan University. He is the Sub-Dean of theDepartment of Computing Science. His majors aredistributed computing system, cloud computing,and the parallel process for big data, includethe security model, parallel algorithms, and
resources scheduling and management in these areas. He is a member ofACM and CCF.
KASHIF BILAL received the Ph.D. degree fromNorth Dakota State University, USA. He iscurrently a Post-Doctoral Researcher with QatarUniversity, Qatar. His research interests includecloud computing, energy efficient high speednetworks, and robustness. He received the CoEStudent Researcher of the Year 2014 based on hisresearch contributions during his doctoral studiesat North Dakota State University.
KEQIN LI (F’15) is a SUNY DistinguishedProfessor of Computer Science. His currentresearch interests include parallel computingand high-performance computing, distributedcomputing, energy-efficient computing andcommunication, heterogeneous computing systems,cloud computing, big data computing, CPU-GPUhybrid and cooperative computing, multicorecomputing, storage and file systems, wirelesscommunication networks, sensor net-
works, peer-to-peer file sharing systems, mobile computing, servicecomputing, Internet of Things, and cyber-physical systems. He has publishedover 400 journal articles, book chapters, and refereed conference papers,and has received several best paper awards. He is currently or has served onthe Editorial Boards of the IEEE TRANSACTIONS ON PARALLEL AND DISTRIBUTED
SYSTEMS, the IEEE TRANSACTIONS ON COMPUTERS, the IEEE TRANSACTIONS ON
CLOUD COMPUTING, and the Journal of Parallel and Distributed Computing.He is an IEEE Fellow.
VOLUME 4, 2016 1783
www.redpel.com +917620593389
www.redpel.com +917620593389