a parametric natural fire model for the structural fire design of multi-storey...
TRANSCRIPT

ARTICLE IN PRESS
0379-7112/$ - se
doi:10.1016/j.fir
�CorrespondConcrete Struc
versity of Techn
E-mail addr
Fire Safety Journal 42 (2007) 115–126
www.elsevier.com/locate/firesaf
A parametric natural fire model for the structural fire designof multi-storey buildings
J. Zehfussa,�, D. Hosserb
ahhpberlin Fire Safety Engineers, Berlin, GermanybInstitute of Building Materials, Concrete Structures and Fire Protection (iBMB), Braunschweig University of Technology, Germany
Received 17 September 2004; received in revised form 10 July 2006; accepted 8 August 2006
Abstract
A parametric natural fire model is presented, which is derived on the basis of simulations with heat balance models for realistic natural
design fires, taking into account the boundary conditions of typical compartments in residential and office buildings. These so-called
iBMB parametric fire curves are formulated with the help of simplified empirical equations which can easily be used for structural fire
design as part of a performance-based natural fire design concept. The iBMB parametric fire curves are checked and validated by
comparison with results of different heat balance models and with published fire tests from different fire research laboratories. In
addition, a natural fire test in a test room with ordinary office room furnishings has been performed which supports the parametric
natural fire model presented here. The application of the iBMB parametric fire curves is demonstrated by means of an example.
r 2006 Elsevier Ltd. All rights reserved.
Keywords: Simplified natural fire model; Structural fire design; Design fire; iBMB parametric fire curve
1. Introduction
Within a performance-based fire design concept thestructural design should be based on a natural design firewhich is representative for the boundary conditions of agiven building. The ‘‘traditional way’’ of structural firedesign using the ISO 834 temperature–time curve in manycases results in a design on the safe side causingunsatisfactory costs for fire protection measures, e.g.greater concrete cover of reinforced concrete elements,thicker cladding or over-dimensioning of steel elements,which entails economic as well as aesthetical disadvantages.In some cases the structural fire design with ISO 834temperature–time curve can result in under-estimation ofthe thermal exposure.
In this paper a parametric natural fire model callediBMB parametric fire curve [1,2] is presented. It considersthe actual boundary conditions of the fire compartment
e front matter r 2006 Elsevier Ltd. All rights reserved.
esaf.2006.08.004
ing author. Anciently: Institute of Building Materials,
tures and Fire Protection (iBMB), Braunschweig Uni-
ology, Germany.
ess: [email protected] (J. Zehfuss).
concerning fire load, ventilation conditions, geometryand thermal properties of the enclosure. The iBMBparametric fire curves are derived by heat balancesimulations assuming a great number of naturaldesigns fires by varying the above-mentioned parameters.The iBMB parametric fire curves are appropriate todescribe the thermal action of natural fires in residentialand office buildings including realistic room-to-room firespread. Contrary to the Eurocode 1 parametric tempera-ture–time curves, the iBMB parametric fire curves aredirectly derived from the rate of heat release defining thedesign fire.Because of the connection between design fire and
parametric fire curve, all events influencing the natural fireand resulting in a variation of the rate of heat release canbe considered by the iBMB parametric fire curves. Thus theiBMB parametric fire curves can also be used to considerthe occurrence of flashover, the breakage of windows withadditional ventilation, a failure of the enclosure with loss ofcompartmentation or the effect of fire fighting andsprinkler systems. Whilst the iBMB parametric fire curvesare valid for the structural fire design of each kind ofstructure, they offer the most benefit for steel structures.

ARTICLE IN PRESS
Nomenclature
Af floor area of fire compartment, m2
At total area of the enclosing components includ-ing openings, m2
AT total area of the enclosing components withoutopenings, m2
Aw area of ventilation openings, m2
Hnet net calorific value, MJ/kgO opening factor ðAwh1=2
w =AtÞ, m1/2
Q fire load, MJ
Q�
rate of heat release, MW
Q�
f ;A rate of heat release per unit area, fuel-con-
trolled fire, MW/m2
Q�
max maximum rate of heat release, MW
Q�
max;f maximum rate of heat release, fuel-controlled
fire, MW
Q�
max;v maximum rate of heat release, ventilation-controlled fire, MW
Q�
v rate of heat release, ventilation-controlled fire,MW
T temperature, 1Cb averaged thermal property of the enclosing
components, J/(m2s0.5K)hw averaged height of the ventilation openings, m
m�
mass burning rate, kg/sma mass flow into the fire compartment, kg/s
m� 00
mass burning rate per unit area, kg/(m2s)q00 fire load density, MJ/m2
r stoichiometric fuel/air ratio, dimensionlesst time, stg time of fire growth to 1 MW, sw combustion efficiency, dimensionless
J. Zehfuss, D. Hosser / Fire Safety Journal 42 (2007) 115–126116
2. Natural fires in multi-storey buildings
2.1. Temperature–time curves
The standard temperature–time curve according to ISO834 was developed in the 1930s summarising data fromfires in residential, office and commercial buildings. Thecurve should cover most of the potential courses of fires incommon buildings. As fire tests have shown, the maximumtemperature of a natural fires can exceed the ISO-curve,but after the maximum it decreases again, whereas the ISO-curve rises continuously (Fig. 1).
Magnusson et al. [3] published curves describing thetemperature development of natural fires on the basis ofmass and energy balance equations. These curves havebeen incorporated into a Swedish standard and have servedalso as the basis for the parametric temperature–time
0
200
400
600
800
1000
1200
0 15 30
tim
tem
pera
ture
[°C
]
Natural fires
Fig. 1. Comparison of temperature–time curves
curves of Eurocode 1-1-2 [4]. Latter can be applied to thestructural fire design of small to medium rooms where afully developed fire is assumed.The parametric temperature–time curves of Eurocode 1-
1-2, annex A in some cases provide an unrealistictemperature increase and decrease. One reason is that forfuel-controlled fires in residential and office buildings themaximum temperature is fixed at a fire duration of 20min.For fire compartments with large openings and anenclosure with low thermal conductivity the Eurocodegives an extremely fast enhancement and decay of thetemperature. For fire compartments with small openingsand an enclosure with high thermal conductivity; however,an extremely slow decay of the temperature is assumed.The parametric temperature–time curves in Eurocode 1-1-2[4] only describe the fully developed phase of the firewithout considering the growth phase. Results of fire tests
45 60 9075
e [min]
ISO 834
in natural fires with ISO 834 standard fire.

ARTICLE IN PRESSJ. Zehfuss, D. Hosser / Fire Safety Journal 42 (2007) 115–126 117
with ordinary furnishings reveal that even in small firecompartments it can take some minutes to reach the fullydeveloped fire from the initial fire. The most critical point isthat the parametric temperature–time curves of Eurocode1-1-2 annex A have no temporal connection with the rateof heat release of Eurocode 1-1-2 annex E.
This deficiency with respect to temperature increase anddecrease will be clarified by comparing the parametrictemperature–time curve according to Eurocode 1-1-2 withthe recorded average temperature–time curve of the NFSC2
fire test No. 2 at BRE [5] governed by fuel-controlledconditions (Fig. 2). Even more obvious is the discrepancybetween the temporal course of the parametric tempera-ture–time curve and the rate of heat release according toEurocode 1-1-2 annex E. The latter achieves its maximumafter 30min and declines after 43min. The parametrictemperature–time curve and rate of heat release neithermatch each other nor are they temporally congruent.
A set of further procedures for the computation oftemperature–time curves was developed during the last fewyears (e.g. [6–8]), a part of which is based on the aboveapproach. Most of the proposals are derived fromexperimental results; therefore, their range of applicationis limited to compartments of dimensions and fire loadssimilar to those in the respective fire tests.
A more consistent way is to assume a realistic fire scenario,to define the resulting design fire and to compute on thisbasis the temperature–time curve using an established andvalidated fire simulation model. The range of application ofsuch temperature–time curves is determined by the field ofboundary conditions covered by the simulations.
2.2. Design fire
2.2.1. General
A performance-based structural fire design should bebased on a realistic fire scenario which is described by adesign fire taking into account the relevant boundary
0
200
400
600
800
1000
1200
3020100
time [m
tem
pera
ture
[°C
]
Fig. 2. Temperature–time curve and rate of he
conditions (fire load, ventilation, geometry of fire compart-ment). The design fire is defined in terms of a rate of heatrelease, which can be used as input to most types of firemodels for calculating important fire effects, e.g. tempera-tures and mass flow. This description is physically clearerand more general than temperature–time-curves [1]. The
rate of heat release Q�
ðtÞ is given by
Q�
ðtÞ ¼ m�ðtÞwHnet. (1)
The combustion efficiency w is derived from experimentalresults, e.g. w ¼ 0:7 for wooden fire loads [9]. The netcalorific value can be taken as Hnet,wood ¼ 17.3MJ/kg forwooden fire loads and furnishings [9,10]. The rate of heatrelease strongly depends on the ventilation conditions anda distinction is made between ventilation-controlled firesand fuel-controlled fires.
2.2.2. Ventilation-controlled fires
In small and medium-size rooms fully developed fires arefrequently ventilation-controlled. They are governed by thesize and shape of the ventilation openings (windows anddoors). The mass flow rate through the ventilation open-ings can be assumed as
m�
a ¼ 0:52Aw
ffiffiffiffiffihw
pkg=s. (2)
Being aware of the stoichiometric ratio (r ¼ 5.2 kg air/kgburning material for wooden fire loads resp. furnishings),that is the required amount of air for the combustion perkg of burning material, the burning rate can be assumed as
m�¼
ma�
r¼
0:52
5:2Aw
ffiffiffiffiffihw
p¼ 0:1Aw
ffiffiffiffiffihw
pkg=s. (3)
Inserting Eq. (3) in Eq. (1) supplies the rate of heatrelease of a ventilation-controlled fire, which correspondsto annex E of Ref. [4]:
Q�
v ¼ 0:1Aw
ffiffiffiffiffihw
pwHnet MW: (4)
605040
in]
0
10
20
30
40
rate
of h
eat r
elea
se [M
W]temperature test
temperature Eurocode 1-1-2
rate of heat releaseEurocode 1-1- 2
at release according to Eurocode 1-1-2 [4].
ARTICLE IN PRESSJ. Zehfuss, D. Hosser / Fire Safety Journal 42 (2007) 115–126118
The maximum rate of heat release for residential andoffice buildings in case of a ventilation-controlled fire canbe derived by inserting w ¼ 0:7 and Hnet,wood ¼ 17.3MJ/kgin Eq. (4):
Q�
max;v ¼ 1:21Aw
ffiffiffiffiffihw
pMW. (5)
2.2.3. Fuel-controlled fires
In large compartments fully developed fires are oftenfuel-controlled and the burning rate is primarily influencedby the area of the burning surface of the fire load. The rateof heat release can be defined as
Q�
ðtÞ ¼ m� 00
� Af ðtÞ � w �Hnet. (6)
For wooden fire loads resp. furnishings the burning rateper unit area can be assumed as m
� 00
¼ 0.02 kg/(m2s) [1].Inserting w ¼ 0:7 and Hnet,wood ¼ 17.3MJ/kg in Eq. (6) therate of heat release can be assumed as
Q�
f ;AðtÞ ¼ 0:02� 0:7� 17:3Af ðtÞ ¼ 0:242Af ðtÞMW: (7)
In agreement with the investigation of [11] the maximumrate of heat release of multi-storey residential and officebuildings in case of a fuel-controlled fire can be determinedas
Q�
max;f ¼ 0:25Af MW, (8)
where by the maximum burning area Af (m2) is assumed to
be limited to the floor area of the fire compartment.
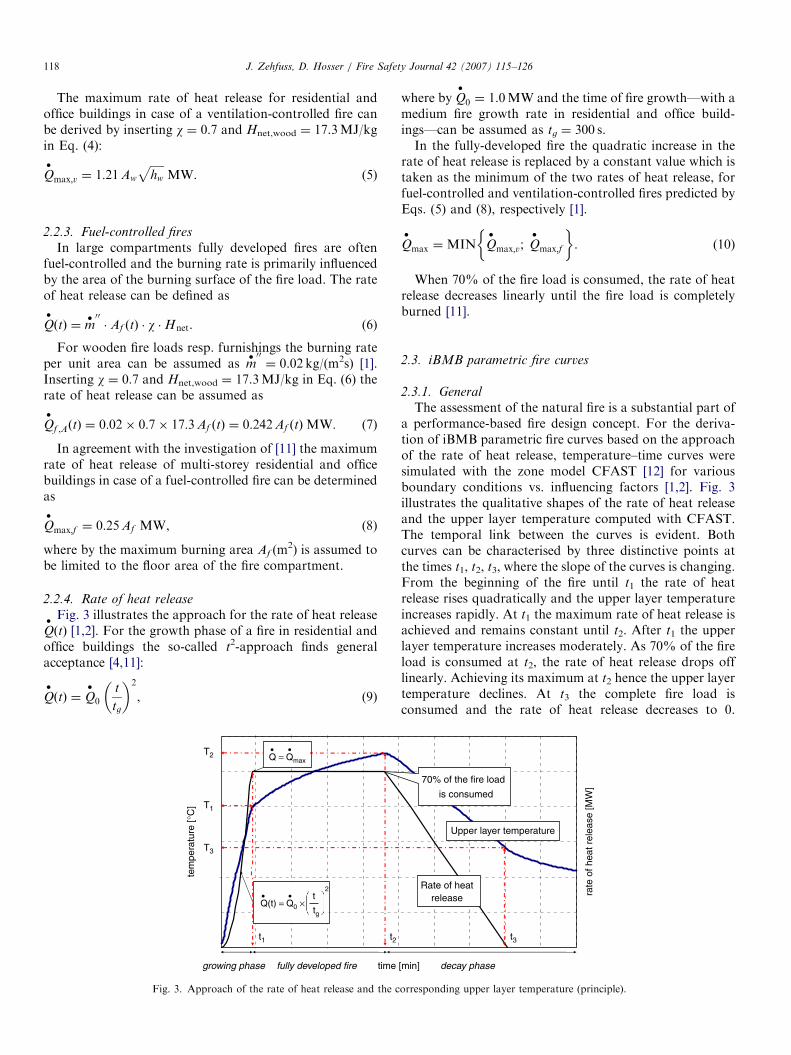
2.2.4. Rate of heat release
Fig. 3 illustrates the approach for the rate of heat releaseQ�
ðtÞ [1,2]. For the growth phase of a fire in residential andoffice buildings the so-called t2-approach finds generalacceptance [4,11]:
Q�
ðtÞ ¼ Q�
0
t
tg
� �2
, (9)
time
tem
pera
ture
[°C
]
t2
T2
2t
Q(t) = Q0 × tg
Q = Qmax
t1
T1
T3
growing phase fully developed fire
Fig. 3. Approach of the rate of heat release and the c
where by Q�
0 ¼ 1.0MW and the time of fire growth—with amedium fire growth rate in residential and office build-ings—can be assumed as tg ¼ 300 s.In the fully-developed fire the quadratic increase in the
rate of heat release is replaced by a constant value which istaken as the minimum of the two rates of heat release, forfuel-controlled and ventilation-controlled fires predicted byEqs. (5) and (8), respectively [1].
Q�
max ¼MIN Q�
max;v; Q�
max;f
� �. (10)
When 70% of the fire load is consumed, the rate of heatrelease decreases linearly until the fire load is completelyburned [11].
2.3. iBMB parametric fire curves
2.3.1. General
The assessment of the natural fire is a substantial part ofa performance-based fire design concept. For the deriva-tion of iBMB parametric fire curves based on the approachof the rate of heat release, temperature–time curves weresimulated with the zone model CFAST [12] for variousboundary conditions vs. influencing factors [1,2]. Fig. 3illustrates the qualitative shapes of the rate of heat releaseand the upper layer temperature computed with CFAST.The temporal link between the curves is evident. Bothcurves can be characterised by three distinctive points atthe times t1, t2, t3, where the slope of the curves is changing.From the beginning of the fire until t1 the rate of heatrelease rises quadratically and the upper layer temperatureincreases rapidly. At t1 the maximum rate of heat release isachieved and remains constant until t2. After t1 the upperlayer temperature increases moderately. As 70% of the fireload is consumed at t2, the rate of heat release drops offlinearly. Achieving its maximum at t2 hence the upper layertemperature declines. At t3 the complete fire load isconsumed and the rate of heat release decreases to 0.
[min]
rate
of h
eat r
elea
se [M
W]
70% of the fire load
is consumed
Upper layer temperature
Rate of heatrelease
t3
decay phase
orresponding upper layer temperature (principle).

ARTICLE IN PRESSJ. Zehfuss, D. Hosser / Fire Safety Journal 42 (2007) 115–126 119
At this time the upper layer temperature–time curve bendsand declines slower than before.
The times t1, t2, t3 can be determined by the considera-tion of the functional course of the rate of heat release [1].For the total description of the run of the upper layertemperature–time curve the associated temperatures T1, T2
and T3 have to be ascertained (Fig. 3). Being aware of thecharacteristic times and temperatures, the course of thetemperature can be described functionally as iBMBparametric fire curves. Thus, the iBMB parametric firecurves are a simplified description of the upper layertemperature–time curve of a natural fire. They can serve asa realistic thermal action for the structural fire designavoiding the application of sophisticated heat balancemodels.
For the derivation of the iBMB parametric fire curvesthe link between rate of heat release and the temperature–time curve is essential. Thus for a reference fire load densityof q00 ¼ 1300MJ/m2, which is taken as an upper value forresidential and office buildings, parametric functions forthe temperature–time curve were developed which considerthe ventilation conditions, thermal properties of theenclosure and geometry of the compartment. For fire loaddensities less than the maximum, the maximum tempera-ture is achieved accordingly earlier. The appropriate timecan be ascertained from the rate of heat release function(Fig. 7).
2.3.2. Ventilation-controlled fires
The availability of oxygen controls the energy released inthe compartment and, therefore, the resulting temperatures[13].
For the temperature development of ventilation-con-trolled fires, apart from the thermal properties of theenclosure, the opening factor O is predominant [7,14]. InFig. 4 the maximum upper layer temperature T2 at time t2(according to definition of Fig. 3) of ventilation-controlled
0
200
400
600
800
1000
1200
1400
20 25 30 35
1/O
tem
pera
ture
[°C
]
T2 = (0.004 b - 17) 1/O - 0.4 b +
Fig. 4. Maximum temperatures T2 of ventilation-controlled fires (q00 ¼ 1300MJ
properties of the enclosure.
fires for the reference fire load density of q00 ¼ 1300MJ/m2
calculated with CFAST [12] is plotted against the factor1=O for different thermal properties of the enclosure.A regression analysis for the upper layer temperatures
T1, T2 and T3 of ventilation-controlled fires provides thefollowing functions for the reference fire load density ofq00 ¼ 1300MJ/m2 [1]:
T1 ¼ �8:75� 1=O� 0:1 bþ 1175 �C; (11)
T2 ¼ ð0:004 b� 17Þ � 1=O� 0:4 bþ 2175�Cp1340�C,
(12)
T3 ¼ �5:0� 1=O� 0:16 bþ 1060 �C; (13)
with the opening factor
O ¼ Aw
ffiffiffiffiffihw
p=At m
1=2. (14)
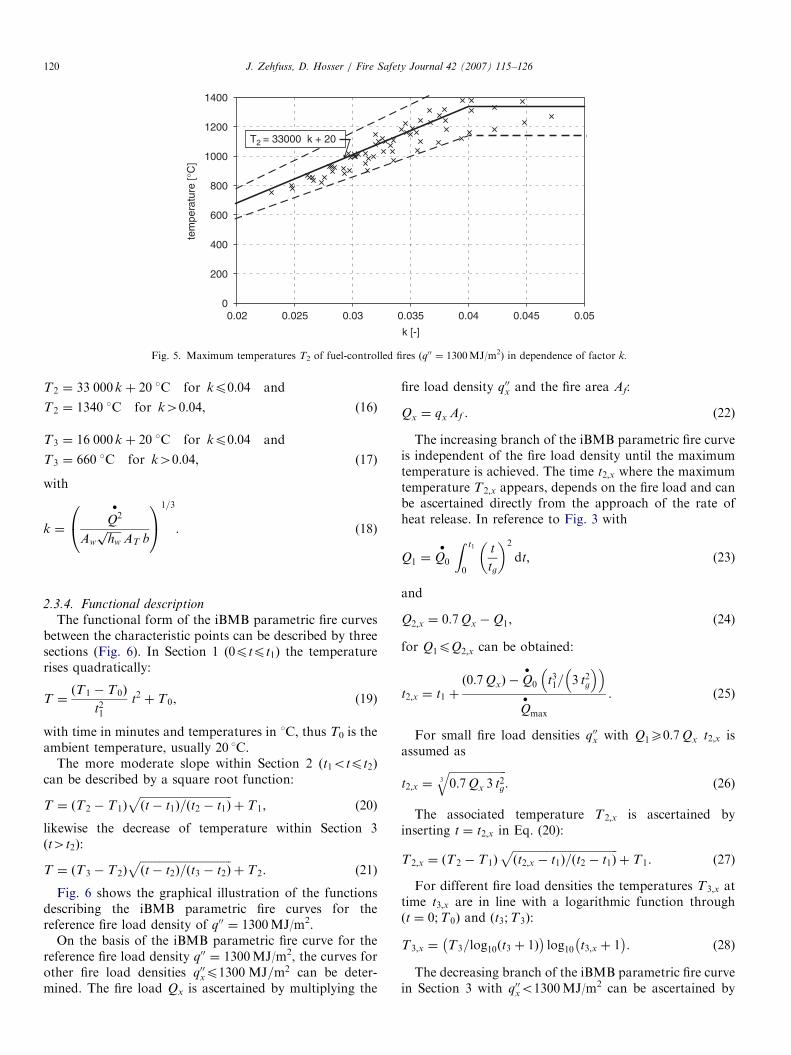
2.3.3. Fuel-controlled fires
For the temperature development of fuel-controlled fires,apart from the heat loss out of openings and through theboundaries, the heat released by the fire source is the mostimportant factor [15]. In Fig. 5 the maximum upper layertemperature T2 at time t2 (according to definition of Fig. 3)of fuel-controlled fires for the reference fire load density ofq00 ¼ 1300MJ/m2 calculated with CFAST [12] is plottedagainst the factor k (according to Eq. (18)). The linearcorrelation between k and the maximum temperature T2
for ko0.04 is indicated by the continuous line.Performing a regression analysis for the upper layer
temperatures T1, T2 and T3 of fuel-controlled fires thefollowing functions can be determined for the reference fireload density of q00 ¼ 1300MJ/m2 [1]:
T1 ¼ 24 000 k þ 20 �C for kp0:04 and
T1 ¼ 980 �C for k40:04, ð15Þ
40 45 50 55 60
[m-0.5]
b=1000
b=1500
b=2000
2175 <= 1340 °C
/m2) in dependence of the inverse opening factor 1=O for different thermal
ARTICLE IN PRESS
0
200
400
600
800
1000
1200
1400
0.02 0.025 0.03 0.035 0.04 0.045 0.05
k [-]
tem
pera
ture
[°C
]
T2 = 33000 k + 20
Fig. 5. Maximum temperatures T2 of fuel-controlled fires (q00 ¼ 1300MJ/m2) in dependence of factor k.
J. Zehfuss, D. Hosser / Fire Safety Journal 42 (2007) 115–126120
T2 ¼ 33 000 k þ 20 �C for kp0:04 and
T2 ¼ 1340 �C for k40:04, ð16Þ
T3 ¼ 16 000 k þ 20 �C for kp0:04 and
T3 ¼ 660 �C for k40:04, ð17Þ
with
k ¼Q2�
Aw
ffiffiffiffiffihw
pAT b
0@
1A
1=3
. (18)
2.3.4. Functional description
The functional form of the iBMB parametric fire curvesbetween the characteristic points can be described by threesections (Fig. 6). In Section 1 ð0ptpt1Þ the temperaturerises quadratically:
T ¼ðT1 � T0Þ
t21t2 þ T0, (19)
with time in minutes and temperatures in 1C, thus T0 is theambient temperature, usually 20 1C.
The more moderate slope within Section 2 ðt1otpt2Þ
can be described by a square root function:
T ¼ ðT2 � T1Þffiffiffiffiffiffiffiffiffiffiffiffiffiffiffiffiffiffiffiffiffiffiffiffiffiffiffiffiffiffiffiffiffiðt� t1Þ=ðt2 � t1Þ
pþ T1, (20)
likewise the decrease of temperature within Section 3ðt4t2Þ:
T ¼ ðT3 � T2Þffiffiffiffiffiffiffiffiffiffiffiffiffiffiffiffiffiffiffiffiffiffiffiffiffiffiffiffiffiffiffiffiffiðt� t2Þ=ðt3 � t2Þ
pþ T2. (21)
Fig. 6 shows the graphical illustration of the functionsdescribing the iBMB parametric fire curves for thereference fire load density of q00 ¼ 1300MJ/m2.
On the basis of the iBMB parametric fire curve for thereference fire load density q00 ¼ 1300MJ/m2, the curves forother fire load densities q00xp1300 MJ=m2 can be deter-mined. The fire load Qx is ascertained by multiplying the
fire load density q00x and the fire area Af:
Qx ¼ qx Af . (22)
The increasing branch of the iBMB parametric fire curveis independent of the fire load density until the maximumtemperature is achieved. The time t2;x where the maximumtemperature T2;x appears, depends on the fire load and canbe ascertained directly from the approach of the rate ofheat release. In reference to Fig. 3 with
Q1 ¼ Q0
�Z t1
0
t
tg
� �2
dt, (23)
and
Q2;x ¼ 0:7Qx �Q1, (24)
for Q1pQ2;x can be obtained:
t2;x ¼ t1 þð0:7QxÞ �Q
�
0 t31= 3 t2g
� �� �
Q�
max
. (25)
For small fire load densities q00x with Q1X0:7Qx t2;x isassumed as
t2;x ¼ffiffiffiffiffiffiffiffiffiffiffiffiffiffiffiffiffiffiffiffiffi0:7Qx 3 t2g
3
q. (26)
The associated temperature T2;x is ascertained byinserting t ¼ t2;x in Eq. (20):
T2;x ¼ ðT2 � T1Þffiffiffiffiffiffiffiffiffiffiffiffiffiffiffiffiffiffiffiffiffiffiffiffiffiffiffiffiffiffiffiffiffiffiffiffiffiffiðt2;x � t1Þ=ðt2 � t1Þ
pþ T1. (27)
For different fire load densities the temperatures T3;x attime t3;x are in line with a logarithmic function throughðt ¼ 0;T0Þ and ðt3;T3Þ:
T3;x ¼ T3=log10ðt3 þ 1Þ
log10 t3;x þ 1
. (28)
The decreasing branch of the iBMB parametric fire curvein Section 3 with q00xo1300MJ/m2 can be ascertained by

ARTICLE IN PRESS
time [min]
tem
pera
ture
[°C
]
T= (T1-T0)/t1² t² +T0
for t1 <= t
T = (T2-T1)((t-t1)/(t2-t1))1/2+T1
for t1 < t <= t2
section 1 section 2 section 3
(t2;T2)
(t3;T3)(t1;T1)
(t0;T0)
T = (T3-T2)((t-t2)/(t3-t2))1/2+T2
for t > t2
Fig. 6. Mathematical description of the iBMB parametric fire curves in 3 sections.
J. Zehfuss, D. Hosser / Fire Safety Journal 42 (2007) 115–126 121
substituting in Eq. (21):
T ¼ T3;x � T2;x
ffiffiffiffiffiffiffiffiffiffiffiffiffiffiffiffiffiffiffiffiffiffiffiffiffiffiffiffiffiffiffiffiffiffiffiffiffiffiffiffiffiðt� t2;xÞ=ðt3;x � t2;xÞ
pþ T2;x. (29)
2.3.5. Flashover
The critical rate of heat release for the incidence offlashover can be calculated according to the method ofThomas [9]. Thomas uses the energy balance of the upperlayer for the derivation of the critical rate of heat release
Q�
fo for flashover, which can be determined by
Q�
fo ¼ 0:0078AT þ 0:378Aw
ffiffiffiffiffihw
pMW. (30)
For the development of the iBMB parametric fire curvesthis expression is applied to estimate the time to flashover,when the rate of heat release reaches its maximum value:
t1;fo ¼
ffiffiffiffiffiffiffiffiffiffiffiffit2g Q�
fo
r. (31)
If the time t1;fo is less than the time t1, Eq. (30) has to betaken into account. In case of t1;foXt1, which can beexpected especially for small compartments, the rate ofheat release increases quickly to the maximum.
The fire load consumed until the time to flashover isdetermined as
Q1;fo ¼t31;fo
3 t2g. (32)
By inserting Q1;fo instead of Q1 and t1;fo instead of t1 thetotal development of the fire can be described [1].
2.3.6. Room cells
With the iBMB parametric fire curves presented here,successive fire spread in compartments which are sub-divided into so-called room cells can be presented in asimplified approach. In office buildings the internal walls
between the rooms (cells) are often light partitions whichhave a low fire rating and no fire classification. The cellwalls prevent unobstructed fast fire spread. Thus a growingfire successively spreads from one room cell to the next oneuntil the whole storey is involved in the fire.The structural fire design of buildings with cell construc-
tions leads to an overestimation of the fire action if thedelaying effect of the cell walls is not considered.The standard fire design (ISO 834), the design with theparametric temperature–time curves of [4], and the methodof equivalent time of fire exposure according to [4], annex Fassume an unhindered fire spread over the whole compart-ment. The simplified approach of the design fire presentedin this contribution allows the consideration of a successivespreading fire.For considering the fire spread from one cell to the
adjacent cell the failure criterion of the partition (e.g. EI-criteria of EN 13501-2) has to be known. In many cases acritical temperature can be determined and the failure timecan be determined by heat transfer simulations. Alterna-tively, the principle of equivalent time of fire duration canbe used to derive the failure criteria from the failure timeunder standard fire exposure.Taking into account successive fire spread, the rate of
heat release has to be adapted to the governing boundaryconditions. After the breakthrough from the cell of fireinitiation, the rate of heat release is calculated for theenlarged room with possibly varied fire load density, largeropenings and varied thermal properties of the enclosure.Depending on the construction of the cell walls, the firespreads to two, three or more cells. With the growing fire,the failure times of the cell walls decrease, thus after thesecond breakthrough of the cell a fully developed fire inthe whole compartment (storey) can be assumed (Figs. 7and 8).For the validation of this simplified approach a
comparative calculation with the CFD-model FDS [16]

ARTICLE IN PRESS
time [min]
tem
pera
ture
[°C
]
t3,x t3t2t1 t2,x
T3,x = (T3/log10(t3+1)) log10(t3,x+1)
q=1300 MJ/m2
qx < 1300 MJ/m2
T3,x
T1
T2
T2,x
T3
Fig. 7. Determination of the temperatures T2;x and T3;x.
time [min]
rate
of h
eat r
elea
se [M
W]
1. Breakthrough of cell 2. Breakthrough of cell
Qmax whole compartment (storey)
Qmax 2 resp. 3 cells
Qmax 1 cell
Fig. 8. Development of the rate of heat release in case of successive fire spread in a building containing a cell construction (qualitative).
J. Zehfuss, D. Hosser / Fire Safety Journal 42 (2007) 115–126122
was carried out where the development of the rate of heatrelease and the temperature for successive fire spread isinvestigated. For the cell of fire origin the rate of heatrelease is defined according to the approach given inSection 2.2.4. It is assumed that after 10min the criticaltemperature of the cell wall between cells 1 and 2 isachieved and the wall fails (Fig. 9).
In the adjacent cell the fire loads are modelled as objectswhose thermo-physical properties such as ignition tem-perature, density and heat of combustion are given. Theignition, the rate of burning and heat release of the objectsare simulated by the combustion model of [16]. In Fig. 10the rate of heat release according to the simplifiedapproach is compared to the rate of heat release resultingfrom the CFD-simulation. Both curves run nearly con-gruent apart from a peak at the breakthrough of the cellsafter 10min. This is the point where in the CFD-simulationthe released energy suddenly increases due to the rapidignition of the fire loads in cell 2.
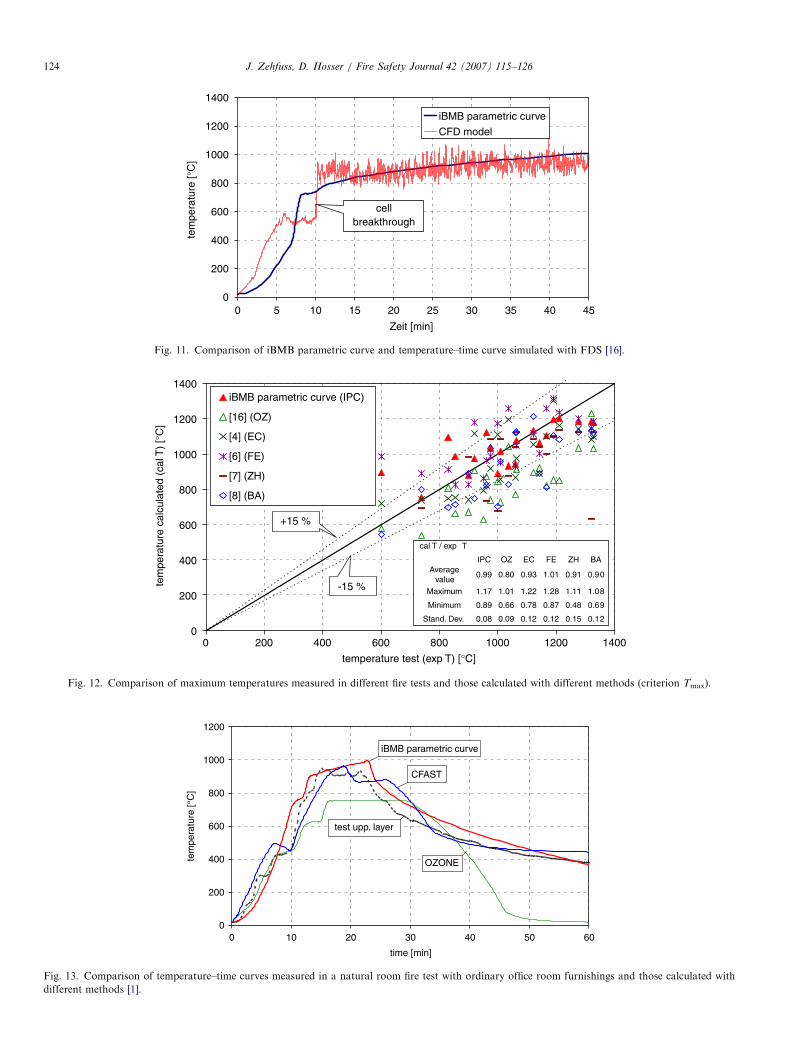
Fig. 11 depicts the iBMB parametric fire curve and thetemperature–time curve simulated with FDS which isdetermined by averaging the values of the thermocouplesin the upper half of the total room. It is clear that thetemperature–time curve bends due to the breakthrough ofthe cell and becomes consistent with the changed boundaryconditions of the fire compartment formed by the two cells.After the cell breakthrough the iBMB parametric fire curveand the temperature–time curve simulated with FDSdeviate only slightly.
2.3.7. Validation of the iBMB parametric fire curves
By a comprehensive validation it was shown that theiBMB parametric fire curves can realistically follow thetemperature development of natural fires. The validationwas carried out in three steps by means of
�
a wide range of comparative calculations with heatbalance models,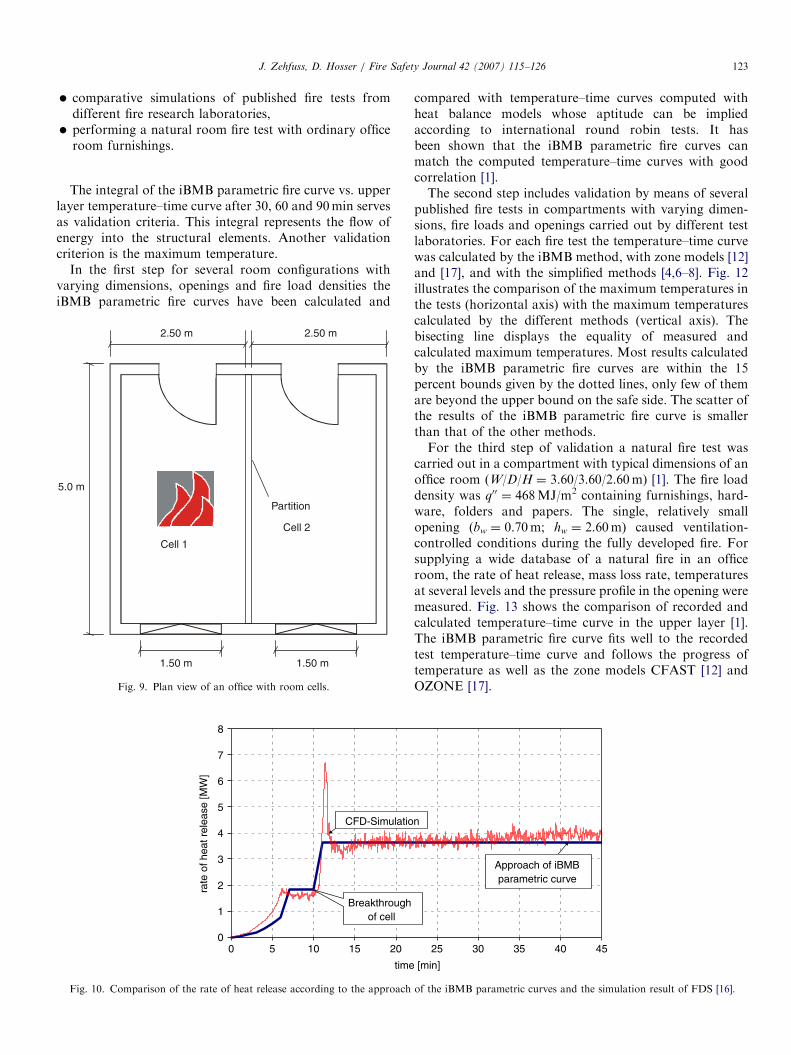
ARTICLE IN PRESSJ. Zehfuss, D. Hosser / Fire Safety Journal 42 (2007) 115–126 123
�
5.0
comparative simulations of published fire tests fromdifferent fire research laboratories,
� performing a natural room fire test with ordinary officeroom furnishings.
The integral of the iBMB parametric fire curve vs. upperlayer temperature–time curve after 30, 60 and 90min servesas validation criteria. This integral represents the flow ofenergy into the structural elements. Another validationcriterion is the maximum temperature.
In the first step for several room configurations withvarying dimensions, openings and fire load densities theiBMB parametric fire curves have been calculated and
0
1
2
3
4
5
6
7
8
0 10 15 20
time
rate
of h
eat r
elea
se [M
W]
Breakthroughof cell
CFD-Simulatio
5
Fig. 10. Comparison of the rate of heat release according to the approach
Partition
2.50 m 2.50 m
m
1.50 m 1.50 m
Cell 1
Cell 2
Fig. 9. Plan view of an office with room cells.
compared with temperature–time curves computed withheat balance models whose aptitude can be impliedaccording to international round robin tests. It hasbeen shown that the iBMB parametric fire curves canmatch the computed temperature–time curves with goodcorrelation [1].The second step includes validation by means of several
published fire tests in compartments with varying dimen-sions, fire loads and openings carried out by different testlaboratories. For each fire test the temperature–time curvewas calculated by the iBMB method, with zone models [12]and [17], and with the simplified methods [4,6–8]. Fig. 12illustrates the comparison of the maximum temperatures inthe tests (horizontal axis) with the maximum temperaturescalculated by the different methods (vertical axis). Thebisecting line displays the equality of measured andcalculated maximum temperatures. Most results calculatedby the iBMB parametric fire curves are within the 15percent bounds given by the dotted lines, only few of themare beyond the upper bound on the safe side. The scatter ofthe results of the iBMB parametric fire curve is smallerthan that of the other methods.For the third step of validation a natural fire test was
carried out in a compartment with typical dimensions of anoffice room (W/D/H ¼ 3.60/3.60/2.60m) [1]. The fire loaddensity was q00 ¼ 468MJ/m2 containing furnishings, hard-ware, folders and papers. The single, relatively smallopening (bw ¼ 0.70m; hw ¼ 2.60m) caused ventilation-controlled conditions during the fully developed fire. Forsupplying a wide database of a natural fire in an officeroom, the rate of heat release, mass loss rate, temperaturesat several levels and the pressure profile in the opening weremeasured. Fig. 13 shows the comparison of recorded andcalculated temperature–time curve in the upper layer [1].The iBMB parametric fire curve fits well to the recordedtest temperature–time curve and follows the progress oftemperature as well as the zone models CFAST [12] andOZONE [17].
25 30 35 40 45
[min]
Approach of iBMBparametric curve
n
of the iBMB parametric curves and the simulation result of FDS [16].
ARTICLE IN PRESS
0
200
400
600
800
1000
1200
1400
0 10 15 20 25 30 35 40 45
Zeit [min]
tem
pera
ture
[°C
]
iBMB parametric curve
CFD model
cellbreakthrough
5
Fig. 11. Comparison of iBMB parametric curve and temperature–time curve simulated with FDS [16].
0
200
400
600
800
1000
1200
1400
0 200 400 600 800 1000 1200 1400
temperature test (exp T) [°C]
tem
pera
ture
cal
cula
ted
(cal
T)
[°C
]
iBMB parametric curve (IPC)
[16] (OZ)
[4] (EC)
[6] (FE)
[7] (ZH)
[8] (BA)
-15 %
+15 %
Fig. 12. Comparison of maximum temperatures measured in different fire tests and those calculated with different methods (criterion Tmax).
0
200
400
600
800
1000
1200
0 10 20 30 40 50 60
time [min]
tem
pera
ture
[°C
]
iBMB parametric curve
test upp. layer
CFAST
OZONE
Fig. 13. Comparison of temperature–time curves measured in a natural room fire test with ordinary office room furnishings and those calculated with
different methods [1].
J. Zehfuss, D. Hosser / Fire Safety Journal 42 (2007) 115–126124

ARTICLE IN PRESSJ. Zehfuss, D. Hosser / Fire Safety Journal 42 (2007) 115–126 125
3. Example office fire
By means of an example the application of the iBMBparametric fire curve is demonstrated.
Office fire compartment (area Af ¼ 16m2, heightH ¼ 3m, area of openings Aw ¼ 8m2, averaged height ofopenings hw ¼ 2.50m):
0
200
400
600
800
1000
1200
0
tem
pera
ture
[°C
]
Fig. 14. Comparison of iBMB parametric fire
curve.
ventilation factor
Awffiffiffiffiffihw
p¼ 12.65m3/2
opening factor
O ¼ 0.158m1/2fire load density (resp. [4])
q00 ¼ 511MJ/m2total fire load
Q511 ¼ 8176MJ averaged thermal property ofenclosureb ¼ 1500 J/(m2s0.5K)
total area of enclosingcomponents (incl. openings)
At ¼ 80.0m2
total area of enclosingcomponents (without openings)
AT ¼ 72.0m2
rate of heat release
Q�
max ¼MINðQ�
max;v;Q�
max;f Þ
¼MINð1:21Aw
ffiffiffiffiffihw
p; 0:25Af Þ
¼MINð15:31; 4:0Þ,
Q�
max ¼ Q�
max;f ¼ 4:0 MW) fuel�controlled fire;
Q ¼ q Af ¼ 1300� 16:0 ¼ 20; 800 MJ;
t1 ¼ 600 s ¼ 10 min; Q1 ¼ 800 MJ,
Q2 ¼ 13 760 MJ; t2 ¼ 4040 s � 67 min,
Q3 ¼ 6240 MJ; t3 ¼ 7160 s � 119 min,
Q2;511 ¼ 4923 MJ; t2;511 ¼ 1831 s � 31 min,
Q3;511 ¼ 2453 MJ; t3;511 ¼ 3057 s � 51 min,
40302010
tim
I
iBMB parametrifire curve
curve and upper layer temperat
k ¼ ðQ� 2
max=ðAw
ffiffiffiffiffihw
p� AT � bÞÞ
1=3¼ 0:0227,
T1;f ¼ 24 000 k þ 20 ¼ 565 �C,
T2;f ¼ 33 000 k þ 20p1340 �C) T2 ¼ 769 �C;
T3;f ¼ 16 000 k þ 20 ¼ 383 �C;
T2;511 ¼ 689 �C;
T3;511 ¼ 316 �C:
Fig. 14 illustrates the iBMB parametric fire curvecompared to the upper layer temperature simulated withthe fire model CFAST [12] and to ISO 834 temperature–time curve. iBMB parametric fire curve and CFAST upperlayer temperature–time curve yield a good correlation.For the actual boundary conditions the ISO 834
temperature–time curve overestimates the temperatures ofthe natural fire in the office and leads to an inefficientdesign of components.
4. Conclusion and outlook
The structural fire design for residential and officebuildings can be optimised by considering the realisticdevelopment of the natural fire. Usually the structures aredesigned according to ISO 834 standard fire which can leadto inadequate fire protection measures. For a performance-based structural fire design the fire scenario itself needsdetailed discussion and a more realistic description. TheiBMB parametric fire curves presented in this paper includethe growing and the decay phase of a fire. Contrary toother simplified natural fire models as e.g. the parametrictemperature–time curves of Eurocode 1-1-2 the iBMBparametric fire curves distinguishes two key aspects. Theycan consider the actual ventilation conditions and they are
80706050 90
e [min]
SO 834
c
CFAST
ure–time curve (CFAST) of an office fire with ISO 834 temperature–time

ARTICLE IN PRESSJ. Zehfuss, D. Hosser / Fire Safety Journal 42 (2007) 115–126126
based on a realistic design fire which entails a temporallycongruence with the rate of heat release. Due to the link tothe rate of heat release with iBMB parametric fire curvesthe modification of boundary conditions in a fire caused bye.g. flashover, failure of compartmentation or fire fightingcan be considered.
The iBMB parametric fire curves can serve as a basis foradvanced calculation methods (according to the Euro-codes) for structural fire design. Whilst the simplifiednatural fire model can be applied to all types of structures,the most benefit is provided for the design of steelstructures. Apart from the realistic fire development theconsideration of load redistributions in the overall struc-ture also provides advantages in fire safety design [18]. Asshown in [1] the consideration of both: realistic firedevelopment and the overall structural behaviour can leadto an efficient and aesthetical construction with unpro-tected steel components.
References
[1] ZehfuX J. Bemessung von Tragsystemen mehrgeschossiger Gebaude
in Stahlbauweise fur realistische Brandbeanspruchung. Dissertation
Braunschweig University of Technology, 2004.
[2] Hosser D, ZehfuX J. Behaviour of structural systems exposed to
natural fires considering the failure of substructures and repair. Third
international workshop structures in fire, Ottawa, May 2004.
[3] Magnusson SE, et al. Temperature–time curves of complete process of fire
development. Bulletin 16. Lund, Sweden: Institute of Technology; 1970.
[4] prEN 1991-1-2; Eurocode 1 part 1-2. Actions on structures: general
actions—actions on structures exposed to fire. Second draft, March 2001.
[5] Schleich JB, et al. Natural fire safety concept full scale tests,
implementation in the eurocodes and development of an userfriendly
design tool. Technical report no. 6, period from 01.01.2000–
30.06.2000. CEC agreement 7210-PA/PB/PC/PD/PE/PF/PR-060.
Esch/Alzette, 2000.
[6] Feasey R, Buchanan B. Post-flashover fires for structural design. Fire
Saf J 2002;37:83–105.
[7] Zhongcheng M, Makelainen P. Parametric temperature–time curves
of medium compartment fires for structural design. Fire Saf J
2000;34:361–75.
[8] Barnett CR. BFD curve: a new empirical model for fire compartment
temperatures. Fire Saf J 2002;37:437–63.
[9] Society of Fire Protection Engineers, National Fire Protection
Association, editor. The SFPE handbook of fire protection engineer-
ing. Quincy, MA, USA, 1990.
[10] DIN 18230 Teil 3 (German Standard). Baulicher Brandschutz im
Industriebau; Rechenwerte. Berlin: Beuth Verlag; 2002.
[11] Schleich JB, et al. Competitive steel buildings through natural
fire safety concept: draft final report: CEC agreement 7210-SA/125,
1999.
[12] Portier RW, Reneke PA, Jones WW, Peacock RD. A user’s guide for
CFAST, version 2.01. NISTR4985, National Institute of Standards
and Technology. Gaithersburg, MD, USA: Building and Fire
Research Laboratory; 1994.
[13] Bryl S, et al. Simulation von Modellbranden in Raumen. Alternative
Methode zur Beurteilung von Brandschutzmassnahmen, Schweizer
Ingenieur und Architekt, 1987. p. 391–402.
[14] Law M. A basis for the design of fire protection of building
structures. Struct Eng 1983;61:25–33.
[15] McCaffrey BJ, Quintierre JG, Harkleroad MF. Estimating room fire
temperatures and the likelihood of flashover using fire test data
correlations. Fire Technol 1981;17:98–119.
[16] McGrattan KB, et al. Fire dynamics simulator (Version 3), user’s
guide: National Institute of Standards and Technology. US Depart-
ment of Commerce; 2002.
[17] Cadorin JF, Franssen JM, Pintea D. The design fire tool OZONE, V
2.0—theoretical description and validation on experimental fire tests,
1st draft, 11.06.2001. Liege, University, 2001.
[18] Bailey C, et al. The behaviour of multi-storey steel framed buildings
in fire, a European joint research programme. Swinden: Technology
Centre; 1998.