a parametric study for euler-granular model in …
TRANSCRIPT

© 2018 WIT Press, www.witpress.comISSN: 2046-0546 (paper format), ISSN: 2046-0554 (online), http://www.witpress.com/journalsDOI: 10.2495/CMEM-V6-N1-46-58
W. K. Hiromi Ariyaratne, et al., Int. J. Comp. Meth. and Exp. Meas., Vol. 6, No. 1 (2018) 46–58
A PARAMETRIC STUDY FOR EULER-GRANULAR MODEL IN DILUTE PHASE VERTICAL
PNEUMATIC CONVEYING
W.K. HIROMI ARIYARATNE, PRASANNA WELAHETTIGE & MORTEN C. MELAAENFaculty of Technology, Natural Sciences and Maritime Sciences,
University College of Southeast Norway, Norway.
ABSTRACTThe Euler-Granular approach was used to predict pneumatic conveying characteristics of vertically upward dilute phase flow. Three-dimensional computational fluid dynamics simulations were carried out for 8 m long and 30.5 mm diameter circular pipe. The density of conveyed materials was 1020 kgm-3. Simulations for different particle diameters: 200 µm, 500 µm and 3 mm were performed. The air velocities ranged from 7 to 16 ms-1 and solid to air mass flow ratios ranged from 1.2 to 3.6. The main objective of this study was to analyse the sensitivity of specularity coefficient in Johnson and Jackson particle-wall boundary conditions on conveying characteristics. It was found that there is a significant sensitivity of certain ranges of specularity coefficients on pressure drop, air and particle velocities and solid distribution in pipe cross section. Among the tested range of the specularity coefficient val-ues, some values are recommended for different particle sizes by comparing the predicted results with experimental data from existing literature. Moreover, it was also found that the coefficient of restitution for particle-wall collisions which counts the momentum loss by the walls in normal direction has less sensitivity on the results compared to that of specularity coefficient which counts the momentum loss by the walls in tangential direction.Keywords: air velocity, Computational Fluid Dynamics, particle velocity, pressure drop, solid distribution, specularity coefficient
1 INTRODUCTIONPneumatic conveying is a material transportation process, in which materials are moved along distances within a pipe system by means of compressed air stream [1]. It is used to transport a wide range of materials in many industrial applications all over the world; as example, chemical process industry, pharmaceutical industry, mining industry, agricultural industry, food processing industry, etc. A pneumatic conveying system may consist of verti-cal, horizontal and inclined pipe sections. The orientation of the pipe makes a considerable effect to the flow patterns due to effect of the gravity force.
Understanding of pneumatic conveying characteristics is hard due to complex interactions between gas-particle, particle-particle and particle-wall. Computational Fluid Dynamics (CFD) modelling is an advanced tool to study the various aspects of pneumatic conveying characteristics [2]. Different model approaches are available for the prediction of gas–solids multi-phase flow systems and the Euler-Granular method is one of those model approaches [3]. This model is an Eulerian-Eulerian approach where the both gas and solid phases are treated as continua. The approach has a main advantage over Eulerian-Lagrangian approach with respect to computational cost. However, for accurate predictions of conveying charac-teristics, such as pressure drop, air and particle velocities, solid distribution pattern, the calibration of model coefficients is an important requirement. Typically, experimental results are used for the calibration of model parameters.
Sensitivity analysis studies have been previously carried out for vertical gas–solid mul-tiphase flow systems, such as vertical pneumatic conveying pipes and fluidized bed systems.

W. K. Hiromi Ariyaratne, et al., Int. J. Comp. Meth. and Exp. Meas., Vol. 6, No. 1 (2018) 47
The sensitivity of important numerical parameters in Euler-Euler model such as the coefficient of restitution for particle collisions (ess), the coefficient of restitution for particle-wall collisions (esw) and the specularity coefficient (φ) have been in interest. Patro and Dash [4] have tested some of those model parameters for vertical pneumatic conveying and the selected values for the study were φ = 0.1 and ess = esw = 0.94. Azizi et al. [5] have used φ = 0.008-0.04, ess = 0.9 and esw = 0.2-0.6 for a similar type of application. The sensitivity of the specularity coefficient for a circulating fluidized bed riser in a dense phase has been studied by Zhao et al. [6]. Loha et al. [7] have analyzed the effect of specularity coefficient in the range of 0–1 for a bubbling fluidized bed. Yet in another study, the difference between the specularity coefficient of 1 and no-slip solid phase boundary conditions has been investigated for a gas–solid fluidized bed [8]. According to those previous studies, the specularity coefficient gives significant effects for particular results depending on the application. The specularity coefficient is the parameter that determines how much of tangential energy is transferred to the wall during particle-wall colli-sions. According to Johnson and Jackson [9], this depends on large-scale roughness of the wall surface. The specularity coefficient cannot be determined experimentally and typically it is found by adjusting this parameter to fit relevant experimental data [4].
In the present study, the sensitivity of wall boundary conditions of particle-wall collisions on pneumatic conveying characteristics of dilute phase vertical upward flow is investigated. The effects of specularity coefficient on pressure drop, air velocity, particle velocity, and solid distribution pattern for different particle sizes and solid loading ratios are studied. Moreover, the sensitivity of the particle-wall restitution coefficient is also discussed. The commercial CFD software ANSYS Fluent, version 16.2, was used for modelling and simulation. Steady state three-dimensional simulations were carried out using Euler-Euler approach for granular flows (Euler-Granular model). The simulation results were validated using experimental results from Tsuji and Morikawa [10].
2 NUMERICAL MODELSBoth gas and solid phases are considered as continuous phases in Euler-Granular approach. Few of the governing equations are presented here and a detailed model description can be found in elsewhere [11].
The volume fraction representation, steady state continuity equation and momentum equation for the gas phase are presented by eqns (1)–(3). The equations for the particle phase can be written in a similar manner.
α αg s+ =1. (1)
∇⋅ =( )α ρg g gv
0. (2)
∇⋅ = − ∇ +∇ ⋅ + + −( ) − −( ) ,α ρ α τ α ρg g g g g g g g sg s g lift s tv v P g K v v F F
dd s, . (3)
The k-ε dispersed turbulence model is used to model turbulent viscosities. The Gidaspow model is used to calculate the gas-solid exchange coefficient, K sg.
3 COMPUTATIONAL DETAILSTsuji and Morikawa have experimentally measured the gas and particle velocities in a vertical section of a pneumatic conveying rig using Laser Doppler velocimetry [10]. They have tested spherical plastic materials which are having diameters in the range of 200–3000 µm and also cylindrical particles. In the present simulations, the dimensions of the vertical pipe as well as

48 W. K. Hiromi Ariyaratne, et al., Int. J. Comp. Meth. and Exp. Meas., Vol. 6, No. 1 (2018)
the operating conditions and material properties are similar to those of experimental set up from Tsuji and Morikawa.
The following sections present the details about the geometry and mesh, boundary conditions and material properties used in the present simulations. Table 1 gives a brief summary of the information.
3.1 The geometry and the mesh
ANSYS DesignModeler 16.2 and ANSYS Meshing 16.2 were used for the geometry drawing and mesh generation, respectively. The diameter of the vertical pipe is 30.5 mm and the length is 8 m. Figure 1 shows the geometry and the mesh. The total number of elements in the mesh is 46080 and the maximum skewness is less than 0.39 in the mesh. The computational time is around 4 hrs for a run when 2.4 GHz Intel ® Xeon ® processor and 32 GB installed memory are used.
3.2 Boundary conditions and material properties
The air–solid mixture enters bottom of the pipe and leaving from top of the pipe. There are two types of boundary conditions, which are for the gas phase and for the solid phase. Air and the solid particles enter to the pipe with similar and uniform velocities. The real velocities of air and solids and the solid volume fraction at the inlet defined for each case are shown in Table 2. The turbulence intensity of the air at the inlet is 10%. Solid phase granular
Table 1: Simulation data.
Description Value
Pipe diameter (m) 0.0305Pipe length (m) 8Particle diameter (mm) 0.2, 0.5, 3Particle density (kgm-3) 1020Air density, (kgm-3) 1.225Air viscosity (kgm-1s-1) 1.7894×10⁻⁵
Figure 1: (a) The geometry (b) The mesh

W. K. Hiromi Ariyaratne, et al., Int. J. Comp. Meth. and Exp. Meas., Vol. 6, No. 1 (2018) 49
Table 2: Details of simulated cases.
Case ds ×103 (mm)
v g at inlet (ms-1)
v s at inlet (ms-1) m αs at inlet Re φ esw
Case -1.1 0.2 11.03 11.03 1.3 0.00156 2.3 × 10⁴ 0.000010 0.95Case -1.2 0.2 11.03 11.03 1.3 0.00156 2.3 × 10⁴ 0.000100 0.95Case -1.3 0.2 11.03 11.03 1.3 0.00156 2.3 × 10⁴ 0.001000 0.95Case -1.4 0.2 11.03 11.03 1.3 0.00156 2.3 × 10⁴ 0.010000 0.95Case -2.1 0.5 10.58 10.58 3.4 0.00407 2.2 × 10⁴ 0.000100 0.95Case -2.2 0.5 10.58 10.58 3.4 0.00407 2.2 × 10⁴ 0.000200 0.95Case -2.3 0.5 10.58 10.58 3.4 0.00407 2.2 × 10⁴ 0.000300 0.95Case -2.4 0.5 10.58 10.58 3.4 0.00407 2.2 × 10⁴ 0.000400 0.95Case -2.5 0.5 10.58 10.58 3.4 0.00407 2.2 × 10⁴ 0.000500 0.95Case -2.6 0.5 10.58 10.58 3.4 0.00407 2.2 × 10⁴ 0.000600 0.95Case -2.7 0.5 10.58 10.58 3.4 0.00407 2.2 × 10⁴ 0.000700 0.95Case -2.8 0.5 10.58 10.58 3.4 0.00407 2.2 × 10⁴ 0.000800 0.95Case -2.9 0.5 10.58 10.58 3.4 0.00407 2.2 × 10⁴ 0.000900 0.95Case -2.10 0.5 10.58 10.58 3.4 0.00407 2.2 × 10⁴ 0.001000 0.95Case -2.11 0.5 10.58 10.58 3.4 0.00407 2.2 × 10⁴ 0.005000 0.95Case -2.12 0.5 10.58 10.58 3.4 0.00407 2.2 × 10⁴ 0.010000 0.95Case -2.13 0.5 10.58 10.58 3.4 0.00407 2.2 × 10⁴ 0.050000 0.95Case -3.1 0.5 10.55 10.55 1.3 0.00156 2.2 × 10⁴ 0.000010 0.95Case -3.2 0.5 10.55 10.55 1.3 0.00156 2.2 × 10⁴ 0.000200 0.95Case -3.3 0.5 10.55 10.55 1.3 0.00156 2.2 × 10⁴ 0.000300 0.95Case -3.4 0.5 10.55 10.55 1.3 0.00156 2.2 × 10⁴ 0.000400 0.95Case -3.5 0.5 10.55 10.55 1.3 0.00156 2.2 × 10⁴ 0.000500 0.95Case -3.6 0.5 10.55 10.55 1.3 0.00156 2.2 × 10⁴ 0.000600 0.95Case -3.7 0.5 10.55 10.55 1.3 0.00156 2.2 × 10⁴ 0.000700 0.95Case -3.8 0.5 10.55 10.55 1.3 0.00156 2.2 × 10⁴ 0.000800 0.95Case -3.9 0.5 10.55 10.55 1.3 0.00156 2.2 × 10⁴ 0.000900 0.95Case -3.10 0.5 10.55 10.55 1.3 0.00156 2.2 × 10⁴ 0.001000 0.95Case -3.11 0.5 10.55 10.55 1.3 0.00156 2.2 × 10⁴ 0.002000 0.95Case -3.12 0.5 10.55 10.55 1.3 0.00156 2.2 × 10⁴ 0.010000 0.95Case -3.13 0.5 10.55 10.55 1.3 0.00156 2.2 × 10⁴ 0.050000 0.95Case -4.1 3.0 16.00 16.00 1.2 0.00144 3.1 × 10⁴ 0.000100 0.95Case -4.2 3.0 16.00 16.00 1.2 0.00144 3.1 × 10⁴ 0.001000 0.95Case -4.3 3.0 16.00 16.00 1.2 0.00144 3.1 × 10⁴ 0.010000 0.95Case -4.4 3.0 16.00 16.00 1.2 0.00144 3.1 × 10⁴ 0.100000 0.95Case -5.1 0.5 10.57 10.57 2.6 0.00311 2.2 × 10⁴ 0.000010 0.95Case -5.2 0.5 10.57 10.57 2.6 0.00311 2.2 × 10⁴ 0.000100 0.95Case -5.3 0.5 10.57 10.57 2.6 0.00311 2.2 × 10⁴ 0.001000 0.95Case -5.4 0.5 10.57 10.57 2.6 0.00311 2.2 × 10⁴ 0.010000 0.95Case -5.5 0.5 10.57 10.57 2.6 0.00311 2.2 × 10⁴ 0.100000 0.95
(Continued)

50 W. K. Hiromi Ariyaratne, et al., Int. J. Comp. Meth. and Exp. Meas., Vol. 6, No. 1 (2018)
temperature at the inlet is calculated according to the formula mentioned by Patro and Dash [4] and it is in the range of values between 0.2 and 1.0 for all cases. The outlet gauge pressure is considered as zero. The pipe wall is considered as hydrodynamically smooth and no-slip for the gas phase. Johnson and Jackson [9] wall boundary condition is used for the particle phase (eqn (4)).
q g u u e gss
ss ss s sl sl
s
ssw s= ⋅ − −( )
πϕ
α
α
ρ θπ α
α
ρ
63
43 10
20
,max,
,max,
sss sθ3 2/ . (4)
The conveying medium is air. The particles are spherical polystyrene and mono-sized for each case. The properties of air and particles are mentioned in Table 1.
4 SIMULATION CASE DETAILSTable 2 shows the cases simulated in the present study. As mentioned above, the cases are in accordance with experimental cases carried out by Tsuji and Morikawa [10]. The real air and particle velocities at the inlet are in the range of 7–16 ms-1 and the corresponding Reynolds numbers are in the range of 1.6 × 10⁴ – 3.1 × 10⁴. The solid loading ratios are in the range of 1.2–3.6 and the corresponding solid volume fractions at the inlet vary in between 0.00156–0.00430. The sensitivity of specularity coefficient is tested in the range from 0.000001 to 0.100000. As reference value, 0.95 is used for the coefficient of restitution for particle-wall collisions; however the sensitivity is studied for 0.50–0.95 range. Coefficient of restitution for particle collisions used in the all simulation cases is 0.9.
5 RESULTS AND DISCUSSIONFirst, the sensitivity of specularity coefficient on pressure drop, air and particle velocity pro-files and solid flow pattern is analysed for different particle sizes and for different solid loading ratios. Next, the effect of the coefficient of restitution for particle-wall collision is discussed for 500 µm particles. The pressure profiles from bottom of the pipe to the top of the pipe along the pipe axis are shown in Figs. 2(a)–3(b) and these do not include the hydrostatic
Table 2: (Continued)
Case ds ×103 (mm)
v g at inlet (ms-1)
v s at inlet (ms-1) m αs at inlet Re φ esw
Case -6.1 0.5 7.89 7.89 3.6 0.00430 1.6 × 10⁴ 0.000001 0.95Case -6.2 0.5 7.89 7.89 3.6 0.00430 1.6 × 10⁴ 0.000010 0.95Case -6.3 0.5 7.89 7.89 3.6 0.00430 1.6 × 10⁴ 0.000100 0.95Case -6.4 0.5 7.89 7.89 3.6 0.00430 1.6 × 10⁴ 0.001000 0.95Case -6.5 0.5 7.89 7.89 3.6 0.00430 1.6 × 10⁴ 0.010000 0.95Case -6.6 0.5 7.89 7.89 3.6 0.00430 1.6 × 10⁴ 0.100000 0.95Case -7.1 0.5 7.89 7.89 3.6 0.00430 1.6 × 10⁴ 0.000100 0.50Case -7.2 0.5 7.89 7.89 3.6 0.00430 1.6 × 10⁴ 0.000100 0.60Case -7.3 0.5 7.89 7.89 3.6 0.00430 1.6 × 10⁴ 0.000100 0.70Case -7.4 0.5 7.89 7.89 3.6 0.00430 1.6 × 10⁴ 0.000100 0.80Case -7.5 0.5 7.89 7.89 3.6 0.00430 1.6 × 10⁴ 0.000100 0.95
W. K. Hiromi Ariyaratne, et al., Int. J. Comp. Meth. and Exp. Meas., Vol. 6, No. 1 (2018) 51
pressure. The mean air and particle velocity profiles and the solid volume fraction profiles (Fig. 4–Fig. 7(b)) are taken along a diameter of a pipe cross section at 7.5 m height from the bottom of the pipe which ensures the fully-developed profiles. Some of the profiles were compared with experimental results from Tsuji and Morikawa [10].
5.1 Sensitivity of specularity coefficient (φ)
The force on the wall boundary from particles is the sum of the collisional and frictional contributions. Frictional contributions are important for dense phase flows and considered by applying Coulomb’s law of friction. However, the collisional contribution is rather important in dilute phase flows as in the present study. Johnson and Jackson [9] solid phase partial-slip wall boundary condition is adopted to consider the collisional interactions between particles and wall here. According to that model, the rate of momentum transfer to the unit area of the wall due to particle-wall collisions depend on collision frequency of each particle, the num-ber of particles adjacent to unit area of the surface and the average tangential momentum transferred per collision. The latter is a function of specularity coefficient φ, which describes the level of the large-scale roughness of the wall surface. The increase of specularity coeffi-cient indicates increase of wall roughness. It ranges from 0 for perfect specular collisions to 1 for perfectly diffuse collisions [8]. These are corresponding to free-slip and no-slip bound-ary conditions; however, Zhong et al. [8] recommends not to use φ=1 to describe no-slip condition.
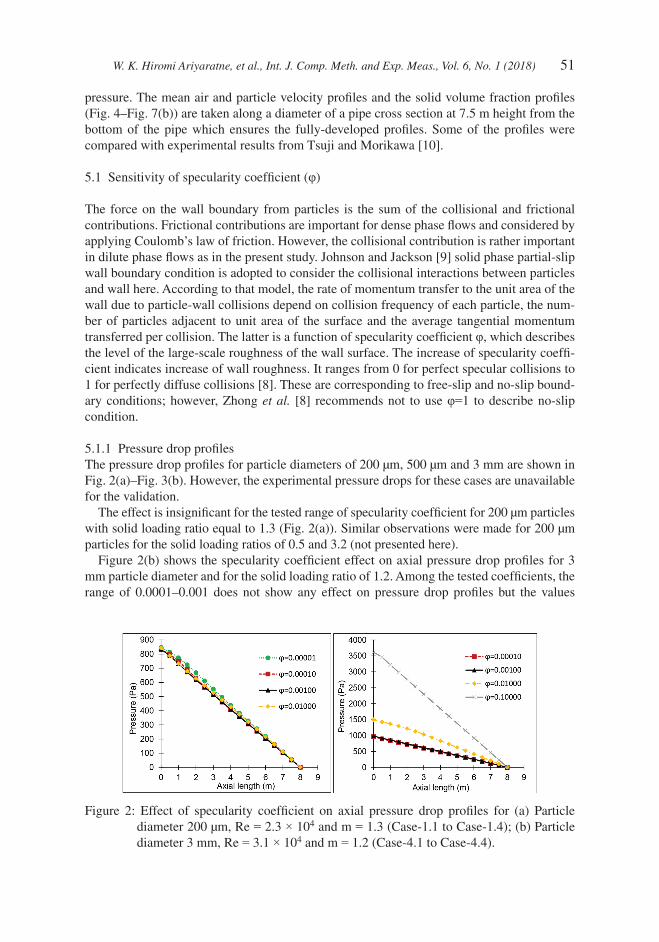
5.1.1 Pressure drop profilesThe pressure drop profiles for particle diameters of 200 µm, 500 µm and 3 mm are shown in Fig. 2(a)–Fig. 3(b). However, the experimental pressure drops for these cases are unavailable for the validation.
The effect is insignificant for the tested range of specularity coefficient for 200 µm particles with solid loading ratio equal to 1.3 (Fig. 2(a)). Similar observations were made for 200 µm particles for the solid loading ratios of 0.5 and 3.2 (not presented here).
Figure 2(b) shows the specularity coefficient effect on axial pressure drop profiles for 3 mm particle diameter and for the solid loading ratio of 1.2. Among the tested coefficients, the range of 0.0001–0.001 does not show any effect on pressure drop profiles but the values
Figure 2: Effect of specularity coefficient on axial pressure drop profiles for (a) Particle diameter 200 µm, Re = 2.3 × 10⁴ and m = 1.3 (Case-1.1 to Case-1.4); (b) Particle diameter 3 mm, Re = 3.1 × 10⁴ and m = 1.2 (Case-4.1 to Case-4.4).

52 W. K. Hiromi Ariyaratne, et al., Int. J. Comp. Meth. and Exp. Meas., Vol. 6, No. 1 (2018)
above the range show significant impact on pressure drop profiles. When increasing the spec-ularity coefficient from 0.001 to 0.01, the pressure drop increases by 60 Pa and 500 Pa respectively for the particle diameters 500 µm (Fig. 3(b)) and 3 mm (Fig. 2(b)).
Figures 3(a) and 3(b) show the axial pressure variation for different solid loading ratios; 3.4 and 1.3, respectively for 500 µm diameter particles. For a certain specularity coefficient, the pressure drop is increased when the solid loading ratio is increased. When the solid load-ing ratio is increased by increasing the solid mass flow rate, the work that should be done by unit mass of air in order to carry the particles ahead is increased. Similarly, the higher solid mass flow rate increases the particle number density in the system, which in turn increases the collisions between particle–particle and particle–wall [4]. These are the reasons for increas-ing pressure drop with increasing solid mass flow rate (i.e. solid loading ratio). Moreover, it can be observed that there is no significant change in axial pressure drop profiles in the range of 0.00001 < φ < 0.002 (Fig. 3(b)). However, when the specularity coefficient is increased from 0.01 to 0.05, the pressure drops have been increased by around 300 Pa and 200 Pa for 3.4 and 1.3 solid loading ratios, respectively.
In general, the impact of particle size on the pressure drop depends on many factors. Patro and Dash [4] have observed that the pressure drop increases in the range of particle diameters 35–50 µm but then decreases with the increase of particle diameters up to 200 µm for a cer-tain operating conditions. When comparing Fig. 3(b) and Fig. 2(b), it can be observed that the pressure drop is higher in Fig. 2(b) compared to Fig. 3(b) for a certain specularity coefficient, despite of that the solids mass loading ratio is little less for the predictions in Fig. 2(b) (m=1.2) compared to Fig. 3(b) (m=1.3). One reason for the higher pressure drop predictions is high air velocities used for the predictions in Fig. 2(b) (16.00 ms-1) compared to Fig. 3(b) (10.55 ms-1). The other reason is the particle size effect and this can be either positive or negative depending on dominant factors. When the particle diameter is large, the particles have low tendency to follow the air stream compared to small particles resulting high relative velocity between the phases. This increases the drag and hence the pressure drop. Moreover, accord-ing to eqn (5) [9], the average tangential momentum transfer to the wall per collision (M T ) might be high for the large particles since it depends on power three of the particle diameter resulting increased pressure drop. However, this momentum transfer per collision also depends on the particle slip velocity parallel to the wall that should be considered when inter-preting the effect of equation so that the resultant effect might be different. In the same time,
Figure 3: Effect of specularity coefficient on axial pressure drop profiles for (a) Particle diameter 500 µm, Re = 2.2 × 10⁴ and m = 3.4 (Case-2.1 to Case-2.13); (b) Particle diameter 500 µm, Re = 2.2 × 10⁴ and m = 1.3 (Case-3.1 to Case-3.13).

W. K. Hiromi Ariyaratne, et al., Int. J. Comp. Meth. and Exp. Meas., Vol. 6, No. 1 (2018) 53
the large particles reduce the particle number density inside the system for a constant solid volume fraction which might reduce the particle-particle and particle-wall collision frequen-cies. This reduces the pressure drop. Therefore, it seems that the particle size affects the pressure drop either positively or negatively and this depends on the factors dominant in the certain system.
M d uT s s sl=1
63
ϕπ ρ
. (5)
The above figures reveal that a particular range of the specularity coefficient - depending on the particle size and solid lading ratio - has no effect on the pressure drop profiles; however above that range, the effect is significant at least for the larger particle sizes (500 µm and 3 mm). In general, according to Fig. 2(b), 3(a) and 3(b), the pressure drop increases when the specularity coefficient increases for the values above around 0.001. This can be explained in the following way. For higher wall roughness (i.e. higher specularity coefficient), the colli-sion of particles with wall tends to be more diffusive, producing high shear at the wall. Moreover, this results the transfer of axial particle momentum (stream-wise direction) to the wall. Therefore, the particles require more energy to reaccelerate in the stream-wise direction resulting increased drag and hence increased pressure drop. The increase of pressure drop when increasing specularity coefficient has been observed by Patro and Dash [4] too.
5.1.2 Real air velocity profilesThe real air velocity profiles along a diameter in a pipe cross section at fully developed region for different particle sizes and solid loading ratios are shown in Fig. 4–Fig. 5(b). The profiles are also compared with the experimental data [10].
In general, the air velocity profile for 200 µm is similar to a single-phase turbulent profile, because the small particles follow the air stream without significantly affecting the air flow in dilute regimes (Fig. 4). Similar observations have been made by previous researchers for 70 µm diameter particles with solid loading ratio = 1 and air velocity = 14.85 ms-1 [12]. In con-trast, the experimental air velocity profile becomes more concave for 500 µm particles (Fig. 5(a) and Fig. 5(b)), in where the effect of particles on air flow is significant. The maximum velocities reach in the range of r/R=0.4 - r/R=0.6. Generally, the air velocities are low nearby wall due to boundary layer effect.
Figure 4: Effect of specularity coefficient on mean real air velocity profiles along a diameter in a pipe cross section at fully developed region for particle diameter 200 µm, Re = 2.3 × 10⁴ and m = 1.3 (Case-1.1 to Case-1.4).

54 W. K. Hiromi Ariyaratne, et al., Int. J. Comp. Meth. and Exp. Meas., Vol. 6, No. 1 (2018)
The agreement between experimental and predicted results is reasonable for 200 µm diameter particles (Fig. 4) while it is good for 500 µm diameter particles (Fig. 5(a)). The simulated profiles are flattened out compared to experimental profile for 200 µm particles (Fig. 4). The simulated results are in good agreement with experiments for 500 µm particles (Fig. 5(a) & 5(b)), however depending on the specularity coefficient.
Importantly, the specularity coefficient has significant effect on the predictions especially for the 500 µm particles. The effect is more pronounced in the central region (from centre to r/R=0.6). In general, increase of specularity coefficient decreases the air velocity in that region. Therefore, the profile becomes more flattened for low specularity coefficients. The reason for decreasing air velocity in central region with increase of specularity coefficient is the restriction of air flow due to high solid volume fraction in core region. This is more described in Subsection 5.1.4. According to the air velocity profile observations and the tested range of specularity coefficients, specularity coefficient > 0.001 is not recommended for the 200 µm particle diameters. Moreover, the ranges of 0.0001–0.001 and 0.00001–0.001 could be acceptable for 500 µm diameter particles for the solid loading ratios 3.4 and 2.6, respectively (Fig. 5(a) & 5(b)).
5.1.3 Real particle velocity profilesFigures 6(a) and 6(b) show the real particle velocity profiles along a diameter in a pipe cross section at fully developed region. It is observed that the increase of specularity coefficient decreases the particle velocity in general. This is compatible with the meaning of the specu-larity coefficient. Higher the coefficient, higher the particle momentum transfer to the wall during collisions in tangential direction (stream-wise direction) creating high shear. Since the major velocity component is in stream-wise direction, this will reduce the resultant velocity of the particles. Moreover, the effect is pronounced nearby walls. When the specularity coef-ficient is increased above certain values, the velocity nearby wall drastically reduces depending on the operating conditions and the particle size. In Fig. 6(b), the specularity coefficient 0.1 gives less deviation between experiments and predictions with respect to over-all shape of the profile. However, the average real particle velocity is better predicted with a specularity coefficient between 0.001 and 0.01. The recommendation of specularity
Figure 5: Effect of specularity coefficient on mean real air velocity profiles along a diameter in a pipe cross section at fully developed region for (a) Particle diameter 500 µm, Re = 2.2 × 10⁴ and m = 3.4 (Case-2.1 to Case-2.13); (b) Particle diameter 500 µm, Re = 2.2 × 10⁴ and m = 2.6 (Case-5.1 to Case-5.5).

W. K. Hiromi Ariyaratne, et al., Int. J. Comp. Meth. and Exp. Meas., Vol. 6, No. 1 (2018) 55
coefficient less than 0.001 for 500 µm diameter particles (Subsection 5.1.2) is valid also with respect to the particle velocity profiles. A value between 0.001 and 0.01 is satisfactory for 3 mm diameter particles under tested operating conditions.
5.1.4 Particle flow patternFigure 7(a) shows the sensitivity of specularity coefficient on particle distribution along a diameter in a pipe cross section at fully developed region for 500 µm diameter particles. When the specularity coefficient increases, more particles concentrate in the centre of the pipe by creating rich particle core in the central region. When the specularity coefficient increases i.e. due to wall roughness, the momentum loss of particles in tangential direction is
Figure 6: Effect of specularity coefficient on mean real particle velocity profiles along a diameter in a pipe cross section at fully developed region for (a) Particle diameter 500 µm, Re = 1.6 × 10⁴ and m = 3.6 (Case-6.1 to Case-6.6); (b) Particle diameter 3 mm, Re = 3.1 × 10⁴ and m = 1.2 (Case-4.1 to Case-4.4).
Figure 7: (a) Effect of specularity coefficient on solid volume fraction profiles along a diameter in a pipe cross section at fully developed region for particle diameter 500 µm, Re = 1.6 × 10⁴ and m = 3.6 (Case-6.1 to Case-6.6); (b) Effect of particle-wall restitution coefficient on mean real particle velocity profiles along a diameter in a pipe cross section at fully developed region for particle diameter 500 µm, Re = 1.6 × 10⁴ and solid loading ratio 3.6 (Case-7.1 to Case-7.5).

56 W. K. Hiromi Ariyaratne, et al., Int. J. Comp. Meth. and Exp. Meas., Vol. 6, No. 1 (2018)
high during particle-wall collisions, therefore the particle rebound angle is increased resulting particles movements into core region of the pipe. This is the reason for having lower air velocities in the central region of the pipe for higher specularity coefficients (Fig. 5(a) and Fig. 5(b)). Very high concentration in the core region compared to outer annulus region is not physical for such a flow regime [5, 12], so the values less than 0.001 can be recommended for 500 µm under these operating conditions. However, the predictions nearby wall region are not as expected for entire range of specularity coefficients tested.
5.2 Sensitivity of coefficient of restitution for particle-wall collisions (esw )
The coefficient of restitution for particle-wall collisions determines how much momentum in the direction normal to the wall is retained by the particle after the collision with the boundary. In the present study, some values in a wide range (0.5–0.95) were tested. Compared to the effect from specularity coefficient, the sensitivity of coefficient of restitution for particle- wall collisions on the results is not significant for 500 µm diameter particles (Fig. 7(b)). The observations are compatible with previous findings. According to Patro and Dash [4], there was a negligible effect on the pressure drop from esw in the range of 0.8 to 0.95. Azizi et al. [5] have used esw in the range of 0.2–0.6. This has also been proven for horizontal pipe dilute phase pneumatic conveying [13].
6 CONCLUSIONThe sensitivity of specularity coefficient in Johnson and Jackson particle-wall boundary condi-tions on pneumatic conveying characteristics of dilute phase vertical upward flow is investigated in the present study. Cases with different operating conditions and particle diameters are simu-lated and some of the results are compared with experimental data from the existing literature. Specularity coefficient values, which are greater than certain ranges (depending on the operat-ing conditions and the particle sizes) show significant effect on pneumatic conveying results. In general, the increase of specularity coefficient increases the pressure drop, decreases the real air velocity in central region of the pipe and decreases the particle velocity. It also results in higher solid volume fractions in the core region of the pipe. These observations are compatible with the previous findings. According to the tested operating conditions and the range of the specu-larity coefficients, a range of 0.00001–0.001, which gives low deviations with experimental results can be recommended for 500 µm diameter particles. This range seems to be acceptable for 200 µm diameter particles as well. A slightly higher range of specularity coefficient values (0.001–0.01) seems to be reasonable for 3 mm particles; however, more investigations should be made. Additionally, it was found that the coefficient of restitution for particle-wall collisions has lower sensitivity for pneumatic conveying results compared to specularity coefficient.
Nomenclature
D Pipe diameter, m
dsDiameter of solid particles, m
essCoefficient of restitution for particle collisions
eswCoefficient of restitution for particle-wall collisions
Flift s,Lift force acting on solid phase, Nm-3
Ftd s,Turbulent dispersion force for the solid phase, Nm-3

W. K. Hiromi Ariyaratne, et al., Int. J. Comp. Meth. and Exp. Meas., Vol. 6, No. 1 (2018) 57
g Gravitational acceleration =9.80665, ms-2
g ss0,Radial distribution function
K sgInterphase momentum exchange coefficient, kgm-3 s-1
m Solid loading ratio (solid mass flow rate/air mass flow rate)
M TAverage tangential momentum transfer per collision, kgms-1
P Static pressure, Pa
qsRate of energy transfer to unit area of the wall surface by particle-wall collisions, Jm-2 s-1
RRe
Pipe radius, mReynolds number of the flow
r Horizontal distance from pipe vertical axis, m
uslParticle slip velocity parallel to the wall, ms-1
v gGas phase mean velocity vector, ms-1
v sSolid phase mean velocity vector, ms-1
αgVolume fraction of gas phase
αsVolume fraction of solid phase
αs max,Volume fraction for the particles at maximum packing = 0.63
ρgDensity of gas phase, kgm-3
ρsParticle density, kgm-3
φ Specularity coefficient between the particle and the wall
θsGranular temperature, m2 s-2
τ gGas phase effective stress-strain tensor, Pa
ACKNOWLEDGEMENTSThe authors would like to acknowledge the financial support provided by the Research Coun-cil of Norway under PETROMAKS II program and Det Norske oljeselskape ASA.
REFERENCES [1] Ratnayake, C., A comprehensive scaling up technique for pneumatic transport systems
[PhD], Telemark University College, Norway, 2005. [2] Chandra, K.A., Ariyaratne, W.K.H. & Melaaen, M.C., Prediction of Dilute Phase Pneu-
matic Conveying Characteristics Using MP-PIC Method. Proceedings of EUROSIM 2016, September 13–16 2016; Oulu, Finland. Published by IEEE, ISBN 978-1-5090-4119-0, pp. 593–598, 2016, available at: http://eurosim2016.info.
[3] Ariyaratne, W.K.H., Manjula, E.V.P.J., Ratnayake, C. & Melaaen, M.C., CFD Approaches for Modeling Gas-Solids Multiphase Flows – A Review. Proceedings of EUROSIM 2016, September 13–16 2016 2016; Oulu, Finland. Published by IEEE, ISBN 978-1-5090-4119-0, pp. 629–634, 2016, available at: http://eurosim2016.info
58 W. K. Hiromi Ariyaratne, et al., Int. J. Comp. Meth. and Exp. Meas., Vol. 6, No. 1 (2018)
[4] Patro, P. & Dash, S.K., Two-fluid modeling of turbulent particle–gas suspensions in verti-cal pipes. Powder Technology, 264, pp. 320–331, 2014.https://doi.org/10.1016/j.powtec.2014.05.048
[5] Azizi, S., Mowla, D. & Ahmadi, G., Numerical evaluation of turbulence models for dense to dilute gas–solid flows in vertical conveyor. Particuology, 10(5), pp. 553–561, 2012.https://doi.org/10.1016/j.partic.2011.12.006
[6] Zhao, Y., Ding, T., Zhu, L. & Zhong, Y., A specularity coefficient model and its appli-cation to dense particulate flow simulations. Industrial & Engineering Chemistry Research, 55(5), pp. 1439–1448, 2016.https://doi.org/10.1021/acs.iecr.5b03792
[7] Loha, C., Chattopadhyay, H. & Chatterjee, P.K., Euler-Euler CFD modeling of fluid-ized bed: Influence of specularity coefficient on hydrodynamic behavior. Particuology, 11(6), pp. 673–680, 2013.https://doi.org/10.1016/j.partic.2012.08.007
[8] Zhong, H., Lan, X., Gao, J., Zheng, Y. & Zhang, Z., The difference between specularity coefficient of 1 and no-slip solid phase wall boundary conditions in CFD simulation of gas–solid fluidized beds. Powder Technology, 286, pp. 740–743, 2015.https://doi.org/10.1016/j.powtec.2015.08.055
[9] Johnson, P.C. & Jackson, R., Frictional–collisional constitutive relations for granular mate-rials, with application to plane shearing. Journal of Fluid Mechanics, 176, pp. 67–93, 1987.https://doi.org/10.1017/s0022112087000570
[10] Tsuji, Y., Morikawa, Y. & Shiomi, H., LDV measurements of an air-solid two-phase flow in a vertical pipe. Journal of Fluid Mechanics, 139, pp. 417–434, 1984.https://doi.org/10.1017/s0022112084000422
[11] Ariyaratne, W.K.H., Ratnayake, C. & Melaaen, M.C., Eularian-Eularian Approach for Modeling Dilute Phase Pneumatic Conveying in a Horizontal Pipe. Proceedings of ICBMH 2016 July 11–14 2016; Darwin, Australia, pp. 409–416, 2016.
[12] Benyahia, S., Syamlal, M. & O’Brien, T.J., Evaluation of boundary conditions used to model dilute, turbulent gas/solids flows in a pipe. Powder Technology, 156(2–3), pp. 62–72, 2005.https://doi.org/10.1016/j.powtec.2005.04.002
[13] Ariyaratne, W.K.H., Ratnayake, C. & Melaaen, M.C., CFD Modelling of dilute phase pneumatic conveying in a horizontal pipe using Euler-Euler approach. Advanced Powder Technology, submitted, 2016.