a parametric study on ibr sheeting supported by...
TRANSCRIPT

1
A PARAMETRIC STUDY ON IBR SHEETING
SUPPORTED BY PURLINS
Marope Stella Mlasi Student number: 0412084R
Supervisor: Prof A.A. Elvin
A dissertation submitted to the
Faculty of Engineering and the Built Environment,
University of the Witwatersrand,
in fulfilment of the requirements for the degree of
Master of Science in Engineering
Johannesburg, 2016

i
DECLARATION
I declare that this dissertation is my own unaided work. It is being submitted for the degree
of Master of Science in Engineering to the University of the Witwatersrand, Johannesburg.
It has not been submitted before for any degree or examination to any other University.
………………………………..…
Marope Stella Mlasi
……………day of May 2016

ii
ABSTRACT
This dissertation presents a parametric study conducted on the dimensions of an inverted box rib
(IBR) sheet. The objectives of the study were (i) to obtain the optimum dimensions that would be
used to simulate new IBR profiles made from standard sheet input coils whilst meeting the stiffness
criterion; and (ii) to perform a cost analysis to determine the most economic simulated profile.
The dimensions which were varied in the parametric study were rib-height, rib-width, sheet
thickness and the number of pans per 686 mm cover width of a single IBR 686 sheet. Numerical
experiments were conducted using the Finite Elements Method and Abaqus/CAE software. The
results were compared to the predictions obtained from Euler-Bernoulli beam theory. The outputs
from the experiments were the sheet deflection from which stiffness was determined, and
eigenvalues from which the profiles’ stability and buckling modes were calculated.
This study found that sheet stiffness increased as the rib-height, sheet thickness and number of pans
per 686 mm cover width increased. In contrast, the rib-width had little effect on the sheet stiffness.
Hence, it was concluded that, for any IBR sheet profile, the rib-width should be kept at
approximately 23 mm to avoid using more material in the sheet. The optimum dimensions found
were rib-height of 34 mm, rib-width of 23 mm and four pans per 686 mm cover width. The
commercially available IBR 686 sheet is made up of four pans and has a rib-height and a rib-width
of 37 and 33 mm, respectively. It is manufactured from an input sheet coil of 925 mm. Reducing
the rib-height from 37 mm to 34 mm and the rib-width from 33 mm to 23 mm resulted in
increasing the cover width by 8 %.
The optimum dimensions were further used to simulate profiles made from the 925, 940, 1000,
1175, 1219, 1225, 1250 and 1320 mm standard sheet coils in order to find the most economic IBR
profiles that met the stiffness criterion. The 1250 mm coil yielded the most economical IBR profile,
which has six 97 mm wide pans, and a 996 mm cover width. This profile resulted in a 10 % cost
saving compared with the next closest profile.
KEYWORDS:
Optimal IBR sheet profile
Parametric study of an IBR sheet profile
Z-section purlins
IBR sheet stiffness
IBR sheet buckling load

iii
ACKNOWLEDGEMENTS
I would like to thank:
My supervisor, Prof. Alex Elvin, for the guidance and support received whilst
working on this degree.
The Southern African Institute of Steel Construction.
University of South Africa for funding the first two years of my Master’s degree
and for purchasing the Abaqus/CAE software licences used in this study.
My husband, Mr Bongani Mlasi, and our lovely son, Siyeza Olaninyi Mlasi, and
daughter, Phetogo Titilayo Mlasi.
Mrs Jeannette Menasce for assisting me to edit and correct this document.

iv
CONTENTS
DECLARATION .................................................................................................................. i
ABSTRACT ......................................................................................................................... ii
ACKNOWLEDGEMENTS ............................................................................................... iii
CONTENTS ........................................................................................................................ iv
LIST OF FIGURES ........................................................................................................... vii
LIST OF TABLES .............................................................................................................. ix
LIST OF SYMBOLS ........................................................................................................... x
ABBREVIATIONS, ACRONYMS AND GLOSSARY ................................................. xii
1: INTRODUCTION ................................................................................................... 1
1.1 Background ........................................................................................................................... 1
1.2 Introduction to roof components used in the research .......................................................... 2
1.2.1 Overview of what makes up a steel roof ...................................................................... 2
1.2.2 Description of a purlin .................................................................................................. 4
1.2.3 Description of an inverted box rib sheet (IBR) ............................................................ 5
1.2.4 Description of the fasteners .......................................................................................... 6
1.3 Statement of the problem ...................................................................................................... 6
1.4 Significance of the research .................................................................................................. 6
1.5 Research objectives ............................................................................................................... 7
1.6 Definitions of the terms used ................................................................................................ 7
1.7 Structure of the document ..................................................................................................... 7

v
2 LITERATURE REVIEW ....................................................................................... 8
2.1 Reasons for using inverted box rib roof sheeting .................................................................. 8
2.2 Overview of the parametric studies performed on roof sheeting .......................................... 8
3 RESEARCH METHODOLOGY ......................................................................... 10
3.1 Introduction ......................................................................................................................... 10
3.1.1 Abaqus/CAE overview ............................................................................................... 10
3.2 Finite Element Model in Abaqus/CAE ............................................................................... 10
3.2.1 Abaqus/CAE experimental setup ............................................................................... 11
3.2.2 Creating purlin and sheet as parts in Abaqus/CAE .................................................... 14
3.2.3 Material and section properties .................................................................................. 14
3.2.4 Fastenings ................................................................................................................... 15
3.2.5 Modelling the loads in Abaqus/CAE .......................................................................... 17
3.2.6 Meshing technique ..................................................................................................... 20
3.2.7 Data analysis and convergence study ......................................................................... 21
3.3 Euler-Bernoulli beam theory ............................................................................................... 21
4 SELECTION OF PARAMETERS ...................................................................... 23
4.1 Introduction ......................................................................................................................... 23
4.2 Key parameters.................................................................................................................... 23
4.2.1 Variation of rib-height ................................................................................................ 24
4.2.2 Variation of rib-width ................................................................................................. 25
4.2.3 Variation of sheet thickness ....................................................................................... 25
4.2.4 Variation of number of pans ....................................................................................... 26
4.2.5 Simultaneous variation of rib-height and rib-width ................................................... 26
4.2.6 Simultaneous variation of rib-height and number of pans.......................................... 29
4.2.7 Simultaneous variation of rib-width and number of pans .......................................... 31
5 DISCUSSION AND ANALYSIS OF PARAMETRIC VARIATION
RESULTS ............................................................................................................... 33
5.1 Introduction ......................................................................................................................... 33
5.2 Result implications of the convergence study ..................................................................... 33
5.3 Effect of variation of rib-height .......................................................................................... 36
5.3.1 Buckling strength of the web ...................................................................................... 38
5.4 Effect of variation of rib-width ........................................................................................... 41

vi
5.5 Effect of variation of sheet thickness .................................................................................. 42
5.6 Effect of variation of number of pans in a single sheet ....................................................... 43
5.7 Effects of simultaneous variation of rib-height and rib-width ............................................ 44
5.8 Effects of simultaneous variation of rib-height and number of pans .................................. 47
5.9 Effects of simultaneous variation of rib-width and number of pans ................................... 49
5.10 Cost analysis........................................................................................................................ 51
6 CONCLUSIONS, LIMITATIONS AND RECOMMENDATIONS ................. 57
6.1 Summary of the research ..................................................................................................... 57
6.2 Limitations of the research .................................................................................................. 58
6.3 Recommendations for future research ................................................................................. 59
REFERENCES .................................................................................................................. 60
APPENDIX A: DERIVATION OF THE APPLIED LOADS ..................................... 64
A.1 Estimation of the magnitude of the applied load (W) ......................................................... 64
A.1.1 Specifications ............................................................................................................. 64
A.1.2 Fundamental wind speed ............................................................................................ 65
A.1.3 Probability factor ........................................................................................................ 65
A.1.4 Peak gust wind speed ................................................................................................. 65
A.1.5 Terrain roughness ....................................................................................................... 66
A.1.6 Roughness factor ........................................................................................................ 66
A.1.7 Topography factor ...................................................................................................... 66
A.1.8 External pressure coefficients .................................................................................... 67
A.1.9 Internal pressure coefficients ...................................................................................... 72
APPENDIX B: DERIVATION OF EULER-BERNOULLI BEAM THEORY ........ 74
B.1 Terminology in Euler-Bernoulli beam theory ..................................................................... 74
B.2 Assumptions in the Euler-Bernoulli beam theory ............................................................... 74
B.3 The Euler-Bernoulli beam theory ........................................................................................ 75
B.3.1 Coordinate system ...................................................................................................... 75
B.3.2 Beam supports and boundary conditions .................................................................... 75
B.3.3 Stresses, strains and bending moments ...................................................................... 75
B.3.4 Beam deflections ........................................................................................................ 77

vii
LIST OF FIGURES
Figure 1.1: General components of a steel roof structure (not to scale) ............................................... 3
Figure 1.2: A 200 x 75 x 20 x 3 mm Z-section purlin (not to scale) .................................................... 4
Figure 1.3: Example of a typical IBR 686 sheet (TUFDEK IBR – see SAFINTRA, 2012) ................ 5
Figure 1.4: A cross-section of a typical IBR sheet, including a depiction of the details of a rib
(not to scale) ...................................................................................................................... 5
Figure 3.1: Flow diagram of the development and application of the Abaqus/CAE model used
in this research ................................................................................................................. 11
Figure 3.2: Experimental setup of IBR sheet and a 200 x 75 x 20 x 3 mm Z-section purlin in
Abaqus/CAE .................................................................................................................... 13
Figure 3.3: Simplified stress-strain relationship for steel (after Case & Chilver, 1964; Case,
Chilver & Ross, 1999) .................................................................................................... 14
Figure 3.4: Model for bolt heads, nuts and bolts ................................................................................ 16
Figure 3.5: Wind uplift loading on the sheet ...................................................................................... 17
Figure 3.6: A schematic representation of the IBR sheet used in the buckling analysis .................... 19
Figure 3.7: Element S4R and typical mesh of the sheet and purlin.................................................... 20
Figure 4.1: Cross-section of a typical IBR sheet (not drawn to scale) ............................................... 23
Figure 4.2: Rib-height varying from 34 to 80 mm ............................................................................. 24
Figure 4.3: Rib-widths varying from 26 to 59.5 mm ......................................................................... 25
Figure 4.4: Different IBR sheet profiles with three, four, six and eight pans .................................... 26
Figure 4.5: IBR sheet profiles with 20 mm rib-width and rib-height varying from 34 to 80 mm ...... 27
Figure 4.6: IBR sheet profiles with 40 mm rib-width and rib-height varying from 34 to 80 mm ...... 28
Figure 4.7: IBR sheet profiles with 59.5 mm rib-width and rib-height varying from 34 to
80 mm .............................................................................................................................. 28
Figure 4.8: Sheet profiles with three pans and rib-height varying from 34 to 80 mm ....................... 29
Figure 4.9: Sheet profiles with four pans and rib-height varying from 34 to 80 mm ......................... 29
Figure 4.10: Sheet profiles with six pans and rib-height varying from 34 to 80 mm ........................... 30
Figure 4.11: Sheet profiles with eight pans and rib-height varying from 34 to 80 mm ....................... 30
Figure 4.12: Sheet profiles with three pans and rib-width varying from 20 to 59.5 mm ..................... 31
Figure 4.13: Sheet profiles with four pans and rib-width varying from 20 to 59.5 mm ....................... 31
Figure 4.14: Sheet profiles with six pans and rib-width varying from 20 to 59.5 mm......................... 32

viii
Figure 4.15: Sheet profiles with eight pans and rib-width varying from 20 to 59.5 mm ..................... 32
Figure 5.1: Convergence study of the Finite Element mesh .............................................................. 34
Figure 5.2: Convergence study for buckling under concentrated load ............................................... 36
Figure 5.3: Convergence study for buckling under wind uplift ......................................................... 36
Figure 5.4: Graph of sheet deflections versus rib-heights .................................................................. 37
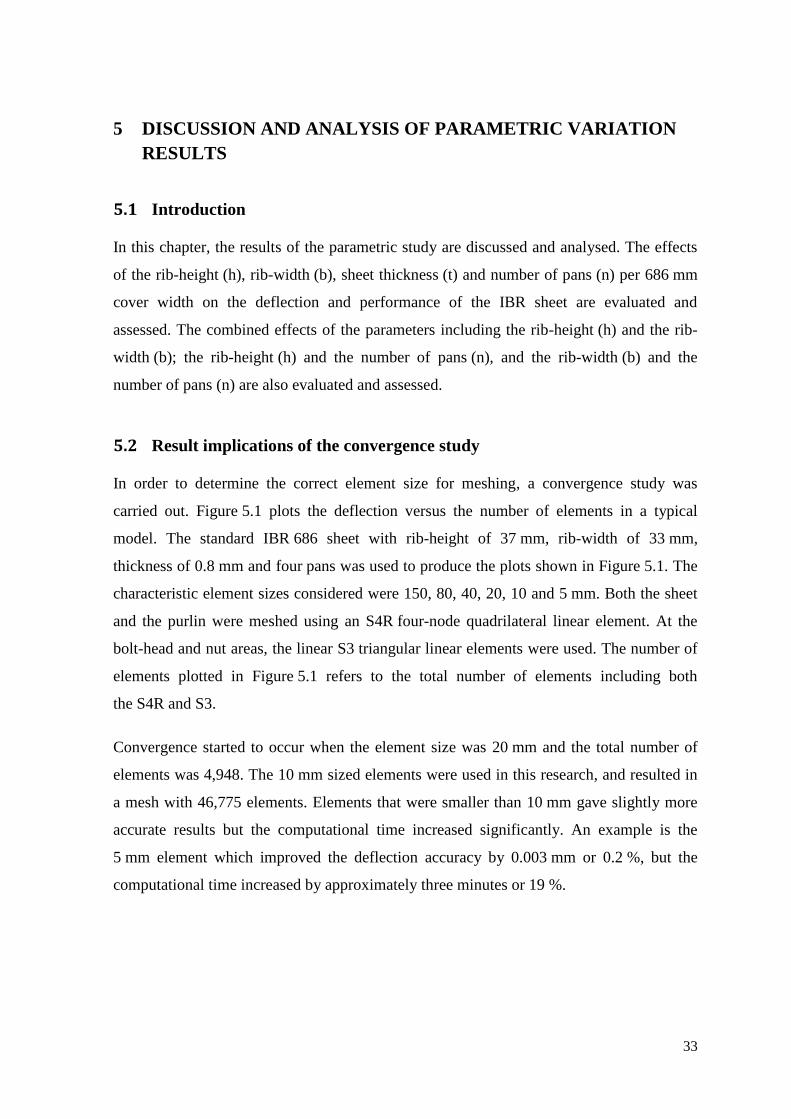
Figure 5.5: Graph of critical buckling load of the sheet versus rib-heights ....................................... 39
Figure 5.6: Buckling modes of an IBR sheet subject to wind uplift and a concentrated load ............ 40
Figure 5.7: Graph of sheet mid-span deflection versus rib-width ...................................................... 41
Figure 5.8: Graph of sheet mid-span deflection versus sheet thickness ............................................. 43
Figure 5.9: Graph of sheet mid-span deflection versus number of pans in a single sheet .................. 43
Figure 5.10: Graph of sheet mid-span deflection versus rib-height at different rib-widths ................. 44
Figure 5.11: Graph of sheet mid-span deflection versus rib-height at three, four, six and eight
pans in a single sheet ....................................................................................................... 47
Figure 5.12: Graph of sheet mid-span deflection versus number of pans at different rib-widths ........ 49
Figure 5.13: Graph of width/thickness extras cost of the commercial input coil versus the width
of the commercial input coil (Arcelor Mittal, 2015) ........................................................ 52
Figure 5.14: Graph of sheet deflection versus number of pans, indicating the profiles which
satisfy the strength criteria ............................................................................................... 54
Figure 5.15: Graph of cover width against cost ................................................................................... 55
Figure 5.16: Profile P67 (not drawn to scale) ........................................................................................ 56
Figure A.1: Cross-section through an internal portal frame of the structure ....................................... 65
Figure A.2: Loading zones of the walls and roof of the building when the wind acts normal to
the long side of the building ............................................................................................ 68
Figure A.3: Dimensions of the loading zones of the gable wall when the wind acts normal to
the long side (SANS 10160-3, 2011: 32, 40) ................................................................... 69
Figure A.4: Loading zones of the walls and roof of the building when the wind acts normal to
the gable wall ................................................................................................................... 69
Figure A.5: Dimensions of the loading zones of the long side and roof when the wind acts
normal to the gable wall (SANS 10160-3, 2011: 32, 40) ................................................ 70
Figure A.6: Coefficients for internal and external pressure ................................................................ 73
Figure B.1: Beam long- and cross-section ......................................................................................... 75
Figure B.2: Direct stress acting on the segment of area dA ............................................................ 76
Figure B.3: A simply supported beam supporting an uplift wind loading .......................................... 77
Figure B.4: A rib taken from an IBR sheet and divided into elements ............................................... 78

ix
LIST OF TABLES
Table 5.1: Eigenvalues calculated when rib-height and element sizes were varied with the
sheet subject to wind uplift .............................................................................................. 35
Table 5.2: Eigenvalues calculated when rib-height and element sizes were varied with the
sheet subject to a concentrated load ................................................................................. 35
Table 5.3: Effects on the deflection when the rib-height is doubled................................................. 37
Table 5.4: Comparison of profiles with the rib-height and rib-width varied simultaneously ........... 46
Table 5.5: Comparison of profiles with varying rib-height and number of pans .............................. 48
Table 5.6: Comparison of profiles with varying rib-width and number of pans ............................... 50
Table 5.7: Profiles simulated from the optimum parameters ............................................................ 53
Table 5.8: Recommended purlin spacing to support profile P67 ....................................................... 56
Table A.1: Estimated external pressure coefficients when the wind acts normal to the long
side ................................................................................................................................... 71
Table A.2: Estimated external pressure coefficients when the wind acts normal to the gable
wall .................................................................................................................................. 71

x
LIST OF SYMBOLS
𝑎 Bottom rib-width
𝐴 Cross-sectional area
𝑏 Rib-width in the IBR sheet
𝐵 Cover width of the sheet
𝐵′ Unfolded cover width of the sheet
𝐶𝑜 Topography factor
𝐶𝑝𝑒 Coefficient of external pressure
𝐶𝑝𝑖 Coefficient of internal pressure
𝐶𝑝𝑟𝑜𝑏 Probability factor
𝐶𝑟 Roughness factor
𝐸 Elastic modulus
𝐸𝐼 Sheet stiffness
𝜎𝑦 Yield stress
ℎ Rib-height in the IBR sheet
𝐻 Height of the building
𝐼 Second moment of area
𝐿 Sheet span between two adjacent supporting purlins (also called purlin spacing)
𝐿𝑢 Horizontal length of the upward wind slope
𝑀 Bending moment
𝑛 Number of pans per 686 mm cover width in a single IBR sheet
𝑃 Applied concentrated load on the sheet
𝑃𝑐𝑟 Critical buckling concentrated load
𝑄 Shear force
𝑞 Wind pressure
𝑅 External reaction force
𝑡 Thickness of the IBR sheet
𝑉 Wind speed

xi
𝑊 Applied wind uplift loading on the sheet
𝑊𝑐𝑟 Critical buckling wind uplift load
𝑋′ Pan width in the IBR sheet
𝑧 Height above the ground
𝑧𝑐 Minimum height below which no further reduction in wind speed is allowed
𝑧𝑔 Gradient height
𝑧𝑜 Height of reference plane
𝛼 Roughness factor exponent
∆ Total sheet deflection
𝜀 Strain
𝜆𝑖 The ith
eigenvalue corresponding to the ith
buckling mode
𝜙 Upward wind angle or slope
𝜎 Direct bending stress
𝜃 Corrugation angle
𝜌 Density
𝜈 Poisson ratio

xii
ABBREVIATIONS, ACRONYMS AND GLOSSARY
Abaqus/CAE Complete Abaqus Environment
(Dassault Systemes SIMULIA (2014))
ACO(s) Ant Colony Optimisation(s)
ANSYS Finite Element Analysis Software
FEA Finite Element Analysis
FEM Finite Element Method / Finite Element Modelling
GRS Global Roofing Solutions
GUI Graphical User Interface
IBR Inverted Box Rib
MPC(s) Multi-Point Constraint(s)
RP Reference Point
SAISC Southern African Institute of Steel Construction

1
1: INTRODUCTION
1.1 Background
Roof sheeting is popular in industrial and domestic buildings and warehouses. This is due
to several reasons which include:
(1) the availability and wide range of cross-sectional shapes and sizes;
(2) thin-walled structure of the roof sheeting which reduces space consumption;
(3) longer life span due to coating;
(4) recyclability of materials;
(5) faster construction processes, and
(6) Light weight.
However, the quality of roof sheeting is not measured by its relatively low cost or the
popularity of its manufacturer, but by considerations of each dimensional parameter of the
sheet. The quality and dimensional parameters of sheeting as a roof-covering material are
governed by durability, stiffness, cost, insulation and water-carrying capacity (Balex
Metal, 2011).
Inverted Box Rib (IBR) sheeting has become one of the most popular profiles used in the
construction of industrial buildings. An IBR sheet is defined as a “trapezoidal fluted profile
sheet that is often adopted as roof-covering or side-cladding material” (Cousins Steel
International, 2015). The IBR sheet profile is made up of flutes or corrugations known as
“ribs” and the spaces between the ribs are known as “pans”. The pans are measured from
centre to centre of two adjacent ribs. There are different types of IBR sheeting, often
named based on the cover width of a single sheet. Examples include IBR 686 and IBR 890
sheets, which have cover widths of 686 and 890 mm respectively (Southern African
Institute of Steel Construction (SAISC), 2013). These sheets have well-established

2
dimensions and shapes and are available in different thicknesses (ranging from 0.3 to
0.8 mm), with galvanized zinc or Zincalume coating (SAISC, 2013).
In many IBR sheet profiles, the sizes of the dimensional parameters are known and
established for several reasons (such as material and production cost, type of manu-
facturing process as well as the identification of the sheet itself). However, there is a
deficiency in the current literature on the relationship between the dimensional parameters,
sheet stiffness and stability of the IBR profiles (SANS 10162-1, 2011; Eurocode 3 –
Part 1-3, 2005).
This research focuses on addressing the influence of the dimensional parameters of the
IBR profiles on its stiffness, stability and material cost.
1.2 Introduction to roof components used in the research
1.2.1 Overview of what makes up a steel roof
A metal roof, particularly one made from structural steel, consists of rafters or trusses,
purlins and roof sheeting which provides cover to the entire roof structure. The sheet is
affixed to the purlins via screws; whilst the purlins are supported by rafters or trusses,
which, in turn, are supported by the walls, beams or columns. Figure 1.1 shows a simple
example of the components that make up a structural steel roof. For clarity, only three
purlins are shown supporting three overlapped IBR 686 sheets. Usually the roof sheeting
would cover the entire roof, making the structure waterproof.

3
Figure 1.1: General components of a steel roof structure (not to scale)
(a) General structure of a warehouse as a common example of a structural steel building
Rafter
Rafter
Roof purlins
Ridge purlin
Eave purlin
Eaves connection
3 x IBR 686 sheets
Rafters: 305 x 102 x 25 mm I-section
Purlins: 200 x 75 x 20 x 3 mm Z-section
(b) Details of roof bay (sag rods and screws not shown)
Rafters
Eave purlin Ridge
Eaves connection
Column
Ridge purlin
Roof purlins
Braced roof bay
Braced frame bay
Sag rods
Wall girts

4
1.2.2 Description of a purlin
A purlin is a horizontal and longitudinal structural member in roofing that spans parallel to
the eaves and is supported by rafters, walls or trusses. Purlins support the roof cladding or
sheeting. Roof purlins in most steel-framed buildings are made from cold-formed, lipped
open sections such as channels, angles and Z-sections. Generally, these cold-formed
sections are lighter than hot-rolled sections and are, therefore, less expensive. The purlins
can be designed to span up to 12 m but, for such long spans, the members should be
designed in double span or continuous configurations in order to minimise deflections
(SAISC, 2013). The thickness of the purlin section usually ranges from 2.0 to 4.5 mm
(SAISC, 2013). According to SANS 10162: – Part 1, for commercial quality steel (such as
a cold-formed section) the yield and ultimate tensile strength should be 200 and 365 MPa,
respectively.
Unless stated otherwise, a 200 x 75 x 20 x 3 mm Z-section (shown in Figure 1.2) is used as
a purlin in all cases in this research. The Z-section was chosen because it allows
continuous span configurations through the overlaps over the supports, resulting in
optimum adaptation of the cross-sections and an increased capacity to carry “hogging”
moments (Robra & Luza, 2008; Metsec, 2016). Although the cross-section is not
symmetrical, the shear centre coincides with the centroid, making the Z-section
rotationally stiffer (Vlasov, 1959).
Figure 1.2: A 200 x 75 x 20 x 3 mm Z-section purlin (not to scale)
200
mm
20 mm
20 mm
75 mm
75 mm

5
1.2.3 Description of an inverted box rib sheet (IBR)
An IBR sheet comes in different profiles and thicknesses. An example of an IBR 686 sheet
is shown in Figure 1.3 with its cross-section shown in Figure 1.4. Sheet thickness (t) could
range from 0.3 to 0.8 mm depending on the type, size and number of spans, type and
purpose of the building and whether the sheet is used for side or roof cladding. An IBR 686
sheet is an IBR sheet with a cover width (B) of 686 mm (Figure 1.4). According to Global
Roofing Solutions (2016), IBR sheeting offers the optimum strength, mass and load-span
characteristics compared with other steel roofing profiles.
Pan width (X’) Rib-width (b)
Cover width (B)
Rib-height (h)
Corrugation angle (θ) Sheet thickness (t)
Rib
59.5 mm
θ θ
b = 33 mm
h = 37mm
13.25 mm 13.25 mm
θ = 70.3o
Figure 1.3: Example of a typical IBR 686 sheet (TUFDEK IBR – see SAFINTRA, 2012)
Figure 1.4: A cross-section of a typical IBR sheet, including a depiction of the
details of a rib (not to scale)
See detail below

6
1.2.4 Description of the fasteners
A corrugated sheet can be attached to the purlin with screws or bolts at alternating crests or
troughs, or at intervals prescribed by the manufacturer. The type and spacing of the screws
or bolts is usually determined by the type of loading and the sheet used. In practice
Class 4.8 M16 bolts with Classes 8 and 5 nuts are adequate for purlin or girt connections in
South Africa (SAISC, 2013). For more information on mechanical properties of Classes 8
and 5 nuts, reference may be made to SANS 1700:5-1. Class 4.8 M16 bolts have an
ultimate tensile strength and yield stress of 400 and 320 MPa, respectively. Bolted
connections should be designed in accordance with SANS 10162: Part 1 or Part 2, and
should be fabricated and erected in accordance with SANS 10094. Self-tapping screws are
used in fixing roof or side sheeting.
1.3 Statement of the problem
Failure modes of roof-sheet profiles are difficult to predict due to their complex behaviour
when subject to different types of loading and other factors such as material, stiffness,
handling during erection and support conditions; leading to high repair and maintenance
cost. To reduce the chances of failure, manufactures produce coils of steel roof-sheet
material in different grades of strength which usually range from 230 to 550 MPa
depending on the thickness of the sheet coil (Arcelor Mittal, 2015). The thinner sheets are
made from higher strength steel (550 MPa) and thicker sheets from a relatively lower
strength (230 MPa) steel. The stiffness is governed by the dimensions, corrugation and the
total cover width of the sheet profile. Excellent drainage pans and high production
efficiency are desirable, but the most important aspect that will reduce the cycle of repair
and maintenance is the sheet profile stiffness. Some manufactures incorporate rib stiffners
in the pans in order to increase the stiffness of the profile and to prevent buckling on the
pans.
1.4 Significance of the research
The significance of this research (conducted between 2013 and 2015) lies in both
engineering and economics. Much research has been done on the subject of roof sheeting,
covering the purlin and sheeting, environmental impacts, economic aspects and safety
(SANS 10162-1, 2011; Eurocode 3 – Part 1-3, 2005). This research probes improved IBR
sheet performance and cost.

7
1.5 Research objectives
The key objectives of this research are:
to determine the optimum dimensional parameters of an IBR sheet profile, that
would be used to simulate new and different IBR profiles made from standard
commercially available input sheet coils whilst satisfying the stiffness criterion;
and
to perform a cost analysis in order to determine the most economic simulated
profile.
1.6 Definitions of the terms used
In this dissertation:
An “optimal” sheet is defined as one which satisfies the strength and stability
criteria using the minimum material.
The “dimensional parameters” are the geometrical characteristics of the sheet
profile.
The “stiffness” is defined as the force per unit deflection of an IBR sheet profile,
or the extent to which it can resist deflection in response to the applied external
loads.
“Material cost” is the cost of input sheet coil from which the IBR sheet will be
made.
1.7 Structure of the document
This document has the following structure: Chapter 1 introduces the research topic and
Chapter 2 contains an overview of the literature. The methodology and structural theory
underlying the modelling of purlin and sheeting, including material, characteristics,
loading and design are presented in Chapter 3. Chapter 4 discusses the selection of
parameters and profiles used in the study. Chapter 5 presents the results and discussion
from the parametric study of the IBR sheet supported by the purlin, compared with the
existing solutions in the literature and design codes in practice. Chapter 6 presents overall
conclusions on the research and discusses topics requiring future research. Thereafter, a
comprehensive list of References is listed, followed by Appendix A and Appendix B
which derive the applied loads and present the Euler-Bernoulli beam theory.

8
2 LITERATURE REVIEW
This chapter presents an overview of the literature available and research that has been
done to date on different profile characteristics of corrugated or trapezoidal sheeting in
general. It also presents a synopsis of different types of corrugated and trapezoidal metal
roof sheeting and their importance and advantages as the preferred option over other types
of roofing.
2.1 Reasons for using inverted box rib roof sheeting
Metal roof sheets are available in a wide variety of designs, sizes, textures and colours; and
thus they are attractive and multipurpose (Yu & LaBoube, 2010). Metal roof sheeting is
“durable” as it is resilient to cracking and corrosion, and can endure extreme cold and hot
weather conditions. Thus it can last upwards of twenty years (Bergfelt, Edlund & Larsson,
1975). When it comes to constructability and installation, roof sheeting is relatively easy
and quick to install compared with reinforced concrete slabs and tiling.
There are various types of metal roof sheeting: namely, the sinusoidal corrugated sheet,
trapezoidal sheet, wide-span and IBR sheet (SAISC, 2013). The literature review revealed
little work has been published that compares these sheets with one another. Rather, each
type of sheet has been investigated separately by different researchers. IBR sheets have
been proved by different researchers to have a good strength-to-weight ratio, better water-
carrying capacity and are regarded as the most efficient sheet profile (Cousins Steel
International, 2015; ArcelorMittal, 2015).
2.2 Overview of the parametric studies performed on roof sheeting
Of interest are design and dimension type parameters. “Designtype” parameters can
include the material properties such as density, elastic modulus and weight. “Dimension
type” parameters can include the size and shape of the cross-section of the sheet. Different
authors followed different methods to study and investigate the parameters involved in the
design, manufacturing, construction and performance of the IBR sheet (Lee,
Mioduchowski & Faulkner, 1995; Chaudhary & Khan, 2015).
Most of the research done throughout the world is based on experiments and modelling
using Finite Element Methods (Mezzomo et al., 2010; Peng, Liew & Kitipornchai, 2006).
Lee et al. (1995) followed numerical procedures to design appropriate profiles that would

9
satisfy the imposed dimensional constraints and minimise bending stresses in the
trapezoidal sheet. Using the Finite Element Analysis software ANSYS, Mezzomo et al.
(2010) investigated the mechanical behaviour of roof sheeting and discovered the sheet
profile with the smallest displacement, high critical buckling load and maximum roof
covering area. Peng et al. (2006) have investigated the design parameters of both
corrugated and trapezoidal sheets, through studying the flexural properties in two
perpendicular directions of the sheet.
It was observed from most of the literature reviewed that the objective of parametric
studies is often to improve the load-carrying capacity of the profiled roof sheeting or to
optimise the sheet profile (Morgan & Beck, 1976; Balázs, Melcher & Horáček, 2015;
Balázs, Melcher & Horáček, 2012; Mezzomo et al., 2010). The cross-sectional shape of
the sheet profile is the key element in enhancing its stiffness as it controls the local,
distortional and global buckling modes (Sharafi, Teh & Muhammad, 2013). Sharafi et al.
(2013) considered sheets of different grades and different thicknesses along with a range of
wind speeds in order to optimize the dimensions of trapezoidal roof sheeting supporting
solar panels. Sivachenko and Broacha (1982) invented an improved profile for a
trapezoidal corrugated plate so as to optimize the moment of inertia and the section
modulus utilizing a given material. In using metamodelling for shape optimization,
Janushevskis, Melnikovs and Auzins (2015) obtained the cross-sectional shape of
corrugated sheets by a global stochastic search procedure in order to minimise the
displacement of the structure. Mahaarachchi and Mahendran (2009) investigated crest-
fixed thin trapezoidal sheets with closely spaced ribs subject to wind uplift. Graph theory,
combined with Ant Colony Optimization (ACO) algorithms, was used by Sharafi, Teh and
Muhammad (2014) in open and closed thin-walled steel sections and trapezoidal roof
sheeting with the objective of finding the optimum mass and stiffness.
However, in the results of the aforementioned research, a deficiency remains unanswered
regarding the relationship between the dimensional parameters of an IBR sheet and its
stiffness; thus prompting the research presented in this dissertation. Stiffness is an
important aspect in the design and performance of any structure. Since it is the desire of
every roof-sheeting manufacturer to reduce the input material cost, and hence the
production cost yet offer the stiffest sheet, this research also focused on the material cost of
IBR sheeting.
Having presented the literature review, the next chapter discusses the research
methodology.

10
3 RESEARCH METHODOLOGY
3.1 Introduction
This chapter outlines the steps that were followed in modelling and simulation of the
purlins, sheeting and screws. The Finite Element Method (FEM) as implemented in
Abaqus/CAE (referring to Complete Abaqus Environment) (Dassault Systemes SIMULIA,
2014) [hereinafter referred to as “Abaqus/CAE” in this document] was used.
3.1.1 Abaqus/CAE overview
Many commercial Finite Element Analysis (FEA) software packages are available for
analysis of roof structures. The FEA software, Abaqus/CAE (Dassault Systemes
SIMULIA, 2014), was used in the simulations performed in this research. Abaqus/CAE is
a well-known computer-aided engineering software used for the modelling and analysis of
mechanical components and assemblies. It has become popular in research and academic
institutions because of its large library of materials and elements and its ability to simulate
multi-dimensional problems. With Abaqus/CAE the user is able to create any form of
geometry using the graphical user interface (GUI), analyse and use the visualization
options to view, interpret or communicate the results from the model.
3.2 Finite Element Model in Abaqus/CAE
Figure 3.1 shows a flow diagram summarising the logic that was followed when the model
was developed in Abaqus/CAE.

11
3.2.1 Abaqus/CAE experimental setup
The components of the steel roof structure used in the experimental setup were the two
purlins, the IBR sheet with a constant 686 mm cover width and the screws. The purlins
were assumed to be 200 x 75 x 20 x 3 mm lipped Z-sections and were not varied in this
research. The purlins were spaced at 2200 mm since that is the recommended span for
single span IBR 686 sheets with 0.8 mm thickness and a Grade of 230 MPa (SAISC,
2013). An allowable deflection of span/200 ratio (SAISC, 2013) was used.
Selection of parameters
(refer to Chapter 4)
FEM Discretization
Inputs: - Material (elastic modulus, Poisson’s ratio and yield stress)
- Loading and boundary conditions
- Mesh
FEM Solution
Output: - Deflections
- Von Mises stress
Correlate with
the predictions? Done No Yes
Figure 3.1: Flow diagram of the development and application of the
Abaqus/CAE model used in this research

12
The purlins were assumed to be simply supported by the rafters. The sheet was also
assumed to be simply supported by the two purlins (Figure 3.2 (a)). In order to reduce the
computational time and due to symmetry, half of the structure shown in Figure 3.2 (a) was
modelled. This resulted in half the sheet span that equals 1100 mm and only one purlin
having to be considered as shown in Figure 3.2 (b). A slider was inserted in order to allow
for vertical movement but to prevent rotation and horizontal movement of the sheet at mid-
span.
Steel roof sheeting can be subject to a few common types of loading. In this research only
the wind uplift loading (W) on the IBR sheet will be considered as it is the most critical.
To simplify the process and reduce the computational time, only one sheet of 686 mm
cover width and a purlin span of 686 mm were used in the Abaqus/CAE experiments as
shown in Figure 3.2 (c).
3.2.1.1 Boundary conditions and coordinates system in Abaqus/CAE
The side edges of the sheet were free in the z-axis and y-axis directions, and restrained in
the x-axis direction to ensure that the cross-section maintained its shape during loading as
shown in Figure 3.2 (c). At mid-span, the sheet was sectioned due to symmetry and
supported with a vertical slider to allow for vertical movements in the y-axis and restrain
the longitudinal movements in the z-axis direction as shown in Figure 3.2 (b).
Coordinate system in Abaqus/CAE
Origin of the global coordinate system:
x: defined along the length of the purlin
(Deflection = U1, Rotation about x-axis = UR1)
y: defined along the height of the purlin and sheet
(Deflection = U2, Rotation about y-axis = UR2)
z: defined along the length of the sheet
(Deflection = U3, Rotation about z-axis = UR3)

13
Figure 3.2: Experimental setup of IBR sheet and a 200 x 75 x 20 x 3 mm
Z-section purlin in Abaqus/CAE
(a) A sheet supported by two purlins and modelled as a simply supported beam
∆ W
Pin support Roller support
Sheet
Z-purlin 200 x 75 x 20 x 3 mm Z-purlin 200 x 75 x 20 x 3 mm
Sheet
Sheet-span (L = 2200 mm)
Sheet-span (L = 2200 mm)
(c) Due to symmetry, one half of a sheet supported by a purlin was modelled in Abaqus/CAE
Sheet mid-span constraints: U3 = UR1 = UR2 = 0
Sheet side edges’ constraints: U1 = UR2 = UR3 = 0
Purlin pinned supports: U1 = U2 = U3 = 0
(b) One half of a sheet modelled as a simply supported beam due to symmetry
∆
W
Pin support
Sheet
Z-purlin 200 x 75 x 20 x 3 mm
Sheet Slider
L/2 = 1100 mm L/2 = 1100 mm

14
3.2.2 Creating purlin and sheet as parts in Abaqus/CAE
A Finite Element model for each IBR sheet profile (Chapter 4) was developed using
Abaqus/CAE (Dassault Systemes SIMULIA, 2014). Both the purlin and sheet were created
as separate parts and treated as three-dimensional deformable shell extrusions. A single
sheet was used and attached to the purlin, which took the same length as the width of that
single sheet. In all the models that were created, the sheet was connected to the purlin
through crests or ribs. The units adopted in Abaqus/CAE for this research were
millimetres (mm) and newtons (N).
3.2.3 Material and section properties
The material was assumed to have a tri-linear elastic-plastic behaviour, with elastic
modulus (E) and Poisson ratio (ν) of 200 x 103 N/mm
2 and 0.3, respectively. The
simplified stress-strain relationship adopted is shown in Figure 3.3 for material exhibiting
linear elasticity and Von Mises (Liu, 2005) plasticity. The discrepancies in the yield
strength – due to cold-forming and manufacturing of sheeting and purlins – were ignored.
Homogeneous shell-sections were utilized for both the sheet and purlin using the
Simpson’s integration rule.
Figure 3.3: Simplified stress-strain relationship for steel (after Case & Chilver, 1964;
Case, Chilver & Ross, 1999)
0
100
200
300
Str
ess
(M
Pa
)
Strain
E = 200 x 103 N/mm2
ν = 0.3
Plastic strain = 0.2 %
Yield stress, σy

15
3.2.4 Fastenings
3.2.4.1 Bolt heads and nuts
Circular partitions of 16 mm diameter were made on the sheet to resemble the bolt or
screw heads and on the top flange of the purlin to resemble the nuts as shown in
Figure 3.4 (a) and (b). Partitioning in Abaqus/CAE is a tool that is used to divide parts into
portions that can be treated separately. Kinematic couplings were created for all bolt heads
and nuts, with the translational movements restrained and the rotational movement
allowed. According to Abaqus/CAE, kinematic constraints are used when a large number
of nodes (also referred to as the “coupling nodes”) are constrained to rigid body motion of
a single node and the degrees of freedom at that constraint are selected individually in a
local coordinate system. In this case, the nodes in the bolt head and nut partitions were
constrained to the rigid body motion of the nodes at reference points RP-3 and RP-6,
respectively (Figure 3.4 (b)). A contact between the sheet and the purlin was created,
assuming frictionless conditions.
3.2.4.2 Bolts
The bolt or screw was modelled by the multi-point constraints (MPCs) using rigid links.
According to Abaqus/CAE, the MPCs are used to specify the linear and non-linear
constraints; and can offer a multi-point constraint between two points. In this case, the
MPCs are used as non-linear constraints between the reference points at the centres of the
bolt head and nut (for example, the connecting line between RP-3 and RP-6 in
Figure 3.4 (b)). The link provides a pinned but rigid connection between its two ends
(which are at the centres of the bolt head and nut) to keep the distance between the nodes
constant (this means that bolt length does not change).

16
16 mm diameter partition for bolt head
16 mm diameter partition for nut
Link (MP constraint)
as the bolt model
Reference points RP-3 & RP-6
(a)
(b)
Figure 3.4: Model for bolt heads, nuts and bolts

17
3.2.5 Modelling the loads in Abaqus/CAE
3.2.5.1 Wind uplift load
Abaqus/CAE automatically creates an initial step under which the boundary conditions are
defined. Next, the loading step is created in which the wind uplift load (W) is applied on
the top surfaces of the sheet as shown in Figure 3.5. The step is quasi-static with no time
effects. The non-linear geometric analysis option is chosen, and the increment step size is
set automatically. The computed uniform uplift pressure load is applied as a ramp until the
specified pressure is reached. During the parametric study (presented in Chapters 4 and 5),
the applied wind uplift load (W) is kept at a magnitude of 0.0016 N/mm2 in all the
experiments conducted. The calculation of the estimated wind uplift loading is presented in
Appendix A.
Figure 3.5: Wind uplift loading on the sheet
Uplift loading on the sheet top surface
IBR sheet Pin supports
200 x 75 x 20 x 3 mm Z-section purlin

18
3.2.5.2 Buckling load
Stability is an important aspect in the design and analysis of many structures including
shells. In this investigation, both the IBR sheet and purlin were modelled as 3-dimensional
shell structures, and it was necessary to perform a buckling strength assessment, especially
to determine the stability of the ribs of the IBR sheet.
The whole sheet was subject to a wind uplift loading (Figure 3.5), and the sheet
experienced a bending moment and thus a compression at the lower surfaces of the cross-
section. A stability study was conducted on the whole sheet, using eigenvalue buckling
analysis. Eigenvalue buckling analysis is a method used to estimate the critical load at
which the response of a structure will bifurcate (Dassault Systemes, 2014). The analysis is
based on the assumption that the response and behaviour of the structure before bifurcation
is linear; therefore, eigenvalue buckling analysis is useful for structures that undergo small
elastic deformations before buckling.
The linear perturbation step was created, during which a wind uplift load (W) of
0.0016 N/mm2 and a concentrated load of 834 N (the equivalent mass of a human weighing
85 kg, but SANS 10237 specifies 900 N) were applied to the sheet. The Lanczos
eigensolver in Abaqus/CAE was used and ten eigenvalues were requested in order to
reduce computational time.
Buckling due to (1) wind uplift loading and (2) concentrated load
Equations 3.1 and 3.2 were used to estimate the critical buckling loads, Wcr and Pcr, due to
wind uplift and concentrated load acting on the IBR sheet, respectively:
Wcr = λiW 3.1
Pcr = λiP 3.2
where:
W = The wind uplift load applied to the sheet during the linear
perturbation step
P = The concentrated load applied to the sheet during the linear
perturbation step

19
λi = The ith eigenvalue corresponding to the ith buckling failure
mode
Note that if:
λ > 1 Wcr > W or 𝑃𝑐𝑟 > P; Buckling is not predicted
λ = 1 Wcr = W or 𝑃𝑐𝑟 = P; Buckling is predicted
0 < λ < 1 Wcr < W or 𝑃𝑐𝑟 < P; Buckling will occur
−1 < λ < 0 Buckling is predicted if the load acts in the opposite direction
λ < −1 Buckling is not predicted.
For the detailed derivation of equations 3.1 and 3.2, the reader is referred to Abaqus/CAE
Documentation (Dassault Systemes, 2014).
Figure 3.6 shows the point of application of the concentrated load (P) acting on the middle
rib at mid-span of the IBR sheet.
The objective of the eigenvalue buckling analysis in this investigation was to:
predict the critical buckling load as a function of the rib-height (h) of an IBR sheet
with four pans, 33 mm rib-width (b) and 0.8 mm thickness.
establish the buckled mode shape of an IRB sheet with large values of rib-
height (h).
P
Figure 3.6: A schematic representation of the IBR sheet used in the buckling
analysis

20
3.2.6 Meshing technique
Since steel roof sheeting is thin, it is likely to experience large deformation and localized
yielding around the areas that are highly stressed. In order to account for this, a geometric
and material non-linear static analysis was carried out. The quadrilateral shell element with
six degrees of freedom at each node, S4R was chosen as the meshing element for the sheet
and the purlin as shown in Figure 3.7 (a) and (b). The element size was set to 10 mm after
a numerical convergence study was carried out. The element sizes considered in order to
reach convergence were 150 mm, 80 mm, 40 mm, 20 mm, 10 mm and 5 mm. The reduced
integration option was chosen in order to reduce the computation time and to improve the
accuracy of the results. The results of the convergence study are discussed and analysed in
Chapter 5.
Figure 3.7: Element S4R and typical mesh of the sheet and purlin
1
2
3
4
(a) IBR sheet and a 200 x 75 x 20 x 3 mmm
Z-section purlin meshed using element S4R
(b) Element S4R with four nodes labelled from 1 to 4
Purlin: Element size = 10 mm
Number of elements = 3111
IBR sheet: Element size = 10 mm
Number of elements = 11140

21
3.2.7 Data analysis and convergence study
3.2.7.1 Incrementation in Abaqus/CAE
The total time period for the step analysis in Abaqus/CAE is assumed to be 1 unit.
Abaqus/CAE divides this total time period into increments. For the general static step in
Abaqus/CAE the following options were considered:
o An automatic time increment option was chosen, which means Abaqus/CAE will
start the incrementation using the value chosen and entered as the ‘initial increment
size’. The sizes of the increments to follow are then chosen automatically by
Abaqus/CAE based on how fast the model converges.
o The initial time increment size was taken as 0.05 (5 % of the total step).
o The minimum time increment size was taken as 1 x 10⁻⁵
.
o The maximum time increment size was assumed to be equal to 1.
3.2.7.2 Deflection outputs
In every simulation that was performed, the deflections of the nodes at sheet mid-span
were recorded. The deflections were U1 in the x-direction, U2 in the y-direction and U3 in
the z-direction (Section 3.2.1.1).
3.3 Euler-Bernoulli beam theory
The Euler-Bernoulli beam theory, also called “classical” or “engineer’s” beam theory is
one of the simplest and most useful theories that provides a way of calculating the load-
carrying capacity and the deflection of the beam (Case et al., 1999). (For a derivation of
the Euler-Bernoulli beam theory, refer to Appendix B.) Although beams are generally
three-dimensional bodies, the Euler-Bernoulli theory presents a two-dimensional beam
model.
The Euler-Bernoulli beam theory (Case et al., 1999) was used to estimate the deflections in
order to validate the results from Abaqus/CAE. The Euler-Bernoulli beam theory was
chosen over other methods of calculating beam deflection because:

22
An IBR sheet supported by multiple purlins would behave as a 2-dimensional beam
on continuous supports, hence the beam theory was applied to solve for the
deflection of the IBR sheet.
In the Euler-Bernoulli beam theory, the internal energy is due to bending
deformation only, whilst Timoshenko’s (1953) beam theory considers the
contributions of the shear deformation (Beer et al., 2012). In this research only
bending deformation of the IBR sheet is considered.
The Euler-Bernoulli beam theory gives good results for normal or direct stresses
because of its capability to produce the bending-dominated deformations (Beer
et al., 2012).
Equation 3.3 is used to estimate the deflection (νc) of the sheet at mid-span (L/2) supported
by two purlins and subject to uplift wind loading.
Maximum deflection = vC (x =L
2) =
5WL4
384EI 3.3
Where
W = Applied wind uplift
L = Sheet span between adjacent purlins
I = Second moment of area of cross-section of the IBR sheet profile (Appendix B)
E = Elastic modulus
The methodology for this research was discussed in detail in this chapter. Selection of the
parameters researched is given in Chapter 4.

23
4 SELECTION OF PARAMETERS
4.1 Introduction
The influence of the profile parameters and thickness of a corrugated sheet on its overall
behaviour and performance is not well understood by designers and manufacturers.
“Corrugation”, which is the main source of sheet “stiffness”, is formed by the rises in
heights (called “ribs”), spaces in between the ribs (called “pans”) and the inclination angle
of the ribs’ vertical walls which is usually less than 90o. The design shape and sizes of each
profile parameter in any corrugated or trapezoidal sheet govern its failure modes and
overall performance.
This chapter selects the dimensional parameters that were used in the parametric study
conducted on an IBR corrugated sheet. This was achieved by first identifying the key
profile parameters to be varied, defining the range for each parameter, specifying the
constraints and then analysing and discussing the results of each parameter variation.
4.2 Key parameters
Figure 4.1 shows the cross-section of a typical IBR sheet. The profile parameters that were
varied were rib-height (h), rib-width (b), sheet thickness (t) and number of pans (n) per
686 mm cover width measured from centre to centre of each rib.
Other parameters which were studied but not shown in Figure 4.1 are the unfolded cover
width or the width when the ribs are flattened (B’) and the span ( 𝐿) of the sheet.
Pan-width (X’) Rib-width (b)
Cover width (B)
Rib-height (h)
IBR sheet
Corrugation angle (θ) Sheet thickness (t)
Figure 4.1: Cross-section of a typical IBR sheet (not drawn to scale)
Bottom rib-width (a)

24
Reasons for deciding on the key parameters
It should be noted from Equation 3.3 that the sheet deflection is inversely proportional to
the second moment of area (I). The formula for calculating the second moment of area is
presented in Appendix B. The second moment of area (I) of the cross-section of the IBR
sheet is affected by the dimensional parameters: rib-height (h), rib-width (b), number of
pans (n) per 686 mm cover width, sheet thickness (t) and the corrugation angle (θ). The
rib-height (h) and rib-width (b) are affected by the corrugation angle (θ) and thus the
corrugation angle (θ) is not an independent parameter and that is why it was not selected as
a key parameter to be varied. The pan-width (X’) was not varied because it depends on the
number of pans fitted in the cover-width. The bottom rib-width (a), which affects the
stability of the rib, was kept constant at a value of 59.5 mm in order reduce the number of
varying parameters in a rib during the analysis.
4.2.1 Variation of rib-height
The rib-height (h) was varied from 34 to 80 mm while keeping the rib-width (b), sheet
thickness (t) and number of pans (n) per 686 mm cover width constant at 33 mm, 0.8 mm
and four, respectively, as shown in Figure 4.2. A minimum rib-height (h) of 34 mm was
chosen to prevent the allowable sheet deflection from being exceeded, whilst the maximum
rib-height (h) of 80 mm was chosen in order to ensure that the required sheet width falls
within the sizes of the 925 mm input coil.
Figure 4.2: Rib-height varying from 34 to 80 mm
b
B
h IBR sheet
Rib-height (h) varied from 34 to 80 mm b = 33 mm
h

25
4.2.2 Variation of rib-width
The rib-width (b) was varied from 20 mm to 59.5 mm, whilst keeping the rib-height (h),
sheet thickness (t) and number of pans (n) per 686 mm cover width constant at 37 mm,
0.8 mm and four, respectively. Choosing a minimum rib-width (b) of 20 mm was to ensure
that the area around the bolt on the sheet is not too small; otherwise the top corners of the
rib will be under high stresses and might be susceptible to local buckling. A maximum rib-
width (b) of 59.5 mm was chosen so that the inclination angle of the rib does not exceed
90°. Figure 4.3 shows a single rib of different widths used in the analysis.
4.2.3 Variation of sheet thickness
The sheet thickness (t) was varied from 0.3 mm to 0.8 mm whilst keeping the rib-
height (h), rib-width (b) and number of pans (n) per 686 mm constant at 37 mm, 33 mm
and four, respectively. According to the SAISC Handbook (2013), the IBR sheet thickness
often varies from 0.3 mm for light industrial and residential buildings to 0.8 mm for heavy
industrial buildings.
Figure 4.3: Rib-widths varying from 26 to 59.5 mm
b
B
h = 37 mm IBR sheet
Rib-width (b) varied from 26 to 59.5 mm
Rib
b
h =
37
mm

26
4.2.4 Variation of number of pans
The number of pans (n) per 686 mm cover width in the single sheet was varied from three
to eight, while keeping the rib-height (h), rib-width (b) and sheet thickness (t) constant at
37 mm, 33 mm and 0.8 mm, respectively. The minimum number of pans (n) per 686 mm
cover width was chosen to be three in order to avoid excessive deflections in the sheet,
while the maximum number of pans (n) per 686 mm cover width was chosen to be eight in
order to have a minimum space between the ribs. Figure 4.4 shows the four profiles to
demonstrate the number of pans and sizes in each profile. B’ is the unfolded cover width of
the sheet also used as a measure of cost. It should be noted that the profile with the number
of pans n = 4, is the standard IBR 686 sheet.
4.2.5 Simultaneous variation of rib-height and rib-width
The rib-heights (h) and rib-widths (b) were simultaneously varied from 34 mm to 80 mm
and 20 mm to 59.5 mm, respectively. This was done in a single sheet whilst keeping the
Figure 4.4: Different IBR sheet profiles with three, four, six and eight pans

27
sheet thickness (t) and number of pans (n) per 686 mm cover width constant at 0.8 mm
and four, respectively. For every rib-width of 20 mm, 40 mm and 59.5 mm, the rib-height
was varied from 34 mm to 80 mm. Figure 4.5 presents an IBR sheet with a 20 mm rib-
width and the rib-height varying from 34 mm to 80 mm. Figure 4.6 shows an IBR sheet
with rib-width of 48 mm and the rib-height varying from 34 mm to 80 mm. The IBR sheet
with rib-width of 59.5 mm and the rib-height varying from 34 mm to 80 mm is shown in
Figure 4.7.
Figure 4.5: IBR sheet profiles with 20 mm rib-width and rib-height varying from
34 to 80 mm

28
Figure 4.6: IBR sheet profiles with 40 mm rib-width and rib-height varying
from 34 to 80 mm
Figure 4.7: IBR sheet profiles with 59.5 mm rib-width and rib-height varying
from 34 to 80 mm

29
4.2.6 Simultaneous variation of rib-height and number of pans
The rib-height (h) and number of pans (n) per 686 mm were simultaneously varied from
34 mm to 80 mm and three to eight, respectively. This was done whilst keeping rib-
width (b) and sheet thickness (t) constant at 33 mm and 0.8 mm, respectively. For every
number of pans (n) per 686 mm from three to eight, the rib-height was varied from 34 mm
to 80 mm as shown in Figures 4.8 to 4.11.
Figure 4.8: Sheet profiles with three pans and rib-height varying from 34 to
80 mm
Figure 4.9: Sheet profiles with four pans and rib-height varying from 34 to
80 mm

30
Figure 4.10: Sheet profiles with six pans and rib-height varying from 34 to
80 mm
Figure 4.11: Sheet profiles with eight pans and rib-height varying from 34 to
80 mm

31
4.2.7 Simultaneous variation of rib-width and number of pans
Lastly, the rib-width (b) and number of pans (n) per 686 mm were varied simultaneously
from 20 mm to 59.5 mm and three to eight, respectively. This variation was performed
whilst keeping the rib-height (h) and sheet thickness (t) constant at 37 mm and 0.8 mm,
respectively. For every number of pans (n) per 686 mm from three to eight, the rib-
width (b) was varied from 20 mm to 59.5 mm as shown in Figures 4.12 to 4.16.
Figure 4.12: Sheet profiles with three pans and rib-width varying from 20 to
59.5 mm
Figure 4.13: Sheet profiles with four pans and rib-width varying from 20 to
59.5 mm

32
In this chapter the parameters selected for variation were shown. The results, discussion
and analysis from the parametric variations are presented in Chapter 5.
Figure 4.14: Sheet profiles with six pans and rib-width varying from 20 to 59.5 mm
Figure 4.15: Sheet profiles with eight pans and rib-width varying from 20 to
59.5 mm
33
5 DISCUSSION AND ANALYSIS OF PARAMETRIC VARIATION
RESULTS
5.1 Introduction
In this chapter, the results of the parametric study are discussed and analysed. The effects
of the rib-height (h), rib-width (b), sheet thickness (t) and number of pans (n) per 686 mm
cover width on the deflection and performance of the IBR sheet are evaluated and
assessed. The combined effects of the parameters including the rib-height (h) and the rib-
width (b); the rib-height (h) and the number of pans (n), and the rib-width (b) and the
number of pans (n) are also evaluated and assessed.
5.2 Result implications of the convergence study
In order to determine the correct element size for meshing, a convergence study was
carried out. Figure 5.1 plots the deflection versus the number of elements in a typical
model. The standard IBR 686 sheet with rib-height of 37 mm, rib-width of 33 mm,
thickness of 0.8 mm and four pans was used to produce the plots shown in Figure 5.1. The
characteristic element sizes considered were 150, 80, 40, 20, 10 and 5 mm. Both the sheet
and the purlin were meshed using an S4R four-node quadrilateral linear element. At the
bolt-head and nut areas, the linear S3 triangular linear elements were used. The number of
elements plotted in Figure 5.1 refers to the total number of elements including both
the S4R and S3.
Convergence started to occur when the element size was 20 mm and the total number of
elements was 4,948. The 10 mm sized elements were used in this research, and resulted in
a mesh with 46,775 elements. Elements that were smaller than 10 mm gave slightly more
accurate results but the computational time increased significantly. An example is the
5 mm element which improved the deflection accuracy by 0.003 mm or 0.2 %, but the
computational time increased by approximately three minutes or 19 %.

34
Figure 5.1: Convergence study of the Finite Element mesh
The convergence study was also performed on a standard IBR 686 sheet to determine the
element size at which buckling will occur under wind uplift and concentrated load cases.
The characteristic element sizes considered were 50, 20, 10 and 5 mm. Results of the
convergence study are presented in Figure 5.2 for the wind uplift loading and Figure 5.3
for the concentrated load. The graphs in Figure 5.2 and Figure 5.3 plot the smallest
eigenvalues obtained versus the number of elements in the mesh.
Convergence started to occur at the 20 mm sized element, and the 10 mm sized elements
were used in the model. The total number of elements in the mesh was also affected by the
variation of the rib-height in each case. The eigenvalues (λ) obtained from the convergence
study are shown in Tables 5.1 and 5.2. The percentage error in Tables 5.1 and 5.2 indicates
how close the deflection value is to correct deflection value, which was the deflection
when the element was 5 mm in the mesh.
0
2
4
6
8
10
12
14
16
1.5
1.6
1.7
1.8
1.9
2
2.1
2.2
2.3
0
10
000
20
000
30
000
40
000
50
000
60
000
70
000
80
000
Co
mp
uta
tio
na
l ti
me (
min
ute
s)
Sh
eet
mid
-sp
an
defl
ecti
on
(m
m)
Number of elements Deflection
Computational time
Element size = 150
Element size = 5
Element size = 10
Element size = 20

35
Table 5.1: Eigenvalues calculated when rib-height and element sizes were varied
with the sheet subject to wind uplift
h
(mm)
50 mm
Element
20 mm
Element
10 mm
Element
5 mm
Element
λ
%
Error λ
%
Error λ
%
Error λ
37 2.95 60 1.23 3 1.2 1 1.19
40 3.11 59 1.31 2 1.29 1 1.28
50 3.63 56 1.68 4 1.62 1 1.61
60 4.13 52 2.05 3 2 1 1.98
74 5.33 52 2.68 4 2.59 1 2.56
80 5.89 52 2.96 4 2.86 1 2.83
Table 5.2: Eigenvalues calculated when rib-height and element sizes were varied
with the sheet subject to a concentrated load
h
(mm)
50 mm
Element
20 mm
Element
10 mm
Element
5 mm
Element
λ
%
Error λ
%
Error λ
%
Error λ
37 5.76 74 2.91 48 1.75 14 1.51
40 6.68 76 3.08 47 1.87 13 1.62
50 10.42 82 2.91 35 2.12 10 1.9
60 11.46 82 2.93 31 2.18 8 2.01
74 6.91 71 2.5 21 2.08 5 1.98
80 6.81 71 2.46 21 2.05 5 1.95

36
5.3 Effect of variation of rib-height
Figure 5.4 plots the sheet mid-span deflection versus the rib-height (h). The results are in
agreement with the predictions of Euler-Bernoulli beam theory. The difference in the
results from the two methods was 3 % on average and 7 % maximum. The results from
Finite Elements model are expected to be more accurate since the model is 3-dimensional.
The average discrepancy in the deflections is approximately 1 mm. The sheet mid-span
deflection decreased as the rib-height increased. The dashed line gives the allowable sheet
deflection, which is independent of the rib-height but depends on the sheet span, which
was taken as 2200 mm for a single-span sheet of thickness 0.8 mm (SAISC, 2013).
0
1
2
3
4
5
6
70
10
000
20
000
30
000
40
000
50
000
60
000
70
000
80
000
Eig
en
va
lue
Number of elements
h = 37 mm
h = 40 mm
h = 60 mm
h = 80 mm
0
1
2
3
4
5
6
7
8
9
0
10
000
20
000
30
000
40
000
50
000
60
000
70
000
80
000
Eig
en
va
lue
Number of elements
h = 37 mm
h = 40 mm
h = 60 mm
h = 80 mm
Figure 5.2: Convergence study for buckling
under wind uplift Figure 5.3: Convergence study for buckling
under concentrated load

37
Figure 5.4: Graph of sheet deflections versus rib-heights
From Figure 5.4 both the Finite Elements results and Euler-Bernoulli beam theory
decreased as the rib-height increased. This implies that as the rib-height increased the sheet
became stiffer, and since the load remained constant there was a decrease in the deflection.
Thus the profile with the highest rib-height had the greatest stiffness and experienced the
lowest deflections under a constant load. However, such profiles will be more expensive
since more material is used.
Table 5.3 presents a comparison between the performance of the profiles made from rib-
heights (h) of 37 mm and 74 mm.
Table 5.3: Effects on the deflection when the rib-height is doubled
Rib-height
(h)
(mm)
Sheet deflection (∆)
from
Finite Elements
(mm)
Percentage smaller
than allowable
deflection = 11 mm
(%)
Unfolded cover width
of the profile
(mm)
37 8.8 20 921
74 1.9 83 1 254
0
1
2
3
4
5
6
7
8
9
10
11
12
30 40 50 60 70 80 90
Defl
ecti
on
at
sheet
mid
-sp
an
(m
m)
Rib height (mm)
Finite
Elements
Allowable
deflection
Beam theory
Allowable deflection

38
If the rib-height (h) was doubled from 37 mm to 74 mm, the deflection (∆) decreased by
6.9 mm, which is approximately 80 %; the unfolded cover width of the respective profiles
increases by 287 mm, which represents an approximate 30 % increase in material.
When the rib-height was 74 mm to 80 mm, the discrepancies between the Finite Elements
and Euler-Bernoulli theory increased. It was assumed in Appendix B.2 that, according to
Euler-Bernoulli beam theory, plane sections originally normal to the longitudinal axis of
the beam before bending remain plane and normal to the longitudinal axis of the beam
after bending; and thus the internal strain energy of the beam is due to bending only.
According to Vlasov (1959) if the cross-section of a thin-walled beam is not rigid, internal
stresses are directly proportional to the internal strains. Vlasov’s (1959) criteria for thin-
walled beams are:
Thickness of the cross section
Depth of the cross section≤ 0.1 and
Depth of the cross section
Length of the beam member≤ 0.1
In this case, the sheet is 0.8 mm thick, 80 mm deep and 2200 mm in length:
0.8
80= 0.01 < 0.1 and
80
2200= 0.04 < 0.1
When the beam (or sheet in this case) satisfies the abovementioned criteria, it is regarded
as a “thin-walled beam”. For thin-walled beams, the Euler-Bernoulli assumption about
plane sections remaining plane and normal to the neutral axis does not hold according to
Vlasov (1959). Thin-walled beams experience distortion of the plane cross-section caused
by longitudinal displacements. It was also observed from Finite Elements outputs, that the
displacements in the longitudinal direction of the sheet were not zero and this was true at
all values of the rib-heights. The Euler-Bernoulli beam theory does not account for the
longitudinal displacements of the thin-walled beam section, hence the small discrepancy in
the results.
5.3.1 Buckling strength of the web
A buckling analysis was performed on the IBR sheet that had four pans (n = 4), a rib-
width (b) of 33 mm, thickness (t) of 0.8 mm and rib-height (h) of 37, 40, 50, 60, 74 and
80 mm.
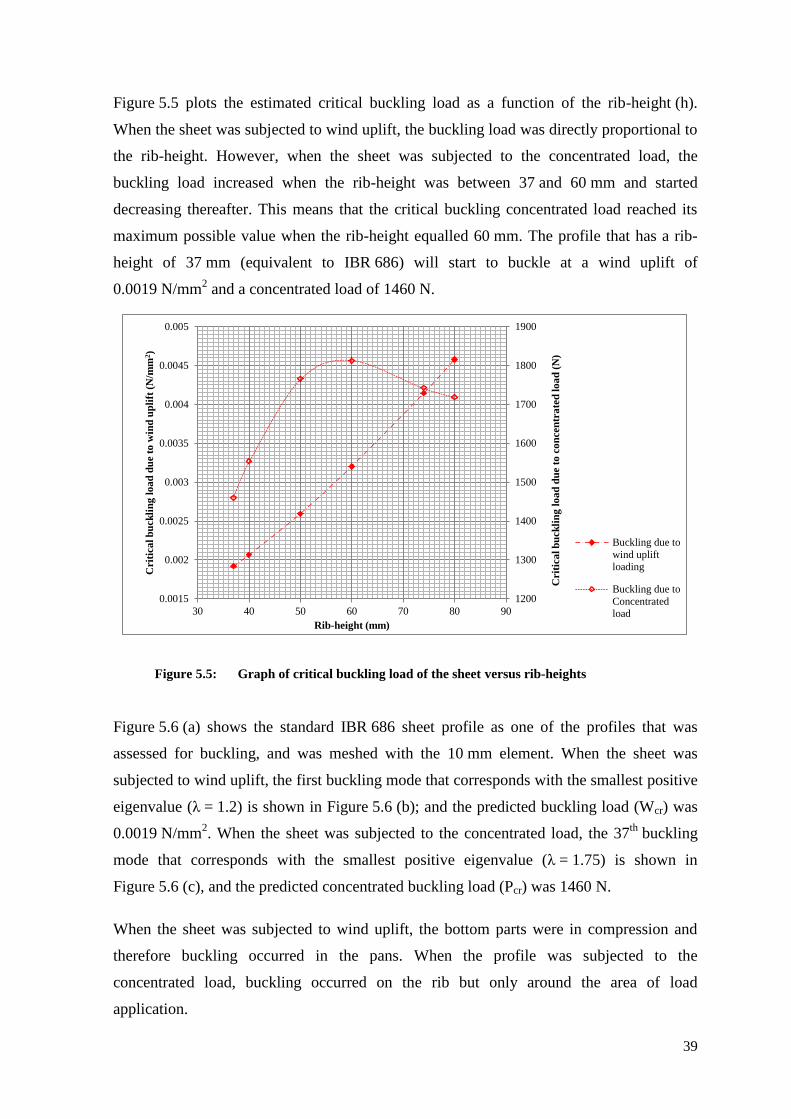
39
Figure 5.5 plots the estimated critical buckling load as a function of the rib-height (h).
When the sheet was subjected to wind uplift, the buckling load was directly proportional to
the rib-height. However, when the sheet was subjected to the concentrated load, the
buckling load increased when the rib-height was between 37 and 60 mm and started
decreasing thereafter. This means that the critical buckling concentrated load reached its
maximum possible value when the rib-height equalled 60 mm. The profile that has a rib-
height of 37 mm (equivalent to IBR 686) will start to buckle at a wind uplift of
0.0019 N/mm2 and a concentrated load of 1460 N.
Figure 5.5: Graph of critical buckling load of the sheet versus rib-heights
Figure 5.6 (a) shows the standard IBR 686 sheet profile as one of the profiles that was
assessed for buckling, and was meshed with the 10 mm element. When the sheet was
subjected to wind uplift, the first buckling mode that corresponds with the smallest positive
eigenvalue (λ = 1.2) is shown in Figure 5.6 (b); and the predicted buckling load (Wcr) was
0.0019 N/mm2. When the sheet was subjected to the concentrated load, the 37
th buckling
mode that corresponds with the smallest positive eigenvalue (λ = 1.75) is shown in
Figure 5.6 (c), and the predicted concentrated buckling load (Pcr) was 1460 N.
When the sheet was subjected to wind uplift, the bottom parts were in compression and
therefore buckling occurred in the pans. When the profile was subjected to the
concentrated load, buckling occurred on the rib but only around the area of load
application.
1200
1300
1400
1500
1600
1700
1800
1900
0.0015
0.002
0.0025
0.003
0.0035
0.004
0.0045
0.005
30 40 50 60 70 80 90
Crit
ica
l b
uck
lin
g l
oa
d d
ue t
o c
on
cen
tra
ted
lo
ad
(N
)
Crit
ica
l b
uck
lin
g l
oa
d d
ue t
o w
ind
up
lift
(N
/mm
2)
Rib-height (mm)
Buckling due to
wind upliftloading
Buckling due to
Concentratedload

40
Figure 5.6: Buckling modes of an IBR sheet subject to wind uplift and a
concentrated load
h = 37 mm
b = 33 mm
(b) First buckling mode of the profile shown in (a) subject to wind uplift
Cover width (B) = 686 mm
(a) A profile that was assessed for buckling
(c) The 37th buckling mode of the profile shown in (a) subject to a concentrated load

41
It should be noted that obtaining accuracy and performing checks on the numerical
experiment such as in Abaqus/CAE is difficult and confidence is based on good modelling
techniques and software outputs, such as choosing the correct element size and type for
meshing and deciding on the suitable boundary condition. It was presented in Tables 5.1
and 5.2 that the accuracy of the results increased with a finer mesh. The estimated buckling
loads from this investigation are theoretical and non-conservative because, in reality, the
erected IBR sheet’s buckling load is also influenced by its geometric and mechanical
imperfections, which often exhibit non-linear behaviour.
According to Sun and Spencer (2005), the buckling failure modes of a stiffened panel can
be categorised into three levels: local face/web plate buckling; unit corrugation buckling,
and entire/global corrugation buckling. At higher values of the rib-height (h), the profile
might experience local face/web buckling since the web becomes too slender.
5.4 Effect of variation of rib-width
Figure 5.7 plots the sheet mid-span deflection versus the rib-width (b). The profiles were
formed from the IBR sheet with the rib-width (b) varying from 20 mm to 59.5 mm. The
Finite Elements results follow a similar trend to the Euler-Bernoulli beam theory.
Figure 5.7: Graph of sheet mid-span deflection versus rib-width
9
10
11
12
15 20 25 30 35 40 45 50 55 60 65 70
Defl
ecti
on
at
sheet
mid
-sp
an
(m
m)
Rib-width (mm)
Finite Elements
Allowable
Deflection
Beam theory
Allowable deflection

42
The difference in the results from the Finite Elements and Euler-Bernoulli beam theory
was 0.5 % on average and 0.9 maximum. It was observed that the rib-width (b) had a small
effect on the sheet deflection. A sheet profile with a rib-width (b) of 26 mm experienced a
deflection of 11.2 mm, whilst the same profile – but with a rib-width of 52 mm –
experienced a deflection of 10.1 mm. This implies that doubling the size of the rib-width
produces a decrease of 1.1 mm or 9 % in the sheet deflection. For an IBR sheet with four
pans per 686 mm (n = 4), an increase of 26 mm in each rib-width (b) would lead to an
overall increase in the unfolded cover width of the sheet of approximately 112 mm, which
is approximately a 12 % increase in material. It is, therefore, recommended not to increase
the rib-width, but rather to keep it at a minimum because it has less impact on the
deflection but increases the material of the sheet substantially. The Finite Elements and the
allowable deflection graphs intersect when the rib-width, b = 23 mm, which is the
minimum rib-width one should choose for the profile subjected to 0.0016 N/mm2 used in
this study.
5.5 Effect of variation of sheet thickness
Figure 5.8 plots the sheet mid-span deflection versus the sheet thickness (t). The sheet
thickness (t) was varied from 0.3 mm to 0.8 mm. It was observed that the Finite Elements
results are in good agreement with the Euler-Bernoulli beam theory. The difference in the
Finite Elements and beam theory results was 15 % on average and 28 % maximum. The
graph illustrates that, at higher values of sheet thicknesses, the deflections are lower. The
thickest profile experienced the lowest deflections under the same load. The thicker the
sheet, the heavier it is, and the higher the cost of the input material required.

43
Figure 5.8: Graph of sheet mid-span deflection versus sheet thickness
5.6 Effect of variation of number of pans in a single sheet
Figure 5.9 plots the sheet mid-span deflection versus the number of pans (n) per 686 mm
(or per single sheet). The profiles were formed using an IBR sheet with the number of
pans (n) per 686 mm sheet width varying from three to eight.
Figure 5.9: Graph of sheet mid-span deflection versus number of pans in a single sheet
5
10
15
20
25
30
0.2 0.3 0.4 0.5 0.6 0.7 0.8 0.9 1 1.1 1.2
Defl
ecti
on
at
sheet
mid
-sp
an
(m
m)
Thickness of the sheet (mm)
Beam theory
Finite Elements
Allowable
Deflection
Allowable deflection
5
6
7
8
9
10
11
12
2 3 4 5 6 7 8 9
Defl
ecti
on
at
sheet
mid
-sp
an
(m
m)
Number of pans
Beam theory
Allowable
Deflection
Finite Elements
Allowable deflection

44
The Finite Elements results are in good agreement with the Euler-Bernoulli beam theory as
shown in Figure 5.9. The difference in the results from the Finite Elements and beam
theory was 0.3 % and 0.9 % maximum. The profile with eight pans (n = 8) was the stiffest.
In order to increase the number of pans (n) per 686 mm from four to eight, the unfolded
cover width (B’) of the sheet must be increased by 254.7 mm, which is an approximately
22 % increase in material. The sheet with four pans (n = 4) per 686 mm experienced a
deflection of 9 mm, whilst the sheet with eight pans (n = 8) per 686 mm experienced a
6.2 mm deflection, which is approximately a 31 % difference. It is thus advantageous to
have more ribs in a single sheet since this will reduce deflection although there will be a
substantial increase in material and production cost.
5.7 Effects of simultaneous variation of rib-height and rib-width
Figure 5.10 plots the sheet mid-span deflection versus the rib-height (h) at different values
of rib-width (b). The profiles were formed using an IBR sheet with rib-height (h) and rib-
width (b) simultaneously varied from 34 to 80 mm and 20 to 59.5 mm. The Finite
Elements results agreed with the predictions from the Euler-Bernoulli beam theory.
Figure 5.10: Graph of sheet mid-span deflection versus rib-height at different rib-widths
0
1
2
3
4
5
6
7
8
9
10
11
12
13
14
15
16
30 40 50 60 70 80 90
Mid
-sp
an
defl
ecti
on
of
the s
heet
(mm
)
Rib-height (mm)
b = 20 mm (Finite Elements)
b = 26 mm (Finite Elements)
b = 33 mm (Finite Elements)
b = 48 mm (Finite Elements)
b = 59.5 mm (Finite Elements)
b = 20 mm (Beam theory)
b = 26 mm (Beam theory)
b = 33 mm (Beam theory)
b = 48 mm (Beam theory)
b = 59.5 mm (Beam theory)
Allowable deflection
Allowable deflection
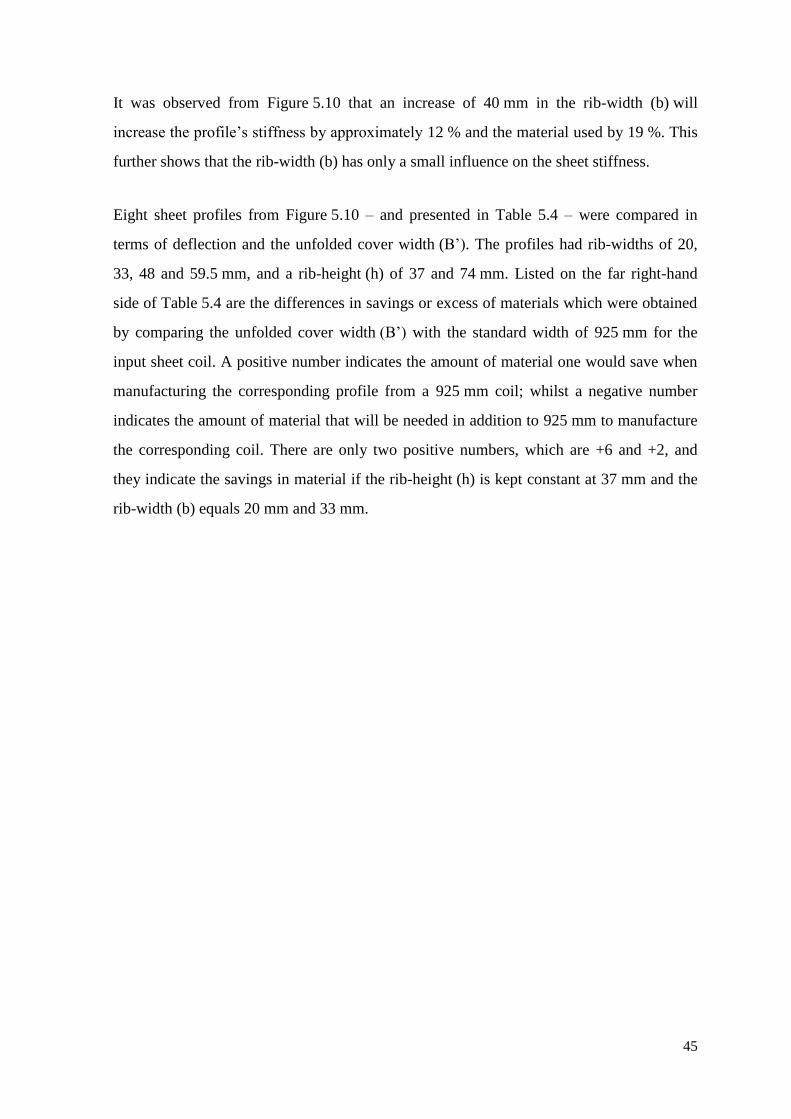
45
It was observed from Figure 5.10 that an increase of 40 mm in the rib-width (b) will
increase the profile’s stiffness by approximately 12 % and the material used by 19 %. This
further shows that the rib-width (b) has only a small influence on the sheet stiffness.
Eight sheet profiles from Figure 5.10 – and presented in Table 5.4 – were compared in
terms of deflection and the unfolded cover width (B’). The profiles had rib-widths of 20,
33, 48 and 59.5 mm, and a rib-height (h) of 37 and 74 mm. Listed on the far right-hand
side of Table 5.4 are the differences in savings or excess of materials which were obtained
by comparing the unfolded cover width (B’) with the standard width of 925 mm for the
input sheet coil. A positive number indicates the amount of material one would save when
manufacturing the corresponding profile from a 925 mm coil; whilst a negative number
indicates the amount of material that will be needed in addition to 925 mm to manufacture
the corresponding coil. There are only two positive numbers, which are +6 and +2, and
they indicate the savings in material if the rib-height (h) is kept constant at 37 mm and the
rib-width (b) equals 20 mm and 33 mm.
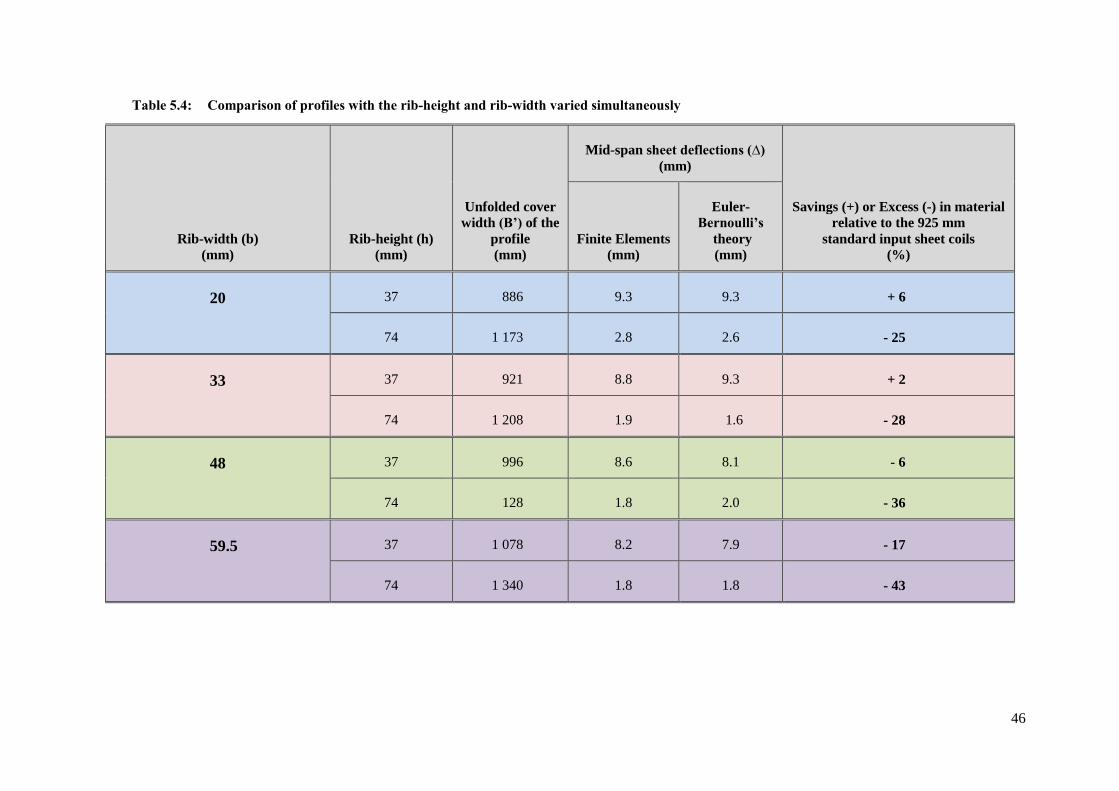
46
Table 5.4: Comparison of profiles with the rib-height and rib-width varied simultaneously
Rib-width (b)
(mm)
Rib-height (h)
(mm)
Unfolded cover
width (B’) of the
profile
(mm)
Mid-span sheet deflections (∆)
(mm)
Savings (+) or Excess (-) in material
relative to the 925 mm
standard input sheet coils
(%)
Finite Elements
(mm)
Euler-
Bernoulli’s
theory
(mm)
20 37 886 9.3 9.3 + 6
74 1 173 2.8 2.6 - 25
33 37 921 8.8 9.3 + 2
74 1 208 1.9 1.6 - 28
48 37 996 8.6 8.1 - 6
74 128 1.8 2.0 - 36
59.5 37 1 078 8.2 7.9 - 17
74 1 340 1.8 1.8 - 43

47
5.8 Effects of simultaneous variation of rib-height and number of pans
Figure 5.11 plots the sheet mid-span deflection versus the rib-height (h) at different
number of pans (n) per 686 mm cover width. The profiles were formed from an IBR sheet
with the rib-height (h) varied from 34 to 80 mm and the number of pans (n) from three
to eight.
Figure 5.11: Graph of sheet mid-span deflection versus rib-height at three, four, six and
eight pans in a single sheet
From Figure 5.11, eight sheet profiles were compared in terms of deflection and unfolded
width (B’). The profiles had a rib-height (h) of 37 mm and 74 mm and the number of
pans (n) varied from three to eight, as shown in Table 5.5. Out of the eight sheet profiles
that were compared, only two resulted in savings even though they have relatively higher
deflections. That is, the profiles with three pans and rib-height of 37 mm would save 3 %
of material if manufactured from a 925 mm coil; and doubling the rib-height would require
30 % of material in addition to 925 mm.
0
1
2
3
4
5
6
7
8
9
10
11
12
13
14
15
16
30 40 50 60 70 80 90
Mid
-sp
an
defl
ecti
on
of
the s
heet
(mm
)
Rib-height (mm)
Number of pans (n) = 3 (Finite Elements)
Number of pans (n) = 4 (Finite Elements)
Number of pans (n) = 6 (Finite Elements)
Number of pans (n) = 8 (Finite Elements)
Number of pans (n) = 3 (Beam theory)
Number of pans (n) = 4 (Beam theory)
Number of pans (n) = 6 (Beam theory)
Number of pans (n) = 8 (Beam theory)
Allowable deflections
Allowable deflection

48
Table 5.5: Comparison of profiles with varying rib-height and number of pans
Number of pans
(n)
Rib-height (h)
(mm)
Unfolded cover
width (B’) of the
profile
(mm)
Mid-span sheet deflections (∆)
(mm)
Savings (+) or Excess (-) in material
relative to the 925 mm
standard input sheet coils
(%)
Finite Elements
(mm)
Euler-
Bernoulli’s
theory
(mm)
3
37 915 12.6 12.8 + 3
74 1 202 3.1 3.0 - 30
4
37 921 8.8 9.3 + 2
74 1 208 1.9 1.6 - 36
6
37 1 071 7.1 7.9 - 14
74 1 574 1.5 1.2 - 67
8
37 1 175 6.3 6.8 - 25
74 1 822 1.2 1.01 - 94

49
5.9 Effects of simultaneous variation of rib-width and number of pans
Figure 5.12 plots sheet mid-span deflection versus number of pans (n) per 686 mm cover
width at different rib-widths (b). The profiles were formed from an IBR sheet with the rib-
width (b) and number of pans (n) per 686 mm cover width varied simultaneously from
20 to 59.5 mm and three to eight, respectively.
Figure 5.12: Graph of sheet mid-span deflection versus number of pans at different rib-
widths
From Figure 5.12, sixteen sheet profiles presented in Table 5.6 were compared in terms of
deflection and unfolded cover width (B’). The profiles had a rib-width (b) of 20, 33, 48 and
59.5 mm and the number of pans (n) varied from three to eight. It was observed from the
right-hand side column of Table 5.6 that only four profiles showed savings in material. By
reducing the rib-width (b) to 20 mm and keeping the rib-height (h) constant at 37 mm, one
would save 11 % and 6 % in materials from the profiles with three and four pans,
respectively. As was discussed in the previous sections, increasing the rib-width (b) will
result in more material being used with a relatively small increase in stiffness.
Of major interest is the sheet profile made up of four pans (n = 4), with a rib-width (b) of
23 mm which was found to be the ‘optimal’ IBR sheet profile, performing at almost the
same level as the standard IBR 686 sheet but offering approximately 5.1 % of material
saved.
0
1
2
3
4
5
6
7
8
9
10
11
12
13
14
15
16
2 3 4 5 6 7 8 9
Sh
eet
defl
ecti
on
at
mid
-sp
an
(m
m)
Number of pans (n)
b = 20 mm (Finite Elements)
b = 26 mm (Finite Elements)
b = 33 mm (Finite Elements)
b = 40 mm (Finite Elements)
b = 48 mm (Finite Elements)
b = 59.5 mm (Finite Elements)
b = 20 mm (Beam theory)
b = 26 mm (Beam theory)
b = 33 mm (Beam theory)
b = 40 mm (Beam theory)
b = 48 mm (Beam theory)
b = 59.5 mm (Beam theory)
Allowable deflection
Allowable deflection

50
Table 5.6: Comparison of profiles with varying rib-width and number of pans
Number of pans
(n)
Rib-width (b)
(mm)
Unfolded cover
width (B’) of the
profile
(mm)
Mid-span sheet deflections (∆)
(mm)
Savings (+) or Excess (-) in material
relative to the 925 mm
standard input sheet coils
(%)
Finite
Elements
(mm)
Euler-
Bernoulli’s
theory
(mm)
3 20 836 15.4 15.8 + 11
33 915 12.6 12.8 + 3
48 975 10.6 10.7 - 4
59.5 1 021 10.2 10.4 - 9
4 20 886 11.5 12.0 + 6
33 921 8.8 9.3 + 2
48 995 8.0 8.1 - 6
59.5 1 053 7.5 8.0 - 12
6 20 1 022 8.2 8.1 - 9
33 1 071 7.1 7.9 - 14
48 1 176 5.1 5.4 - 25
59.5 1 256 4.8 5.2 - 34
8 20 1 112 6.3 6.3 - 18
33 1 175 6.2 6.2 - 20
48 1 310 3.8 4.0 - 39
59.5 1 414 3.5 3.9 - 50

51
In concluding the parametric study, the following dimensional parameters of IBR sheet
profile were found to be optimum:
Rib-height, h = 34 mm
A rib-height that equalled 34 mm produced the required strength. Choosing higher
values might lead to buckling or yield failure.
Rib-width, b = 23 mm
This was found to be the optimal parameter of the profile, because its variation had
a minor influence on the stiffness yet affected material and cost substantially.
Under the given loading conditions the profile with a rib-width of 23 mm had a
deflection which was less than the allowable deflection by 2 %. The rib-width of
23 mm resulted in 5.1 % savings in material and cost.
Number of pans
The number of pans affects the total cover width and the number of sheets required
to cover the total roof area as well as the number of overlaps. The more pans there
are in a sheet, the smaller the pan width and the cover width; resulting in higher
labour costs due to many overlaps and increased material cost.
Sheet thickness
The thickness of the ‘optimal’ IBR sheet depends on the purpose and use of the
building on which it will be affixed.
5.10 Cost analysis
In this section the optimum parameters were used to simulate new and different profiles
from the standard commercially available input sheet coils. The input sheet coil comes in
different widths, which are: 925, 940, 1000, 1175, 1219, 1225, 1250 and 1320 mm
(Arcelor Mittal, 2015). Figure 5.13 plots the width/thickness extras cost of the commercial
input sheet coils versus the standard coil widths. The cost in Figure 5.13 was quoted by
Arcelor Mittal based on the width of the galvanized coil, but the extras such as grading,
thickness, zinc coating, surface finish and packaging were omitted (Arcelor Mittal, 2015).
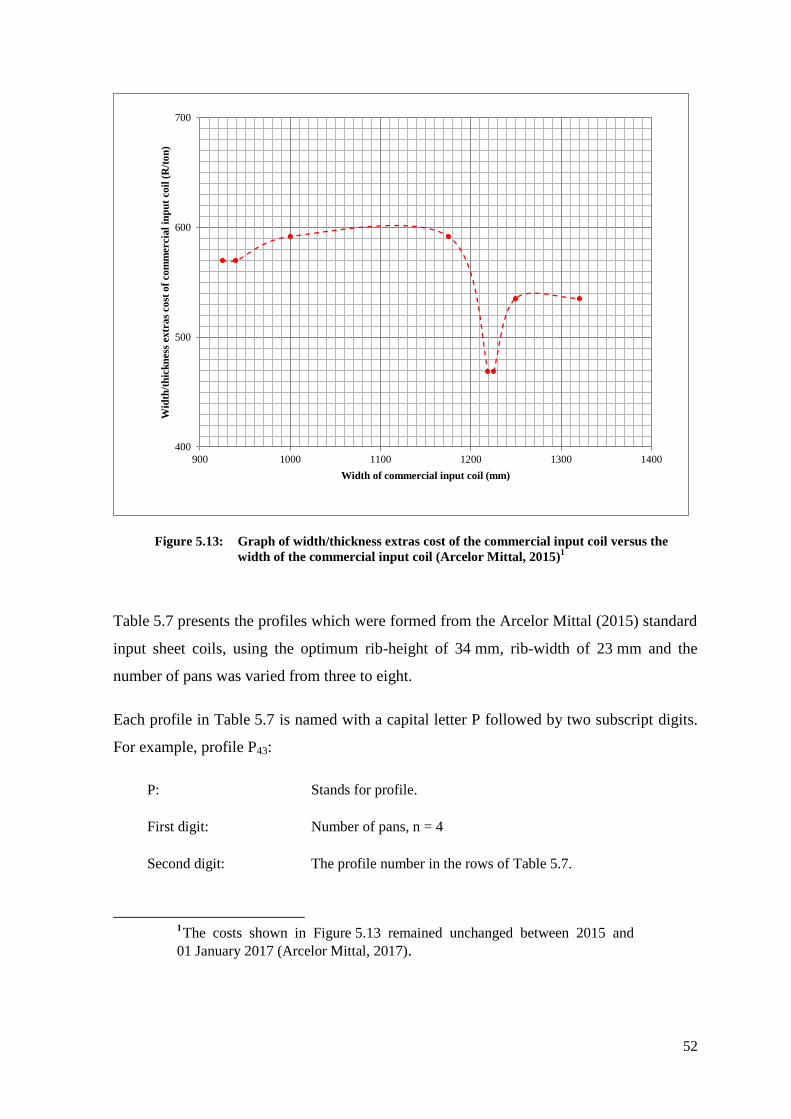
52
Figure 5.13: Graph of width/thickness extras cost of the commercial input coil versus the
width of the commercial input coil (Arcelor Mittal, 2015)1
Table 5.7 presents the profiles which were formed from the Arcelor Mittal (2015) standard
input sheet coils, using the optimum rib-height of 34 mm, rib-width of 23 mm and the
number of pans was varied from three to eight.
Each profile in Table 5.7 is named with a capital letter P followed by two subscript digits.
For example, profile P43:
P: Stands for profile.
First digit: Number of pans, n = 4
Second digit: The profile number in the rows of Table 5.7.
1The costs shown in Figure 5.13 remained unchanged between 2015 and
01 January 2017 (Arcelor Mittal, 2017).
400
500
600
700
900 1000 1100 1200 1300 1400
Wid
th/t
hic
kn
ess
extr
as
co
st o
f co
mm
ercia
l in
pu
t co
il (
R/t
on
)
Width of commercial input coil (mm)

53
Table 5.7: Profiles simulated from the optimum parameters
Input
coil
width
(mm)
n = 3 n = 4 n = 5 n = 6 n = 7 n = 8
Pro-
file
Name
Pan
width
(X')
(mm)
Cover
width
(B)
(mm)
Pro-
file
Name
Pan
width
(X')
(mm)
Cover
width
(B)
(mm)
Pro-
file
Name
Pan
width
(X')
(mm)
Cover
width
(B)
(mm)
Pro-
file
Name
Pan
width
(X')
(mm)
Cover
width
(B)
(mm)
Pro-
file
Name
Pan
width
(X')
(mm)
Cover
width
(B)
(mm)
Pro-
file
Name
Pan
width
(X')
(mm)
Cover
width
(B)
(mm)
925 P31 190 779 P41 116 743 P51 72 707 P61 42 671 P71 21 635 P81 5 599
940 P32 195 794 P42 120 758 P52 75 722 P62 45 686 P72 23 650 P82 7 614
1 000 P33 215 854 P43 135 818 P53 87 782 P63 55 746 P73 32 710 P83 15 675
1 175 P34 273 1 029 P44 179 993 P54 122 957 P64 84 921 P74 57 885 P84 37 849
1 219 P35 288 1 073 P45 190 1 037 P55 131 1 001 P65 91 965 P75 63 929 P85 42 893
1 225 P36 290 1 079 P46 191 1 043 P56 132 1 007 P66 92 971 P76 64 935 P86 43 899
1 250 P37 298 1 104 P47 198 1 068 P57 137 1 032 P67 97 996 P77 68 960 P87 46 924
1 320 P38 322 1 174 P48 215 1 138 P58 151 1 102 P68 108 1 066 P78 78 1 030 P88 55 994

54
In Table 5.7 all profiles that are to the right of – and including the highlighted cells – meet
the stiffness criterion. The profiles that are highlighted are economical. As mentioned
before, the narrower sheet will lead to the requirement of many sheets and many overlaps.
The pan width also decreases as the number of pans increases, and the disadvantage of a
sheet with narrow pans is poor drainage that requires a steep roof and thus a greater
sheeting length.
Figure 5.14 plots sheet deflection against the number of pans for all the profiles shown in
Table 5.7. The sheet profiles which satisfy the stiffness criterion are those below the
dashed line. The number of pans in each profile was restricted to a maximum of eight
(n = 8) as indicated by the dotted line in Figure 5.14. Six profiles from each coil were
simulated, giving a total of 48 profiles (listed in Table 5.7). From Figure 5.14, the profiles
below and closest to the line of allowable deflection are the most economical and are
highlighted in Table 5.7.
Figure 5.14: Graph of sheet deflection versus number of pans, indicating the profiles which
satisfy the strength criteria
0
2
4
6
8
10
12
14
16
18
20
22
2 3 4 5 6 7 8 9
Sh
eet
defl
ecti
on
s (m
m)
Number of pans
925 mm Coil
940 mm Coil
1000 mm Coil
1175 mm Coil
1219 mm Coil
1225 mm Coil
1250 mm Coil
1320 mm Coil
Allowable deflection
Limit on the number of pans
Stiffness criterion not satisfied
Stiffness criterion satisfied

55
Figure 5.15 plots the cover width of the highlighted profiles in Table 5.7 against the cost of
roof covering, using projections from Figure 5.13.
Figure 5.15: Graph of cover width against cost
In Figure 5.15 the most economical profile is P67. It is made from a 1250 mm coil, and has
six pans and a 97 mm pan width (Table 5.7) and offers a 996 mm cover width. The ribs are
34 mm high, 23 mm wide at the top and spaced at 166 mm centres. Figure 5.16 shows the
fully dimensioned sketch of profile P67.
With respect to cover width, profile P67 is second best to P68 by 7 %. A wider sheet leads to
fewer sheets and fewer overlaps, and thus savings on labour cost. Profile P67 also offers
80 % efficiency on production. Efficiency is the ratio of cover width to the width of the
coil and it measures the amount of cover produced from the original coil width in order to
5
5.5
6
6.5
7
7.5
8
600 700 800 900 1000 1100 1200
Wid
th/t
hic
kn
ess
extr
as
co
st (
R/m
2 )
Cover width (mm)
Profile P41
Profile P42
Profile P53
Profile P54
Profile P66
Profile P68
Profile P65
Profile P67

56
avoid waste and expenses. This means that 80 % of the original coil width is used up to
produce cover and 20 % to produce ribs and thus stiffness.
Profile P67 also offers good stiffness characteristics because it deflects 9.81 mm under the
applied load.
Table 5.8 presents the recommended purlin spacing to support profile P67 over a single,
internal and end spans. The purlin spacing was obtained though iterative testing in
Abaqus/CAE based on the computed uplift loading of 0.0016 N/mm2 and a roof pitch
of 5°. The purlin spacing was varied from 600 to 3000 mm in 300 mm increments and two
sheet thicknesses were considered: 0.5 and 0.8 mm. For both sheet thicknesses, the single
span controls the design and the thicker sheet can have a larger span.
Table 5.8: Recommended purlin spacing to support profile P67
Maximum recommended purlin spacing (mm)
Type of span Sheet thickness = 0.5 mm Sheet thickness = 0.8 mm
Single span 1 510 2 130
Internal span 2 360 2 550
End span 2 095 2 290
Mass (kg/m2)
3.93 6.28
Figure 5.16: Profile P67 (not drawn to scale)
b = 23 mm
Cover width = 996 mm
h = 34 mm X’=97 mm
Overall width = 1034 mm
166 mm

57
6 CONCLUSIONS, LIMITATIONS AND RECOMMENDATIONS
6.1 Summary of the research
This dissertation presented a parametric study on IBR sheet profile supported by purlins
and subject to wind uplift loading. This was done by using Finite Element Methods and
Abaqus/CAE. The first objective of the study was to obtain the optimum dimension
parameters that would be used to simulate new and different IBR profiles from standard sheet
input coils whilst satisfying the stiffness criterion. The second objective was to perform a cost
analysis in order to determine the most economical simulated profile.
The dimensional parameters were the rib-height (h), rib-width (b), number of pans (n) per
686 mm cover width and thickness (t) of the profile of the IBR sheet. Each parameter was
varied within a specific range. The rib-height (h) was varied from 34 mm to 80 mm; the
rib-width (b) from 20 mm to 59.5 mm; the number of pans (n) per 686 mm cover width
from three to eight, and sheet thickness (t) was varied from 0.3 mm to 0.8 mm. Each of
these parameters was varied whilst the others were kept constant, thus forming different
IBR sheet profiles.
The results showed that increasing the rib-height (h) increases the depth of the cross-
section of the profile, resulting in increased stiffness. Therefore, at large values of rib-
height (h) (approximately 70 mm or more), the sheet deflection was relatively low, but the
material required increased. No part of the sheet exceeded the yield stress even at smaller
values of rib-height (approximately 34 mm). It was evident that the area around the bolts
was the most stressed.
The rib-width (b) was found to be the deciding parameter of the profile because, although
its variation had minor influence on the stiffness, it affected the material size required and
thus the cost of the input coil. The ribs that are wider at the top might buckle under
concentrated loads. Therefore, the rib-width (b) must be kept at a minimum, in order to
avoid an unnecessary increase in the material needed with little or no increase in the
stiffness of the profile. In contrast, increasing the sheet thickness (t) increased the stiffness,
resulting in smaller deflections. Undoubtedly, thinner sheets will be more prone to local
buckling and indentation compared with thicker sheets. The standard IBR 686 sheet has
four pans, which offer sufficient stiffness and excellent drainage or water-carrying

58
capacity. Therefore, it makes sense to limit the number of pans (n) to the minimum number
that will produce sufficient stiffness, because increasing the number of pans will result in
an increase in cost.
The optimum parameters were found to be a rib-height (h) of 37 mm and a rib-width (b) of
23 mm. The optimum parameters were used to simulate new and different sheets from the
standard commercially available sheet coil widths of 925, 940, 1000, 1175, 1219, 1225,
1250 and 1320 mm. The simulated profiles were assessed against the stiffness criterion and
cost. The profile made from a 1250 mm wide sheet coil, with six 97 mm wide pans, ribs
spaced at 166 mm centres and a 996 mm cover width was found to be the most
economical. This profile has 80 % efficiency and is 10 % less expensive than the next best
profile.
6.2 Limitations of the research
Limitations of this research originated in the study design:
For each dimensional parameter that was varied there were few profiles
formed and thus many profiles to model. Physical tests as recommended in
SANS 10237 were not performed to verify the results.
Many parameters affect the behaviour and failure modes of roof sheeting.
Examples include: external parameters (such as types and magnitudes of
loading; fixing and assembly of components); design parameters (such as
connections, spacing and behaviour of purlins), material, and dimensional
parameters of the profile (such as size and shape). Although all the above
parameters affect or influence one another, it was not possible to incorporate
all of them into the numerical experiments conducted.
Further, this research did not address the following:
Mechanical contact between the sheet and the purlins, including slip or
friction.
The influence of other open, thin-walled often-used purlin sections, except
the Z-section, on the behaviour and deflection of the IBR sheet.
The deflections and behaviour of the purlin.

59
The effects of gravity and other types of loadings on roof sheeting.
6.3 Recommendations for future research
It is recommended that the economical profiles presented in Table 5.7 be tested physically
under different types of loading as recommended in SANS 10237. The findings will be
useful in determining the purlin spacing and methods of sheet fixing.
A more accurate estimate of the critical buckling load of an IBR sheet influenced by its
profile parameters could be obtained using non-linear buckling analysis methods such as
Von Karman’s theory (Landau and Lifshitz, 1970) or Winter’s theory (Chajes and Winter,
1965), which incorporate geometric and mechanical non-linearities.

60
REFERENCES
ArcelorMittal. (2015). Extras List 140 Galvanised Sheet in Coil, 1-11. Available:
https://www.google.co.za/?gws_rd=ssl#q=ArcelorMittal.++++(2015).++++Extras+list+140+Galvanised+
sheet+in+coil%2C+1+11
[Accessed: 29 November 2015.]
ArcelorMittal. (2017). Extras List 140 Galvanised Sheet in Coil, 1-11. Available:
https://www.google.co.za/?gws_rd=ssl#q=ArcelorMittal.++++(2017).++++Extras+list+140+Galvanised+
sheet+in+coil%2C+1+11
[Accessed: 13 January 2017.]
Balázs, I., Melcher, J. & Horáček, M. (2015). Stabilization of Beams by Trapezoidal Sheeting:
Parametric Study. Recent Advances in Engineering.
Balázs, I., Melcher, J. & Horáček, M. (2012). Stabilization of Beams by Trapezoidal Sheeting:
Parametric Study. In: Proceedings of the 3rd European Conference of Civil Engineering (ECCIE '12).
Advances in Mathematical and Computational Methods. Paris, France.
Balex Metal. (2011). Trapezoidal Sheets – Technical Catalogue. Poland: Bolszewo. pp1-125.
Beer, F.P., Johnston Jr., E.R., De Wolf, J.T. & Mazurek, D.F. (2012). Mechanics of Materials.
Sixth Edition. New York: McGraw-Hill Companies.
Bergfelt, A., Edlund, B. & Larsson H. (1975). Experiments on trapezoidal steel sheets in bending.
Third International Speciality Conference on Cold-Formed Steel Structures. Paper 4. Missouri
University of Science and Technology.
Bhatt, P. (1999) Structures. Fourth Edition. Harlow: Longman.
Case, J. & Chilver, A.H. (1964). Strength of Materials – An Introduction to the Analysis of Stress
and Strain. London: Edward Arnold Publishers.
Case, J. Chilver, Lord A.H. & Ross, C.T.F. (1999). Strength of Materials and Structures. Fourth
Edition. Butterworth Heinemann Publications.
Chajes, A. & Winter G. (1965). Torsional flexural buckling of thin-walled members, ASCE J.
Structural Division 91(04):103-124.
Chaudhary, A.S. & Khan S.N. (2015). A parametric study on the effect of trapezoidal web profile on
the angle of twist of steel I-beam for eccentric loading, International Journal of Advanced Technology
in Engineering and Science, 3(01):273-279.
Cousins Steel International. (2015). Product Brochure.
Available: http://cousinssteel.co.za/686-ibr-profile
[Accessed: 17 January 2016.]

61
Dassault Systemes SIMULIA, Abaqus/CAE. (2014). Version 6.14-1. Available:
https://www.google.co.za/?gws_rd=ssl#q=Dassault+Systemes+SIMULIA,+Abaqus/CAE+(2014)+Versio
n+6.14-1&nfpr=1
[Accessed: 17 October 2015.]
Eurocode 3 – Design of steel structures – Part 1-3: General rules – Supplementary rules for cold-formed
members and sheeting. (2005). Brussels: European Committee for Standardization.
Global Roofing Solutions. (2016). Our Products.
Available: http://www.globalroofs.co.za/portfolio/ibr-686-890/
[Accessed: 04 March 2016.]
Janushevskis, A., Melnikovs, A. & Auzins, J. (2015) Investigation of mechanical behaviour and
shape optimization of roofing sheets using metamodels. Journal of International Scientific Publications,
9:216-226.
Jewett Jr, J.W. & Serway, R.A (2004). Physics for Scientists and Engineers with Modern Physics.
Sixth Edition. Belmont CA: Thomson Learning Academic Centre.
Landau, L.D. , Pitaevskii, L.P., Kosevich, A.M. & Lifshitz E.M. (1970). Theory of elasticity.
Second Edition. Moscow: Pergamon Press.
Lee, C.L., Mioduchowski, A. & Faulkner, M.G. (1995). Optimization of corrugated cladding,
Journal of Structural Engineering, 121(8):1190-1196.
Liu, A.F., (2005). Mechanics and mechanisms of fracture. First Edition. Materials Park, Ohio:
ASM International
Mahaarachchi, D. & Mahendran, M. (2009). Wind uplift strength of trapezoidal steel cladding with
closely spaced ribs. Journal of Wind Engineering and Industrial Aerodynamics, 97(3):140-150.
Metsec. (2016). Cold Rolled Steel Purlins: Purlin and Side Rail Systems.
Available: http://www.metsec.com/purlins/
[Accessed: 01 March 2016.]
Mezzomo, G.P., Iturrioz, I., Grigoletti, G. & Gomes, H.M. (2010). Investigation of the mechanical
behavior of trapezoidal roofing sheets using genetic algorithms. Expert Systems with Applications,
37(2):939-948.
Morgan, J. & Beck, V.R. (1976). Failure of sheet metal roofing under repeated wind loading.
[Online]. Proceedings of the Annual Engineering Conference (1976): Engineering 1976-2001.
Townsville, Queensland. Available:
http://search.informit.com.au/documentSummary;dn=570969545478188;res=IELENG
[Accessed: 12 March 2015.]
Peng, L.X., Liew, K.M. & Kitipornchai, S. (2006). Analysis of stiffened corrugated plates based on
the FSDT via the mesh-free method. International Journal of Mechanical Sciences, 49(3):364-378.

62
Robra, J. & Luza, G. (2008). Design of Z-purlins: Part 1 – Basics and cross-section values according
to EN 1993-1-3; EUROSTEEL 2008. In: Proceedings of the 5th European Conference on Steel and
Composite Structures. Graz, Austria: EUROSTEEL. Vol. A, pp129-134.
SAFINTRA (2012). TUFDEK IBR Brochure. Available: www.safintra.com
[Accessed: 16 March 2015.]
SANS 10094. (2005) The use of high-strength friction-grip bolts. Edition 4. Pretoria: Standards
South Africa.
SANS 10160-3. (2011) Basis of Structural Design and Actions for Buildings and Industrial
Structures. Edition 1.1. Pretoria: Standards South Africa.
SANS 10162:-Part 1. (2011) The Structural Use of Steel Part 1: Limit-States Design of Hot-Rolled
Steelwork. Edition 2.1. Pretoria: Standards South Africa.
SANS 10162:-Part 2. (2011). The Structural Use of Steel Part 2: Cold-Formed Steel Structures.
Edition 2. Pretoria: Standards South Africa.
SANS 10237. (1991). Roof and side cladding. Edition 1. Pretoria: Standards South Africa.
SANS 1700:5-1. (2010). Fasteners Part 5: General Requirements and Mechanical Properties
Section 1: Mechanical Properties of Fasteners made of Carbon Steel and Alloy Steel – Bolts, Screws and
Studs. Edition 2. Pretoria: Standards South Africa.
Sharafi, P., Teh, L.H. & Muhammad N.S.H. (2013). Sizing optimization of trapezoidal corrugated
roof sheeting supporting solar panels under wind loading. In: Conference Proceedings of the Society
for Experimental Mechanics Series, 4:535-542.
Sharafi, P., Teh, L.H. & Muhammad N.S.H. (2014). Shape optimization of thin-walled steel
sections using graph theory and ACO algorithms. Journal of Construction Steel Research,
101:331-341.
Sivachenko, E.W. & Broacha F.H. (1982). Corrugated Plate having Variable Material Thickness
and Method for Making Same. U.S Patent No. 4, 317-350. Alexandria VA: United States Patent and
Trademark Office.
SAISC (Southern African Institute of Steel Construction) (2013) The Southern African Steel
Construction Handbook. Eighth edition. Johannesburg: Southern African Institute of Steel
Construction.
Sun, H. & Spencer, J. (2005). Buckling strength of assessment of corrugated panels in offshore
structure. Marine Structures, 18(7-8):548-565.
Timoshenko, T. (1953). History of Strength of Materials. New York: McGraw-Hill Books.
Vieira Jr, L.C.M., Malite, M. & Schafer, B.W. (2008). A numerical analysis of cold-formed steel
purlin-sheeting systems. In: Proceedings of the Fifth International Conference on Thin-Walled
Structures, Australia.

63
Vlasov, V.Z. (1959) Thin-walled elastic beams. Second edition (translated from Russian).
Published for the National Science Foundation, Washington DC and the Department of Commerce, USA
by the Israel Program for Scientific Translations, Jerusalem 1961.
Yu, W.W. & LaBoube, R.A. (2010). Cold-Formed Steel Design. Fourth Edition. Hoboken NJ:
Wiley.

64
APPENDIX A:
DERIVATION OF THE APPLIED LOADS
There are a few common types of loading that metal roof sheeting experience, such as the
self-weight of the roof, human and equipment loading during construction and
maintenance, snow and rain, services or imposed loads and wind uplift. A number of
researchers (Mahaarachchi & Mahendran, 2009; Vieira Jr, Malite & Schafer, 2008) have
focused on the performance and design of roof-sheeting components subject to uplift
loading only, since it has been considered the critical case.
In this research, the IBR sheet was subject to uplift loading in all model cases considered,
except during the buckling assessment where a concentrated load was also applied.
A.1 Estimation of the magnitude of the applied load (W)
A.1.1 Specifications
The roof is for a 48 m long warehouse with portal frames at 6 m centres.
The building is situated in Johannesburg, on flat ground, and assumed to be
surrounded by open terrain with negligible vegetation and no obstruction.
The site altitude is 1800 m above mean sea level.
Openings on all surfaces (including small windows and doors) are assumed to
take approximately 5 % of the surface area. Two 8 x 3 m roller shutter doors will
be installed on the long wall facing the wind direction.

65
Figure A.1 shows a typical section through an internal portal frame of the structure.
SANS 10160-3 stipulates that the peak wind speed (Vb, peak) is given as:
𝑉𝑏,𝑝𝑒𝑎𝑘 = 𝐹𝑢𝑛𝑑𝑎𝑚𝑒𝑛𝑡𝑎𝑙 𝑤𝑖𝑛𝑑 𝑠𝑝𝑒𝑒𝑑 (𝑉𝑏) × 𝑃𝑟𝑜𝑏𝑎𝑏𝑖𝑙𝑖𝑡𝑦 𝑓𝑎𝑐𝑡𝑜𝑟 × 𝐺𝑢𝑠𝑡 𝑓𝑎𝑐𝑡𝑜𝑟 × 𝑅𝑜𝑢𝑔ℎ𝑛𝑒𝑠𝑠 𝑓𝑎𝑐𝑡𝑜𝑟 ×
𝑇𝑜𝑝𝑜𝑔𝑟𝑎𝑝ℎ𝑦 𝑓𝑎𝑐𝑡𝑜𝑟 𝐴. 1
A.1.2 Fundamental wind speed
For most of South Africa, is assumed that:
𝑉𝑏,0 = 28 𝑚𝑠 ⁄
A.1.3 Probability factor
The probability factor is based on the design working life of the structure. In this case the
structure was assumed to have normal consequences of failure, with a mean return period
of 50 years.
𝐶𝑝𝑟𝑜𝑏 = 1.00
A.1.4 Peak gust wind speed
SANS 10160-3 allows the wind speed to be based on gust, which is 40 % greater than the
basic wind speed.
𝑉𝑏,𝑝𝑒𝑎𝑘 = 1.4𝑉𝑏
15°
9 m
20 m
Figure A.1: Cross-section through an internal portal frame of the
structure

66
A.1.5 Terrain roughness
For open terrain with negligible vegetation and no obstruction, Terrain Category A was
assumed.
A.1.6 Roughness factor
For Terrain Category A: Gradient height, zg = 250 m
Height of reference plane, zo = 0 m
Minimum height, zc = 1 m
Exponent, α = 0.07
Height above the ground, z = 9 m
𝑅𝑜𝑢𝑔ℎ𝑛𝑒𝑠𝑠 𝑓𝑎𝑐𝑡𝑜𝑟, 𝐶𝑟(𝑧) = 1.36 (𝑧−𝑧𝑜
𝑧𝑔−𝑧𝑐)
𝛼
= 1.08 𝐴. 2
A.1.7 Topography factor
H is the height of the building
Lu is the horizontal length of the upward wind slope and was assumed to be approximately
200 m
∅ =𝐻
𝐿𝑢=
9
200= 0.045 < 0.05
Therefore, the wind funnelling effects can be ignored, and
𝑇𝑜𝑝𝑜𝑔𝑟𝑎𝑝ℎ𝑦 𝑓𝑎𝑐𝑡𝑜𝑟 = 𝐶𝑜(𝑧) = 1
Therefore, the peak wind speed,
𝑉𝑏,𝑝𝑒𝑎𝑘 = 𝑉𝑏,𝑜 × 𝐶𝑝𝑟𝑜𝑏 × 𝐶𝑟(𝑧) × 𝐶𝑜(𝑧) × 1.4 = 28 × 1 × 1.08 × 1 × 1.4 = 42.34 𝑚𝑠⁄
The wind peak pressure is given as
𝑞𝑝(𝑧) =1
2𝜌𝑉𝑝(𝑧)2 𝐴. 3
By extrapolation from Table 4 of the code SANS 10160-3, air density, ρ = 0.96 at an
altitude of 1800 m. Therefore,

67
𝑞𝑝(𝑧) =1
2𝜌𝑉𝑝(𝑧)2 =
1
2(0.96)(42.34)2 = 0.00086 𝑁
𝑚𝑚2⁄
The wind pressure acting on the internal surfaces of the structure is
𝑊𝑖 = 𝑞𝑝. 𝑧. 𝐶𝑝𝑖 𝐴. 4
And the wind pressure acting on the external surfaces of the structure is
𝑊𝑒 = 𝑞𝑝. 𝑧. 𝐶𝑝𝑒 𝐴. 5
Where
ze = reference height relevant to the internal pressure
Cpi = Coefficient for the internal pressure
Cpe = Coefficient for the external pressure
Clause 8.3 of SANS 10160-3 outlines the detailed procedure for calculating the external
and internal pressure coefficients, which depend on the size of the loaded area, roof slope
and the direction at which the wind strikes the building. The loading zones of the walls and
roof are marked A to J when the wind acts normal to the long side of the building as
shown in Figure A.2, and A to I when the wind acts normal to the gable wall as shown in
Figure A.4. Figures A.3 (a) and (b) show the dimensions of the loading zones when the
wind acts normal to the long side of the building. Figures A.5 (a) and (b) show the
dimensions of the loading zones when the wind acts normal to the gable wall.
A.1.8 External pressure coefficients
Roof slope = 15°

68
For wind at 0° (normal to the long side of the building)
A
B
C D
F
F
G
H
J I
Wind at 0°
Figure A.2: Loading zones of the walls and roof of the building when the wind acts
normal to the long side of the building

69
For wind at 90° (normal to gable wall):
A
B
C
D
F
F
G
H G
I H
I
Wind at 90°
Figure A.4: Loading zones of the walls and roof of the building when the wind acts
normal to the gable wall
(a) Loading zones for the gable when the
wall’s wind acts normal to the long side of
the building
(b) Loading zones for the roof when the wind
acts normal to the long side of the building
Figure A.3: Dimensions of the loading zones of the gable wall when the wind acts
normal to the long side (SANS 10160-3, 2011: 32, 40)

70
Tables A.1 and A.2 present the estimated external pressure coefficients based on
SANS 10160-3 Tables 6, 10 and 11.
(c) Loading zones for the long side when the
wind acts normal to the gable wall
(d) Loading zones for roof when the wind acts
normal to the gable wall
Figure A.5: Dimensions of the loading zones of the long side and roof when the wind acts
normal to the gable wall (SANS 10160-3, 2011: 32, 40)

71
Table A.1: Estimated external pressure coefficients when the wind acts normal to
the long side
Wind acting at 0° (normal to the long side);
Aspect ratio = H/d = 9/20 = 0.45
Loading
zone
Length
(m)
Width
(m)
Area
(m2)
External Pressure
Coefficient
(Cpe)
Wal
ls o
f th
e b
uild
ing
A 3.6 6.8 24.48 -1.2
B 14.4 8.25 118.8 -0.8
C 2 6.59 13.18 -0.5
D 48 6.32 303.36 0.8
E 48 6.32 303.36 -0.35
Ro
of
of
the
bu
ildin
g F 4.5 1.74 7.83 -2.5
G 39 1.74 67.86 -1.3
H 48 9.41 451.68 -0.13
I 48 9.41 451.68 -0.13
J 48 1.74 83.52 -0.7
Total area (m2) 1825.75
Table A.2: Estimated external pressure coefficients when the wind acts normal to
the gable wall
Wind acting at 90° (normal to the gable wall);
Aspect ratio = H/d = 9/48 = 0.19
Loading
zone
Length
(m)
Width
(m)
Area
(m2)
External Pressure
coefficient
(Cpe)
Wal
ls o
f th
e b
uild
ing
A 3.6 6.32 22.75 -1.2
B 14.4 6.32 91.01 -0.8
C 30 6.32 189.60 -0.5
D 20 7.66 153.20 0.8
E 20 7.66 153.20 -0.7
Ro
of
of
the
bu
ildin
g
F 1.8 4.1 7.38 -1.9
G 1.8 25.17 45.31 -1.2
H 7.2 25.18 181.30 -0.8
I 39 25.18 982.02 -0.8
Total area (m2) 1825.76

72
A.1.9 Internal pressure coefficients
Clause 8.3 of SANS 10160-3 considers both the internal and external pressure to act
simultaneously on the building. The calculation of the internal pressure coefficients
incorporates any possible openings and leakages. It was specified in Section A.1.1 that
there are two 8 x 3 m roller-shutter doors on the long side of the building facing the wind
direction, and 5 % of the surface area has been allocated to other openings such as doors,
windows and vents.
𝐴𝑟𝑒𝑎 𝑜𝑓 𝑟𝑜𝑙𝑙𝑒𝑟-𝑠ℎ𝑢𝑡𝑡𝑒𝑟 𝑑𝑜𝑜𝑟𝑠 = 2(8 𝑚 × 3 𝑚) = 48 𝑚2
𝐴𝑟𝑒𝑎 𝑜𝑓 𝑜𝑝𝑒𝑛𝑖𝑛𝑔𝑠 𝑜𝑛 𝑡ℎ𝑒 𝑙𝑜𝑛𝑔 𝑠𝑖𝑑𝑒 𝑠𝑢𝑟𝑓𝑎𝑐𝑒, 𝐴1 = 48 𝑚2 + 5 %(303 − 48) = 61 𝑚2
𝐴𝑟𝑒𝑎 𝑜𝑓 𝑜𝑝𝑒𝑛𝑖𝑛𝑔𝑠 𝑜𝑛 𝑜𝑡ℎ𝑒𝑟 𝑠𝑢𝑟𝑓𝑎𝑐𝑒𝑠, 𝐴2 = 5 %(1826 𝑚2 − 303 𝑚2) = 76 𝑚2
𝐴1 < 𝐴2 ∴ 𝑇ℎ𝑒 𝑙𝑜𝑛𝑔 𝑠𝑖𝑑𝑒 𝑤𝑖𝑡ℎ 𝑟𝑜𝑙𝑙𝑒𝑟-𝑠ℎ𝑢𝑡𝑡𝑒𝑟 𝑑𝑜𝑜𝑟𝑠 𝑖𝑠 𝑛𝑜𝑡 𝑑𝑜𝑚𝑖𝑛𝑎𝑛𝑡𝑖𝑛𝑔 𝑡ℎ𝑒 𝑑𝑒𝑠𝑖𝑔𝑛.
𝑇ℎ𝑒 𝑟𝑎𝑡𝑖𝑜 𝑜𝑓 𝑜𝑝𝑒𝑛𝑖𝑛𝑔𝑠 𝑡𝑜 𝑠𝑢𝑟𝑓𝑎𝑐𝑒 𝑎𝑟𝑒𝑎 𝑜𝑛 𝑡ℎ𝑒 𝑙𝑜𝑛𝑔 𝑠𝑖𝑑𝑒 = 61 𝑚2
303 𝑚2= 0.2 𝑜𝑟 20 % < 30 %;
𝑇ℎ𝑒𝑟𝑒𝑓𝑜𝑟𝑒, 𝐶𝑙𝑎𝑢𝑠𝑒 8.3.9 𝑜𝑓 𝑆𝐴𝑁𝑆 10160-3 𝑎𝑝𝑝𝑙𝑖𝑒𝑠.
For the surface facing the wind, the opening ratio is given as:
𝜇 =∑ 𝐴𝑟𝑒𝑎 𝑜𝑓 𝑜𝑝𝑒𝑛𝑖𝑛𝑔𝑠 𝑤ℎ𝑒𝑟𝑒 𝐶𝑝𝑒 𝑖𝑠 𝑒𝑖𝑡ℎ𝑒𝑟 𝑛𝑒𝑔𝑎𝑡𝑖𝑣𝑒 𝑜𝑟 𝑧𝑒𝑟𝑜
∑ 𝐴𝑟𝑒𝑎 𝑜𝑓 𝑎𝑙𝑙 𝑜𝑝𝑒𝑛𝑖𝑛𝑔𝑠 𝐴. 6
For wind acting at 0o (normal to the long side):
The positive pressure on the roof surface facing the wind direction:
𝜇 =12.96
144= 0.09 𝑎𝑛𝑑 𝐶𝑝𝑖 = 0.08
The negative pressure on the roof surface facing the wind direction:
𝜇 =61
144= 0.42 𝑎𝑛𝑑 𝐶𝑝𝑖 = 0.38
For wind acting at 90o (normal to the gable wall):
The positive pressure on the roof surface facing the wind direction:
𝜇 =110.4
144= 0.77 𝑎𝑛𝑑 𝐶𝑝𝑖 = 0.69

73
In this research, only the worst combination of internal and external coefficients of the
positive pressure were considered; such that:
Internally Pushing into the wall = Positive
Externally Pulling away from the wall = Positive
The wind pressure acting at 0° (normal to the long side of the building) is the critical case,
and the pressure coefficients were substituted in Equation A.5 to obtain the nominal wind
uplift used in this research:
𝑊𝑒 = 𝑞𝑝(𝑧𝑒)𝐶𝑝𝑒 = 0.00086 × 9000 × 0.21 = 1.6 𝑘𝑃𝑎
0.35 0.8 0.08
0.13 0.13
For wind pressure at 00 (normal to long side):
For wind pressure at 900 (normal to gable wall):
Figure A.6: Coefficients for internal and external pressure
0.43 0.72
0.21 0.21
0.8 0.8 0.77
0.8 0.8
0.03 0.03
0.03 0.03

74
APPENDIX B:
DERIVATION OF EULER-BERNOULLI BEAM THEORY
B.1 Terminology in Euler-Bernoulli beam theory
A beam is a structural member having one of its dimensions, often the length, much larger
than the other two dimensions; designed to resist bending moments, transverse shears,
axial tension or compression and, conceivably, torsion. Beams can deform axially,
transversely and in rotation (Bhatt, 1999).
For a beam subject to transverse downward loading, the top surface fibre shortens whilst
the bottom surface fibre elongates. Thus a neutral axis undergoing no change in length
exists between the top and bottom surfaces. Refer to Figure B.1 (a) and (b).
A homogenous beam is one made from a material which has the same physical properties
throughout. The neutral axis passes through the centroid of each cross-section of the beam
(Case & Chilver, 1964).
B.2 Assumptions in the Euler-Bernoulli beam theory
The Euler-Bernoulli beam theory was derived based on the following assumptions:
Members can be represented by the neutral axis.
The cross-section is either constant or varies smoothly.
Plane sections originally normal to the neutral axis of the beam before
bending remain plane and normal to the neutral axis of the beam after
bending.
Only bending deformations contribute to the internal strain energy.
Contributions due to transverse shear and axial force are ignored.
All deformations are small to ensure linearity.
The material is elastic and isotropic.

75
B.3 The Euler-Bernoulli beam theory
B.3.1 Coordinate system
The Euler-Bernoulli beam theory models the beam in 2-dimensions, which refer to the
length (x-axis) and the depth (y-axis); the effect of the third dimension (in the z-axis)
which is the width of the cross-section is incorporated in the second moment of area of the
section. Figure B.1 shows the x-axis, y-axis and z-axis of the simply supported beam
carrying a distributed load.
B.3.2 Beam supports and boundary conditions
A simply supported beam is a beam supported by a roller and/or pin support at each end;
with the ends being free to rotate and have no moment restraint. The beam deflection
equation using Euler-Bernoulli theory was derived for the simply supported beam as
shown in Figures B.2 (a) and (b).
B.3.3 Stresses, strains and bending moments
The Euler-Bernoulli beam theory assumes that the stresses and strains due to bending are
the only contributors to the internal energy of the beam. The direct stress and strain are
denoted by the symbols σ and ε, respectively. The relationship between the strain and the
longitudinal deflection is given by:
ε = εx =∂u
∂x= y
d2v
dx2= v′′ B. 1
Figure B.1: Beam long- and cross-section
z
y Neutral axis
(b) Beam cross-section
Neutral axis x
y
(a) Beam long-section
Span
Wind uplift (W)

76
where the displacements under loading of a beam in the x-y plane are given by:
u(x, y) = axial displacement and v(x, y) = transverse displacement
The direct bending stress, σ in Figure B.2 (a) and (b) is linked to the strain through
Hooke’s law (Serway and Jewett, 2004) as:
σ = Eε = Eyd2v
dx2 B. 2
The bending moment (Mz) about the neutral axis, shown in Figure B.3 (b) is defined by the
cross-section integral:
Mz = ∫ yσdx = A
Ed2v
dx2 ∫ y2dAA
= EIzd2v
dx2 B. 3
Where
Iz is the second moment of area about the neutral axis
EIz is the bending stiffness with respect to the neutral axis, and the second moment of area is:
Iz = ∫ y2dAA
B. 4
Wind uplift loading (W)
A B
x
y
Constant EI
y dA
σ NA
(b) Direct stress acting on a segment of area dA (a) A simply supported beam with wind uplift load acting on it
Figure B.2: Direct stress acting on the segment of area dA

77
A = area of the cross-section
B.3.4 Beam deflections
Using Figures B.3 (a) and (b), the moment equilibrium equation with respect to x and
assuming a positive clockwise moment:
Mz = RAx −Wx2
2=
WL
2x −
Wx2
2=
Wx
2(L − x) B. 5
As before: Mz(x) = EIzd2v
dx2
Integrating Mz(x) = EIzd2v
dx2 twice with respect to x:
EIzv(x) =WLx3
12−
Wx4
24+ C1x + C2 =
Wx3
24(2L − x) + C1x + C2 B. 6
Where C1 and C2 are constants of integration.
For a simply supported beam, the boundary conditions are:
The vertical deflection at x = 0 (at point A), vA(x = 0) = 0
The vertical deflection at x = L (at point B), vB(x = L) = 0
Figure B.3: A simply supported beam supporting an uplift wind loading
Uplift wind loading (W)
A B
C
x
Span (L)
L/2 L/2
y
Constant EI
Uplift wind loading (W)
y
x
RA=WL/2
Mz(x)
Qz(x)
A
(a) Simply supported beam with a wind uplift loading acting on it (b) Free-body diagram of a simply supported
beam

78
Substituting the boundary conditions into Equation B.6 gives:
C2 = 0 and C1 = −WL2
24
Substituting into Equation B.6 gives Equation B.7, which is the deflection equation in
terms of x:
v(x) = −Wx
24EIz(L − x)(L2 + Lx − x2) B. 7
Equation B.7 gives the deflection curve that is symmetric about the mid-span point C in
Figure B.3. The maximum deflection given by Equation B.8 occurs at mid-span or point C
where x = L/2 in Figure B.3:
Maximum deflection = vC (x =L
2) =
5WL4
384EI B. 8
Since the IBR sheet is made up of ribs that are identical and equally spaced, the second
moment of area, Iz or INA, of one rib can be calculated and then multiplied by the total
number of ribs in the sheet in order to get the total second moment of area of the sheet
(Equation B.9). Each rib was further divided into three components, of which two pairs are
identical as shown in Figure B.4.
Iz = INA B. 9
where: INA is the second moment of area of a single rib about the neutral axis
INA = INA(1) + INA(2) + INA(3) = 2 (b1d1
3
12) + 2 (
b2d23
36) + (
b3d33
12) B. 10
b1, b2 and b3 are the widths of elements 1, 2 and 3, respectively.
d1, d2 and d3 are the depths of elements 1, 2 and 3, respectively.
Figure B.4: A rib taken from an IBR sheet and divided into elements
1 1
2 2
3
NA NA