a pathway and svm based tool for tumor classification
TRANSCRIPT

ApathwayandSVMbasedtoolfor
tumorclassification
A.A.2016/2017
Candidato:LucaVitaleMatricola:0522500362
Relatori:Prof:RobertoTagliaferriDr.ssa:AngelaSerra

Goals:
Classifywithpathways
1
Identifyrelationsamongpathways
2
Buildagraphofinteractions
betweenpathways
3

TheData
• LungSquamousCellCarcinoma(LSCC)• 106patients• 11837genes• 23074methylationvalues• 352miRNAs• Survivalinformation
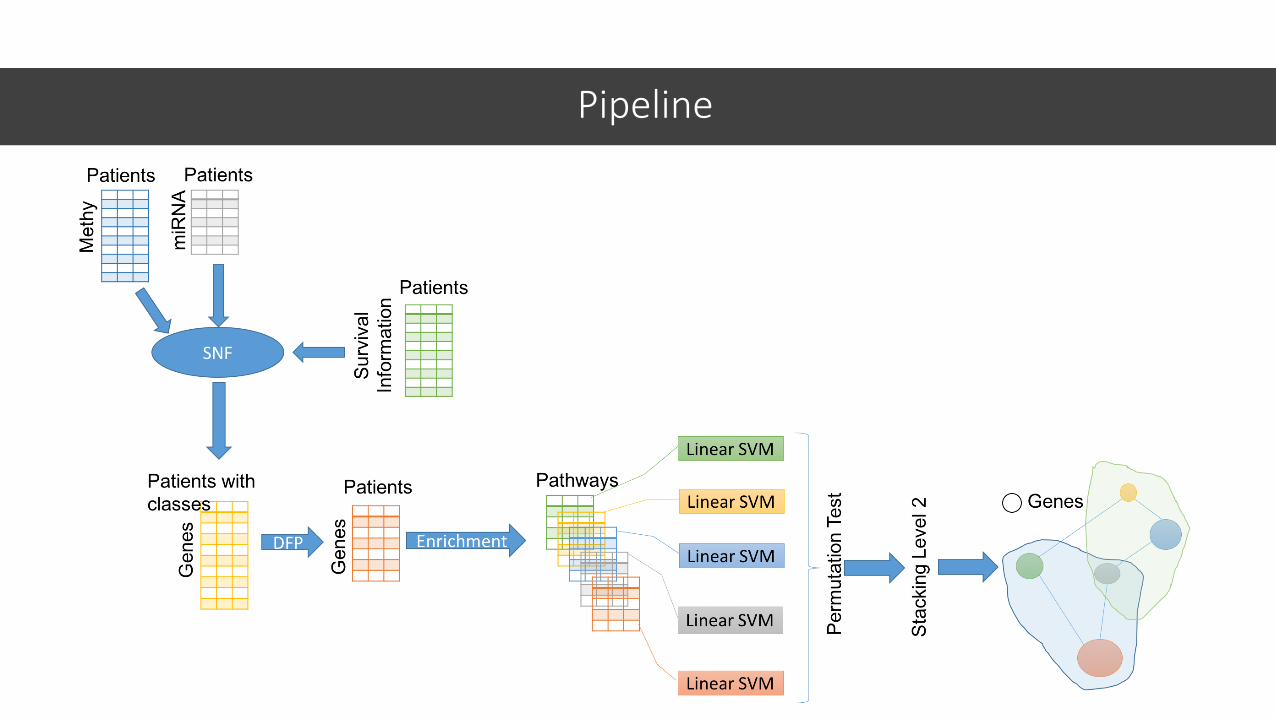
Pipeline

SimilarityNetworkFusion- SNF
• SNFisaintermediatemulti-viewclusteringmethodologyforpatientssub-typing.
Patients similaritynetwork
Fusioniterations Fused patientssimilarity network
miRNAs
methy

SNF- Gridsearch• Thealgorithmisrundifferenttimewiththefollowingparameters:
• Numberofiterations:200• K:10to30stepby1• Numberofnearestneighbors
• 𝛼 :0.3to0.8stepby0.1• Varianceforlocalmodel
• ForeachcombinationofKand𝛼, thenumberofclusterswasevaluatedthroughtwoheuristics:eigen-gapsK12andeigen-gapsK2.
• Eachclusteringwasevaluatedthroughthesurvivalanalysisbyusingthelog-ranktest.

SNF- Theresults
P-Value=0.0015 K=23 𝛼 =0.6 Number of Iteration =200

Featureselection
• IdentifydiscriminantgenesDiscriminantFuzzyPattern
• IdentifywhichpathwaysaresignificantlyrepresentedbythegenesselectedbytheDFPalgorithm
EnrichmentAnalysis

Skipfactorà 0,1,2,3• TheskipFactor valuetoskiptheoutliers.Highervaluesimplythatlessgeneareconsideredoutliers.skipFactorequalto0doesnotskip;
1Zetaà 0.35,0.4,0.45,0.5• Thezetaparameterthatsetsthethresholdvaluewhichcontrolstheactivationofalinguisticlabel;
2piValà 0.4to0.8step by0.05• ThepiVal parameterisequaltothepercentageofvaluesofaclasstodeterminethefuzzypatterns.Itcantakevaluesintheinterval[0,1];
3Overlappingà 1,2• Determines thenumber ofdiscretelabels;
4
DiscriminantFuzzyPattern– Gridsearch

EnrichmentAnalysis
• ForeachgroupofgenesselectedbyDFPparameterstheenrichmentanalysiswasperformed• Thep-valueiscalculatedbasedonthehypergeometricmodel
• WeonlyusedKEGGandReactome Database
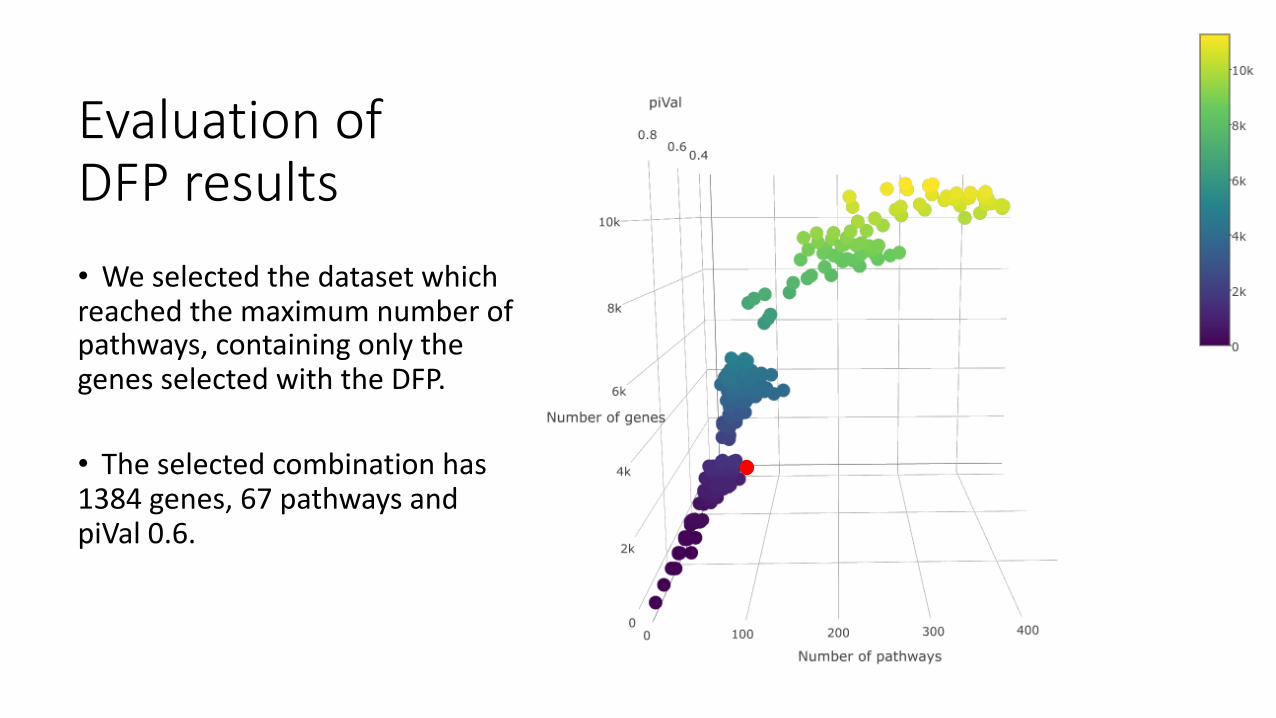
EvaluationofDFPresults• Weselectedthedatasetwhichreachedthemaximumnumberofpathways,containingonlythegenesselectedwiththeDFP.
• Theselectedcombinationhas1384genes,67pathwaysandpiVal 0.6.

Thepathways
• Theselectedpathwaysare67:28KEGGand39Reactome
• Theselectedgenesare1384.TheDFPparametersare:• skipfactor2• zeta0.3• piVal 0.6• overlapping1

ClassificationwithSVM
• Foreach pathway aLinear SVMwas executed oneach pairofclasses
• Two level cross-validation• 3outer folds• 2inner folds
• C:1e-5,1e-4,1e-3,1e-2,1e-1,1e0,1e1,1e2,1e3,1e4,1e5,1e6


Permutationtest
• Thegoalofpermutationtestistoidentifythepathwaysthatarestatisticallysignificantfortheclassification

namepathway idpathway p-value Accuracy Size classesCytokine-cytokinereceptorinteraction K_hsa04060 0.04 0.93 21 5vs2
Cellcycle K_hsa04110 0.03 0.89 12 1vs2 Cellcycle K_hsa04110 0.02 0.97 13 2vs3 Cellcycle K_hsa04110 0.05 0.90 11 5vs3
Osteoclastdifferentiation K_hsa04380 0.03 1.00 10 1vs4 Antigenprocessingandpresentation K_hsa04612 0.03 1.00 8 1vs4 Antigenprocessingandpresentation K_hsa04612 0.05 0.92 7 2vs3 Antigenprocessingandpresentation K_hsa04612 0.03 1.00 7 5vs4 Tcellreceptorsignalingpathway K_hsa04640 0.04 1.00 11 1vs4 Tcellreceptorsignalingpathway K_hsa04640 0.01 0.81 12 5vs1 Th1andTh2celldifferentiation K_hsa04658 0.04 1.00 9 1vs4 Th1andTh2celldifferentiation K_hsa04658 0.04 0.93 9 2vs3
Th17celldifferentiation K_hsa04659 0.04 1.00 11 1vs4 Th17celldifferentiation K_hsa04659 0.04 0.96 12 2vs3
Tcellreceptorsignalingpathway K_hsa04660 0.03 1.00 8 1vs4 Tcellreceptorsignalingpathway K_hsa04660 0.04 1.00 8 5vs4 Bcellreceptorsignalingpathway K_hsa04662 0.04 0.84 7 1vs2 Bcellreceptorsignalingpathway K_hsa04662 0.03 0.89 8 5vs2
Leukocytetransendothelialmigration K_hsa04670 0.01 0.91 12 1vs2 Leukocytetransendothelialmigration K_hsa04670 0.01 0.90 13 1vs3 Leukocytetransendothelialmigration K_hsa04670 0.04 0.92 14 5vs3


Secondstepofclassification:pathwayprobabilitiescombinations• Foreachpairsofclass,wecombinethepathwaysusingtheclassprobabilitiesofSVMasnewfeatures.• WetryallthecombinationofpathwaysusinglinearSVM
• C:1e-5,1e-4,1e-3,1e-2,1e-1,1e0,1e1,1e2,1e3,1e4,1e5,1e6

GraphInteraction
• Wecreateagraphinteractionforeachcombinationofclasses• Theverticesofthegrapharethegenesinpathways
• ThesizeisequalatSVMweight,ifagenesisincommonbetweenthepathwayswepickthemaxweight.
• Fortheedges:1. Wecalculatedthecorrelationbetweenthegenes2. Splitthecorrelationinpositiveandnegativeand
calculatetheMST3. OnlytheedgesbelongedtoMSTareinthefinalgraph
• Wehighlightedthepathwayswithshapesofdifferentcolours
Conclusion
• Thepathwaysaregoodfeaturesfortheclassificationproblem.
• Thepipelinecanbetestedonotherdatasetstotestit’sgeneralizationability.
