a perception analysis of downtown residents: the city of
TRANSCRIPT

Western Michigan University Western Michigan University
ScholarWorks at WMU ScholarWorks at WMU
Master's Theses Graduate College
4-2012
A Perception Analysis of Downtown Residents: The City of A Perception Analysis of Downtown Residents: The City of
Lansing, MI. Food Desert in Context Lansing, MI. Food Desert in Context
Thomas J. Veldman
Follow this and additional works at: https://scholarworks.wmich.edu/masters_theses
Part of the Geographic Information Sciences Commons, and the Human Geography Commons
Recommended Citation Recommended Citation Veldman, Thomas J., "A Perception Analysis of Downtown Residents: The City of Lansing, MI. Food Desert in Context" (2012). Master's Theses. 61. https://scholarworks.wmich.edu/masters_theses/61
This Masters Thesis-Open Access is brought to you for free and open access by the Graduate College at ScholarWorks at WMU. It has been accepted for inclusion in Master's Theses by an authorized administrator of ScholarWorks at WMU. For more information, please contact [email protected].

A PERCEPTION ANALYSIS OF DOWNTOWN RESIDENTS:
THE CITY OF LANSING, MI FOOD DESERT IN CONTEXT
by
Thomas J. Veldman
A Thesis
Submitted to the
faculty of The Graduate Collegein partial fulfillment of the
requirements for theDegree of Master of ArtsDepartment of Geography
Advisor: Lucius Hallett, IV, Ph.D.
Western Michigan UniversityKalamazoo, Michigan
April 2012

A PERCEPTION ANALYSIS OF DONWTOWN RESIDENTS:
THE CITY OF LANSING, MI FOOD DESERT IN CONTEXT
Thomas J. Veldman, M.A.
Western Michigan University, 2012
This thesis examines the perceptions of residents inside and outside of a
USDA-defined food desert in Lansing, MI related to fresh and frozen produce access.
Through an online and paper survey, Lansing-area residents ranked their perceived
level of access to fresh produce, their perception of their own health, and reported
their general daily intake of fresh produce. Through several statistical analyses, this
thesis was able to determine that residents residing within the study area in downtown
Lansing had statistically significant variations in their perception of access to fresh
and frozen produce, traveled longer to their preferred primary and secondary food
retailers, and self-reported similar fresh produce intake and perceptions of health
when compared with other area residents. Car ownership was also found to have
significant impacts on perception of access, and, including age, a participant's
perception of health. Other factors that were analyzed included level of worry
associated with access, travel times to food retailers, and the types of stores visited by
residents inside and outside the study area. Results indicated that residency inside the
study area, travel time, level of education and income did not influence fresh produce
consumption among participants, nor their perception of health, and that the severity
of this food desert may not be as extensive as other food deserts.

Copyright by
Thomas J. Veldman
2012

ACKNOWLEDGMENTS
For the memory of my father
Jerry Lee Veldman
8-4-43 to 1-23-88
I would like to acknowledge my committee, especially my chair, Dr. Lucius Hallet,
IV for all of his assistance in this research. His tireless enthusiasm was critical at so many
junctures, from initial conversations on the topic, all the way to end, has proven to be critical
to the completion of this body of work. His willingness to listen to every idea, no matter how
zany it appeared at the time, enabled me to so many times to connect the themes of this
research. Without him, none of this would have happened. I would also like to acknowledge
the tireless efforts of Dr. Gregory Veeck, who is, perhaps, one of the most influential people I
have ever had the pleasure of meeting in my entire life. I cannot adequately describe the deep
admiration I have for him. His ability to connect with students and to inspire them to achieve
more than they thought possible is truly without equal, and I will sorely miss his daily
guidance, humor, and biting intellect. I would also like to thank Dr. Benjamin Ofori-Amoah
for his assistance on this research. Dr. Ofori provided sound judgment throughout the entire
research and critical feedback, and helped provided well-needed insight. It was a sincere
honor and privilege working with him, and everyone else on my committee. I would also like
to thank Dr. Kirk Goldsberry and Megan Reed from Michigan State University. The
relationship this body of work has opened up for me personally and professionally has
irrevocably altered the trajectory of my life. Their assistance, and interest, is, and always will
be, greatly appreciated by me.
I would also like to thank my colleagues in the department of Geography at Western
Michigan University. There are too many of you to account for properly, and your
assistance, even if only listening to me vent frustrations, or to share what I found to be
exciting results, was greatly appreciated. I wish all of you the best of luck in your future
endeavors.
ii

Acknowledgments—continued
The support and love of my family was absolutely critical during this time, and
without them, I don't know how I would have been able to do this. I want to thank my
mother for raising three great kids on her own after the passing of my father. She did it
thanklessly, and tirelessly, and she did it the best of anyone person I have ever seen. To my
older sister, Elizabeth, who I have competed against for many years without her knowledge.
I held what she accomplished at Kalamazoo College and UC Berkley in the highest of
regards, as she defined what it means to excel. Despite my years of being your doofus
brother, I always looked up to you. And, last but certainly NOT least, my younger sister,
Jennifer, who introduced me to so many people, and advocated for me when I wouldn't.
What you're capable of accomplishing in an hour of work and your tireless and never ending
endeavors puts me and my work to shame. I have always been proud of you.
However, none of this would have been possible without the constant love and
support of Andrea Blanka Szell. When I was out huffing and puffing in the urban jungle of
downtown Lansing during what felt like the hottest summer I have ever experienced, she was
there. When I would frantically check survey responses trickle in after a day of walking, she
was there. She listened to every word, and provided much needed encouragement and
support when I needed it the most. I cannot emphasize enough how important she was
through this entire experience, and how much more enjoyable my life has become
experiencing this all with her at my side.
Finally, this thesis is dedicated to my daughter Elizabeth. Nothing fills a father with
as much joy as seeing his daughter brag about her father to her friends. You have always
made me proud, and I hope that I can continue to inspire your fascination with this world,
your place in it, and your continued academic excellence. You will go as far as your interest
and imagination let you go. Don't ever let anyone tell you cannot do it. You can. Don't ever
give up, even if it seems like you've lost it all. Always, always, always keep at it. Your joy
in life will be found in the journey you take in shaping who you want to become. Always
make the best of each decision when you have the opportunity. And if you made a wrong
choice, relax: You can always reinvent yourself later.
Thomas J. Veldman
in

TABLE OF CONTENTS
ACKNOWLEDGMENTS ii
LIST OF TABLES x
LIST OF FIGURES xi
CHAPTER
I. INTRODUCTION 1
Background 1
Problem Statement 7
Research Questions 8
Anticipated Results 10
Thesis Outline 11
II. METHODS 13
Methods Overview 13
Study Area 14
Questionnaire Development and Implementation 16
Survey Development and Questions: 17
Informed Consent 17
Demographics 18
Rating Access 18
Quality of Life Questions 19
iv
Table of Contents—continued
CHAPTER
Consumer Type 19
Major Local Food Retailers 22
Open-ended questions 25
Data 29
Testing of Data 27
III. LITERATURE 29
Food Desert Research 29
Definitions of a Food Desert 30
USDA Methodology for Identifying Food Deserts 31
Effects of Access 31
Supermarkets 33
Mobility 33
Dietary Influences 36
Lansing Food Environment Studies 37
Previous Participant-based Studies on Food Environments 39
Literature on Methods 42
IV. RESULTS AND DISCUSSION 44
Results Overview 44
Summary Results of Participant Demographics 45
Income 46
v

Table of Contents—continued
CHAPTER
Age 47
Educational Achievement 48
Consumer Behavior and Travel Times 49
Primary Method of Shopping and Car Ownership 50
Summary Results of Travel Time to Primary and SecondaryFood-Retailers 50
Primary and Secondary Sources of Fresh Produce 51
Opinions of Major Local Food Retailers 54
Shopping Frequencies at Major Local Food Retailers 55
Reasons for Choosing Food Retailers 57
Chi-square Analysis of Ordinal Survey Data: Residents Insideand Outside the Study Area 60
Question: How would you rate your ability to purchase freshproduce in the Lansing area given your current mode oftransportation? 61
Question: How would you rate your ability to purchasecanned/frozen fruits and vegetables in the Lansing areagiven your current mode of transportation? 62
Question: What is your overall general opinion about whereyou currently live? 63
Question: I consider myself a healthy person (in shape, freeof food-related diseases - heart disease, diabetes) 64
Question: A major portion of my diet comes from fresh fruitand vegetables (more than 3-5 servings a day) 65
VI

Table of Contents—continued
CHAPTER
Question: A major portion of my diet comes fromcanned/frozen fruits and vegetables (more than 3-5 servingsa day) 66
Question: A major portion of my diet comes from pre-prepared meals (microwave dinners, etc.) (1-2 meals a dayor more) 67
Question: I eat several meals a week from fast-food andother restaurants (3-7 meals a week or more) 68
Question: I am worried about my diet 69
Question: I am worried about being able to purchase freshfruit and vegetables 70
Question: I am worried about having to travel long distancesto purchase food 71
Question: There are certain grocery stores that I wouldnever shop at for food 72
Question: I mix in my grocery shopping with other errands,and prefer to shop at stores that offer items other than food 73
Question: I only shop for food close to home at the closeststore regardless of size or store chain 74
ANOVA and Chi-square Analysis of Ordinal Likert-typeQuestions 74
Car Ownership Chi-square Analysis 75
Gender Chi-square Results 78
A Comparison of Income and Food Related Perceptions 81
Level of Education Chi-square Analysis 82
Age Bracket Groups Chi-square Analysis and ANOVA 82
VII

Table of Contents—continued
CHAPTER
Race Analysis 83
Travel-time ANOVA Analysis 84
Summary of Consumer Behavior and Perception of Access 86
Discussion 88
Research Question 1: Do study-area residents travel longerto purchase fresh produce at their preferred stores whencompared to other Lansing-area residents? 88
Research Question 2: Are downtown study-area residentsconsuming less fresh fruit and vegetables when compared toother Lansing-area residents, and can patterns ofconsumption be detected when analyzing consumers basedon their travel time, or other factors related to age, gender,income, level of education or race? 89
Research Question 3: Does perception of access to freshproduce differ for people living in the study-area versusother area residents due to travel time, or are theseperceptions shaped by a person's other factors related toage, gender, income, level of education or race? 91
Research Question 4: Due to issues related to access to freshproduce, does the perception of a person's health differsignificantly inside and outside the study area? 91
V. THE DOWNTOWN LANSING FOOD DESERT:
CONCLUSION OF FINDINGS 93
Limitations of the Research 95
Implications for Future Food Desert Studies 96
APPENDICES
A. Survey 99
viii

Table of Contents—continued
B. HSIRB Approval Letter 111
C. Consent Form 112
BIBLIOGRAPHY 113
IX

LIST OF TABLES
4.1: Participant Race Percentages 46
4.2: Self-Reported Income Ranges 47
4.3: Self-Reported Age Groups 47
4.4: Self-Reported Level of Education 48
4.5: Self-Reported Travel Times 50
4.6: Self-Reported Travel Time t-test Results 51
4.7: Self-Reported Primary Type of Fresh Food Provider 52
4.8: Self-Reported Secondary Type of Fresh Food Provider 54
4.9: Mean Opinion of Local Major Food Retailers 55
4.10: Mean Shopping Frequency of Local Major Food Retailers 57
4.11: Chi-square Analysis of Perception of Fresh Produce Access 62
4.12: Chi-square Analysis of Perception of Access for Frozen/CannedProduce 63
4.13: Chi-square Analysis of Opinion of Community 64
4.14: Chi-square Analysis of Opinion of Health 65
4.15: Chi-square Analysis of Fresh Fruit/Vegetables Consumption 66
4.16: Chi-square Analysis of Consumption of Frozen/Canned Fruit andVegetables 67
4.17: Chi-square Analysis of Consumption of Pre-Prepared Meals 68
4.18: Chi-square Analysis of Consumption of Fast-Food and Restaurants 69
4.19: Chi-square Analysis of Worry About Diet 70
4.20: Chi-square Analysis of Worry About Ability to Purchase fresh Produce 71
x

List of Tables—continued
4.21: Chi-square Analysis of Worry About Distance Traveled PurchasingFood 71
4.22: Chi-square Analysis of Stores Never Shopped at for Food 72
4.23: Chi-square Analysis of Mixing Shopping with Other Errands 73
4.24: Chi-square Analysis of Shopping Close to Home Responses 74
4.25: Car Ownership Perception of Fresh Produce Access 75
4.26: Car Ownership Perception of Frozen Produce Access 76
4.27: Car Ownership Perception of Health 77
4.28: Car Ownership Worry Associated With Distance 77
4.29: Car Ownership Shopping Only Close to Home 78
4.30: Gender Consumption of Fresh Produce 78
4.31: Gender Consumption of Fast-Food Groups 79
4.32: Gender Worry about Diet 80
XI

LIST OF FIGURES
1.1: Study Area Overview 5
1.2: Near Downtown Fresh Produce Food Retailers and Seasonal Farmer's
Markets 15
2.3: Lansing Area Food Retailers 22
4.4: Survey Participant Location 45
XI

CHAPTER I
INTRODUCTION
Background
In downtown Lansing, Michigan, little is known about the role income, level
of education, gender, ethnicity, source of fresh produce, method of transit or travel
time plays on the perception and consumption of fresh fruit and vegetables for
residents. According to the United States Department of Agriculture (USDA), a
significant portion of downtown Lansing, MI is classified as a "food desert." This
fact, combined with recent research into the Lansing, MI food environment by Reed
(2011), Goldsberry, et al. (2010), Duvall, et al. (2010), as well as a 2009 Downtown
Marketing Study showing residents desiring greater access to fresh produce, serves as
the rationale for determining if downtown Lansing residents perceive access to fresh
food differently from other area residents. By soliciting the opinions of residents that
live inside and outside of a USDA defined food desert, this study explores
perceptions of fresh produce for area residents, and creates opportunities for this
method of research for future food desert studies.
While most food desert studies focus on measuring access to fresh produce
without interacting with the people living in these areas, this study was designed to
analyze the actors interacting with the local food-retail environment in Lansing and to
determine whether statistically significant differences of perceptions exist among
actors and locations. It seeks to understand how people within the boundaries a
USDA-defined food desert perceive their access to fresh produce, the stores they shop
at, the travel time to these stores, and how they perceive their own health when
1

compared to nearby residents living outside of a USDA-designated food desert. In
analyzing perceptions of residents by focusing on these interactions, this study aims
to identify how this access affects people living in downtown Lansing. With recent
quantitative research into food deserts measuring distance to food retailers as a means
to determine access, most studies do not take into consideration individual
perceptions of access as a potential factor in the relationship residents have with their
food environment. This study aims to add to the literature by analyzing residential
perceptions in the context of a food desert, and can help dismiss or confirm several
assumptions about those living within one. By studying Lansing, MI, this adds to the
recent research already conducted in the Lansing area related to this food
environment.
Studying how people perceive their food environment is relevant geographic
research for multiple disciplines and can provide policy makers with more accurate
information about people interacting with their local food environment and how
access can influence dietary behavior. The difficulties people face interacting with
their local food-retail landscape provides greater rationale for conducting this study,
as purchasing the food necessary for a healthy diet can be overwhelming even for the
most well-informed consumer. Confronted with thousands of options in
supermarkets, and given the millions of dollars spent marketing often dubious health
claims of these products, consumers often make quick and ill-informed decisions
when purchasing their food. Purchasing decisions, then, are influenced by multiple
ambient conditions. These range from product placement, targeted sales, and even

the presence of music while inside a typical grocery store or supermarket. Even
before a consumer enters a store, they are required to decide where to shop for a
multitude of reasons: weather, budget, time constraints, and proximity. These
decisions influence where consumers shop, and in doing so, influence the type of
food they are likely to encounter. Whether it is organic local food at the nearby
seasonal farmer's markets, the Peruvian asparagus at Meijer, Wal-Mart, or Kroger, or
the canned green beans at the locally-based Quality Dairy, all ultimately influence the
health of those that consume it.
However, those food-retailers that are most likely to provide the healthy and
nutritious foods are not evenly distributed for various socio-economic groups within
the United States. Studies in Cardiff,Wales (Wrigley, 2002), and London, Ontario
(Larsen and Gillian, 2008), have recorded the phenomenon known as "Food Deserts."
These food deserts are areas of relative social exclusion where people experience
physical and economic barriers to accessing healthy food (Cummins, S., et al. 2007,
Wrigley, et al. 2002). The literature indicates that people living in a food desert pay
higher prices for groceries at small food shops, and liquor and convenience stores in
their neighborhoods, and must travel greater lengths to obtain fresh food (Larsen and
Gilliand, 2008). However, living in a food desert is not the only variable affecting
consumption of fresh produce, as men are found to consume fewer fresh fruit and
vegetables compared to women, and increases in income are highly correlated to
daily fresh produce consumption (Dehghan 2011). The literature, however, is far
from clear, and many aspects of food desert research are contested. For example,

while some food desert specific research has shown that living in a food desert
decreases consumption of fresh produce (Acheson, 1998), but other research shows
that this is not the case (Cummings and Macintyre, 2002), while others still cite socio
economic factors as the primary influence on diet (Pearson, et al. 2005). This study
intends to address the effects of both living in a food desert and its impact on diet.
Within this study, the roles gender, race, income, education and even travel time have
on the daily intake of fresh produce will hopefully emerge in the analysis of the data.
Like most American rust-belt cities, community leaders in Lansing have been
trying to find a newvision for the city in the 21st century afterthe decline and
dismantling of several nearby GM auto-manufacturing plants. The City of Lansing
has seen an increase in capital investment projects in its downtown retail district
beginning in 2000, with the construction of several mixed-use development projects.
This has occurred while also dealing with a population loss of 4.1% (119,000 in 2000
to 114,000 in 2010, US Census). Due to these capital investment projects, downtown
Lansing has seen increased cultural and economic activity with the opening of several
new bars and restaurants. However, access to readily available and affordable fresh-
food products for downtown residents does not appear to have changed during this
period. A 2009 Lansing Market Survey highlighted this lack of access when it
estimated an annual $39 million food-retail leakage to other parts of the Lansing area
for food purchases (Downtown Lansing Market Study and Strategies Summary
Version 2009). Another setback for access confronting downtown residents came
when L&L, a major local food retailer, shuttered the doors on 5 local grocery stores

in early 2011. While some of the closed stores have since reopened under new
management and names, several of these stores remain closed, and will be for the
foreseeable future. Two of these stores still closed are within a couple of miles of the
proposed study area, and it is quite certain that residents within this area will feel the
impact of their closing.
Figure 1.1: Study Area Overview
ittervirStudy Area
IK USDA identified "Food Desert"
(Source: USDA, MCGI)
Studying perceptions of food access in downtown Lansing is especially
relevant due to several barriers in this area for pedestrians that make walking and
biking to other grocery stores difficult or impossible for residents. The study area,
shown in Figure 1, is contained within these barriers: 1-496 to the South, the Grand

River along the eastern and northern boundaries, and M-99 (MLK Blvd) to the West.
However, there is reasonable access to a functioning 7 days-a-week bus-based mass-
transit system with the Capital Area Transit Authority (CATA), which has several
major regional routes crisscrossing the study area that can take residents to stores on
the suburban fringe. However, to classify this area as lacking access to a fresh-food
retailer is misleading, as there are two active food-retail locations immediately
bordering the study area. These two sources of fresh produce are the Vallarta market
in the northeast section of the study area, and the redesigned and rebuilt Lansing City
Market near the eastern boundary of the study area along the eastern bank of the
Grand River. Even with this access, the USDA still defines several block groups in
this area as being a food desert (Figure 1).
Several studies have attempted to map and quantify access to fresh produce
integrating various GIS-based models in an attempt to find linkages between access
and consumption of fresh produce. Duvall, et al. (2010) created a classification
schema of the various fresh food retailers, accounting for quantity and type of
produce available, and Goldsberry, et al. (2010), employed various methodologies
when visualizing access to the available fresh produce in the Lansing food
environment. Goldsberry showed, using cumulative distance, that portions of this
area were unequally serviced by food-retailers, with areas of greater accessibility to
all of the available fresh food items in the Lansing area concentrated within the City
of East Lansing. Downtown Lansing had moderate access when using both the
container and weighted methods, yet the USDA through their food-desert locator

map1 shows large areas of Downtown as being a food-desert. The inherent problem
associated with the USDA methodology for identifying food deserts stems from the
agency excluding smaller, independent stores with sales under $2 million a year from
the identification criteria.
Problem Statement
With the trend of the past several decades for food-retailers to locate in
suburban and exurban locations (Pothukuchi, 2005), residents in urban centers are
often required to travel longer to food retailers to secure fresh produce, thus incurring
greater cost. Few studies have focused on ascertaining whether people living in a
USDA designated food desert perceive their access differently than residents outside
these areas, relying instead on using GIS to visualize access irrespective of the
behavior of people in these areas. Downtown Lansing has a diverse population, with
varying income levels, educational achievement, and method of transit to food
retailers in the Lansing area. Using a top-down methodology to map access makes
assumptions about people in a food desert whereby researchers do not take into
account the actions of the actors in these areas. The goal of this thesis is to determine
whether employing a perception analysis of food desert residents is an appropriate
tool for food desert studies, and to help identify factors that shape the perceptions of
people in these areas as they purchase food. This research will account for the
socioeconomic characteristics of study participants and their method of transit and
travel time to their preferred source of fresh produce to determine if people living in a
1USDA Food Desert Locator Map: http://www.ers.usda.gov/Data/FoodDesert/
7

food desert perceive their access differently when it comes to consuming fresh
produce. If so, it hopes to empower policy makers to make more effective decisions
to improve the diets of people affected by this lack of access.
To accomplish these goals, I analyze how residents inside and outside of the
downtown Lansing food-desert perceive their food environment using a survey. I
attempt to determine whether fresh produce consumption has statistically significant
variation among age, income, education, gender, and even travel time groups, and
between residents inside and outside the downtown study area. This is accomplished
by determining baseline demographic information about Lansing area residents, their
method of transit, and travel times to their primary and secondary food retailers. The
results of this survey, coupled with this baseline information, created a foundation for
analyzing perceptions in the context of multiple factors, controlling for a participants
location inside and outside of a food desert, and then analyzing other factors to
determine the impact these factors have on consumption and perception. The analysis
of these specific factors together will better explain the relationship Lansing area
residents have with their food environment, inside and outside of the downtown study
area.
Research Questions
In order to determine whether study area residents have a different perception of
access to fresh produce, it is important to answer a variety of questions related to
travel time and source of fresh produce to determine any perceived impact on the

participant's access. Specifically, this study is designed to answer the following
questions:
1. Do study-area residents travel longer to purchase fresh produce at their
preferred stores when compared to other Lansing-area residents?
2. Are downtown study-area residents consuming less fresh fruit and vegetables
when compared to other Lansing-area residents, and can patterns of
consumption be detected when analyzing consumers based on their travel
time, other factors related to age, gender, income, level of education or race?
3. Does perception of access to fresh produce differ for people living in the
study-area versus other area residents due to travel time, and/or are these
perceptions shaped by other factors related to age, gender, income, level of
education or race?
4. Due to issues related to access to fresh produce, does the perception of a
person's health differ inside and outside the study area?
Lansing-area residents inside and outside of the study area were solicited to
participate in an online survey (using the survey site Survey Monkey) to answer
questions related to the primary research questions stated above. Given previous
work in studying this food environment by Duvall, et al. (2010) and Goldsberry, et al.
(2010) and Reed (2011), this study aimed to continue this research trend by focusing
specifically on the downtown area. However, instead of attempting to link access to a
top-down visualization of access, this study focuses on taking the experiences and
perceptions of the study participants into consideration in the context of access.

Thus, does access actually impact perception, validating some of the essential
theories surrounding food desert research that states access determines quality of diet
and health, or is the perception of an individual not relevant based on geographic
location? If the former is true, this study aims to contribute to geographic research
into food deserts by focusing entirely on the actions and opinions of people in the
pursuit of food.
The results of this research should encourage further studies examining
perceptions of resident's in food deserts to identify the factors influencing fresh fruit
and vegetable consumption. Another goal is to demonstrate that while powerful, GIS
is not the only tool geographers may bring to bear in food desert research, and that
each locality requires its own method for proper analysis.
Anticipated Results
I expect my research to demonstrate that study-area residents in downtown Lansing
have a statistically significant difference in their perception of access when compared
to similar consumers and residents outside this area. Given the concentration of
stores on the suburban fringes of the Lansing area, the travel time of study-area
residents in downtown Lansing is longer than other Lansing-area residents when
shopping food, and this travel time will impact participants perceived access to fresh
produce. Due to increased travel times, the fresh fruit and vegetable consumption of
study-area residents is lower when compared to a similar person outside the study
area. And finally, as a result of eating fewer fresh fruits and vegetables, study-area
10

residents will view themselves as being unhealthier when compared to similar
Lansing-area residents.
Thesis Outline
Chapter I - Introduction - provides an overview of this thesis research. It identifies
the general issues consumers face navigating food environments, and lists general
definitions regarding the food desert phenomenon. It provides a rationale for this
research in that it highlights past attempts to research access based on aggregated
spatial data, and underscores the assumptions made about people living in food
deserts that may in fact not be valid. It introduces the study area, and the goals
associated with this thesis research.
Chapter II - Methodology - This chapter will outline the various methods employed
in this research and will connect the research questions posed by this research to
questions in the questionnaire. It will provide an introduction into the demographic
make-up of the Lansing-East Lansing Metropolitan Statistical Area (MSA), and the
source of secondary data used in this thesis research.
Chapter III - Literature Review - This chapter will provide a general history of food
desert research, and the various spatial analyst methodologies researchers have used
to identify areas of lower food provisions. It identifies and critiques previous
research into the Lansing food environment by analyzing the assumptions and
limitations recent research attempts made in analyzing this local area. This chapter
will also introduce qualitative research into food deserts, and the need for a mixed
11

methods approach to food deserts that allow actors to freely generate their own
concerns they have when navigating their food environments.
Chapter IV - Results and discussion - This chapter will discuss at length the various
statistical analyses used in understanding participant answers, and the results of these
analyses.
Chapter V - Conclusions - This chapter will provide conclusions to this research,
implications for researchers and policy makers, and insight into any limitations of this
research.
The informed consent, HSIRB approval form, and survey used in this research
can be found in the appendix.
12

CHAPTER II
METHODS
Methods Overview
Again, the primary purpose of this study is to examine perceptions of access
for area residents in the context of a USDA-defined food desert in downtown Lansing
and to determine how perceptions of access to fresh produce vary for Lansing-area
residents across space. I also address the socio-economic characteristics of study
participants to account for any potential explanatory effects these variables have on
their perception. To achieve this, a questionnaire for Lansing-area residents was used
to collect information between May and September 2011. Questions asked in this
survey were designed to allow participants to indicate their perceived views of food
access and their worry associated with access. These questions asked general
consumption patterns of fresh and frozen produce. They also indicated where they
shopped, their reasons for shopping at these locations, and the general perceptions
toward the major fresh produce providers in the Lansing area.
In order to collect a statistically viable sample, the study area in downtown
Lansing was canvassed door-to-door with flyers advising these residents of an online
survey conducted through SurveyMonkey.com. This resource has recently proven
useful in previous food-based studies, notably Simms (2011). Given that certain
residents would not have personal or convenient access to the internet, an identical
print version of the survey was available if the resident was willing to complete it on
the spot. For residents outside the downtown study area, word of mouth was
generated through several Lansing-based Facebook groups via wall posts with links
13

to the online survey. All told, 255 people participated in the study, with 251 viable
survey responses.
Study Area
Given that the entire population of the Lansing-East Lansing MSA was
eligible to participate, the entire study area can be described as the tri-county region
encompassing greater Lansing. More practically, however, the study areas in this
research can best be described as inside and outside of the USDA-defined food desert
in downtown Lansing (Figure 2). The Lansing area is a predominately automobile
oriented mid-sized city with a majority white population. According to the 2010
Census, the Lansing-East Lansing Metropolitan area has a total population of 464,036
people. Of this, 78.3% self-identified as White non-Hispanic, 8.6% Black or African
American non-Hispanic, 6.2% Hispanic or Latino, 3.8% Asian and 3.3% two or more
races. Within the study area itself, the 2010 Census indicates a total population of
6,157 people. Of that population, 56.8% are White non-Hispanic, 23.1% Black or
African American non-Hispanic, 11.14% Hispanic or Latino, 4.29% Asian, 3.52%
two or more races, and .27% other.
14

Figure 1.2: Near Downtown Fresh Produce Food Retailers and Seasonal Farmer's Markets
Legend
Study Area
5: USDAIdentified'Food Desert"
• Quality Dairy
g Co-Op
• Speciality Stores
I Farmers Market
• City Market
• CSAs
• Supermarkets
• Grocery Stores
(Source: USDA, MCGI, Google. Created by Author)
Most residents in the Lansing-area use an automobile when commuting to
work, school, and to the store, and with the climate of Lansing, especially in winter,
walking and biking are not realistic year-round options for most residents when
purchasing food. The dominance of the automobile in the Lansing-area has created
several barriers for pedestrian mobility, notably within the downtown study area.
With several four-lane major arterial roads, 1-496 and the Grand River bordering the
area (Figure 2), walking routes from one part of the study area to another are limited
to appropriate crossings. Periods of inclement weather, specifically in winter, can
create further barriers to pedestrian mobility as snow and ice is known to accumulate
on sidewalks. After years of economic distress in the region, and in particular after
15

the financial crisis of 2008, the downtown study area also has large numbers of
foreclosed or abandoned homes further exacerbating the timely removal of snow and
ice debris. Year-round availability of produce in downtown is limited to the Vallarta
Market and the Lansing City Market, as shown in Figure 2, which requires most
residents to travel to food retailers outside this area. However, Figure 2 also shows
the locations of several Quality Dairy Stores in the study area, and two seasonal
farmer's markets - Old Towne, and Westside. . These farmer's markets operate only
during the summer months, which corresponded to the dates area residents were
solicited to participate in this study. Also visible in this map are several other major
Lansing food retailers, including two L&L stores that remain closed.
Questionnaire Development and Implementation
Informed by the recent research by Reed (2011) into the Lansing-food retail
environment, and Simms (2011) Southwest Michigan Farmer's Market research, a
questionnaire was developed to gather data on individual and regional food shopping
behavior. With a 4-month window in which to collect data, and due to research
budget constraints, an online survey website was determined to be the most
appropriate method to collect as many responses as possible, but as previously noted,
paper copies of the survey were also available to complete for participants that did not
have reasonable access to the internet. Surveymonkey.com has been successfully
used in recent geographic research for collecting primary data on retail behavior,
notably Simms (2011). This methodology ensures anonymity and convenience for
survey participants, and allowed for more questions to be answered in a given period
16

of time by each participant. Whereas Reed (2011) implemented a street-intercept
methodology when gathering data, that study had limited access to major area
supermarkets for conducting research, and had a shorter interaction time with
consumers at each retailer. Given this, an online survey avoids any "hassle"
associated with food-retailers refusing researcher access or researcher consumer
interferences, and could provide data from a larger geographic area. This method
also ensures lesser bias in the data collection method associated with questionnaire
rejection, and with interviewer bias. It also enables participants to think and answer
questions on their own time, and allows them time to communicate their ideas
without time constraints.
Survey Development and Questions
There were various categories of questions asked of participants during the
data collection period of this research. Given that this was an attempt to ascertain the
perceptions of Lansing-area residents as it related to fresh produce access, questions
tended to focus on these perceptions. Other questions were asked in attempt to
ascertain what factors play a role in these perceptions. A copy of the final survey
used in this research is found as Appendix A.
Informed Consent
Prior to starting the survey, a scanned version of the original HSIRB approval
form was displayed giving the participant the appropriate recourse should they choose
to stop their participation in the study. Participants were instructed to carefully read
17
and save a copy of this form if they chose to do so. No participants during this study
requested to have their answers removed after they were submitted.
Demographics
Questions concerning participants socio-economic information was scattered
throughout the survey, with questions requesting the most vital information asked
first. Demographic, mobility, and socio-economic questions asked of participants
included information concerning income, level of education, race, gender,
approximate age, approximate level of income, and method of transit. Participants
were also asked to indicate method of payment for food (cash, credit, debit/check,
food stamps, Women Infants Children (WIC) or other), their current college status (in
college full-time or part-time or not at all), level of employment (from unemployed,
part-time, full-time or retired), pension status or social security status, and whether
they owned a car.
Rating Access
The next set of questions concerned respondents views regarding access to
fresh and frozen/canned produce in the Lansing-area. This section also included an
open-ended question allowing participants to provide any information they felt
important prior to answering the Likert-type questions concerning access. Once
done, participants ranked their perceived level of access of fresh produce and
frozen/canned produce on a scale from 1 to 5, with 1 equaling Very Poorly, with 3
being Average, and 5 being Very Good. Participants were also able to indicate Not
Applicable. These questions were critical to providing answers for one of the
18

research questions posed by this study: whether perception of access to fresh produce
differ for people living within the study-area versus other area residents.
Quality of Life Questions
After participants ranked their level of access, they were next asked to rate
their quality of life in their current location, and their sense of the overall quality of
food access in the Lansing-area. Similar to the previous section, participants were
asked to rank their scores from 1 to 5, with 1 indicating a very negative opinion, 3
being neutral, and 5 equaling a very positive opinion. In addition, questions relating
to residents that have resided in the Lansing-area for one year or less were asked
asking participants to rate their sense of access in their previous community using the
same scale, and then ranked their overall general opinion of where they lived prior to
Lansing. While not critical to the primary questions asked of this research, length of
residency questions were asked to see if duration of residence who have any impact
on perception regarding access to fresh and frozen/canned produce.
Consumer Type
The next set of questions were also asked using a Likert-type scales, with 1
being strongly disagree, 3 being neutral, and 5 being strongly agree. These questions
also included a "not applicable" for participants that did not feel the question was
relevant to their situation. The purpose of these questions were to identify the types
of different consumers in the Lansing-area, and to see if any information could be
gleamed from different consumer types of fresh produce purchases in the Lansing-
area.
19

The first question asked participants whether they considered themselves a
healthy person, free of food-related diseases (heart disease, diabetes, etc.). This
question is based on information identified in the literature that suggested consumers
living in a food desert were less healthy than consumers living outside a food desert
(Acheson, 1998). This was also a central research question for this research, as it was
anticipated from previous literature on food deserts, that residents inside the
downtown study area would perceive their overall health to be poor vis-a-vis
residents outside the food desert.
The next set of questions focused on the consumption behaviors related to
various food products, starting with estimates of the daily consumption of fresh
produce (3-5 servings a day), followed by frozen/canned fruit and vegetables (3-5
servings a day) in order to discover if Lansing-area residents were more prone to
eating one type of available produce over another. These questions were critical to
this research, specifically whether self-reporting downtown study-area residents
consume fewer fresh fruit and vegetables than other Lansing-area residents. Frozen
and canned fruit and vegetables were included as an adjustment in that most studies
exclude this category from food desert research, despite the fact that there are very
viable options given contemporary processing technologies. The focus of the issues
related to most food deserts concern access to fresh produce. However, if a
participant ranked their consumption and perception of access higher for frozen and
canned fruit and vegetables, this finding could go a long way in providing an
20

alternative narrative for a participant's perception of access to fresh produce, and
ultimately for consumption of fresh produce.
In the next section of the questionnaire, participants ranked their consumption
of pre-prepared meals, such as microwave dinners, on a daily basis (1-2 meals a day)
by indicating whether they agreed with this statement. Participants then ranked their
weekly consumption of fast food and other restaurant food, ranging from 3-7 meals a
week. This question was asked to determine what impact "fast-food" and/or other
types of restaurants had on the daily and weekly diet of the study participants.
Perception of access and consumption were not the only variables this study
was designed to examine. Another set of metrics this study wanted to answer was
the level of concern different area residents had related to distances to fresh produce,
their own diet, and their ability to secure fresh produce. These questions can provide
a more thorough narrative of the experiences of Lansing-area residents in the pursuit
of fresh produce, which is sometimes lacking in food-desert research. To accomplish
this task, participants were next asked to rank their level of "worry" related to those
questions. The final set of Likert-type questions focused on ascertaining the
motivating factors the participant had in choosing one particular store over another,
asking whether there were certain grocery stores they would never shop at food,
whether they mixed in grocery shopping with other errands, whether they shopped at
the location closest to home regardless of size or chain, and finally whether they
shopped only based on weekly sales or coupons. These questions were asked to help
21

identify the various types of consumers in the Lansing food-retail environment used
in the analysis of the survey results.
Major Local Food Retailers
Figure 2.3: Lansing Area Food Retailers
(Source: USDA, MCGI, Google)
Participants, using Likert-type questions, ranked their general opinion of the
major food-retailers in the Lansing area, which are shown in Figure 3. The
information from these questions provides an overall narrative of the popularity of the
various food-retailers in the Lansing-area. While not critical to the core questions of
this study, determining the most popular fresh-food retailers in the Lansing-area
demonstrates the type of produce area consumers see when shopping. Participants
ranked their overall opinion of each store using a Likert-type with 1 equaling a very
22

negative opinion, 3 equaling a neutral opinion, and 5 equaling a very positive opinion.
Participants also indicated whether they never heard of a store by selecting N/A. The
stores included regional, national and even international chain stores such as Kroger,
Meijer, Aldi, Wal-Mart, and Save-A-Lot. Locally owned or independently operated
stores such as the Lansing City Market, Local Farmers Markets, the Vallarta Market,
Apple Market, Goodrich Shop Rite, Quality Dairy and Horrocks were included in this
list. While Duvall et al.(2010) demonstrated that fresh produce was sometimes
available at liquor and convenience stores in the Lansing-area, the list was limited to
stores that carried a more substantial variety of foods. While classified in NAICS
(North American Industry Classification System) as a Grocery Store, Quality Dairy,
for example, is more like a convenience store in operation than what a person would
reasonably associate with a grocery store. Their relatively small size, and limited
availability of fresh produce, supports this classification. A Lansing-based store, with
over 25 stores in the area, Quality Dairy represents a critical and culturally relevant
component to the Lansing-area food retail environment. Lansing-area residents are
very familiar with this store, often referring to it simply as "QD." Its inclusion in this
discussion is vital to understanding this chain's role in this food environment. While
Quality Dairy was included, other convenience stores were not, as the purpose was to
rate the major food-retailers in the Lansing-area.
Participants rated their general opinion of each store, using the same list of
Lansing-area food retailers. Using a 5-point Likert-type, participants indicated their
shopping frequency at these stores with 1 equaling very rarely (Once or twice a year),
23

2 equaling rarely (Once or twice every 3-4 months), 3 equaling infrequently (Once or
twice ever 1-2 months), 4 equaling frequently (Once or twice a month) and 5 equaling
very frequently (Three times a month or more). The rationale behind using shopping
frequencies is that it was expected that Lansing-area consumers would interact with
significantly more than just one or two stores in any given year. Identifying the store
that consumers interact with most frequently helps determine whether Lansing-area
residents, inside and outside the study area, are being exposed the available fresh
produce in the Lansing area. If study-area participants are found to limiting their
purchasing to smaller stores, offering smaller quantities of fresh produce, this study
can help pinpoint why this interaction is occurring [Larger stores tend to offer a larger
variety of fresh produce items when compared to local, smaller stores]. In addition,
this information helps track the interaction consumers have with those stores closest
to their homes within the downtown study area.
Since it was expected that most Lansing-area consumers would interact with a
variety of stores in the Lansing-area, the next set of questions focused on primary
sources and secondary sources of fresh and frozen/canned fruits and vegetables.
These questions differ significantly from the Likert-type questions in that participants
were able to freely identify by street address or name (later converted to a physical
address) their primary and secondary fresh and frozen/canned food retailers in the
Lansing-area. Participants identified the location based on type, choosing only one,
identifying the location based on whether it was a grocery store, convenience store,
farmer/city market, community garden, personal garden or other. However, in
24

practice, this question was found to be confusing for some participants in that they
answered one for each category.
With the primary and secondary sources identified, participants then indicated
their reasons for shopping at these locations. The reasons included ability to use self-
checkout; quality of produce; variety of produce; price; no other options; close to
home; close to work/school; close to bus route; store hours; or other. Once consumers
identified their reasons for shopping at their primary and secondary food-retailers,
they then indicated their travel time to these locations. Travel time, and not distance,
to these stores were indicated by participants to control for variations in distance
associated with method of transit, and to standardize survey questions. The reason for
excluding distance was predicated on the anticipation that most mass-transit users
would measure distance irrespective of their method of transit, and would not account
for the distance their actually traveled to get there (such as walking to and from the
bus stop, or the indirect routes often associated with mass transit). To account for
these differences, and to improve accuracy, travel time to the stores was the metric
used for measuring access. Larsen and Gilliand (2008) concluded in their research
that walking distance from the home to the nearest bus stop, and then from the bus
stop to the store, were critical when modeling for mass transit.
Open-ended Questions
Participants also freely generated their own views associated with the Lansing
food environment, highlighting one of the benefits of using an online survey. Since
time was not a constraint, the majority of participants provided more in-depth
25

responses discussing their views of the local food environment than what could have
been anticipated in the design of this survey. These questions will be discussed in the
results section of this thesis to provide a qualitative overview of this food
environment, but will not be analyzed to detect a trend. These responses will help
"paint" a more complete picture of this area, and can provide general insights into the
responses participants indicated through the Likert-type scales and other questions in
this research.
Data
All survey participants provided either their actual or block address and zip
code. This data was later imported into ArcGIS 10.0, along with primary and
secondary store locations, to geocode their physical location. Shapefiles for ArcGIS
came from the Michigan Center for Geographic Information (MCGI) for Ingham,
Eaton and Clinton Counties, including all townships, villages, cities, and census
designated places (CDP), and their corresponding road networks. Store location
addresses identified by survey participants were verified using Google maps. All
survey responses collected from Surveymonkey.com were downloaded in an excel
spreadsheet format on September 15, 2011. Survey data was imported into SPSS
Version 19 for statistical analysis of findings. All baseline demographic information
was provided bythe 2010 U.S. Census 3at the MSA-level outside the study area, and
at the census-tract level inside the study area.
32010 Census Data: http://factfinder2.census.gov/faces/nav/jsf/pages/index.xhtmlMichigan Center for Geographic Information (MCGI): http://www.mcgi.state.mi.us/mgdl/
fact
26

Testing of Data
Survey participation was solicited using a convenience sampling method
inside the downtown study area, and were solicited via word of mouth for those
outside the study area. Since the scope of this thesis is limited to detecting
perceptions differences inside and outside of the food desert, future research should
attempt to sample a larger portion of the Lansing area with a larger number of
participants to resolve any issues associated limitations of this research design. Still,
the current research offers significantly more information on perceptions than any
previous research.
A variety of statistical tests were used to analyze the quantitative data
collected through the survey. Likert-type questions were primarily tested using Chi-
square analysis to determine the distribution of responses between gender, education
groups, residency inside and outside the study area, and car ownership. ANOVA
testing was used to test for differences based on level of income and travel time
groups. After running an initial analysis of ordinal survey data collected through
Likert-type questions, categories were merged, and negative, neutral and positive
groups were created. This method grouped responses based on whether a participant
indicated either a negative or disagree answer, a neutral answer, or a positive or agree
on a Likert-type question. Any variables that were found to impact consumption of
fresh produce were tested using Chi-square analysis comparing one similar group
inside the study area, to a similar group outside the study area. Only questions that
were critical to answering the research questions of this study were tested in this
27

method. Since participants were allowed to "skip" questions at their choosing, there
were null answers for some of the questions, but these "missing responses" were
excluded from all statistical tests in SPSS.
28

CHAPTER III
LITERATURE
Food Desert Research
This chapter summarizes previous studies concerning the definitions of food
deserts, and how the lack of access to fresh produces impacts people's lives. Given
the popularity of this topic, it comes as no surprise that the literature on the subject
comes from a broad range of disciplines, from geography, public health, and
community planning. Whatever the discipline, the majority of food desert research
focuses on quantifying and measuring access based on location, irrespective of how
people choose to behave in the pursuit of food. Larsen and Gilliand (2008), for
example, focused on block-group centroid modeling for determining access, whereas
Goldsberry, et al. (2010) focused on visualizing the nutritional terrain through the
availability of fresh food items available in a given area. Both created radically
different interpretations of what a local food environment might look like in a GIS,
but what both studies lacked was the participation of people who actually interact
with their food environment. Whatever the intent of the research, very few studies
ever attempt to illicit the participation of those residing in food desert areas (Reed
2011).
Reed (2011) had limited success while attempting to extend the research of
Goldsberry, et al. (2010) to correlate consumption patterns based on previously
calculated access through the sampling of Lansing, MI, area residents. Moore, et al.
(2008) examined perceptions of access to fresh produce in the context of number of
29
available food retailers in a given area of residents residing in NC, NY, and MD.
Whereas Reed's (2011) scale was local (Lansing, MI), Moore's, et al. (2008) scale
was across several states, and tracked perceptions based on rural, urban and even
suburban communities. Not surprising, they found that people living with areas well
serviced by food retailers have a more positive perception of access when compared
with areas of lower access. In the context of the Lansing area, Reed (2011) discovered
people living in Lansing generally view their food purchases as healthy, and access as
sufficient.
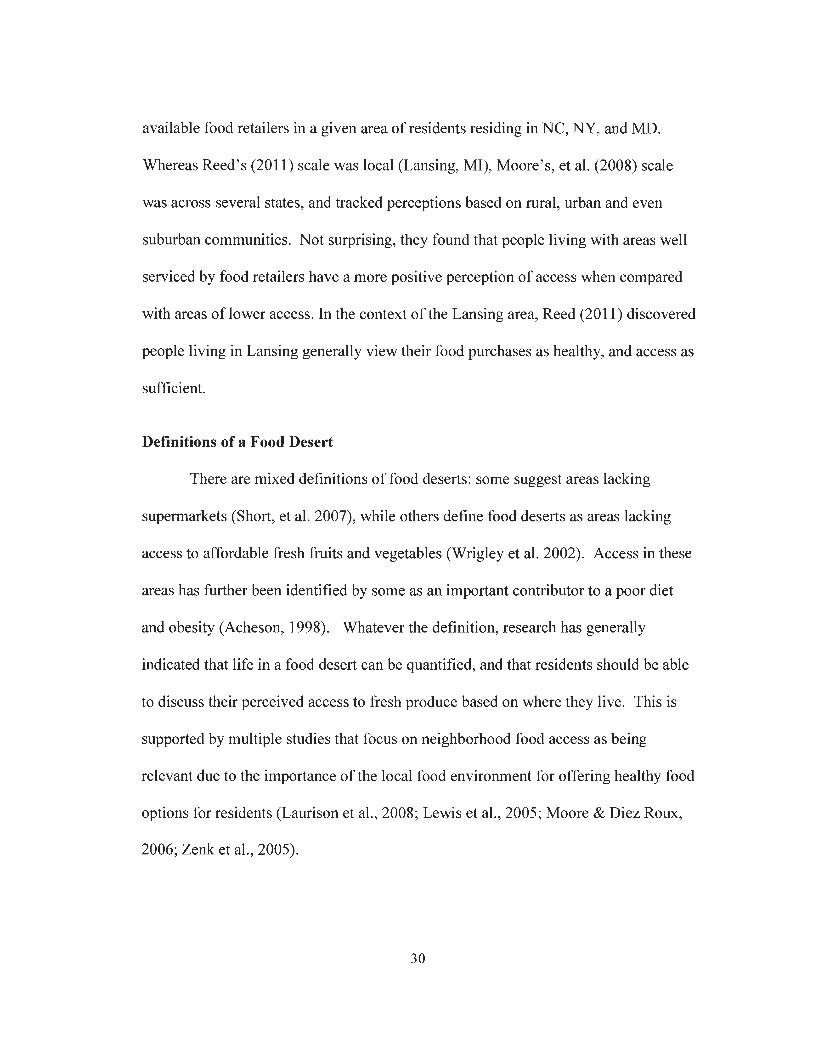
Definitions of a Food Desert
There are mixed definitions of food deserts: some suggest areas lacking
supermarkets (Short, et al. 2007), while others define food deserts as areas lacking
access to affordable fresh fruits and vegetables (Wrigley et al. 2002). Access in these
areas has further been identified by some as an important contributor to a poor diet
and obesity (Acheson, 1998). Whatever the definition, research has generally
indicated that life in a food desert can be quantified, and that residents should be able
to discuss their perceived access to fresh produce based on where they live. This is
supported by multiple studies that focus on neighborhood food access as being
relevant due to the importance of the local food environment for offering healthy food
options for residents (Laurison et al., 2008; Lewis et al., 2005; Moore & Diez Roux,
2006; Zenk et al., 2005).
30
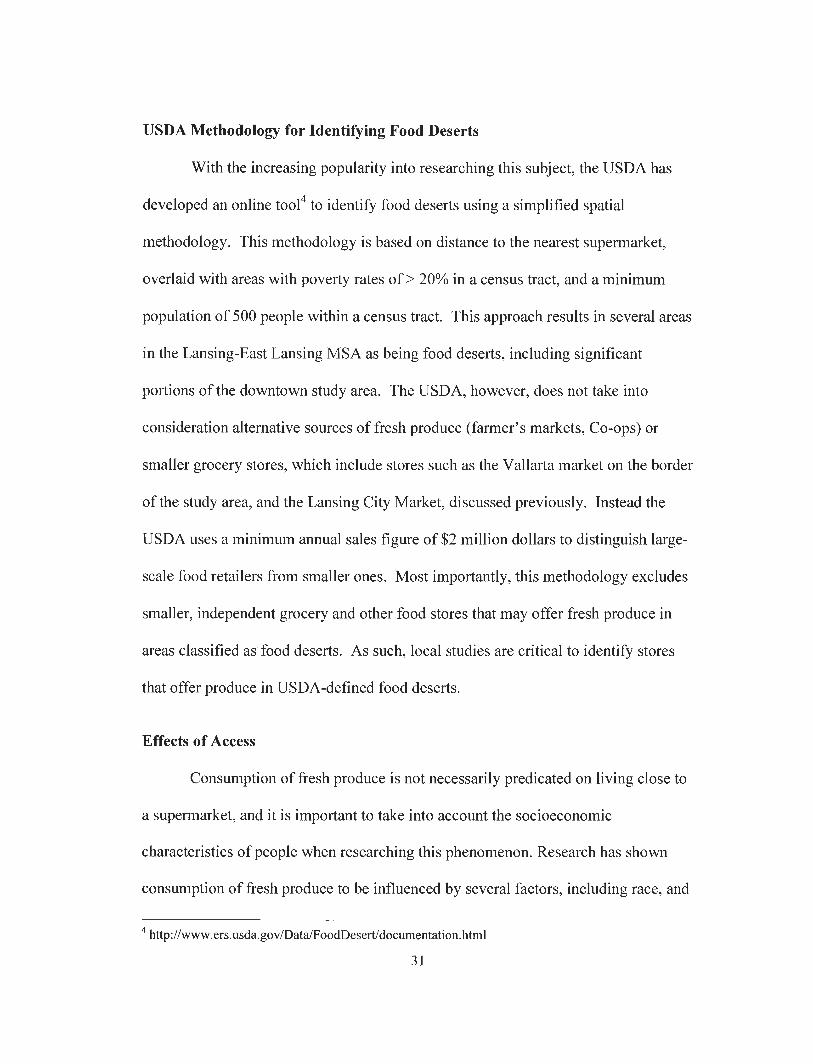
USDA Methodology for Identifying Food Deserts
With the increasing popularity into researching this subject, the USDA has
developed anonline tool4 to identify food deserts using a simplified spatial
methodology. This methodology is based on distance to the nearest supermarket,
overlaid with areas with poverty rates of > 20% in a census tract, and a minimum
population of 500 people within a census tract. This approach results in several areas
in the Lansing-East Lansing MSA as being food deserts, including significant
portions of the downtown study area. The USDA, however, does not take into
consideration alternative sources of fresh produce (farmer's markets, Co-ops) or
smaller grocery stores, which include stores such as the Vallarta market on the border
of the study area, and the Lansing City Market, discussed previously. Instead the
USDA uses a minimum annual sales figure of $2 million dollars to distinguish large-
scale food retailers from smaller ones. Most importantly, this methodology excludes
smaller, independent grocery and other food stores that may offer fresh produce in
areas classified as food deserts. As such, local studies are critical to identify stores
that offer produce in USDA-defined food deserts.
Effects of Access
Consumption of fresh produce is not necessarily predicated on living close to
a supermarket, and it is important to take into account the socioeconomic
characteristics of people when researching this phenomenon. Research has shown
consumption of fresh produce to be influenced by several factors, including race, and
4http://www.ers.usda.gov/Data/FoodDesert/documentation.html
31

the number of available stores. Morland et al. (2002) found differences in African-
American populations residing in census tracts with one or more supermarkets who
were more likely to meet the daily fruit and vegetable consumption recommendations
when compared to similar residents living in census tracts without one. Additionally,
studies have shown that improving access after the construction of a new supermarket
in areas previously underserved saw increases in fruit and vegetable consumption of
area residents (Wrigley et al., 2002), and also that increased access to a supermarket
is associated with lower obesity rates (Morland, et al. 2007). Qualitative research into
food deserts support these findings, and finds that life in a food desert is far from a
minor inconvenience, as access has a considerable impact on the quality of daily life
(Whelan, et al., 2002). This has resulted in the breadth of research on food deserts
focused primarily on physical access to healthy and nutritious foods (Rose &
Richards, 2004; Whelan, et al. 2002) and the benefits that result from increasing
access to supermarkets (Laurison et al., 2008). The rationale behind using
supermarkets as the benchmark for measuring access comes from these stores
offering both higher quality and healthier foods at more affordable prices compared
with smaller stores (Glanz, et al. 2007). However, this approach does not take into
account people's actual behavior or opinion on the matter. This study allows for this
type of interaction, allowing participants to indicate where they shopped for fresh
produce, and did not make assumptions about participants shopping only at the
closest fresh food retailer, which is clearly not always the case.
32

Supermarkets
Certainly, since supermarkets offer a wider variety of fresh produce than
smaller stores, the locations of these stores is critical to research on food deserts. It
becomes vital to determine where consumers actually shop when researching
consumer behavior. The proliferation of supermarkets outside of urban areas in the
United States is attributed to the development of the suburbs (Pothchucki, 2005), as
larger food retailers have fled urban areas in search of available lower-cost land and
the freeway or major arterial road access available in exurban and suburban areas.
These new locations outside urban areas represent a direct threat to smaller urban
markets due to economies of scale offered by supermarkets providing lower costs for
consumers when compared to smaller stores in many urban areas (Alwitt and Donley
1997). This has resulted in a disparity of supermarket access in the United States for
many urban areas (Laurison et al., 2008). This lack of access comes at a cost for
many low-income urban residents, as low-income residents in these areas typically
pay more for groceries at nearby convenience stores, often spend more time traveling
to distant supermarkets, as well as possibly incurring other costs related to forgone
consumption or poor food habits (Cotterill, 1992; Kane, 1990; MacDonald & Nelson
1991; Morland, Wing & Roux, 2002; Pothukuchi, 2005; Whelan, et al. 2002).
Mobility
The trend of supermarket development in low-density areas has resulted in
most Americans shopping for food using an automobile (Handy 1996). However,
even if access were to improve for people in an area with poor access, few people
33

would substitute driving for walking to the grocery store (Dunkley, et al.2004; Hand
and Clifton, 2001; Hallet and McDermott, 2010). Even people without access to cars
would rather borrow a car, share a ride, or take a taxi to purchase groceries (Clifton,
2000) over the other options available to them. However, the effects of life in a food
desert will vary greatly for people facing different transportation methods, as travel
time is an additional cost, as is the opportunity cost of time spent travelling greater
distances to stores (Hallett and McDermott, 2010). This level of mobility for an
individual is an important factor when attempting to assess healthy food access (Reed
2011), and is a critical component in understanding how people are required to
interact with their local food environment. Even though people in the Lansing area
rely primarily on the automobile for daily tasks, there is a viable bus-based mass-
transit system with the Capital Area Transit Authority (CATA), which operates on 7-
day a week, with reliable service to locations throughout the Lansing-area. However,
Giuliano (2005) finds that while the poor use mass transit more, they like it less, and
that owning a car is the only reasonable option for basic household maintenance and
income generation. Even though mass transit is available in the Lansing area,
walking is still a critical component in this method of transit. Larsen and Gilliand
(2008) concede that modeling for mass transit requires including walking into these
calculations, as people are required to walk to and from a bus stop close to home, and
close to their destination.
34

Dietary Influences
The basis of this research is predicated on exploring the conflicting views of
the effects of living in food desert as it relates to the consumption of fresh produce.
While some studies on food deserts have shown this phenomenon as important
contributors to poor diet (Acheson, 1998), Cummings and Macintyre (2002)
discussed the lack of empirical evidence for this hypothesis. Pearson et al. (2005)
suggested that the lack of a locally available supermarket is not a factor that
influences fruit and vegetable intake. Pearson found that the predominant factors
influencing fruit and vegetable consumption are cultural differences, including gender
and age, and not poverty or distance. These findings were confirmed by Dubowitz et
al.(2008) that state the socioeconomic status of a neighborhood influences fruit and
vegetable intake, and that individual characteristics including sex, ethnicity, education
and income are related to fruit and vegetable intake. This provides a rationale for
analyzing perceptions of access in this research in the context of both living in the
food desert, but also the socioeconomic characteristics of study participants, primarily
gender, age, income, level of education and even race.
Dehghan (2011) shows a distinct relationship between income and gender and
the increased consumption of fresh produce in a survey-based study of Canadian
adults. Of those participating, 15.6% of men self-reported, using a 24-hr intake recall
survey, five or more servings of fresh fruit and vegetables in a day. This is contrasted
with 31.4% of women reporting daily consumption of five or more servings of fresh
fruit and vegetables in a day. Income level in this study also showed increases in the
35

frequency a person would consume greater than or equal to 5 servings of fresh fruit
and vegetables. The lowest reported income earners reported 21.8% of participants
indicating 5 or more, with the second lowest income earners reporting 18.9% of
participants eating the same amount. However, the trend increased up to 25.3% of
participants of the highest income bracket in the survey consuming 5 or more
servings of fresh fruit and vegetables. Interestingly, those with a post secondary
degree (86.7%) dominated participation in this survey, and despite 39.9% of
participants self reporting a BMI index suggesting overweight or obese, only 4.7%
reported being in poor health.
Supermarket access, according to Moore et al. (2007), influences dietary
intake. They found that individuals without access to a supermarket near their home
are 25-46% less likely to have a healthy diet compared to participants in areas with
access near their home. After the opening of a large food superstore closer to their
home, thus increasing access for residents, Wrigley et al. (2002) found that people
who consumed fewer than two servings of fruits and vegetables per day increased
consumption of these items by 34% after the store's opening. Moore et al. (2007)
confirmed previous work showing a relationship between supermarket availability
and dietary patterns. However, a strong model to define these influences on dietary
behavior does not currently exist (Reed, 2011; Laraia,, et al. 2004; Ball, et al, 2006).
Studies that focus on only one source for food, specifically grocery stores and
supermarkets provide a misleading view of food deserts (Bitler and Haider, 2010).
36

Lack of access in an area does not mean an individual is limited to shopping there
(Morland, et al.2002).
Overall, the literature provides often conflicting information concerning the
role of access, whether distance or travel time, and the socioeconomic characteristics
of an individual, when analyzing differences in the consumption of fresh produce.
This reflects a lack of a consensus on what actually happens in a food desert when
resident participation is not included, which can be compounded by using GIS to
visualize access in a local food environment. My thesis contributes to the literature
by confronting this lack of consensus directly and focusing on the perceptions as well
as the actions of the consumers living in a food desert. This analysis of Lansing-area
residents, inside and outside the study area while accounting for differences in
gender, age, level of income, level of education, of participants, provides a more in-
depth look at life in a food desert. By including analysis of these factors based on
travel time and car ownership, this study aims to provide a more complete picture of
what affect living in downtown Lansing has on consumers there with respect to the
perceptions as well as the actions this has on consumption of fresh produce.
Lansing Food Environment Studies
This study is not the first to examine the Lansing, MI food environment, but it
does attempt to refine some of the methods previously employed. Duvall, et al.
(2010) conducted an analysis of the availability of the different fresh food options for
Lansing-area residents in all stores, regardless of size or type, with inventory of
available fresh food assembled from store visits between February and April 2008.
37

This enabled Goldsberry (2010) and others to discover through various methods of
analysis several neighborhoods within Lansing with reduced access to fresh produce
compared to other neighborhoods. This census paints a more complete picture of the
Lansing fresh food environment, as few research studies verified lists of food in
stores when analyzing access (Reed 2011).
Goldsberry, et al. (2010) also contributed significantly to the methodology of
food desert studies when they established three different models of access to fresh
produce in Lansing: a container method, a weighted method, and a cumulative
distance method, each model portraying different visualizations of the Lansing food
environment. The container method measured the opportunity to purchase fresh food
in a 10 minute travel time zone for both pedestrians and commuters, and gave equal
weights to items "next door" to an individual and one 10 minutes away (Reed 2011).
The weighted method gives higher accessibility scores to fresh produce items that are
located closer to an individual location than similar fresh produce items that are
located farther away. The third model was the cumulative distance method
establishing an access score based on the overall distance that a consumer would need
to travel to obtain every produce item that was available in Lansing. Reed (2011)
attempted to correlate access to the various methods outlined by Goldsberry et al.
(2010). However, even with access and available produce items well defined, Reed
(2011) indicates there is no relationship between calculated access in the Lansing
area and the consumption of fresh fruits and vegetables.
38

Reed (2011) extended the Goldsberry, et al. (2010) research with the input of
consumers when analyzing the Lansing food-retail environment. This was conducted
at participating food retailers using an intercept methodology to solicit consumer
opinion on access. Overall, Reed found that consumers in the Lansing area generally
have a positive view of their local food environment, generally view their purchases
as being healthy, and were not limited to shopping only at stores closest to home.
Reed's methodology, however, relied upon the participation of a food retailer prior to
interacting with consumers, direct interaction with participants, and limited time in
which to collect survey data. Reed acknowledges that direct interaction with the
researcher could influence participants to provide more socially acceptable answers,
pursuant to findings of Tyebjee (1979). However, Reed did not attempt to ascertain
whether people living inside or outside of a food desert would self-report different
views of their local food environment when compared to a similar resident outside
one.
Previous Participant-based Studies on Food Environments
Even within the general definitions of food deserts, it is accepted that access
to fresh produce is limited in areas designated as food deserts, despite the varying
definitions and criteria, discussed earlier. While some argue that physical access to a
store plays a role in influencing what a person eats (Acheson, 1998), the predominant
factor appears to be unique to the individual. This could be income, culture, or other
factors causing a consumer to prefer fresh fruit and vegetables over other food
options (Pearson et al. 2005). If the above statements are true, it can be assumed that
39

a person living in a food desert may be unhealthier compared to a similar person
living in an area with more fresh food options. If a person lives in an area with better
access, that person could potentially consume healthier food options. It is therefore
reasonable to assume that this person will view themselves as healthier when
compared to a similar person living inside a food desert. A logical conclusion of life
in a food desert, assuming that each individual is a rational actor, is that a person in a
food desert will view themselves, and their choices, as being unhealthier when
compared with a similar person in an area of improved access. However, is this
assumption reasonable?
Recent research about the available fresh food in the Lansing looking to
establish a relationship between consumption and access proved mostly illusive. This
is highlighted by Reed's (2011) findings that were unable to correlate access and
consumption. Given the multitude of factors identified previously in the literature
concerning fresh food consumption to race, income, method of transit and even
proximity to a supermarket, how do the people that live in a food desert perceive their
access? Do their perceptions ultimately uphold or dismiss the very notion of the food
desert debate when compared to other residents in a local geographic area?
Moore, et al.(2008) conducted a random telephone digit survey of over 5,700
residents in Maryland, North Carolina, and New York and found a strong relationship
between perceived availability of healthy foods and the overall density of available
food stores in a geographic area. Unlike many previous studies cited in this review,
this study was not limited to simply mapping supermarkets and grocery stores, but
40
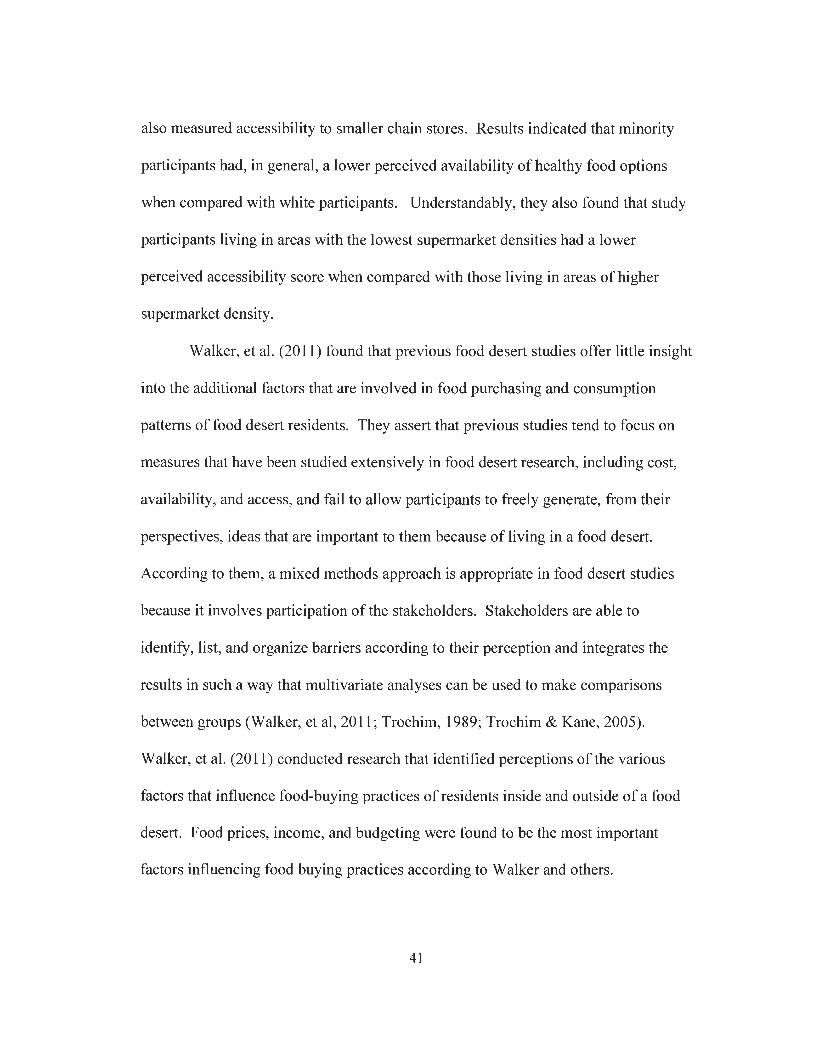
also measured accessibility to smaller chain stores. Results indicated that minority
participants had, in general, a lower perceived availability of healthy food options
when compared with white participants. Understandably, they also found that study
participants living in areas with the lowest supermarket densities had a lower
perceived accessibility score when compared with those living in areas of higher
supermarket density.
Walker, et al. (2011) found that previous food desert studies offer little insight
into the additional factors that are involved in food purchasing and consumption
patterns of food desert residents. They assert that previous studies tend to focus on
measures that have been studied extensively in food desert research, including cost,
availability, and access, and fail to allow participants to freely generate, from their
perspectives, ideas that are important to them because of living in a food desert.
According to them, a mixed methods approach is appropriate in food desert studies
because it involves participation of the stakeholders. Stakeholders are able to
identify, list, and organize barriers according to their perception and integrates the
results in such a way that multivariate analyses can be used to make comparisons
between groups (Walker, et al, 2011; Trochim, 1989; Trochim & Kane, 2005).
Walker, et al. (2011) conducted research that identified perceptions of the various
factors that influence food-buying practices of residents inside and outside of a food
desert. Food prices, income, and budgeting were found to be the most important
factors influencing food buying practices according to Walker and others.
41

Capps and Nayga (1999), using correlation analysis, found that income was
positively related to the likelihood that an individual would perceive maintaining a
healthy weight as important. This study also found that African American
respondents assigned less importance than whites to use of sugar in moderation, eat a
variety of foods, and choose a diet with plenty of breads, cereals, rice and pasta.
However, African Americans are more likely to perceive maintaining a healthy
weight as important when compared to whites. Age increases the likelihood that an
individual would use salt and sugar in moderation, consume more fruits and
vegetables, and consume adequate fiber in their diet. This was consistent with
previous studies that found that older consumers appear to care more about their diet
than younger consumers (Dolby, 1996; Patterson et al., 1996). In terms of geographic
location, Midwesterners prefer a diet with plenty of breads, cereals, rice and pasta
when compared to low fat diets. Previous studies imply that men are typically less
interested in diet and health issues than are women (Dolby, 1996; Food Marketing
Institute, 1990; Nayga, 1997).
Literature on Methods
As indicated in the previous sections of this chapter, most research of food
environments has relied on assumptions, and not on information from people as they
interact with their food environment (Reed 2011). Survey research has been an
important tool in geographic research for decades and is designed to acquire
information about the characteristics and behaviors of a population through
standardized questionnaires (McLafferty, 2010). Reed (2011) successfully employed
42

survey research in the study of the Lansing Food Environment, as did Simms (2011)
when investigating attitudes of consumers toward Farmers Markets in Southwest
Michigan. In geographic research, questionnaire surveys are used to examine
environmental perceptions and consumer choices (Rushton, 1969; Gould and White,
1974). This is a useful tool for gathering information about individuals' lives not
available from secondary sources (McLafferty, 2010). Online surveys, particularly
those through SurveyMonkey.com, are effective at gathering data from a geographic
area in studies on food and perception, notably with Simms' (2011) recent
examination of consumers in Southwest Michigan. The proliferation of the internet
over the past decade into most homes makes it an effective medium in which to
conduct this research.
43

CHAPTER IV
RESULTS AND DISCUSSION
Results Overview
This section will cover the results and discussion associated with the various
statistical analyses performed using the responses from the survey. Baseline
demographic information and their distributions between participants inside and
outside the study area will be addressed first. This will then be followed by an
analysis of the Likert-type ordinal variables using Chi-square analysis for participants
inside and outside the study area, with raw-mean scores providing a narrative and
interpretation as to whether the response to a particular question was positive/agree,
neutral or negative/disagree. To account for any explanatory effects associated with
participants demographic information, the same ordinal Likert-type questions were
analyzed across categories of income, age, race, gender, travel time, level of
education, and car-ownership to determine what affect these had on the survey
responses.
Survey responses were relatively well distributed across the Lansing area
(Figure 4.4), and showed higher concentration of responses, outside of the study area,
in areas east, west and south of the study areas. Participation rates for people outside
of Lansing were more unevenly distributed, and as distance from the study area
increased, the rate of participation among area residents decreased.
44
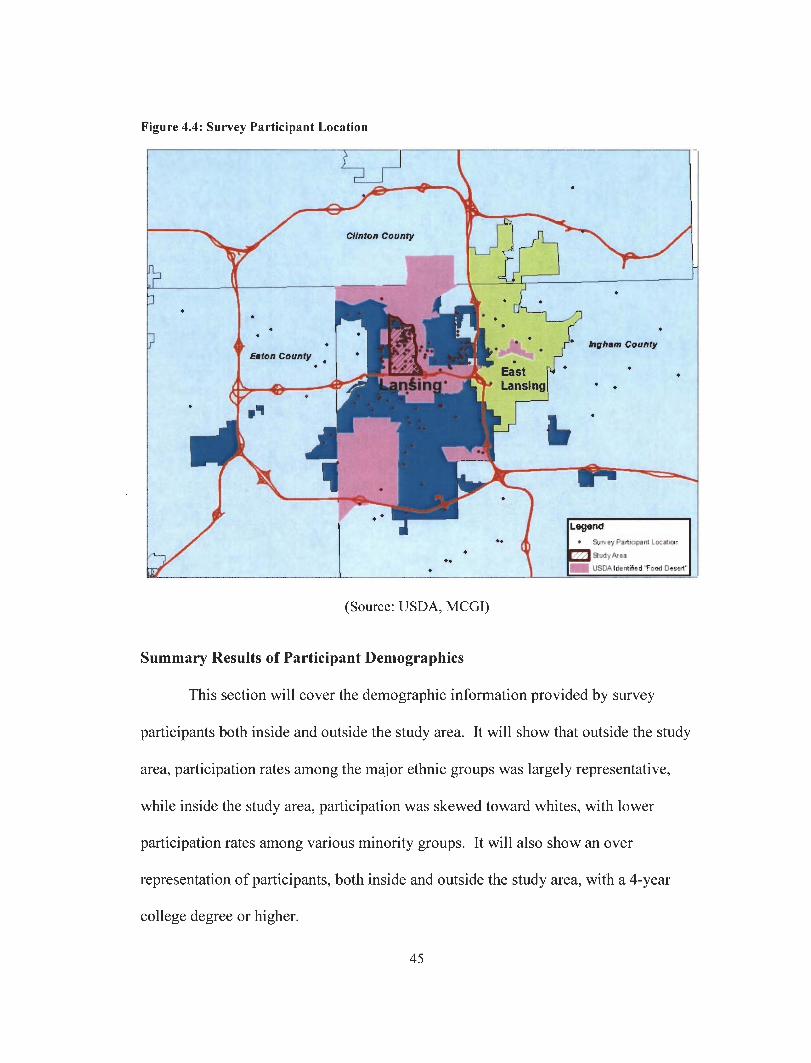
Figure 4.4: Survey Participant Location
ILegendI ♦ Survey Participant location
T RudyAtmif USDA Identified 'Food Desert'
(Source: USDA, MCGI)
Summary Results of Participant Demographics
This section will cover the demographic information provided by survey
participants both inside and outside the study area. It will show that outside the study
area, participation rates among the major ethnic groups was largely representative,
while inside the study area, participation was skewed toward whites, with lower
participation rates among various minority groups. It will also show an over
representation of participants, both inside and outside the study area, with a 4-year
college degree or higher.
45
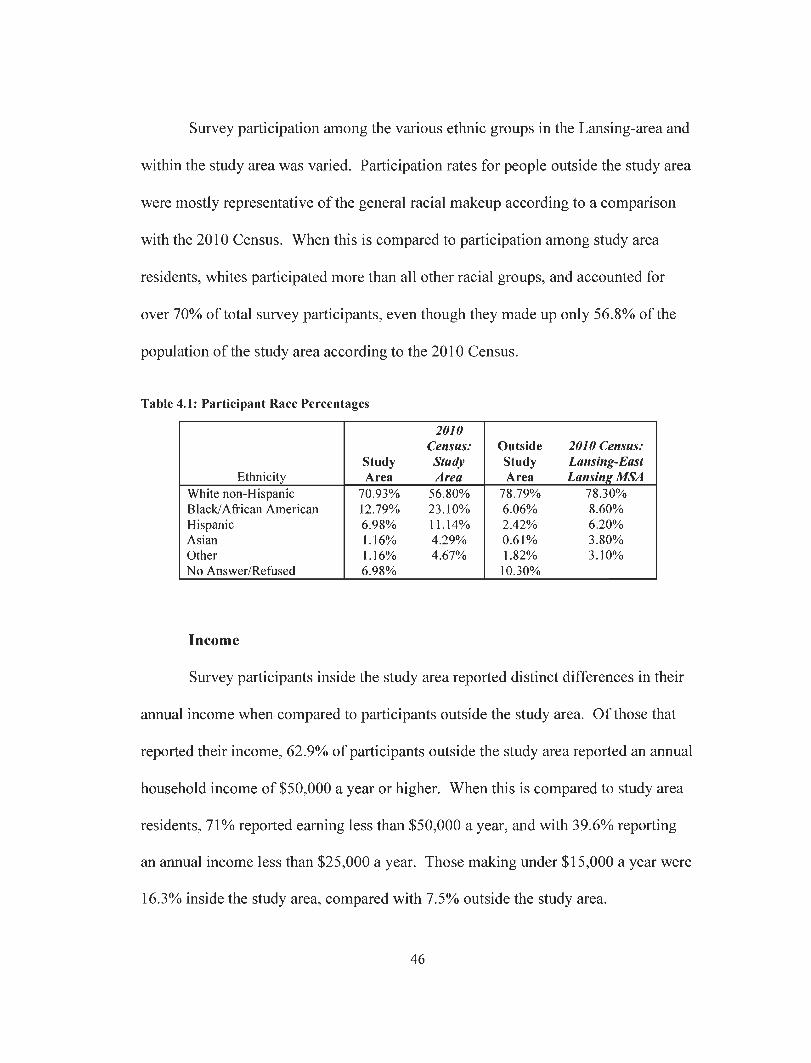
Survey participation among the various ethnic groups in the Lansing-area and
within the study area was varied. Participation rates for people outside the study area
were mostly representative of the general racial makeup according to a comparison
with the 2010 Census. When this is compared to participation among study area
residents, whites participated more than all other racial groups, and accounted for
over 70% of total survey participants, even though they made up only 56.8% of the
population of the study area according to the 2010 Census.
Table 4.1: Participant Race Percentages
2010
Census: Outside 2010 Census:
Study Study Study Lansing-EastEthnicity Area Area Area Lansing MSA
White non-Hispanic 70.93% 56.80% 78.79% 78.30%
Black/African American 12.79% 23.10% 6.06% 8.60%
Hispanic 6.98% 11.14% 2.42% 6.20%
Asian 1.16% 4.29% 0.61% 3.80%
Other 1.16% 4.67% 1.82% 3.10%
No Answer/Refused 6.98% 10.30%
Income
Survey participants inside the study area reported distinct differences in their
annual income when compared to participants outside the study area. Of those that
reported their income, 62.9% of participants outside the study area reported an annual
household income of $50,000 a year or higher. When this is compared to study area
residents, 71% reported earning less than $50,000 a year, and with 39.6% reporting
an annual income less than $25,000 a year. Those making under $15,000 a year were
16.3% inside the study area, compared with 7.5% outside the study area.
46

Table 4.2: Self-Reported Income Ranges
Age
Annual Income RangeWithin Study Area
No Yes
Under $15,000 a year 7.5% 16.3%
$15,001 to $25,000 6.9% 23.3%
$25,001 to $50,000 22.6% 31.4%
$50,001 to $75,000 27.0% 19.8%
$75,001 to $100,000 18.9% 9.3%
$100,001 to $150,000 15.1% 0.0%
More than $150,001 1.9% 0.0%
Table 4.3: Self-Reported Age Groups
What is your approximate age?Within Study Area
TotalOut In
18-24Count
%
12
8.3%
4
5.0%
16
7.1%
25-35Count
%
77
53.5%
28
35.0%
105
46.9%
36-45Count
%
31
21.5%
16
20.0%
47
21.0%
46-55Count
%
18
12.5%
14
17.5%
32
14.3%
56-65Count
%
5
3.5%
15
18.8%
20
8.9%
66+Count
%
1
.7%
3
3.8%
4
1.8%
Total Count
%
144
100.0%
80
100.0%
224
100.0%
Inside the study area, 55% of participants reported being between the ages of
25 and 45 (Table 3), compared to 53.5% of participants outside the study area
reporting an age their ages between 25-35. Participants were not asked to provide
their actual age, but were allowed to report it, if they chose to, in 10-year increments,
save the 18-24 range. Age groups for above the age of 76 were grouped into a 66+
47

age bracket during the analysis due to low participation rates of people over the age
of 66.
Educational Achievement
Overall, the educational achievement levels of study participants varied only
slightly inside and outside of the study area. With 138 participants reporting their
educational achievement outside the study area, with 27 non-responses, 68.1% had a
4-year degree or higher, compared to 59.2% inside the study area. All told, 38.4%
outside the study area had a bachelor's degree compared to 34.2% inside the study
area. Post-secondary educational achievement was 29.7% outside the study area,
compared to 25% inside the study area. No one outside the study area reported
having less than a 9 grade level of education, and this was at 1.3% inside the study
area. The percentage of participants with an associate's degree outside the study area
was around 8.7%, and 1.3% inside.
Table 4.4: Self-Reported Level of Education
Level of Education
Within Study Area
No Yes
Less than 9th grade 0.0% 1.3%
Some High School 2.9% 6.6%
High School/GED 14.5% 22.4%
Some College 5.8% 9.2%
Associates 8.7% 1.3%
Bachelor's Degree 38.4% 34.2%
Masters/JD 27.5% 22.4%
PhD/MD 2.2% 2.6%
48

Consumer Behavior and Travel Times
This section will provide a general overview of how participants inside and
outside the study area interact with the Lansing food environment. It will analyze the
results of survey responses in which participants identified their primary and
secondary sources of fresh produce, their mode of transportation to and from the
store, travel time, opinion of local food retailers, and frequency shopping at the major
food retailers. It will show that the residents inside and outside the study area general
travel using similar methods, to similar stores. However, while all survey
respondents report shopping at similar stores and use roughly similar means, it will
also show that study area residents take longer to arrive at their preferred destination.
Primary Method of Shopping and Car Ownership
The vast majority of respondents inside and outside the study area rely on cars
when purchasing food, with usage rates of 91.6% outside the study area, and 79.7%
inside the study area. The use of a bus was not widely reported for people outside the
study area, with only one respondent, or .7%, indicating they used a bus to purchase
food. This contrasts with a nearly 11.4% of study area participants relying on the bus
when purchasing food. Rates of shopping by foot and bike were reported at 2.8%
each outside the study area, and 2.5% each inside the study area. People that share a
ride with a friend, neighbor or relative accounted for 2.1% of respondents outside the
study area, and 3.8% inside the study area. These findings support previous research
that few people are willing to substitute driving for walking, or biking (Dunkley, et
al.2004; Hand and Clifton, 2001; Hallet and McDermott, 2010).
49

Summary Results of Travel Time to Primary and Secondary Food-
Retailers
The only major difference between participants inside and outside the study
area as it relates to shopping is the time spent travelling to their preferred primary and
secondary food retailers. Table 4.6 shows that mean travel times for study area
residents is around 5 minutes greater, irrespective of method, for both primary and
secondary stores. This suggests that the critical factor that could influence perception
of access is time.
Table 4.5: Self-Reported Travel Times
Within Study Area Mean: Std. Deviation
Out In Out In
How long does it typicallytake you to reach yourprimary food retailer? Inminutes:
10.51 15.74 6.538 8.936
N =138 N =78
How long does it typicallytake you to reach yoursecondary food retailer?In minutes:
11.02 16.74 7.783 12.703
N= 136 N=74
Overall, study-area residents indicate an average travel time of around 16
minutes to their primary food retailer, and around 17 minutes to their secondary food
retailers, irrespective of method of transit. When we compare these to participants
outside the study area, their indicated average travel time was around 11 minutes for
both primary and secondary food retailers. Study-area participants had a greater
range in values, with a standard deviation of around 9 minutes for their primary food
retailer, and 13 minutes for their secondary food retailer. The standard deviation for
50

travel times to primary and secondary food retailers for participants outside the study
area were around 6.5 and 8 minutes, respectively.
Table 4.6: Self-Reported Travel Time t-test Results
Levene's Test for
Equality ofVariances t-test for Equality of Means
F Sig. df
Sig. retailed)
Mean
Difference
How long does ittypically take you to Equalreach your primary variancesfood retailer? In assumed
minutes:
2.143 .145 214 0.000002 -5.236
How long does it _ .typically take you to .
. . variancesreach your secondaryfood retailer? In
assumedminutes:
9.630.002
103.528 .001 -5.721
Primary and Secondary Sources of Fresh Produce
This section will summarize the results of the open-ended questions that
allowed survey participants to freely indicate their primary and secondary sources of
fresh produce in the Lansing area. While there is perhaps little distinction in the mind
of the public as to the difference between a supermarket and grocery store, for the
purposes of this research, grocery stores were identified as those stores who provided
food stuffs only, and that offered a significant variety of fresh produce, and other
edible items. Examples of grocery stores in the Lansing area include Kroger, Good
Rich's, Vallarta Market, Adam's Market, and Horrocks. Even though Horrocks
describes itself as a "farmer's market", their year-round operation, and imported
51

produce from outside the region, suggest otherwise. Supermarkets included stores
like Meijer and Wal-Mart, which also offered consumer items in addition to selling
groceries.
Table 4.7: Self-Reported Primary Type of Fresh Food Provider
Primary Food RetailersWithin Study Area
No Yes
Supermarket 45.8% 50.6%
Grocery Store 40.3% 45.5%
Farmer/City Market 5.6% 2.6%
Community Garden 0.7% 0.0%
Personal Garden 2.1% 0.0%
Co-Op 2.8% 1.3%
CSA Farms 2.8% 0.0%
Results clearly show the dominance of supermarkets and grocery stores as
sources of fresh produce for Lansing area residents. Both study area and non-study
area participants rely primarily on supermarkets or grocery stores as their source for
fresh produce, accounting for 86.1% for participants outside the study area, and
96.1% inside the study area. Participants outside the study area indicated greater
variability in alternative sources of fresh produce, with approximately 14% indicating
either relying a farmers markets/city market, community garden, food co-ops, or a
CSA farm as their primary source of fresh produce. No study-area participants
indicated using personal gardens, community gardens, or a CSA Farm as their
primary source of fresh produce. However, 2.6% indicated that they shopped at a
52

farmer's market or city market, and 1.3% indicated they shopped at a food co-op
during the study period.
When examining secondary sources of fresh produce, a plurality exists in the
sources of fresh produce for Lansing area residents, both inside and outside the study
area. While approximately 65.3% of residents outside the study area indicate
shopping at either a grocery store or supermarket as their secondary source of fresh
produce, 22.9% indicate shopping at a Farmer's Market or the City Market. These
rates were similar for study area participants as well, with approximately 74.7%
relying on grocery stores or supermarkets, and 16% for Farmer's or the City Market,
as their secondary source of fresh produce. Approximately 1.3% of study area
participants indicated using their personal garden to provide fresh produce, and 5.3%
indicated shopping at a Health Food Store. No study area participants indicated using
either a community garden or Co-op as their secondary source of fresh produce.
Interestingly, and contrary to suggestions in the literature, study area
participants reported shopping at convenience stores almost equally as participants
outside the study area, at 2.7% and 2.1%, respectively. As previously indicated, all
responses identifying primary and secondary sources were open-ended. While no one
indicated shopping at a 7-11, or other smaller convenience store, each participant was
given equal opportunity to accurately account for their shopping behavior by
identifying these sources of food. This suggests, but is not entirely verifiable due to
the skewed demographic data, that study area participants are not constrained in their
access.
53
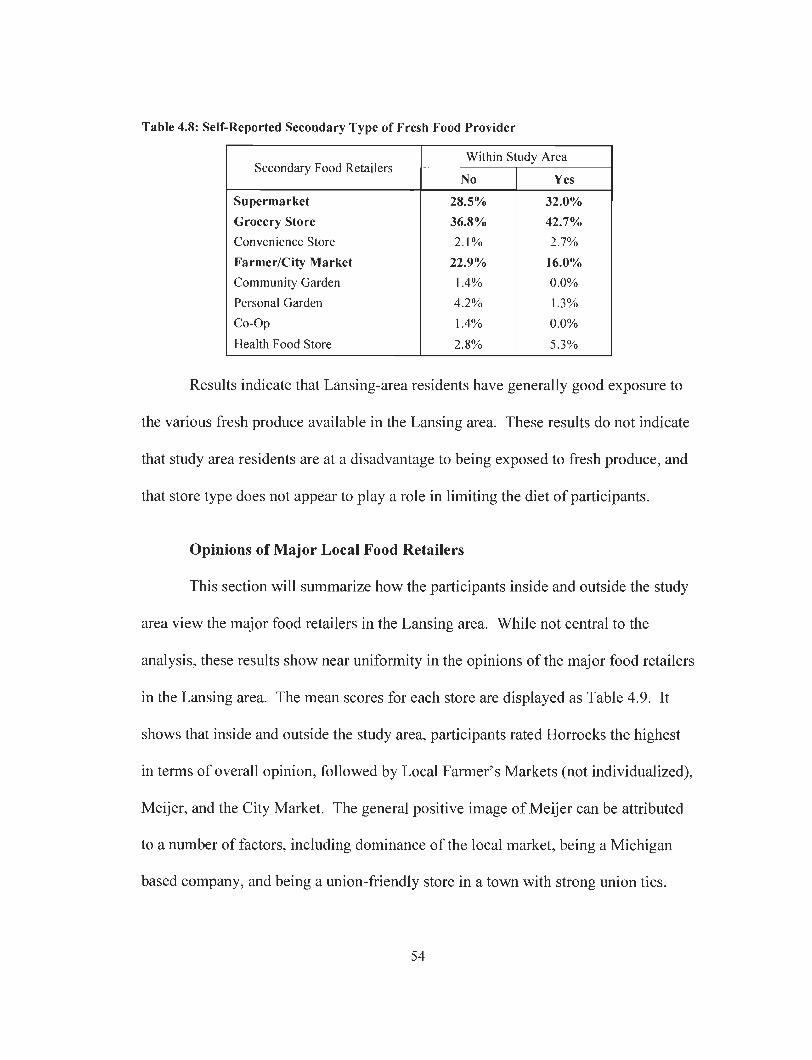
Table 4.8: Self-Reported Secondary Type of Fresh Food Provider
Secondary Food RetailersWithin Study Area
No Yes
Supermarket 28.5% 32.0%
Grocery Store 36.8% 42.7%
Convenience Store 2.1% 2.7%
Farmer/City Market 22.9% 16.0%
Community Garden 1.4% 0.0%
Personal Garden 4.2% 1.3%
Co-Op 1.4% 0.0%
Health Food Store 2.8% 5.3%
Results indicate that Lansing-area residents have generally good exposure to
the various fresh produce available in the Lansing area. These results do not indicate
that study area residents are at a disadvantage to being exposed to fresh produce, and
that store type does not appear to play a role in limiting the diet of participants.
Opinions of Major Local Food Retailers
This section will summarize how the participants inside and outside the study
area view the major food retailers in the Lansing area. While not central to the
analysis, these results show near uniformity in the opinions of the major food retailers
in the Lansing area. The mean scores for each store are displayed as Table 4.9. It
shows that inside and outside the study area, participants rated Horrocks the highest
in terms of overall opinion, followed by Local Farmer's Markets (not individualized),
Meijer, and the City Market. The general positive image of Meijer can be attributed
to a number of factors, including dominance of the local market, being a Michigan
based company, and being a union-friendly store in a town with strong union ties.
54
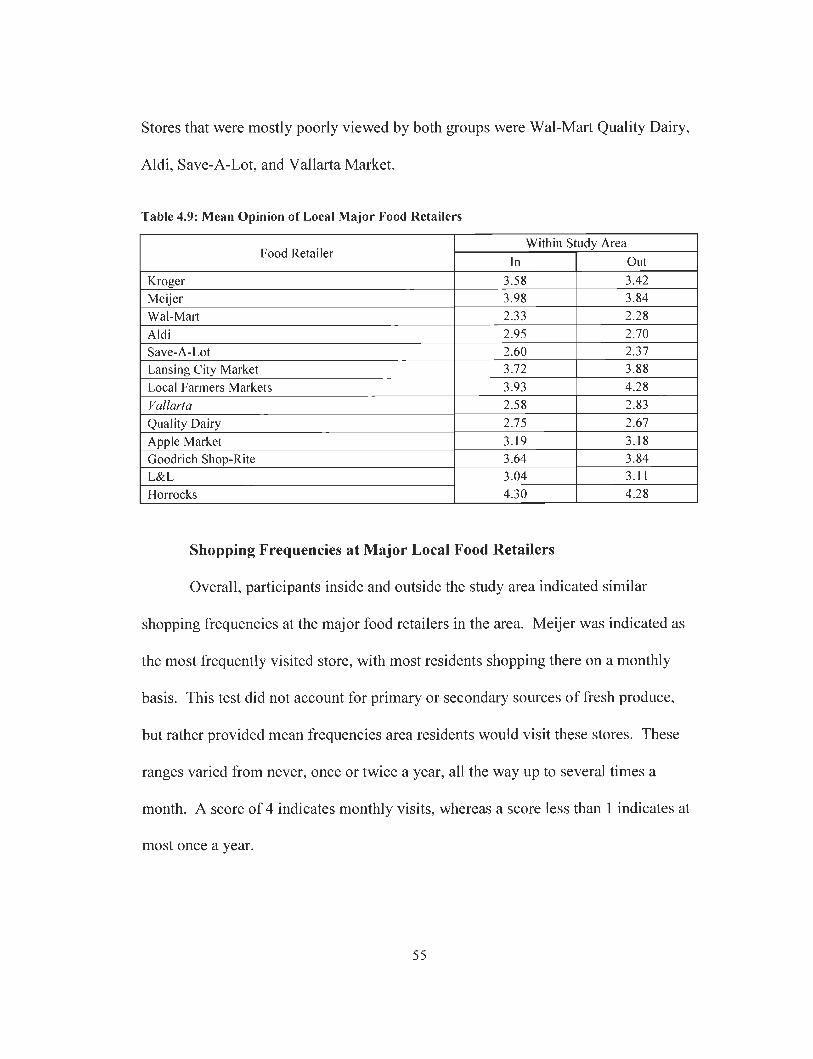
Stores that were mostly poorly viewed by both groups were Wal-Mart Quality Dairy,
Aldi, Save-A-Lot, and Vallarta Market.
Table 4.9: Mean Opinion of Local Major Food Retailers
Food RetailerWithin Study Area
In Out
Kroger 3.58 3.42
Meijer 3.98 3.84
Wal-Mart 2.33 2.28
Aldi 2.95 2.70
Save-A-Lot 2.60 2.37
Lansing City Market 3.72 3.88
Local Farmers Markets 3.93 4.28
Vallarta 2.58 2.83
Quality Dairy 2.75 2.67
Apple Market 3.19 3.18
Goodrich Shop-Rite 3.64 3.84
L&L 3.04 3.11
Horrocks 4.30 4.28
Shopping Frequencies at Major Local Food Retailers
Overall, participants inside and outside the study area indicated similar
shopping frequencies at the major food retailers in the area. Meijer was indicated as
the most frequently visited store, with most residents shopping there on a monthly
basis. This test did not account for primary or secondary sources of fresh produce,
but rather provided mean frequencies area residents would visit these stores. These
ranges varied from never, once or twice a year, all the way up to several times a
month. A score of 4 indicates monthly visits, whereas a score less than 1 indicates at
most once a year.
55

Residents inside the study area generally avoid shopping for fresh produce at
the Vallarta market, and indicate similar shopping frequencies at the Lansing City
Market, as shown in Table 4.10. Open-ended responses from consumers inside and
outside the study area offer some insight into these decisions, highlighting quality of
produce and price of produce at these locations. The Lansing City market, while
viewed favorably, was cited as having higher-priced produce compared to other
Lansing food-retailers, whereas the Vallarta market was cited as having lower quality
produce. Residents inside the study area indicate they would use the Lansing City
Market more if prices were more competitive, and offered more convenient hours to
fit their schedule. Respondents have clearly indicated frustration at the Vallarta
market, repeatedly stating they sell "out-dated produce and can-goods" due to the
impression that the market knows many local residents have no other options.
Respondents inside the study area also indicated a lot of frustration about the
closing of L&L, and it has been shown to impact the purchasing patterns of residents
in the Lansing area. Those in the downtown study area saw two of these stores close
near the study area, but even residents in other areas of Lansing have indicated that
they, too, have been affected by these closings.
Negative responses, however, were also mixed in with several respondents
stating that they had "no problem" securing the fresh produce they wanted. Several
indicated using multiple stores for their sources of food, indicating an interaction with
multiple stores in the local food environment.
56

Table 4.10: Mean Shopping Frequency of Local Major Food Retailers
Food RetailerWithin Study Area
Yes No
Kroger 2.92 2.87
Meijer 4.00 3.90
Wal-Mart/Sam's 1.05 1.15
Aldi .96 .61
Save-A-Lot .52 .37
Lansing City Market 2.21 2.19
Farmers Markets 2.29 2.88
Vallarta 1.01 .25
QD 1.32 .89
Apple Market .96 .84
Goodrich 1.39 1.65
L&L .80 .93
Horrocks 2.87 2.49
Reasons for Choosing Food Retailers
Participants indicated a multitude of reasons when choosing food retailers in
the Lansing-area, including proximity to home/work/school, price, quality and variety
of produce, and even convenience. These questions address why they chose one store
over another, but did not attempt to ascertain the decisions participants made once
they entered the store. Chi-square analysis of the various reasons for choosing their
primary retailer was conducted controlling for residency inside and outside of the
study area. The analysis revealed that residency in the study area did not influence
whether a person would behave differently than residents outside the study area
simply based on living there (x =1.452, df = 3, p = .693). Further analysis,
accounting for income, gender, level of education, car ownership and travel time, did
reveal some differences among the participants across the Lansing food environment.
This section will provide a brief discussion of these results in an attempt to better
57

describe how these variables appear to impact a person's interactions with the local
food environment. Choice based on convenience and hours of operation for a food
retailer were rated consistently low for all factors, with only 8 of the total respondents
indicating this as the defining reason for choosing their primary food retailer, and will
not be addressed when discussing these socio-economic variables.
Gender had some low-level explanatory power, but was not found to be
statistically significant (x = 7.363, df =3, p = .061). Proximity was the most often
indicated reason for men, accounting for 49.3% of the responses, compared with
29.5% of women indicating the same reason. Quality and variety was the most
indicated reason for women, accounting for 50% of responses, compared to 37.3% of
men indicating the same reason. Generally speaking women in the Lansing area are
driven primarily by the quality and variety of the produce at a food retailer, whereas
men are driven primarily by the distance to these locations.
Income by group, on the other hand, did not reveal anything extraordinary,
nor were the differences statistically significant (x2= 10.933, df= 9,p = .28). The
lowest income group bracket, 0-25 K a year, had a plurality of choices indicating
quality/variety at 39.5%, followed by proximity (30.2%) and price (27.9%). The 25-
50k group also indicated a plurality, with proximity the most indicated choice
(43.1%), followed by quality/variety (39.2%), then price (11.85%). The 50-100k
group had a slight majority of responses indicating quality/variety as their primary
reason for selecting their primary food retailer (50.6%), followed by proximity
(36.7%), and price (8.9%). The 100k+ group was similar to the 50-100k group, with
58

a plurality indicating quality/variety (45%), followed by proximity (40%) and price
(10%).
Car ownership, onthe other hand, was found to bestatistically significant (x2
= 9.217, df = 3, p = .027). Of those owning cars, 48.3% indicated that quality/variety,
compared with non-car owners at 17.6%, as the primary reason for choosing their
primary retailer. Proximity and price were the primary reasons for non-car owners,
understandably, with proximity accounting for 41.2% of respondents, and price
accounting for 35.3% of responses. Given that only 21 total responses in this survey
came from non-car owners, future analysis should include more non-car owners when
analyzing reasons consumers choose one store over another.
Similarly to car ownership rates, travel time groups also indicated different
reasons for choosing stores, which were statistically significant variations (x2 =
16.861, df = 6, p = .01). Those traveling longer than 20 minutes to their primary
retailer were primarily motivated by price and proximity, accounting 38.5% and
30.8% of responses, respectively. Quality/variety of produce was the primary
motivating factor for 10-20 minute group, at 57.8% of responses, indicating that this
group was a highly selective group of consumers that were willing, and able, to travel
these distances to get the produce they wanted. Price and proximity, understandably,
accounted for 15.6% and 23.4% of responses, respectively, of this group. Those
traveling 0-10 minutes were primarily motivated by proximity when choosing their
store, accounting for 45.5% of responses. This was followed by quality/variety at
39.1%, and price at 10.9 %.
59

Level ofeducation was also significant (x2= 7.879, df=3,p = .049) when
accounting for reasons for choosing one store over another. Those with a 4-year
degree or more had a majority of responses indicating that quality/variety was the
primary reason for choosing their store, at 51.3%. This was followed by proximity at
34.5%, and price at 10.1%. Those with less than a 4-year degree were more likely to
indicate proximity as their primary reason, accounting for 41.5% of responses. This
was followed by quality/variety at 32.3%, and price at 21.5%.
Chi-square Analysis of Ordinal Survey Data: Residents Inside and Outside the
Study Area
This section will provide an analysis and discussion of ordinal Likert-type
questions rated by participants inside and outside the study area. It will cover
questions related to perception of access, consumption of fresh and frozen/canned
produce, perceptions of health, and other questions asked in a Likert-type format in
the survey. Pearson's chi-square analysis will be used with an alpha of .05 used for
determining significance. The raw mean score is the score given based on the
numerical value assigned to Likert-type questions, with a 1 being either a very
negative/strongly disagree, 3 being neutral, and 5 being either a very positive/strongly
agree. In order to not violate the rules associated with Chi-square analysis that
requires a minimum of 5 responses, negative/disagree comments were similarly
grouped, neutral responses grouped and positive/agree comments being grouped. The
raw mean score discovered through t-tests will serve as a narrative and interpretation
60

of the scores, whereas the test of significant differences will be through chi-square
analysis.
Question: How would you rate your ability to purchase fresh produce inthe Lansing area given your current mode of transportation?
The results of the Chi-square analysis show in Table 4.11, that there was
significant variation in their perception of access between participants inside and
outside the study area as it related to perception of access for fresh produce (x2=
10.081, df= 2, p = .006). Participants ranked their responses using a 5-point Likert-
type, with 1 = very poorly, 3= neutral, and 5 = very good before they were grouped
into poor, neutral or positive view of access groups. The overall mean score for
residents inside the study area was 3.59 out of 5, or about part way between Average
and Good, compared with 4.17 out of 5 for residents outside the study area. This
shows that residents inside the study area view their access differently, while not
negative, more negatively when compared with residents outside the study area.
61
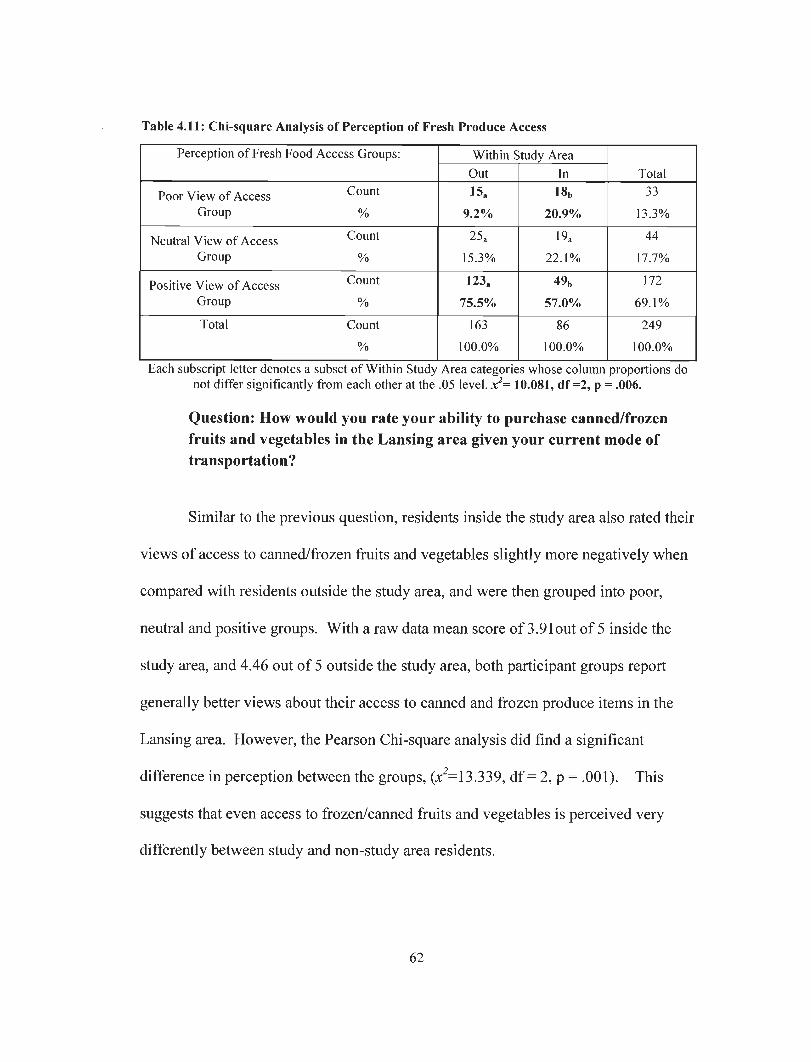
Table 4.11: Chi-square Analysis of Perception of Fresh Produce Access
Perception of Fresh Food Access Groups: Within Study Area
TotalOut In
Poor View of Access CountGroup %
15a
9.2%
18b
20.9%
33
13.3%
Neutral View of Access CountGroup %
25a
15.3%
19,
22.1%
44
17.7%
Positive View of Access CountGroup %
123a
75.5%
49b
57.0%
172
69.1%
Total Count
%
163
100.0%
86
100.0%
249
100.0%
Each subscript letter denotes a subset of Within Study Area categories whose column proportions donotdiffer significantly from each other at the .05 level. a^= 10.081, df =2, p=.006.
Question: How would you rate your ability to purchase canned/frozen
fruits and vegetables in the Lansing area given your current mode of
transportation?
Similar to the previous question, residents inside the study area also rated their
views of access to canned/frozen fruits and vegetables slightly more negatively when
compared with residents outside the study area, and were then grouped into poor,
neutral and positive groups. With a raw data mean score of 3.9lout of 5 inside the
study area, and 4.46 out of 5 outside the study area, both participant groups report
generally better views about their access to canned and frozen produce items in the
Lansing area. However, the Pearson Chi-square analysis did find a significant
difference inperception between the groups, (x2=13.339, df= 2, p = .001). This
suggests that even access to frozen/canned fruits and vegetables is perceived very
differently between study and non-study area residents.
62

Table 4.12: Chi-square Analysis of Perception of Access for Frozen/Canned Produce
Perception of Frozen/Canned produce AccessGroups:
Within Study AreaTotalOut In
Poor View of Access CountGroup %
4a
2.5%
12b
14.1%
16
6.6%
Neutral View of Access CountGroup %
20a
12.7%
14.
16.5%
34
14.0%
Positive View of CountAccess Group %
133a
84.7%
59b
69.4%
192
79.3%
Total Count
%
157
100.0%
85
100.0%
242
100.0%
Each subscript letter denotes a subset of Within Study Area categories whose column proportionsdonot differ significantly from each other at the .05 level. j^=13.339, df =2 p=.001.
Question: What is your overall general opinion about where you
currently live?
Another question that had statistical significance when analyzed was
concerning a participant's general opinion of where they currently lived (x2= 14.519,
df = 2, p = .001). This question used the same general theme of other Likert-type
questions, with 1 = very negative, 3 = neutral, and 5 = very positive. With an overall
mean score of 3.54 out of 5 inside the study area, and a mean score of 4 out of 5
outside the study area, residents living outside of the downtown study area had a
generally more positive view of where they were living. Study area participant
rankings of where they lived suggested positive to overall neutral point of view of
their community.
63

Table 4.13: Chi-square Analysis of Opinion of Community
General opinion of community groups:Within Study Area
TotalOut In
Poor ViewCount
%
13a
8.1%
17b
20.0%
30
12.2%
Neutral ViewCount
%
17.
10.6%
18b
21.2%
35
14.3%
Positive ViewCount
%
130a
81.3%
50b
58.8%
180
73.5%
Total Count
%
160
100.0%
85
100.0%
245
100.0%
Each subscript letter denotes a subset of Within Study Area categories whose column proportionsdonot differ significantly from each other at the .05 level. x2= 14.519, df = 2, p = .001.
Question: I consider myself a healthy person (in shape, free of food-
related diseases - heart disease, diabetes)
Participants inside the study area indicated a higher mean score when asked to
rate whether they viewed themselves as a healthy when compared with participants
outside the study area, with a raw mean of 3.96 out of 5 inside the study area
compared to a raw mean of 3.91 out of 5 outside the study area. The responses were
not statistically different (x = 1.481, df = 2, p = .477), and perception of health does
not differ based on living inside or outside of the study area (See Table 4.14).
However, according to the Michigan Department of Community Health5, the
overweight and obesity rate for residents in Ingham County (home to the study area
and the majority of residents participating in this study) for adults from 2005 to 2007
is approximately 66.3%. It suggests that participants were either unaware of their
http://www.michigan.gov/documents/mdch/Obesity_chapter_283600_7.pdf
64

own health, have a misleading view of their health, or were all mostly healthy and in
shape when completing this survey.
Table 4.14: Chi-square Analysis of Opinion of Health
Opinion of HealthGroups Within Study Area
TotalOut In
CountDisagree Group
/o
25a
15.6%
Ha
13.1%
36
14.8%
CountNeutral Group 0
15a
9.4%
12a
14.3%
27
11.1%
CountAgree Group 0/
120a
75.0%
61a
72.6%
181
74.2%
Total Count
%
160
100.0%
84
100.0%
244
100.0%
Each subscript letter denotes a subset of Within Study Area categories whose column proportions donot differ significantly from each other at the .05 level. jt» 1.481, df = 2,p = .477.
Question: A major portion of my diet comes from fresh fruit and
vegetables (more than 3-5 servings a day)
The analysis of whether consumption rates of fresh produce was statistically
different between participants inside and outside the study area reveal that there is not
a statistically significant difference between population groups (See Table 15). With
a raw mean score of 3.49 out of 5 inside the study area, and a raw mean score of 3.6
out of 5 outside the study area, a Chi-square analysis finds there is no difference (x =
.869, df =2, p = .647). This suggests that both groups view their daily consumption
of fresh produce similarly, and that living within the study area does not impact the
reported consumption of fresh produce. However, not asking directly the number of
fresh produce items consumed on a daily basis may have created some ambiguity in
how participants answered this question. Using a 24-hour recall of fresh produce
65

intake, however, similar to Dehghan (2011) only accounts for produce consumed in
the previous 24-hour period, and does not address whether participants generally
consume significant portions of fresh produce in their diet. This question was
designed to specifically allow residents to describe their overall diet, and not the
previous 24 hours.
Table 4.15: Chi-square Analysis of Fresh Fruit/Vegetables Consumption
Consumption of Fresh Fruit/Vegetable Groups: Within Study AreaTotalOut In
CountDisagree Group
36a
22.4%
23a
27.4%
59
24.1%
CountNeutral Group
28a
17.4%
15a
17.9%
43
17.6%
CountAgree Group
97a
60.2%
46a
54.8%
143
58.4%
Total Count
%
161
100.0%
84
100.0%
245
100.0%
Each subscript letter denotes a subset of Within Study Area categories whose column proportionsdo not differ significantly from each other at the .05 level. jr= .869, df =2, p = .647.
Question: A major portion of my diet comes from canned/frozen fruits
and vegetables (more than 3-5 servings a day)
Considering that most food desert studies focus on the consumption of fresh
produce, this study wanted to include canned/frozen fruits and vegetables in this
analysis. If fresh produce consumption was significantly different between the
population groups, and if consumption of canned/frozen fruits and vegetable
consumption was different between population groups, the reported consumption of
these items provides some additional insight into how the two population groups
viewed their access and consumption of fresh produce. Similar to consumption rates
66

of fresh produce, participants inside the study area and outside the study area display
relatively similar patterns of consumption of frozen/canned fruits and vegetables, and
living within the study area does not appear to impact a person's consumption of
frozen/canned fruits and vegetables. With a raw mean score of 2.54 out of 5 inside
the study area, and a raw mean score of 2.47 out of 5 outside the study area, a Chi-
square analysis found that the difference between this population groups as
statistically insignificant (x2= 1.650, df=2, p = .438). Both groups reported a general
disagreement with the statement that they consume significant quantities of this type
of produce on a daily basis (See table 4.16).
Table 4.16: Chi-square Analysis of Consumption of Frozen/Canned Fruit and Vegetables
Consumption of Frozen Fruit/Vegetable Groups: Within Study AreaTotalOut In
rv ^ CountDisagree Group
94a
60.3%
48a
57.8%
142
59.4%
Neutral Group „,%
31a19.9%
13a15.7%
44
18.4%
„ CountAgree Group
31.19.9%
22a26.5%
53
22.2%
Total Count
%
156
100.0%
83
100.0%
239
100.0%
Each subscript letter denotes a subset of Within Study Area categories whose columnproportions donotdiffer significantly from each other at the .05 level. x*= 1.650, p =.438.
Question: A major portion of my diet comes from pre-prepared meals
(microwave dinners, etc.) (1-2 meals a day or more)
Both participants inside and outside the study area indicated that they did not
consume many pre-prepared meals, with a mean score of 1.87 out of 5 inside the
study area, and a mean score 1.94 out of 5 outside the study area. A Chi-square
analysis of the distribution of answers found no statistical difference (x2= 1.161, df =
67

2, p = .560). The results indicate that consumers in both groups do not generally view
themselves as eating food products that could potentially be detrimental to their
health.
Table 4.17: Chi-square Analysis of Consumption of Pre-prepared Meals
Consumption of Pre-Prepared Meals Group: Within Study AreaTotalOut In
_. _ CountDisagree Group
123a
76.9%
62a
75.6%
185
76.4%
, _ CountNeutral Group
/o
15a9.4%
Ha13.4%
26
10.7%
_ CountAgree Group
%
22a
13.8%
%11.0%
31
12.8%
Total Count
%
160
100.0%
82
100.0%
242
100.0%
Each subscript letter denotes a subset of Within Study Area categories whose column proportions do notdiffer significantly from each other at the .05 level. x?= 1.161, df= 2, p =.560.
Question: I eat several meals a week from fast-food and other
restaurants (3-7 meals a week or more)
Consumption rates of "fast food" and restaurant foods based on living inside
and outside the study area were also found to be statistically insignificant from each
other. With a raw mean score of 2.55 out of 5 inside the study area, and a mean score
of 2.39 out of 5 outside the study area, Chi-square analysis confirmed living within
the study area does not appear to affect consumption of food from outside the home
(x = 3.653, df = 2, p = .161). This analysis demonstrates that, for the most part, self-
reported consumption patterns of "fast food" is not predicated on living within a
USDA-defined food desert, and is relatively uniform across the Lansing food
environment.
68

Table 4.18: Chi-square Analysis of Consumption of Fast-food and Restaurants
Consumption of Fast-Food andRestaurants Groups:
Within Study Area
TotalOut In
CountDisagree Group
96a
60.4%
40a
48.2%
136
56.2%
, _ CountNeutral Group
%
20a
12.6%
16a
19.3%
36
14.9%
a n CountAgree Group43a
27.0%
27a
32.5%
70
28.9%
Total Count
%
159
100.0%
83
100.0%
242
100.0%
Each subscript letter denotes a subset of Within Study Area categories whose column proportionsdonot differ significantly from each other at the .05 level. x*= 3.653, df = 2, p = .161.
Question: I am worried about my diet
Also not affected by living with the study area is the level of concern a
participant has regarding their diet. Generally both groups had raw mean score of
3.12 out of 5 inside the study area, hovering around score of neutral, and 2.81 out of 5
outside the study area, approaching a Neutral as well. The Chi-square results
reported that the distribution of responses for disagree or agree or neutral was not
significant inside oroutside the study area (x2= 3.706, df= 2, p = .157). The results
of this test suggest that living in the study area, with lower access scores, does not
seem to impact whether a person is concerned for their diet. However, the
distribution of responses does indicate, although not significant, that people in the
study area generally agree with a higher worry associated with their diet.
69

Table 4.19: Chi-square Analysis of Worry About Diet
Worried about diet Groups: Within Study AreaTotalOut In
CountDisagree Group
%
69a
43.4%
32a
39.0%
101
41.9%
CountNeutral Group
33a
20.8%
Ha
13.4%
44
18.3%
CountAgree Group
57a
35.8%
39a
47.6%
96
39.8%
Total Count
%
159
100.0%
82
100.0%
241
100.0%
Each subscript letter denotes a subset of Within Study Area categories whose column proportions do notdiffer significantly from each other at the .05 level. x2= 3.706, df = 2, p = .157
Question: I am worried about being able to purchase fresh fruit and
vegetables
Even though living in or out of the study area does not impact a person's
concern for their diet, it does impact the relative level of worry associated with being
able to secure fresh produce. With a raw mean score of 3.19 out of 5 for residents
inside the study area, and a raw mean of 2.60 out of 5 outside the study area, the Chi-
square analysis found these differences to be statistically significant (x = 8.476, df =2,
p = .014). Living within the study area has a significant impact on the perceptions
people have about the perceived ability to secure fresh produce from their home (See
Table 4.20).
70
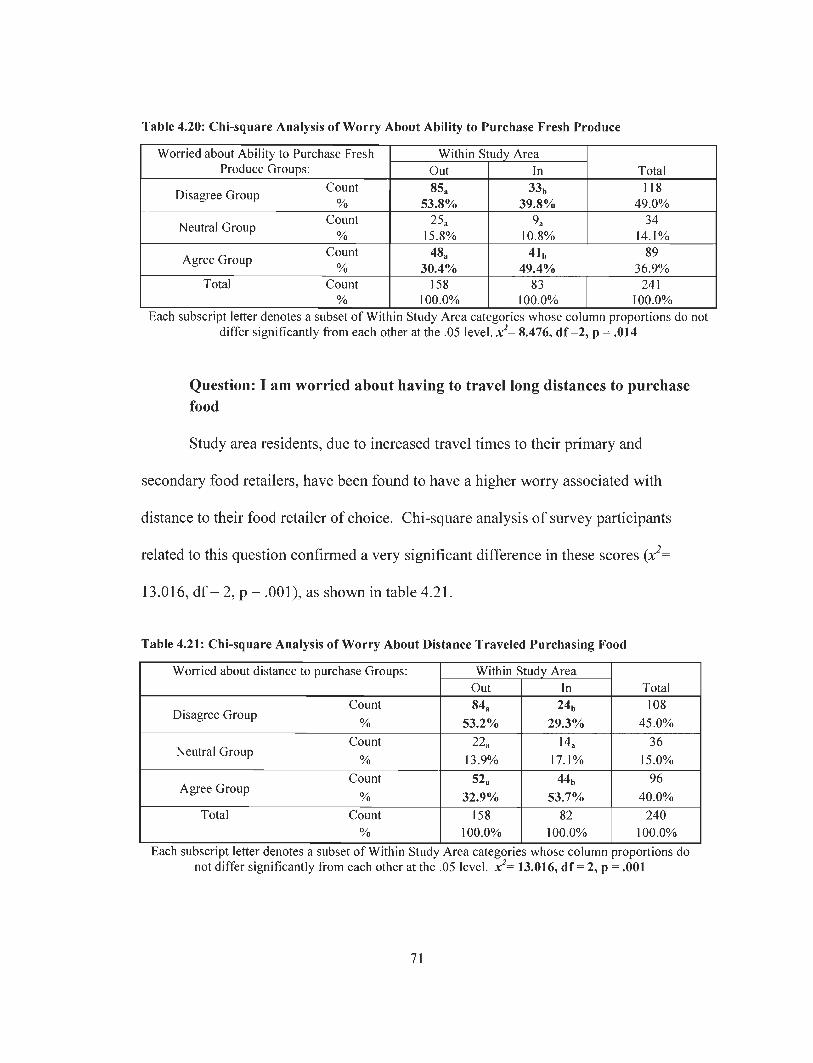
Table 4.20: Chi-square Analysis of Worry About Ability to Purchase Fresh Produce
Worried about Ability to Purchase FreshProduce Groups:
Within Study AreaTotalOut In
„. _ CountDisagree Group
85a
53.8%
33b39.8%
118
49.0%
Neutral Group25a
15.8%
9a10.8%
34
14.1%
. „ CountAgree Group
48a
30.4%
41b49.4%
89
36.9%
Total Count
%
158
100.0%
83
100.0%
241
100.0%
Each subscript letter denotes a subset of Within Study Area categories whose column proportions do notdiffer significantly from each other at the .05 level. *?= 8.476, df =2, p=.014
Question: I am worried about having to travel long distances to purchase
food
Study area residents, due to increased travel times to their primary and
secondary food retailers, have been found to have a higher worry associated with
distance to their food retailer of choice. Chi-square analysis of survey participants
related to this question confirmed a very significant difference in these scores (x2=
13.016, df = 2, p = .001), as shown in table 4.21.
Table 4.21: Chi-square Analysis of Worry About Distance Traveled Purchasing Food
Worried about distance to purchase Groups: Within Study AreaTotalOut In
CountDisagree Group
%
84a
53.2%
24b
29.3%
108
45.0%
CountNeutral Group
22a
13.9%
14.
17.1%
36
15.0%
CountAgree Group
%
52a
32.9%
44b
53.7%
96
40.0%
Total Count
%
158
100.0%
82
100.0%
240
100.0%
Each subscript letter denotes a subset of Within Study Area categories whose column proportions donotdiffer significantly from each other at the .05 level. x2= 13.016, df = 2, p = .001
71

Question: There are certain grocery stores that I would never shop at forfood
Consumer choice is a strong motivating factor when shopping for food in the
Lansing-area, and residency inside or outside the study area does not influence this.
A vast majority of residents in the Lansing-area indicate avoiding certain food
retailers. When taken into account with the primary reasons people visit stores,
Lansing-residents that cannot find the quality and variety of foods at one location will
avoid it in favor of one that offers it. With nearly identical mean scores of 3.99 out of
5 within the study area, and a mean score 4.01 out of 5 outside, a Chi-square analysis
shows that participants have strong similarities when choosing their stores (x2= 1.336,
df = 2, p = .513). This suggests that participants within the study area do not rely
primarily on the stores immediately in their neighborhood, and that shopping in the
Lansing area for food is driven primarily by consumer choice, and not consumer
desperation (Table 4.22).
Table 4.22: Chi-square Analysis of Stores Never Shopped at for Food
Stores I will never shop at for food Groups: Within Study AreaTotalOut In
Disagree Group Count
%
21a13.5%
14a17.9%
35
15.0%
Neutral Group Count
%
15a9.6%
5a6.4%
20
8.5%
Agree Group Count
%
120a76.9%
59a75.6%
179
76.5%
Total Count
%
156
100.0%
78
100.0%
234
100.0%
Each subscript letter denotes a subset of Within Study Area categories whose column proportions donotdiffer significantly from each other at the .05 level. x2= 1.336, df =2, p =.513
72

Question: I mix in my grocery shopping with other errands, and prefer to
shop at stores that offer items other than food
Participants inside and outside the study area also have similar shopping
habits as it relates to mixing errands when shopping for food. The distribution of
answers shows that plurality of residents indicate agreement on this issue, with 45.1%
agreeing inside the study area, and 46.2% outside the study area. When taken into
account with the dominance of the supermarket and grocery store in the Lansing-area,
a significant number of residents will maximize their shopping efficiency. Chi-square
analysis found no variation in this behavior between residents inside and outside of
the study area (x2= .03, df= 2,p = .878). This demonstrates that a significant
percentage of Lansing consumers view food shopping as "just another errand," and
future studies should attempt to measure what impact this has on fresh-produce
consumption.
Table 4.23: Chi-square Analysis of Mixing Shopping with Other Errands
Mixing shopping with other errands Group: Within Study AreaTotalOut In
CountDisagree Group
%
44a
27.8%
23a
28.0%
67
27.9%
CountNeutral Group
41a
25.9%
22a
26.8%
63
26.3%
CountAgree Group
73a
46.2%
37a
45.1%
110
45.8%
Total Count
%
158
100.0%
82
100.0%
240
100.0%
Each subscript letter denotes a subset of Within Study Area categories whose column proportions donotdiffer significantly from each other at the .05 level. x*= .03,df=2, p = .878.
73
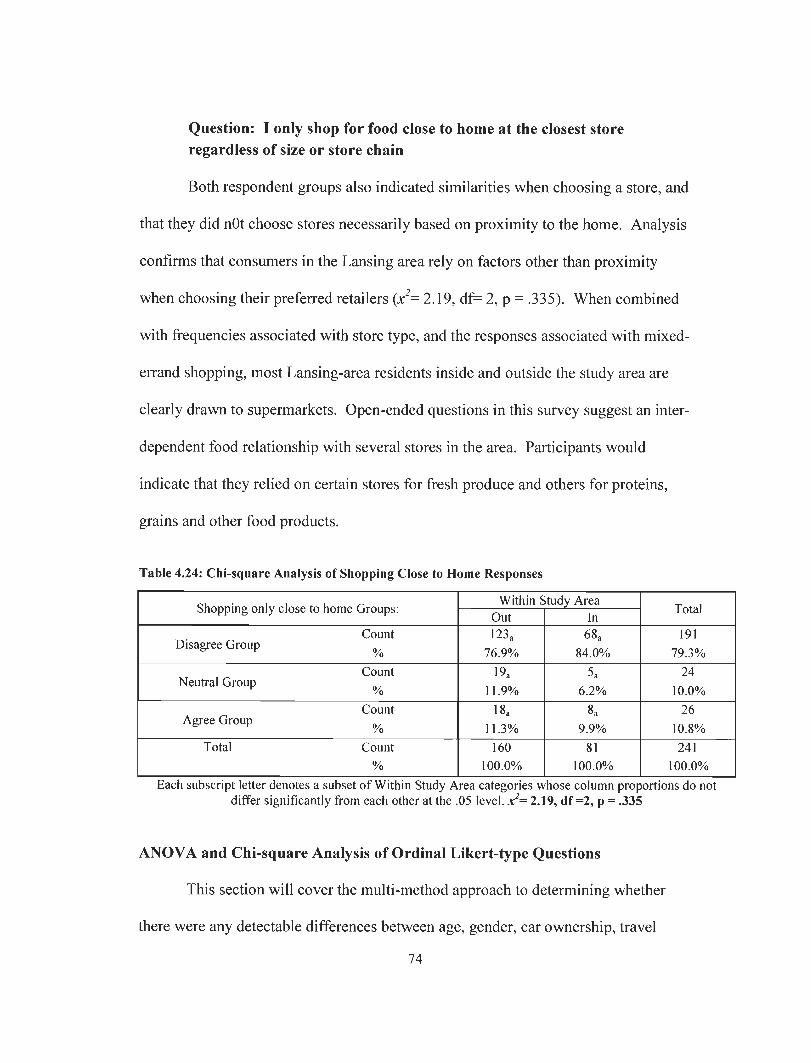
Question: I only shop for food close to home at the closest store
regardless of size or store chain
Both respondent groups also indicated similarities when choosing a store, and
that they did nOt choose stores necessarily based on proximity to the home. Analysis
confirms that consumers in the Lansing area rely on factors other than proximity
when choosing their preferred retailers (x2= 2.19, df= 2,p = .335). When combined
with frequencies associated with store type, and the responses associated with mixed-
errand shopping, most Lansing-area residents inside and outside the study area are
clearly drawn to supermarkets. Open-ended questions in this survey suggest an inter
dependent food relationship with several stores in the area. Participants would
indicate that they relied on certain stores for fresh produce and others for proteins,
grains and other food products.
Table 4.24: Chi-square Analysis of Shopping Close to Home Responses
Shopping only close to home Groups:Within Study Area
TotalOut In
CountDisagree Group
123a
76.9%
68a
84.0%
191
79.3%
CountNeutral Group
19a
11.9%
5a
6.2%
24
10.0%
CountAgree Group
%
18.
11.3%
8a
9.9%
26
10.8%
Total Count
%
160
100.0%
81
100.0%
241
100.0%
Each subscript letter denotes a subset of Within Study Area categories whose column proportions do notdiffer significantly from each other at the .05 level. x2- 2.19, df =2, p = .335
ANOVA and Chi-square Analysis of Ordinal Likert-type Questions
This section will cover the multi-method approach to determining whether
there were any detectable differences between age, gender, car ownership, travel
74

time, income, education and race on questions related to perception of access,
consumption and questions related to worry over access.
Car Ownership Chi-square Analysis
The automobile dominates the Lansing area, as is the case with most
American cities. Of those participating in this research, 21 indicated that they did not
own a car. Chi-square analysis of Likert-type questions reveals that car ownership
impacts a person's perception of access to fresh produce (x2= 10.248, df =2, p =
.006). For example, 42.9% of non-car owners indicated a positive view of access,
compared to 71.6% of car owners, whereas 33.3% of non-car owners indicated a poor
view of access. While a plurality of non-car owners indicates a positive view of
access, it is still a statistically poorer view of fresh food access in the Lansing area.
Table 4.25 Car Ownership Percept on of Fresh Produce Access
Perception of Fresh Food Access Groups: Do you own a car?
TotalYes No
Poor View of Access GroupCount
%
21a10.7%
7b
33.3%
28
12.8%
Neutral View of Access
GroupCount
%
35a
17.8%
5a23.8%
40
18.3%
Positive View of Access
GroupCount
%
141a
71.6%
9b42.9%
150
68.8%
Total Count
%
197
100.0%
21
100.0%
218
100.0%
Each subscript letter denotes a subset of Do you own a car? Categories whose column proportionsdonotdiffer significantly from each other at the .05 level. x2= 10.248, df = 2, p = .006
Similar to perceptions of fresh produce access, those who do not own a car in
the Lansing area also have a poorer view of access to frozen produce in the Lansing
area. Chi-square analysis shows differences between car ownership groups are
statistically significant (x2= 9.728, df=2, p = .008). However, non-car owners do
75

have a more positive view of access to frozen and canned produce in the Lansing area
compared to fresh produce, with 57.1% indicating a positive view of access to these
food products in the Lansing area.
Table 4.26 Car Ownership Perception of Frozen Produce Access
Perception of Frozen/Cannedproduce Access Groups:
Do you own a car?TotalYes No
Poor View of Count
Access Group %9a
4.7%
4b19.0%
13
6.1%
Neutral View of Count
Access Group %24a
12.5%
5a23.8%
29
13.6%
Positive View of Count
Access Group %159a
82.8%
12b57.1%
171
80.3%
Total Count
%
192
100.0%
21
100.0%
213
100.0%
Each subscript letter denotes a subset of Do you own a car? Categories whose column proportions donotdiffer significantly from each other at the .05 level. x2= 9.728, df = 2, p = .008
Perception of health was also affected by car ownership, as non-car owners
indicated a poorer view of their health compared to car owners in the Lansing area
(x = 6.020, df = 2, p = .049). Car ownership was one of the only variables that had
any explanatory effect on a person's view of their own health in this research besides
age which is discussed later. However, since only 21 people indicated they did not
own a car, further analysis of this variable is very limited given the sample size in this
study. It is highly recommended that car ownership be addressed in future Lansing
food environment studies as it relates to a person's health.
76

Table 4.27 Car Ownership Perception of Health
Opinion of Health GroupsDo you own a car?
TotalYes No
CountDisagree Group
%
27a
13.6%
6a
28.6%
33
15.0%
CountNeutral Group 0
%
19a
9.5%
4a
19.0%
23
10.5%
CountAgree Group ..
%
153a
76.9%
lib
52.4%
164
74.5%
Total Count
%
199
100.0%
21
100.0%
220
100.0%
Each subscript letter denotes a subset of Do you own a car? Categories whose column proportions do notdiffer significantly from each other at the .05 level. x2= 6.020, df =2, p=.049
Not surprisingly car ownership also impacts the level of worry one has about
distances to purchasing food. Since car ownership can extend the range a person can
travel in pursuit of food, the results of this variable are rather self-explanatory. Over
66.7% of non-car owners indicated a worry associated with distance, compared to
28.6% indicating no worry. The differences between the car ownership groups were
statistically significant {x2= 6.959, df = 2,p = .031) (Table 4.28).
Table 4.28 Car Ownership Worry Associated With Distance
Worried about distance to purchase Groups:Do you own a car?
TotalYes No
_. _ CountDisagree Group 0/
92a
47.2%
6a28.6%
98
45.4%
, _ CountNeutral Group 0/
/o
30a
15.4%
la4.8%
31
14.4%
a n C°UntAgree Group 0/73a
37.4%
14b66.7%
87
40.3%
Total Count
%
195
100.0%
21
100.0%
216
100.0%
Each subscript letter denotes a subset of Do you own a car? categories whose column proportions donot differ significantly from each other at the .05 level. x2= 6.959, df =2, p=.031.
Continuing with the previous section and the range limitations associated with
not owning a car, non-car owners were also more likely to limit their shopping to
77

food destinations closest to them. While a majority of respondents, 65%, indicate
they disagree with this question, s sizeable minority, 25%, agree with this question.
The differences between car owners and non-car owners were significant {x = 6.959,
df = 2, p = .048) (Table 4.29).
Table 4.29 Car Ownership Shopping Only Close to Home
Shopping only close to home Groups: Do you own a car?TotalYes No
^. _ CountDisagree Group 0/
163a
82.3%
13,65.0%
176
80.7%
, _ CountNeutral Group 0/ 19.
9.6%
2a10.0%
21
9.6%
_ CountAgree Group a.
%
16a
8.1%
5b25.0%
21
9.6%
Total Count
%
198
100.0%
20
100.0%
218
100.0%
Each subscript letter denotes a subset of Do you own a car? categories whose column proportions donot differ significantly from each other at the .05 level. X2- 6.959, df =2, p= .048
Gender Chi-square Results
Table 4.30 Gender Consumption of Fresh Produce
Consumption of Fresh Fruit/Vegetable Groups: GenderTotal
Female Male
rv n CountDisagree Group 0/ 30a
19.7%
28b
32.6%
58
24.4%
Neutral Group 0/22a
14.5%
20a23.3%
42
17.6%
_ CountAgree Group 0/ 100a
65.8%
38b
44.2%
138
58.0%
Total Count
%
152
100.0%
86
100.0%
238
100.0%
Each subscript letter denotes a subset of Gender categories whose column proportions do not differsignificantly from each other at the .05 level. jc*« 10.526, df =2, p=.005.
Chi-square analysis on gender shows 65.8% of women agreeing that that a
major portion of their diet comes from fresh produce, compared with men where
44.2% were in the agree category. In the neutral group, 23.3% of men indicated a
78

neutral response to this question, compared with 14.5% of women. In the
disagreement group, 32.6% of men indicated that they disagree with the statement
that a major portion of their diet comes from fresh produce, compared to 19.7% of
women. This was found to be statistically significant (x = 10.526, df = 2, p = .005)
and consistent with Dehghan (2011) showing women were more likely to consume
increased amounts of fresh produce compared with men.
Table 4.31 Gender Consumption of Fast-Food Groups
Consumption of Fast-Food Groups: GenderTotal
Female Male
Disagree Group Count%
96a
63.6%
37b43.5%
133
56.4%
Neutral Group Count%
21a13.9%
12.14.1%
33
14.0%
Agree Group Count%
34a
22.5%
36b42.4%
70
29.7%
Total Count
%
151
100.0%
85
100.0%
236
100.0%
Each subscript letter denotes a subset of Gender categories whose column proportions do not differsignificantly from each other at the .05 level. jc2= 10.526, df =2, p=.005
Also statistically significant was the consumption of fast-food and other
restaurant foods, with women reporting a raw mean score of 2.26 out of 5 and men
reporting a raw mean of 2.78 out of 5. Chi-square analysis of the distribution of
answers found 42.4% of men agree with this statement, 14.1% indicating neutral, and
43.5% disagreeing with this statement. While a slight plurality exists with more men
indicating that they disagree with this statement, this was found to be statistically
significant distribution (x2= 11.095, df= 2,p =.004). With women, 63.6% disagreed
with this statement, compared to 13.9% neutral, and 22.5% agreeing.
79

Table 4.32 Gender Worry About Diet
Worried about diet Groups: Gender
TotalFemale Male
Disagree Group Count%
71.47.0%
26b
31.3%
97
41.5%
Neutral Group Count%
24a
15.9%
20a
24.1%
44
18.8%
Agree Group Count
%
56a
37.1%
37a
44.6%
93
39.7%
Total Count
%
151
100.0%
83
100.0%
234
100.0%
Each subscript letter denotes a subset of Gender categories whose column proportions do not differsignificantly from each other at the .05 level. x2= 11.095, df =2, p =.004.
Interestingly, and contrary to the suggestions of Dolby (1996) and Nayga
(1997), men do demonstrate a slightly higher worry associated with their diet. The
analysis showed that men had a raw mean of 3.18 out of 5, compared to a raw mean
for women at 2.77 out of 5. Chi-square analysis concerning the level of worry
associated with their diet showed that this was close to significant (x2= 5.588, df= 2,
p =.054). With women, 47% indicated they disagreed, 15.9% indicated a neutral
response, and 37.1% indicated agreement. Compared with men, 31.3% indicated
disagreement, 24.1% indicated a neutral response, and 44.6% indicated agreement.
Since gender was the only variable that proved different with respect to the
consumption of fresh produce, further analyses of the effects of living inside the study
area were conducted. Women living within the study are were compared with women
outside the study area, as were men living inside compared with men outside the
study area. Conducting a Chi-square analysis found that the gender of respondents
inside the study area did not identify any variations compared to men and women
outside the study area as it related to changes on consumption patterns. As such,
80

living within the USDA-designated food desert in downtown Lansing was not found
to influence self-reported consumption of fresh produce.
A Comparison of Income and Food Related Perceptions
To conduct a one-way ANOVA between income groups and the Likert-type
questions concerning access, consumption and level of concern, income levels were
grouped into the following categories: 0-25K a year, 25-50k, 50k-100k, and 100k+.
Fisher's LSD Post-hoc analysis found various statistically intra-significant variations
between income groups.
A comparison of perceptions of fresh food access and income identified
statistically significant variations at the .05 level between 0-25K and 100k+, with a
mean difference of .429 (F (2, 211) = 1.411, p = 1.4 x .0001). Differences among all
other income groups were found to be statistically different from the other.
Perception of frozen/canned access also had proved different across income groups
significance at the .05 level, using LSD Post-hoc analysis, with differences between
0-25k and 50k-100k, and 100k+, with .236 and .387 mean differences, respectively (F
(2, 207)= 10.103, p= .0001).
The level of worry associated with being able to purchase fresh fruit and
vegetables also had significance at the .05 level using LSD Post-Hoc analyses
between the various income groups (F (2, 211) = 14.848, p = .0001). The lowest
income group, 0-25K, was significantly different from the 50-100k, and 100K+
groups, with mean differences of .483 and .955, respectively. The next income
81

group, 25-5Ok, had a statistical significant difference between the 100k+ group, with
a mean difference of .607.
Also significant at the .05 level was the worry associated with distances to
purchase food, between the 0-25K groups and all other groups (F (2,209) = 23.135, p
= .0001). LSD Post-Hoc analysis showed a mean difference between 0-25K of .557;
50-100K, .618; and 100K+ of 1.037. LSD Post-Hoc analysis did not reveal any other
statistical variations between consumption, views of health, or other Likert-type
questions.
Overall, however, income level had very little explanatory effect for the
majority of variables acquired through the questionnaire. Given the concentration of
lower income groups inside the study area, and the inverse concentration of higher
income groups outside the study area, analyzing results based on income cannot
discount the geography of the distribution of incomes.
Level of Education Chi-square Analysis
Participants were grouped into two categories, those with a 4-year college
degree and those without a 4-year college degree. Chi-square analysis did not reveal
any statistical variations between those with a 4 year degree that would provide any
explanatory power on the Likert-type questions.
Age Bracket Groups Chi-square Analysis and ANOVA
Age groups had some variation between groups when tested using a one way
ANOVA as it related to views of health, and fresh produce consumption. LSD Post-
82
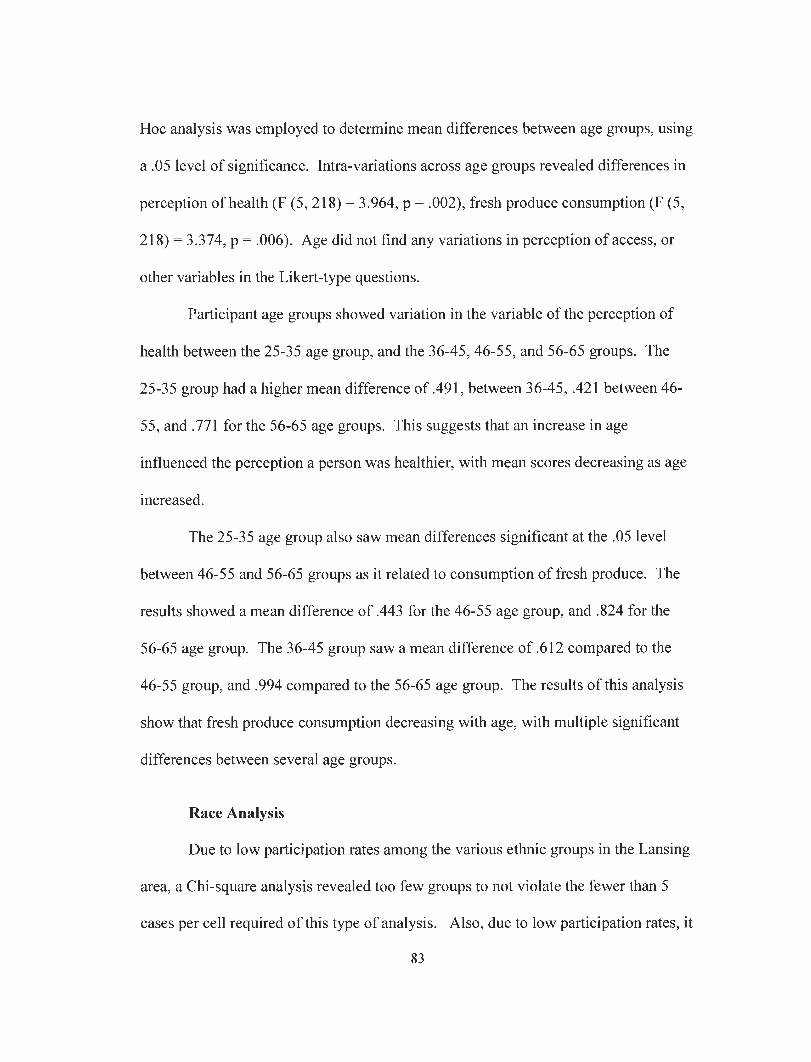
Hoc analysis was employed to determine mean differences between age groups, using
a .05 level of significance. Intra-variations across age groups revealed differences in
perception of health (F (5, 218) = 3.964, p = .002), fresh produce consumption (F (5,
218) = 3.374, p = .006). Age did not find any variations in perception of access, or
other variables in the Likert-type questions.
Participant age groups showed variation in the variable of the perception of
health between the 25-35 age group, and the 36-45, 46-55, and 56-65 groups. The
25-35 group had a higher mean difference of .491, between 36-45, .421 between 46-
55, and .771 for the 56-65 age groups. This suggests that an increase in age
influenced the perception a person was healthier, with mean scores decreasing as age
increased.
The 25-35 age group also saw mean differences significant at the .05 level
between 46-55 and 56-65 groups as it related to consumption of fresh produce. The
results showed a mean difference of .443 for the 46-55 age group, and .824 for the
56-65 age group. The 36-45 group saw a mean difference of .612 compared to the
46-55 group, and .994 compared to the 56-65 age group. The results of this analysis
show that fresh produce consumption decreasing with age, with multiple significant
differences between several age groups.
Race Analysis
Due to low participation rates among the various ethnic groups in the Lansing
area, a Chi-square analysis revealed too few groups to not violate the fewer than 5
cases per cell required of this type of analysis. Also, due to low participation rates, it
83
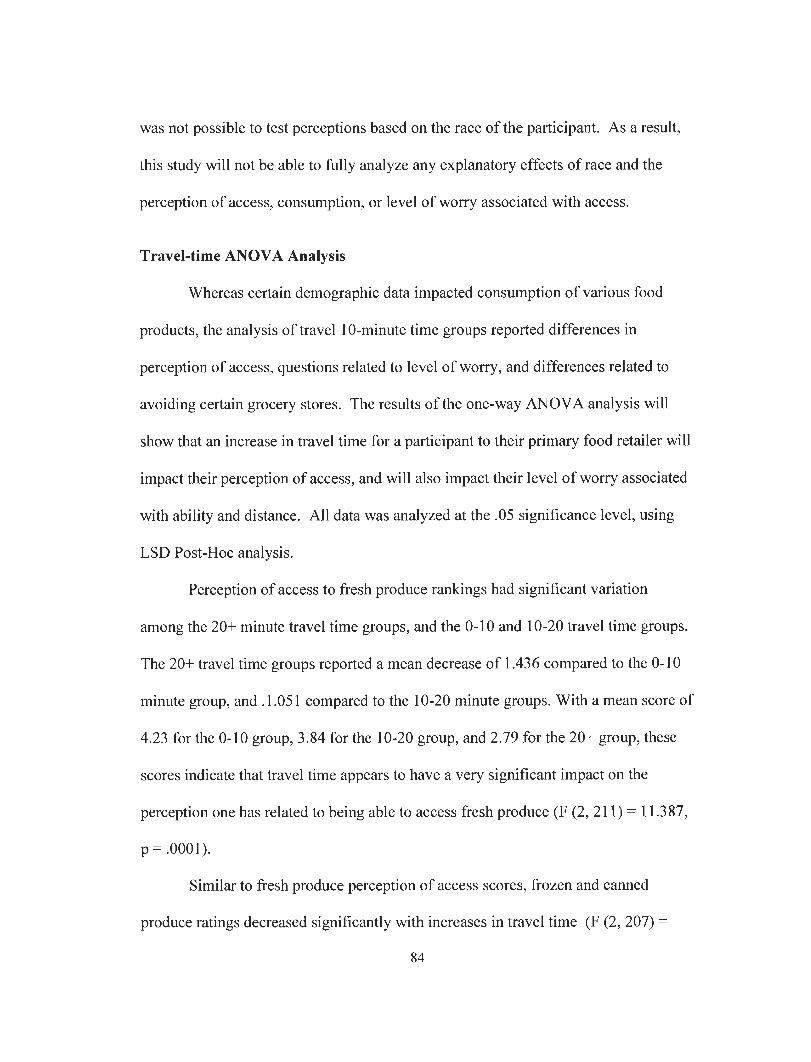
was not possible to test perceptions based on the race of the participant. As a result,
this study will not be able to fully analyze any explanatory effects of race and the
perception of access, consumption, or level of worry associated with access.
Travel-time ANOVA Analysis
Whereas certain demographic data impacted consumption of various food
products, the analysis of travel 10-minute time groups reported differences in
perception of access, questions related to level of worry, and differences related to
avoiding certain grocery stores. The results of the one-way ANOVA analysis will
show that an increase in travel time for a participant to their primary food retailer will
impact their perception of access, and will also impact their level of worry associated
with ability and distance. All data was analyzed at the .05 significance level, using
LSD Post-Hoc analysis.
Perception of access to fresh produce rankings had significant variation
among the 20+ minute travel time groups, and the 0-10 and 10-20 travel time groups.
The 20+ travel time groups reported a mean decrease of 1.436 compared to the 0-10
minute group, and .1.051 compared to the 10-20 minute groups. With a mean score of
4.23 for the 0-10 group, 3.84 for the 10-20 group, and 2.79 for the 20+ group, these
scores indicate that travel time appears to have a very significant impact on the
perception one has related to being able to access fresh produce (F (2, 211) = 11.387,
p = .0001).
Similar to fresh produce perception of access scores, frozen and canned
produce ratings decreased significantly with increases in travel time (F (2, 207) =
84

7.049, p = .001). Whereas the mean score for frozen/canned produce was higher
(4.57 0-10 Minutes; 4.12 10-20 Minutes; 3.68 20+ Minutes) when compared to fresh
produce, these decreases were still highly significant at the .05 significance level.
Post-Hoc analysis showed the 20+ minute travel group had a lower mean difference
of .888 compared with the 0-10 minute group, and .437 compared to the 10-20
minute. This view between the 10-20 and 20+ minute groups was not found to be
significantly different. However, the mean difference of .451 between the 0-10
minute and 10-20 minute group was statistically different, so the .437 difference was
borderline significant at the .05 level.
Worry associated with diet was also significantly different between the 20+
minute group and the 0-10 and 10-20 minute groups (F (2, 211) = 3.784, p = .024).
With an increased mean, thus increased level of worry, of .861 compared between the
20+ minute group to the 0-10 minute group, and .673 compared to the 10-20 minute
group, the post-hoc analysis show that increased travel time increases the level of the
worry associated with their diet. The analysis of worry about ability to purchase fresh
fruit and vegetables also shows significant differences between several groups at the
.05 level (F (2, 211) = 14.848, p = .0001), which increased between the 20+ minute
and the 0-10 and 10-20 minute groups, and between the 10-20 and 0-10 minute group.
This resulted in an increased mean difference of 1.609 between the 0-10 and 20+
group, and an increase of 1.016 between the 10-20 and 20+ group. Between the 10-
20 and 0-10 group, the mean increased by a statistically significant .594, showing that
85
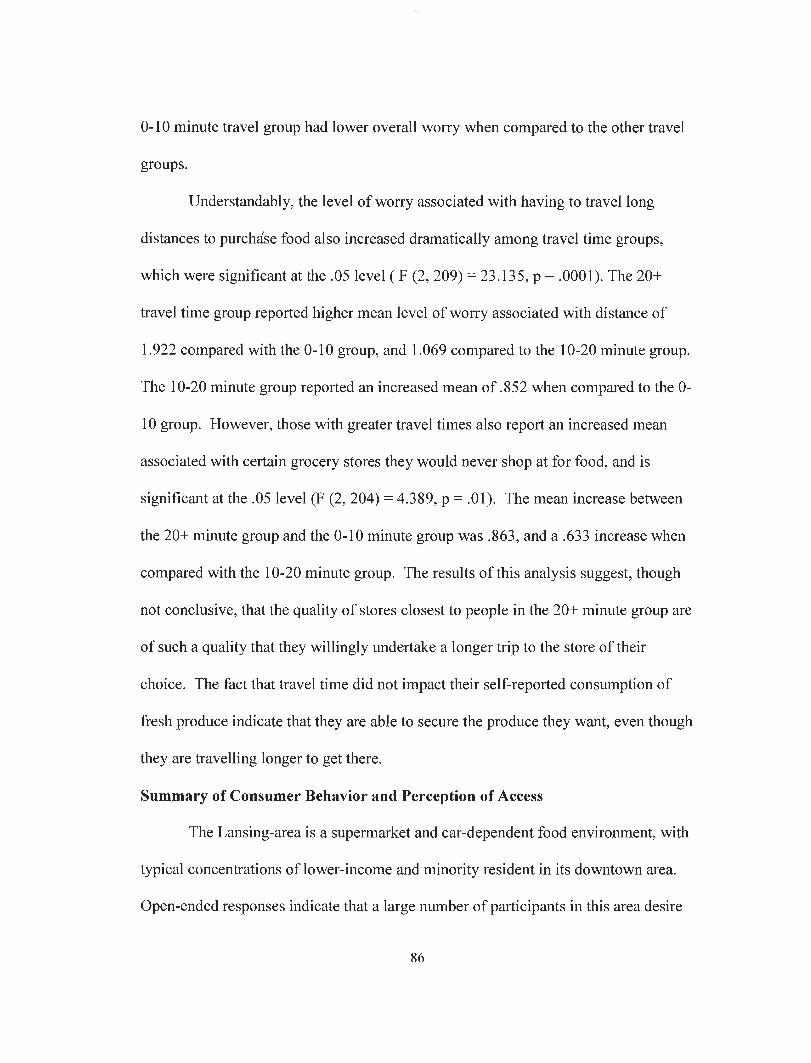
0-10 minute travel group had lower overall worry when compared to the other travel
groups.
Understandably, the level of worry associated with having to travel long
distances to purchase food also increased dramatically among travel time groups,
which were significant at the .05 level ( F (2, 209) = 23.135, p = .0001). The 20+
travel time group reported higher mean level of worry associated with distance of
1.922 compared with the 0-10 group, and 1.069 compared to the 10-20 minute group.
The 10-20 minute group reported an increased mean of .852 when compared to the 0-
10 group. However, those with greater travel times also report an increased mean
associated with certain grocery stores they would never shop at for food, and is
significant at the .05 level (F (2, 204) = 4.389, p = .01). The mean increase between
the 20+ minute group and the 0-10 minute group was .863, and a .633 increase when
compared with the 10-20 minute group. The results of this analysis suggest, though
not conclusive, that the quality of stores closest to people in the 20+ minute group are
of such a quality that they willingly undertake a longer trip to the store of their
choice. The fact that travel time did not impact their self-reported consumption of
fresh produce indicate that they are able to secure the produce they want, even though
they are travelling longer to get there.
Summary of Consumer Behavior and Perception of Access
The Lansing-area is a supermarket and car-dependent food environment, with
typical concentrations of lower-income and minority resident in its downtown area.
Open-ended responses indicate that a large number of participants in this area desire
86

affordable, quality produce, and will shop more often at those stores that offer
products that meet these criteria. However, price alone was not the primary
motivating factor for Lansing residents, as the quality and variety of produce, and the
proximity of a store, were the major reasons for selecting specific stores in the
Lansing area. Even those with limited means, and limited transportation options,
report choosing those stores based on that criteria, indicating price was not the most
important factor when choosing a store.
Lansing-area consumers, inside and outside the study area, indicate a complex
relationship with the food environment as a result of this analysis. No single variable
accounted for the majority of responses. Generally access to an automobile and the
resulting increased travel times as a result of not owning one, and residency inside
and outside the study area, primarily dictates the perceived level of access to fresh
and frozen produce items in the Lansing area. However, these variables did not
appear impact the consumption of fresh produce based on the answers derived from
the questions in the survey. Car ownership did impact a person's perception of
health, and this should be examined further in studies of the Lansing food
environment. Whether this affect is due to car ownership, or whether car ownership
is ancillary to the participants current financial situation remains to be seen, and
cannot be answered concretely in this research.
The level of concern associated with lower perceived access was clearly
apparent, but the level of concern also varied due to factors such as residency, travel
time, and car ownership. As a result, these worries appear to increase the stress
87

associated with securing fresh produce in the Lansing area. Due to such limiting
factors of both quality and affordability associated with fresh produce in Downtown
Lansing, residents in these areas are required to travel longer to secure the fresh
produce they want to have in their daily diets. These increased travel times
sometimes result in greater distances compared to other Lansing-area residents, and
this research has been able to detect this trend.
Discussion
This section will answer the four primary research questions posed by this
study, and identify what factors, if any, are influenced based on residency in the study
area, or other factors related to age, gender, income, level of education or race.
Research Question 1: Do study-area residents travel longer to purchase
fresh produce at their preferred stores when compared to other Lansing-
area residents?
Consistent with food desert research including Larsen and Gilliand (2008),
this research clearly demonstrates that downtown residents inside the USDA defined
food desert do indeed travel longer to purchase fresh produce at their preferred stores.
As a result of these increased travel times, perception of access to fresh and frozen
produce items in the Lansing area worsens as travel time increases. Increased travel
time also impacts the level of worry people report in being able to secure fresh
produce, and the distances they are required to travel to purchase these items. For all
intents and purposes, residence in the downtown study area appears to result in
increased travel times, but it is not an area that impacts a person's ability to secure or
88
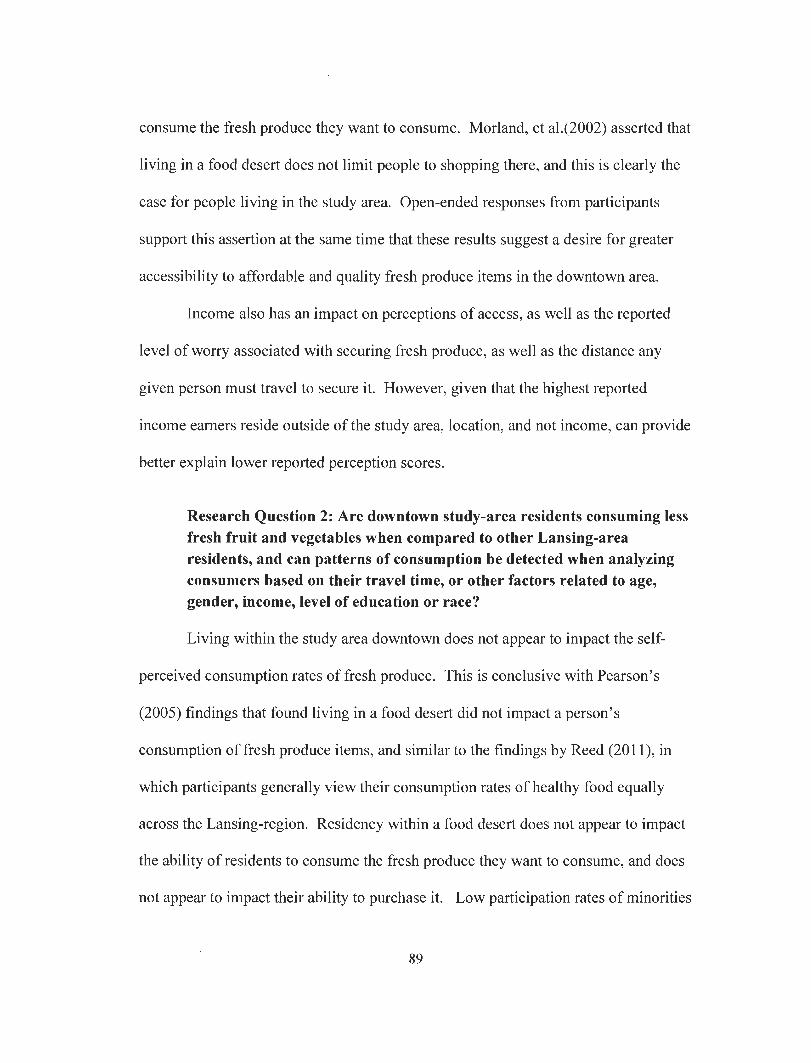
consume the fresh produce they want to consume. Morland, et al.(2002) asserted that
living in a food desert does not limit people to shopping there, and this is clearly the
case for people living in the study area. Open-ended responses from participants
support this assertion at the same time that these results suggest a desire for greater
accessibility to affordable and quality fresh produce items in the downtown area.
Income also has an impact on perceptions of access, as well as the reported
level of worry associated with securing fresh produce, as well as the distance any
given person must travel to secure it. However, given that the highest reported
income earners reside outside of the study area, location, and not income, can provide
better explain lower reported perception scores.
Research Question 2: Are downtown study-area residents consuming less
fresh fruit and vegetables when compared to other Lansing-area
residents, and can patterns of consumption be detected when analyzing
consumers based on their travel time, or other factors related to age,
gender, income, level of education or race?
Living within the study area downtown does not appear to impact the self-
perceived consumption rates of fresh produce. This is conclusive with Pearson's
(2005) findings that found living in a food desert did not impact a person's
consumption of fresh produce items, and similar to the findings by Reed (2011), in
which participants generally view their consumption rates of healthy food equally
across the Lansing-region. Residency within a food desert does not appear to impact
the ability of residents to consume the fresh produce they want to consume, and does
not appear to impact their ability to purchase it. Low participation rates of minorities
89

in the survey excluded race from being analyzed in this study, and certainly needs to
be addressed in future studies of the Lansing food environment. Moreover,
education, income and travel time did not impact a person's consumption of fresh
produce in the Lansing, which is partially contrary to Dubowitz's, et al.(2008)
assertion that consumption of fresh produce is primary influenced based on these
variables. The mechanism used to measure consumption may be an exogenous factor
as to why these variables were not impacted by a participants socio-economic status.
While some of the data did provide low-level explanatory power through
analysis in SPSS, it did not provide the needed "knock-out punch" to fully explain
issues related to perception of access. However, results partially confirmed
Dubowitz's, et al.(2008) and Dehghan's (2011) findings, gender and age impacts
consumption of fresh produce, with women consuming more produce then men.
Results from ANOVA testing of age shows consumption of fresh produce to be
highest in the 36-45 age group, with a mean score of 3.89 out of 5, followed by a
mean score of 3.72 out of 5, in the 25-35 group. However, fresh produce
consumption did not decrease uniformly as one increases in age. Instead it rises and
peaks at the 36-45 age group, and then decrease as age increases, with the exception
of the 66+ group, which had a mean score of 4 out of 5. Post-hoc analysis of these
questions does show some significant differences between age groups, and this should
be explored in more detail in future Lansing food environment studies.
90

Research Question 3: Does perception of access to fresh produce differ
for people living in the study-area versus other area residents due to
travel time, or are these perceptions shaped by a person's other factors
related to age, gender, income, level of education or race?
Perception of access to fresh produce and even frozen/canned vegetables
differ between residents inside and outside the study area, and travel time and car
ownership both appear to influence these perceptions. Frozen and canned produce is
uniformly rated higher than fresh produce access, and while the raw mean scores of
individuals living inside and outside the food desert do not suggest an overall
negative view, they clearly show a lowered perceived access when compared to
residents outside of the food desert. Perception of fresh and frozen food access
decreased, as well, as travel time increased, and also decreased between those that
owned cars, and those that did not. No other variables recorded a statistically
significant difference in perception scores related to access to fresh and frozen
produce.
Research Question 4: Due to issues related to access to fresh produce,
does the perception of a person's health differ significantly inside and
outside the study area?
This study has shown that living within the study area in downtown Lansing
does not appear to impact the perception of a person's health, as the average score of
residents derived from this analysis are statistically insignificant from one another.
This suggests that living in the food desert in downtown Lansing does not appear to
be a significant factor influencing perception of a person's health. The primary
91
factors influencing a person's perception of health included age and car ownership.
While men report greater concern associated with their health, this did not impact
their views that they were themselves healthier. However, when all of these factors
influencing perception of health are taken into account with the 66% obesity and
overweight rates provided by the Michigan Department of Community Health, it
appears that residents participating in this study did not answer honestly, or at least
had a generally biased view of their own health that tended to show that they were
healthy, irrespective of whether they consumed vegetables or not. This is in
accordance with results of Dehghan (2011) in which very few participants indicated
poor health, even though they were found to be overweight/obese. Relying on
surveys to assess the health of respondents in food desert studies should be adjusted
to actually incorporate measures to account for the actual health. Asking participants
directly about their health relating to heart-disease, diabetes, and other food-related
health issues might mitigate the sometimes uninformed assertions that they are
"healthy."
92

CHAPTER V
THE DOWNTOWN LANSING FOOD DESERT: CONCLUSION OF FINDINGS
The results of this research have upheld several findings of the Lansing food
environment reported by Reed (2011), and suggest that the actual impacts and effects
of the downtown Lansing food desert may not be as extensive as they reportedly
found in other food deserts nationwide. Given the USDA designation, the existence
of two fresh produce food retailers in the study area suggests that this area should not
be classified as an actual food desert. Results do generally demonstrate that
participants have a very complex and evolving relationship with the Lansing-food
environment, and yet are quite adept at navigating this area to access those items they
wish to consume. Further, the study shows that participants alternate food-shopping
behavior based on weather, price, local-food, organic, and quality of produce when
choosing which store to purchase specific food items. Given that Wrigley's (2002)
initial definition of a food desert focused included the metric of "culturally acceptable
foods", it appears Lansing-area residents purchase those food types that are culturally
acceptable to them. However, given that study area participants report the price of
fresh produce at the Lansing City Market and the low-quality of produce at the
Vallarta Market as limiting factors, this area appears to be a food desert in that it
forces residents to shop elsewhere in order to acquire the affordable and quality
produce they desire.
Given responses related to "stress" associated with purchasing food, study
area residents have suggested, due to increased travel time to their preferred stores
that living in a food desert can create problems for purchasing fresh produce, and in
93

reaching these stores. Future research should address and quantify this stress
associated with food, and determine if stress associated with securing fresh produce
has any detrimental effects on a person's health. However, it is reasonable to assume
that a person travelling longer to their preferred food-retailer will not always be so
inclined to make this trip. As people age, and physically mobility decreases, the idea
of walking to that bus stop in the middle of February in Michigan becomes even less
desirable than between May and September. While this study capture perceptions
and consumption rates during the late spring and summer months, the seasonal effects
previously described as a barrier to pedestrians also represents barriers to research.
More attention should be placed on what happens in food deserts during winter
months, when those seasonal fresh-produce providers abandon these areas until the
following year.
Increasing travel times for study area participants did not reportedly impact
their ability to purchase fresh produce they wanted to consume. This appears to
confirm the findings of Pearson's (2005) study that a food desert designation does not
impact a person's consumption of fresh produce. However, contrary to Pearson, this
study shows that a person's socio-economic characteristics, mainly income and level
of education, did not result in statistically viable variations in the consumption of
fresh produce. This finding upholds the findings of Reed (2011) that residents in the
Lansing-area generally view their food purchases as "healthy." However, if as the
evidence suggests, that people in this area have a potentially misguided view of their
own health, does it not also suggest that they may have a misguided view as to what
94

they are actually eating? These questions, unfortunately, are beyond the scope of this
research, and should be addressed in future Lansing food-environment studies.
Limitations of Research
This study has been successful at analyzing differences in the perceptions of
Lansing area residents in the context of the downtown Lansing food desert. While
this research did not quantify daily consumption of fresh produce, it was able to
provide a general narrative of study area residents view of their daily consumption of
fresh produce, frozen/canned produce, fast-food, and pre-prepared meals. This
information notwithstanding, future Lansing food environment studies should provide
more specific information concerning the daily intake of specific food items.
Interest, it seems, dictates participation, and even non-answers may indicate a
lack of interest from low-income and other at-risk populations in urban areas. This
research failed, in certain respects, in securing greater participation of low-income
and minority residents whose views of food access could provide a more thorough
understanding of the nature of consumption of fresh produce and the perceptions
access grants to health. A further limitation of this study was the high participation
rates of residents with a college degree, which was consistent with Reed (2011) and
Simms (2011) studies that also had higher proportions of college-degree holders
participating in food studies. The study failed to capture these critical perceptions,
due in part to the use of an online survey and/or a lack of interest in social science
research among these participants. A non-answer on the part of these groups may
signal a lack of awareness or alternatively a view that everything is "A-Okay" with
95

what they consider to be adequate food accessibility. If this is the case, then this is
quite telling, and the problems facing improving the diet of the American consumer is
truly daunting if those that are at-risk do not view this as a problem. Given the
tendency of participants to view themselves as healthy irrespective of their
consumption of fresh produce, and perhaps, irrespective of their actual health, people
may not be aware of what it means to be healthy, or they are unwilling to address it.
Whatever the reason, this study fully acknowledges that an incomplete picture of the
Lansing area remains, and input from these potentially at-risk individuals is still
critical to fully understanding the nature of the Lansing food environment.
As was previously discussed, this research was also limited to operating
during late spring and the summer months in Michigan. It captured perceptions of
access in the context of farmer's markets, and relatively pleasant weather for area
residents. Addressing what happens in winter months in food desert cities can help
paint a more complete picture, and limiting research to months convenient to graduate
studies is a boon to graduate students, but a bust for accounting for those still living
there after the grant money has been spent.
Implications for Future Food Desert Studies
While it appears that the USDA defined downtown Lansing, MI food desert is
not directly involved in the consumption, or lack thereof, of fresh produce, and the
perception of health for residents inside it, it does not negate the existence of other
food deserts, nor does it negate the effects it has on residents who find themselves
living in one. Given the 'broad stroke' by the USDA to identify food deserts, and
96

their exclusion of local food retailers with annual sales under $2 million, local studies
will continue to be critical at refuting or confirming these classifications across the
United States. However, based on this research, the food desert in downtown Lansing
does not seem comparable to other food deserts frequently cited in the Literature, and
this analysis demonstrates the need for taxonomy of the different types of food
deserts. While this analysis shows that the Lansing-area food desert has little to no
effect on the consumption of produce and the health of the residents living inside it,
does not mean that the presence of other food deserts do not. It does suggest that the
downtown Lansing area may not be a food desert in the classical definition, as fresh
produce is available nearby, however, it does suggest that is a food desert based on
the limitations to secure affordable and quality produce in this area. The two primary
fresh produce food retailers in downtown Lansing represent distinct problems for
local policy makers to address. Specifically increasing access to quality and
affordable fresh produce, thus reducing travel times, and the worry associated with
travel times, to supermarkets in the suburban fringe parts of Lansing. However, the
analysis of travel time in this area indicates that this did not impact the ability for
Lansing consumers to secure fresh produce.
Future geographic research into food deserts should emphasize establishing a
classification or rating scheme that can be used to assess and compare food deserts
across the developed world. This classification can provide policy makers in these
areas a better understanding of the problems they face in their particular communities,
and develop mitigation strategies based on the severity of the effects living in local
97

food deserts. Even though local food retailers may exist in some of the food deserts
identified by the USDA, the assessments of quality and affordability of the produce in
these areas will need to be developed in these locations on a case-by-case basis. Not
all residents in these areas will be inclined to devote time to community gardens, nor
will they find farmer's markets to be culturally appropriate locations for a multitude
of reasons. This will result in the continued dominance of the supermarket as the
provider of choice for fresh produce.
98

Appendix A
Survey
Upgrade io Add More Questions
Edit Question • Move Delete
* 1. Wh.it is the block, stieet and zip address of wheie you LIVE: EXAMPLE 400 blockN Walnut St, 48933
Upgrade to Add More Questions Split Page Here
02 Edit Question • Add Question Logic Move Delete
*2. What is youi estimated monthly gioceiy food bill?
Upgrade to Add More Questions Split Page Here
03 jEdit Question j W|j Add Question Logic Move Delete
3. What best desciibestbe income level of youi home?
V
Upgrade to Add More Questions Split Page Here
04 !Edit Question j • jl Move |J Delete
*4. How many people do you typically feed on youi food budget?
99

05 jEdit Question • Add Question Logic Move Delete
*5. What is the typical payment method you use when puichasing food at a <jioceiystoie 01 supeimaiket?
} Cash
) Credit Card
; Debit Card/ Personal Check
| Michigan Bridge Card
.; W.C
| Oth e r (p Ie ase sp e cify)
Upgrade to Add More Questions Split Page Here
OO I EditQuestion • Add Question Logic Move Delete
G. What is youi (jendei?
. Female
;. Male
HereUpgrade to Add More Questions Split Page
07 Edit Question • Add Question Logic Move Delete
7. What is youi iace ethnicity?
; Black/African American
; White Non-Hispanic
; Hispanic Origin - Black or White
; Native American
| Asian
; Asian - Indian
5 Arabic/Middle Eastern
; Oth e r (p Ie ase sp e cify)
100

g questions concei ning access to food in the
OO | Bd«to«**ltoiTV] How De**
9. Please answei the folio * in
Lansing ai ea:
\*ry Poorly Poorly Average Good Vfery Good Not Applicable
How would you rate
your ability to
purchase freshproduce in the
Lansing area given0 J J 3) J J
your current mode
of transportation?
How would you rate
your ability to
purchase
canned/frozen fruits
and vegetables inthe Lansing area
J V,-' 2) .,':• 0 J
given your current
mode of
transportation?
Upgrad« to Add More Qutitoni Spilt Pag* Here
010 EdltOietttoiN | Hone jJDt let
>n foi the following j questions:10. Please |>iovkl<? youi opini<
VferyNegative
Opinion
NegativeOpinion
NeutralPositive
Opinion
Very Positive
Opinion
1
' Not Applicable
What is your overall
general opinion about
where you currently 0 ..> $ ..) -3 ..:>live:
If you have lived inthe Lansing area
FOR ONE YEAR
OR LESS, what is
your OVERALL2> 2> ...•' 2> ..)
general opinion about
where you USED to
live:
What is your overallopinion of food
access in Lansing:2) J J> .) J ..;•
If in the Lansingarea for LESS THAN
ONE YEAR, what is
your overall opinion
of food access ofj J 0 J J ..)
where you livedPRIOR to living in
the Lansing area:
01

Oil [Edit Question 1?|| Move II Delete j* II. Please indicate whethei you acjiee 01 disagiee with the following questions:
StronglyDisagree
Disagree
Strongly NotNeutralAgree
Agree Applicable
1consider myself a healthy person (inshape, free of food-related
diseases- heartdisease, diabetes) ) ) ) ..• )
A majorportion of my diet comes from fresh fruit and vegetables
(more than 3-5 servings a day) ) ) ..: ) j J
A major portion of my diet comes from canned/frozen fruits and
vegetables(more than 3-5servings a day) 0 ..: ) ) o ..:•
A major portion of my diet comes from pre-prepared meals
(microwave dinners, etc.)(1-2 meals a day ormore) _*' ) ..•' ..• .-•
I0
I eat several meals a week from fast-food and other restaurants
(3-7 meals a week ormore) ) ) ) ) ) .;•
I am worried about my diet ;• ; ;• ••' ;• .:•
I am worried about being able to purchase fresh fruit and
vegetables •• > •* : J
I am worried about havingto travel long distances to purchase
food; ) ) ; .: 0
There are certain grocery stores that Iwould nevershop at for
food;• ) ) .) ) )
I mix in my grocery shopping with other errands, and prefer to.) i ) ••' )shop at storesthat offeritems otherthan food .•
I onlyshop for food close to home atthe closest store regardless
of size or store chain) :• ) ) ) )
I onlyshop for food based on weeklysales, deals orcoupons J ) .•* ^J J .)
I frequently purchase food items from markets and storesthat
cater to specificethnic groups ) ) ) ) .:•
I purchase mostlyorganic fruits/Vegetables when Ishop ..:•
'
)'
.,•' )
102
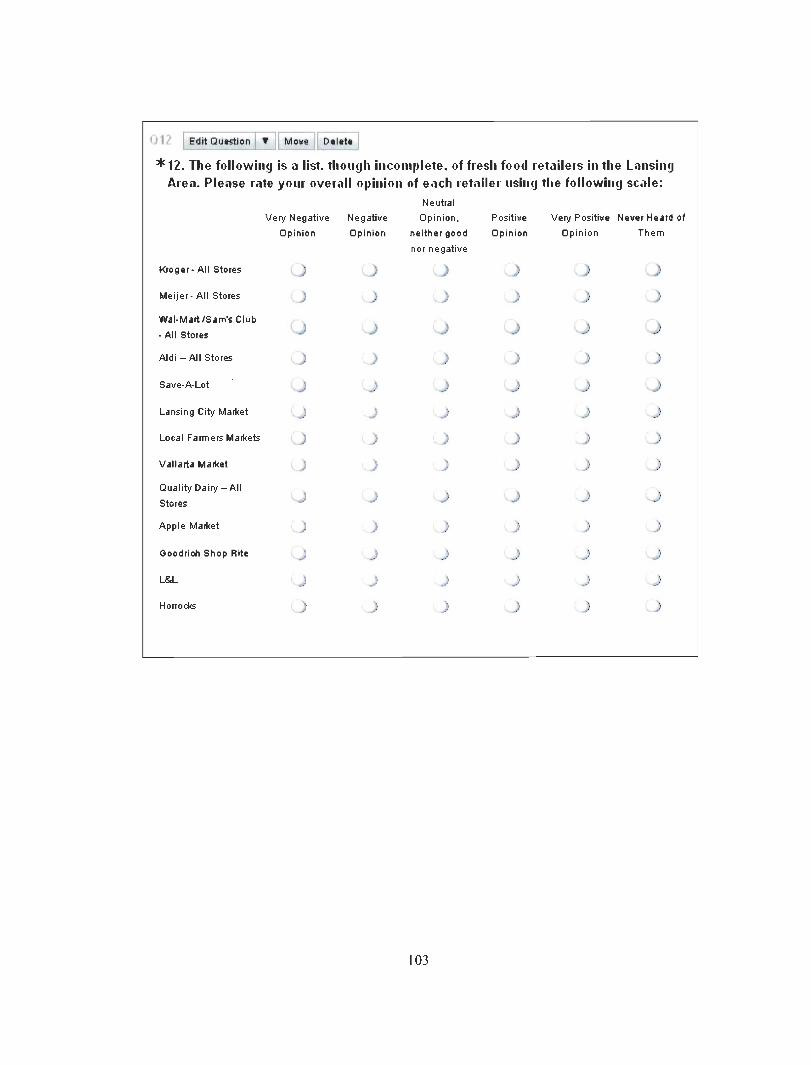
nplete, of fiesh food iof each letailei usim
etaileis in the
1the followingLansingscale:
012 [Edit Question[ T Move Delete
*12. The followingAiea. Please late
is a list, though incoiyoui oveiall opinion
Very Negative Negative
Opinion Opinion
Neutral
Opinion.
neither good
nor negative
Positive
Opinion
Very Positive N
Opinion
ever Heard of
Them
Kroger- All Stores .: •• •' ) .:• )
Meijer- All Stores ) : .: •• o )
Wal-Mart /Sam's Club
- All Stores ) .:• O .; Q J
Aldi —All Stores: ) : ;• O
Save-A-Lot .: > o ..• o J
Lansing City Market ..:• .-• .:•• J o ..:•
Local Farmers Markets :• > •• J) J )
Vallarta Market:• :•• : : ) .:
Quality Dairy-All
Stores .; i J .:• o )
Apple Market > : •• ; : :•
Goodrich Shop Rite ..: ..:• ;• ..•' ..: .:
L&L .: ..:• .:• > ) .;
Horrocks )} ' : *
;•
103

hich you shop foi fiesh pioduce at these
013 | Edit Question | • |[ Move Delete
*13. Please indicate the fiequency at wpioviders in the Lansing aiea:
Very Rarely: 1
to 2 times a
year
Rarely: About
1 or 2 times
every 3 - 4
months
Infrequently: 1Frequently: 1 -
to 2 times2 times a
every 1 - 2month
months
Very
Frequently: 3 -
4 times a
month or more
Never Shop
there for fresh
produce
Kroger- All Stores > : :• \ > )
Meijer- All Stores.
.:• > : i o
Wal-Mart /Sam's Club
- All StoresX_jf
•L> : ; )
Aldi-AII Stores .: .. O .:•• J o
Save-A-Lot .; J ) J J J
Lansing City Market ;• • .:• :• J :••
Local Farmers Markets :•• ) ; •• : J
Vallarta Market :•• :•• :•• :•• )
Quality Dairy-All
Stores : O ) > J
Apple Market .:•• , .:•• i J
Goodrich Shop Rite .: .:•• .:•• ..: , O
L&L, • : .: ) o
Ho rrocks .: • ) •:'
;
.:•
04

014 Edit Question • , Move : Delete
* 14.What is youi PRIMARY souice of fiesh pioduce 01 canned fiozen vegetahles andfi<iit in the Lansing-East Lansing aiea? CHOOSE ONLY ONE. {The question is looking
foi youi primary souice, not the primaiy souice foi each categoiy. Pick the categoiythat best lepiesentsyoiu piimaiy souice of food, and please piovide the location ofthat source. MAKE SURE THERE IS ONLY DATA IN ONE FIELD - MAKE SURE THERE ARE
NO SPACES IN OTHERS. AS THIS WILL PREVENT YOU FROM PROCEEDING)
Grocer/Supermarket: NAME and LOCATION (Example: Lake
Lansing Meijer)
Convenience Store: NAME and LOCATION (Example: QD, Cedar
and Greenlatwn)
Farmer/City Market: NAME and LOCATION
Community Garden
Personal Garden
Other:
Here+ Add Question Split Page
015 j EditQuestion • Add Question Logic Move Delete
15. What is youi PRIMARY leason foi shopping at the location you indicated in thepievious Ouestion?
;. Ability to use self-checkout
: Quality of produce
;• Variety of produce
;• Price
} No other options
) Location - close to home
'• Location - close to work/school
;• Location - close to bus route
;< Store hours
;• Other (please specify)
05
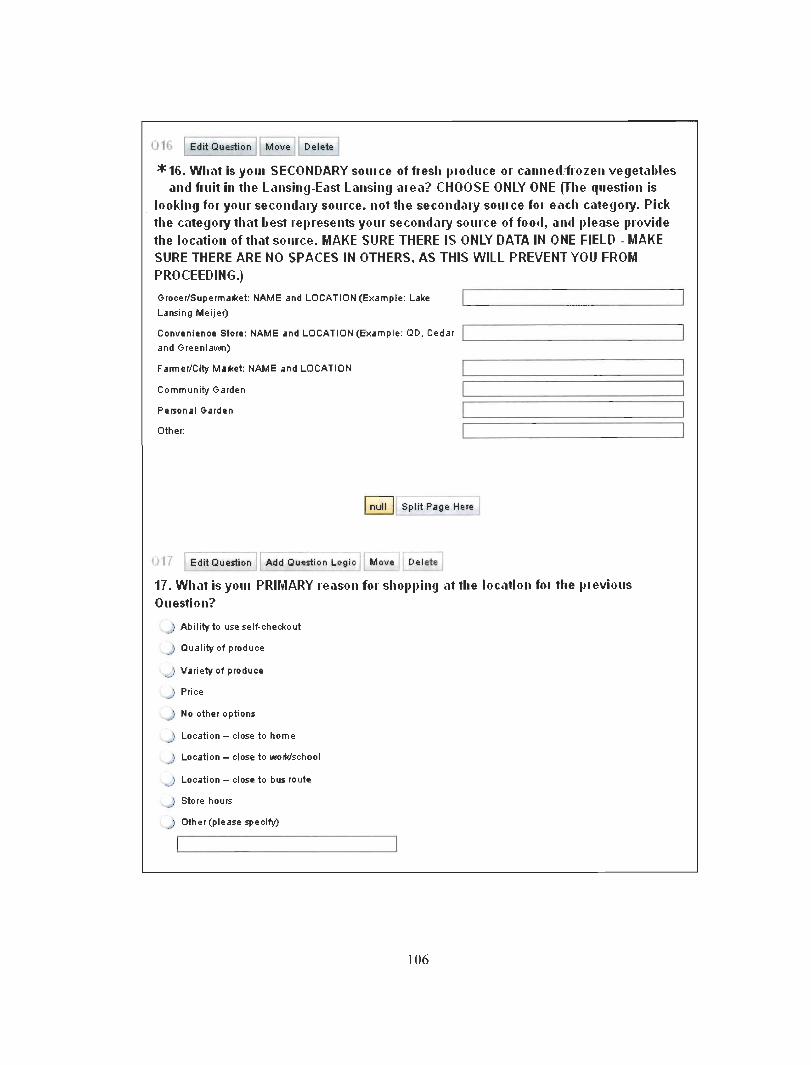
016 Edit Question Move Delete
* 16. What is youi SECONDARY souice of fiesh pioduce 01 canned fiozen vegetahlesand fiuit in the Lansing-East Lansing aiea? CHOOSE ONLY ONE (The question is
looking foi youi secondaiy souice. not the secondaiy souice foi each categoiy. Pickthe categoiy that best lepiesentsyoiii secondaiy souice of food, and please piovidethe location of that souice. MAKE SURE THERE IS ONLY DATA IN ONE FIELD - MAKE
SURE THERE ARE NO SPACES IN OTHERS. AS THIS WILL PREVENT YOU FROM
PROCEEDING.)
Grocer/Supermarket: NAME and LOCATION (Example: Lake
Lansing Meijer)
Convenience Store: NAME and LOCATION (Example: QD, Cedar
and G re e n Iawn)
Farmer/City Market: NAME and LOCATION
Community Garden
Personal Garden
Other:
null j Split Page Here
017 [Edit Question Add Question Logic Move Delete
17. What is youi PRIMARY leason foi shopping at the location foi the pieviousOuestion?
; Ability to use self-checkout
:• Quality of produce
;• Variety of produce
Price
;• No other options
j Location - close to home
;• Location - close to work/school
: Location - close to bus route
} Store hours
;> Other (piease specify)
106

018 Edit Question Move Delete
18. How long does it typically take you to leach youi piimary food retailer? In minutes:
null Split Page Here
Edit Question Move Delete
19. How long does it typically take you to leach youi secondaiy food letailei? Inminutes:
null Split Page Here
020 | Edit Question Move Delete
20. What is the aveiage length of time you spend shopping foi food on an aveiagetrip? In hours and minutes: (example 0 his 45 mins, oi 1 hi, 15 mins)
null Split Page Here
\l\ Edit Question Add Question Logic Move Delete
21. Do you own a cai?
r v
07

022 EditQuestion Add Question Logic Move Delete
22. What is youi primary method of foo
..:, Foot
;• Car
; Bus
; Share a ride in a car with neighbor, friend, or r
;• Taxi
;• Bike
;• Food is delivered
;• Other (piease specify)
d shopping?
ilative.
1
null Split Page Here
i Edit Question Move Delete
* 23. How many trips do you typic ally inake in a month to puichase food:
null
108

7.Page 4 - Demographic Information
+ Add Question
024 Edit Question T Add Question Logic Move
* 24. What is youi appioximate age?
Delete
+ Add Question Split Page Here
025 [Edit Question Move Delete
25. What do you do foi a living?
Here+ Add Question Split Page
026 Edit Question j W\ Add Question Logic Move Delete
26. Aie you cuiiently living off a pension, letiiement oi social secuiity benefits?
+ Add Question Split Page Here
027 Edit Question • Add Question Logic Move Delete
27. Aie you woiking full-time oi pait-time?
09

028 jj28. How long have you lived at this residence in years and oi months?
Edit Question Move Delete
Q29 I Edit Question Move Delete
null Split Page Here1
29. If less than one yeai. wheie did you live piioi to heie? Leave blank if notapplicable.
null Split Page Here
MA i Edit Question Add Question Logic Move Delete
30. If in youi anient location foi less than a yeai, how would you best desciibe youipievious community?
_;• Suburban
) Urban
;• Rural
| Campus
; Apartment Complex
;• Trailer Park
| Oth e r(p Ie ase sp e cify)
10

031 EditQuestion Add Question Logic Move Delete
31. Are you cuiiently taking classes at the college level?
null j Split Page Here
0,>2 ; Edit Question Add Question Logic Move Delete
32. What is youi highest level of education?
;• Less than 9th grade
;• Some High School
;• High School/GED
;• Some College
; Associates
: Bachelors Degree
; Masters/JD
; PhD/MD
) Oth e r (p Ie ase sp e cify)
null | Split Page Here
033 ! Edit Question Move Deletet i I I' !
33. Optional - In the space below, please piovide any opinions you have about foodaccess at youi anient location:
111

Appendix B
HSIRB Approval Letter
Date: March 10, 2011
To: Lucius Hallett, Principal InvestigatorThomas Veldman , Student Investigator for thesis
:Amy Naugle, Ph.D., LirJ^NiUir-Re: HSIRB Project Number: 11-03-10
Thisletterwill serveas confirmation thatyourresearch project titled"A PerceptionAnalysis ofDowntown Residents: The City ofLansing, MI: Food Desert inContext" hasbeen"approved under the exempt category ofreview by the Human Subjects InstitutionalReview Board. Theconditions and duration of this approval are specified in the PoliciesofWestern Michigan University. You may now begin to implement the research asdescribed in the application.
Please note that you may only conduct this research exactly inthe form it was approved.You must seek specific board approval for any changes in this project. You must alsoseek reapproval if the project extends beyond the termination date noted below. Inaddition if there areanyunanticipated adverse reactions or unanticipated eventsassociated withtheconduct of this research, youshould immediately suspend theprojectand contact the Chair of the HSIRB for consultation.
TheBoard wishes yousuccess in thepursuit ofyourresearch goals.
Approval Termination: March 10,2012
From
12
Human Subjects Institutional Review Board
Walwood Hail, Kalamazoo, Ml 49008-5456
PHONE: (269! 387-8293 TO (269!387-8276

Appendix C
Consent Form
CONSENT FORM
You are invited 10participate in a Western Michigan University research project entitled '"APerceptionAnalysisof DoivntoHn Residents Ihe ( it) of Ijittsirtg. MI Ftyod Desert in Context." Thestudy is designed 1oawdyve how resident* purchase food in Downiown Lansing, where theypurchase. food, and their perceptions of food access given their current mode of transportation.Information ty.tli,•:•..: fi.1:11 this ccsi-auli ur.-.y ,iiJ future research into understanding the nature offood deserts in communities worldwide. The study is being conducted by Dr. Lucius F. HaUett IVand Mr Ihomas J, Veldman, front the Department of Geography of WeHem Michigan University.The research is being carried out for part of the thesis requirements for Mr. Thomas i. Veldman.
Your responses will be completely anonymous, please do nol put your name or address anywhere onthis form except where indicated to be considered for the $100 Gift Card, which will be storedseparately upon receipt from the survey vdu completed, tt will not be possible to link your personalinformation to your survey response once this information has been separated. You nuy choose notto answer any question by leaving the question blank. If you do not want to participate "m the survey,please discard the survey and the return envelope. By returning the completed survey, you indicatejour consent for the use of the Answers you supply. If you have any questions, or you wish to notparticipate in this survey after you submitted it, you may contact l>r. Lucius F. llallctt, IV at (269-387-5536 Of Iucius.halletter wnuch.edu), Mr. Iliomas Veldman at (517-889-2044 orthomas.j.vcldman'a!wmich.edu), the Human Subjects Institutional Review Board (269*38?'R293) orthe Vice President for research at Western Michigan 1 niversily (269-387-8298).
'Ihis consent document has been approved for use for one year by the Human Subjects InstitutionalRl\ jew Board (HSIRB) as indicated by the stamped date and signature of the hoard chair in theupper rightcorner Subjects should not participate in this project if the stamped date is more than imcS _'.!.- ..'J.
Contact information:
Dr. Lucius K.llallrtl, IV
1903 W. Michigan Ave. MS 5424Kalamazoo, Ml 49008-5424HI: 269-387-3536
li-mai I: 1uc iu vhal lett 'avvmich .cdu
Human Subjects InMitiitinnal Review liuarcilO'.U W Michg*n Ave Ms --Jv.Kalamazoo, Ml 4900S-5424PH: 269-387-8293
T>mail: rcsearch-c<mipl ianc-c'<? winich.edu
Thomas Veldman
1903 * • Michigan Ave. MS 5424Kalama/oo, Ml 19O08-5424HI: 517-889-2044
L-mail: Ibornas j .vcldman^wmich cd «
Office nf the Vice-President fnr Research
1903 W. Michigan Ave. MS 5456Kalamazoo, Ml 49008-5424
PI I: 269-387-8293
E-mail: ospr-in for/wiinch.edu
Survcv Code: ONLINE: Please reference jour initiah aadblock address if >«<i choose not Co iiartkipateafter you complete ifc*" onltn* sarvcy. 5. S. I. R. B.
'PCfOnW Kr tii* tor otn yw frc»n At ivr.
13

BIBLIOGRAPHY
Acheson, D. (1998). Independent inquiry into inequalities in health. London: TheStationary Office.
Alwitt, Linda A., and Thomas D. Donley. (1997). "Retail Stores in Poor UrbanNeighborhoods." TheJournal ofConsumer Affairs 31.1 139-64.
Ball, K., Timperio, A. F., & Crawford, D. A. (2006). Understanding environmentalinfluences on nutrition and physical activity behaviors: where should we lookand what should we count? The International Journal ofBehavioral Nutritionand Physical Activity, 3-33.
Bitler, Marianne and Steven J. Haider. 2010. "An Economic View of Food Deserts inthe United States." Journal ofPolicy Analysis and Management 30(1),153-176.
Capps, O., & Nayga, R. (1999). US consumers' perceptions of the importance offollowing the US dietary guidelines. Food Policy, 24(5), 553-564.
Cotterill, R. W., & Haller, L. E. (1992). Barrier and queue effects: A study of leadingus supermarket chain entry patterns. TheJournal ofIndustrial Economics, 40(4),427-440.
Cummins, S., & Macintyre, S. (2002). A systematic study of an urban foodscape: theprice and availability of food in greater Glasgow. Urban Studies, 39(11), 2115-2130.
Cummins, S., & Macintyre, S. (2006). Food environments and obesity—neighbourhood or nation? International Journal ofEpidemiology, 35(1), 100 -104.
Cummins, S., Marshall, D., Sparks, L., Taylor, M., Dawson, J., Dewar, J., et al.(2007). The development of a healthy eating indicator shopping basket tool(HEISB) for use in food access studies—identification of key food items. PublicHealth Nutrition, 70(12), 1440-1447.
Cummins, S., Smith, D. M., Taylor, M., Dawson, J., Marshall, D., Sparks, L., &Anderson, A. S. (2009). Variations in fresh fruit and vegetable quality by storetype, urban-rural setting and neighbourhood deprivation in Scotland. PublicHealth Nutrition, 12(11), 2044-2050.
Diez-Roux, A. V., Nieto, F. J., Caulfield, L., Tyroler, H. A., Watson, R. L., & Szklo,M. (1999). Neighbourhood differences in diet: the Atherosclerosis Risk in
114

Communities (ARIC) Study. Journal ofEpidemiology and CommunityHealth, 53(1), 55-63.
Diez-Roux, A. V., Nieto, F. J., Caulfield, L., Tyroler, H. A., Watson, R. L., & Szklo,M. (1999). Neighbourhood differences in diet: the Atherosclerosis Risk inCommunities (ARIC) Study. Journal ofEpidemiology and CommunityHealth, 53(1), 55-63.
Dolby, V., 1996. Where American diets fall short, supplements make up thedifference. Better Nutritionfor Today's Living 58 (9), 12.
Donald, R. (2007). Food stamps, the thrifty food plan, and meal preparation: Theimportance of the time dimension for US nutrition policy. Journal ofNutritionEducation and Behavior, 39(4), 226-232.
Downtown Professionals Network. (2009). Downtown Lansing, Michigan MarketStudy and Strategies Summary Version.
Duvall, C. S., Howard, P. H., & Goldsberry, K. (2010). Apples and Oranges?Classifying Food Retailers in a Midwestern US - City Based on theAvailability of Fresh Produce. Journal ofHunger & Environmental Nutrition,5(4), 526-541.
Eyre, H., Clarke, G., & Guy, C. (2004). Food retail change and the growth of fooddeserts: A case study of Cardiff. International Journal ofRetail DistributionManagement, 32(2/3), 72.
Fisher, G. (1997). The low-income consumer: Adjusting the balance of exchange, TheJournal ofConsumer Affairs, 31(2), 372-376.
Food Marketing Institute, 1990. Trends: Consumer Attitudes and the Supermarket.Washington, DC.
Glanz, K., Sallis, J. F., Saelens, B. E., & Frank, L. D. (2007). Nutrition environmentmeasures survey in stores (NEMS-S): Development and evaluation. AmericanJournal ofPreventive Medicine, 32(4), 282-289.
Goldsberry, K., Duvall, C. S., Howard, P. H., & Stevens, J. E. (2010). Visualizingnutritional terrain: a geospatial analysis of pedestrian produce accessibility inLansing, Michigan, USA. GEOCARTO International, 25(6), 485-499.
Gould, P. and White, R. (1974). Mental Maps. Baltimore, MD: Penguin Books.
Hallett IV, L. F., & McDermott, D. (2011). Quantifying the extent and cost of fooddeserts in Lawrence, Kansas, USA. Applied Geography, 31(4), 1210-1215.
115

Laraia, B. A., Siega-Riz, A. M., Kaufman, J. S., & Jones, S. J. (2004). Proximity ofsupermarkets is positively associated with diet quality index for pregnancy.Preventive Medicine, 39(5), 869-875.
Larsen, K., & Gilliland, J. (2008). Mapping the evolution of'food deserts' in aCanadian city: Supermarket accessibility in London, Ontario, 1961-2005.International Journal ofHealth Geographies, 7(1), 16.
Laurison, H., Giang, T., Karpyn, A., Hillier, A., & Perry, R. D. (2008). Closing thegrocery gap in underserved communities: The creation of the Pennsylvania freshfood financing initiative. Journal ofPublic Health Management and Practice,14(3), 272-279.
McLafferty, Sara L. (2010). Conducting Questionnaire Surveys. Key Methods inGeography,2nd Edition. Sage Books: 77-88
Michigan Department of Community Health. (2009). Overweight and Obesity:Surveillance Report Series, http://www.michigan.gov/ documents/mdeh/Obesity_chapter_283600_7.pdf
Moore, L. V. (2007). Measuring the localfood environment and its associations withdiet quality. University of Michigan). ProQuest Dissertations and Theses, , 91 p.
Moore, L. V., & Diez Roux, A. V. (2006). Associations of neighborhoodcharacteristics with the location and type of food stores. American Journal ofPublic Health, 96(2), 325-331.
Moore, L.V., A.V. Diez Roux, and S. Brines (2008). "Comparing Perception-Basedand Geographic Information System (GIS)-Based Characterizations of the LocalFood Environment," J Urban Health, March, 85(2): 206-16.
Morland, K., Diez Roux, A. V., & Wing, S. (2006). Supermarkets, other food stores,and obesity: The atherosclerosis risk in communities study. American Journal ofPreventive Medicine, 30(4), 333-339.
Morland, K., Diez Roux, A., & Wing, S. (2002). The contextual effect of the localfood environment on residents' diets: The atherosclerosis risk in communities
study. American Journal ofPublic Health, 92( 11), 1761-1767.
Morland, K., Wing, S., Diez Roux, A., & Poole, C. (2002). Neighborhoodcharacteristics associated with the location of food stores and food service
places. American Journal ofPreventive Medicine, 22(1), 23-29.
116
Nayga Jr., Rodolfo M. & Capps Jr., Oral, 1999. "US consumers' perceptions of theimportance of following the US dietary guidelines," Food Policy, Elsevier, vol.24(5), pages 553-564, October.
Nayga, R.M., 1997. Impact of sociodemographic factors on perceived importance ofnutrition in food shopping. Journal ofConsumer Affairs 31 (1), 1-9.
Patterson, R.E., Kristal, A.R., White, E., 1996. Do beliefs, knowledge, and perceivednorms about diet and cancer predict dietary change? American Journal ofPublicHealth 86 (10), 1394-1400.
Pearson, T., Russell, J., Campbell,M.J.,&Barker, M. E. (2005).Do'food deserts'influence fruit and vegetable consumption? - a cross-sectional study. Appetite,25, 195-197.
Pothukuchi, K. (2005). Attracting supermarkets to inner-city neighborhoods:Economic development outside the box. Economic Development Quarterly,19(3), 232-244.
Powell, L. M., Slater, S., Mirtcheva, D., Bao, Y., & Chaloupka, F. J. (2007). Foodstore availability and neighborhood characteristics in the United States.Preventive Medicine, 44(3), 189-195.
Reed, M. (2011). Examining the behavioral interactions between urban residents andtheir food environment: A case study of greater Lansing, Michigan. ProQuestDissertations and Theses.
Rose, D., & Richards, R. (2004). Food store access and household fruit and vegetableuse among participants in the US food stamp program. Public Health Nutrition,7(8), 1081-1088.
Rushton, G. (1969). Analysis of spatial behavior by revealed space preference',Annals ofthe Association ofAmerican Geographers, 59: 391-406
Short, A., Guthman, J., Raskin, S. (2007) Food Deserts, Oases, or Mirages?: SmallMarkets and Community Food Security in the San Francisco Bay AreaJournal ofPlanning Education and Research March 26, 352-364.
Simms, E. (2011). Local food: Perceptions and realities in southwest Michigan,ProQuest Dissertations and Theses.
Trochim, W. (1989). An introduction to concept mapping for program planning andevaluation. Evaluation and Program Planning, 12, 1-16.
117

Trochim, W. M., & Kane, M. (2005). Concept mapping: An introduction to structuralconceptualization in health care. International Journal for Quality in HealthCare, 17, 187-191.
Tyebjee, T. T. (1979). Telephone survey methods: the state of the art. The JournalofMarketing, 43(3), 68-78.
U.S. Census Bureau. (2010). Census. Retrieved October 11, 2010, fromhttp://2010.census.gov/2010census/.
United States Department of Agriculture. (2011). Food Desert Locator.http://www.ers.usda.gov/data/fooddesert/fooddesert.html
Walker, R., Keane, C, Burke, J., (2010), Disparities and access to healthy food in theUnited States: A review of food deserts literature, Health & Place, Volume 16,Issue 5, 876-884
Whelan, A., Wrigley, N., Warm, D., & Cannings, E. (2002). Life in a —food desert.lUrbanStudies, 39(11), 2083 -2100.
Wrigley, N. (2002). 'Food deserts' in British cities: Policy context and researchpriorities. UrbanStudies, 39(11), 2029-2040.
Wrigley, N., Margetts, B., Whelan, A., & Warm, D. (2002). Assessing the impact ofimprovedretail access on diet in a 'food desert': A preliminary report. UrbanStudies, 39(11), 2061-2082.
Zenk, S. N., Schulz, A. J., Hollis-Neely, T., Campbell, R. T., Holmes, N., Watkins,G., Nwankwo, R., et al. (2005a). Fruit and vegetable intake in AfricanAmericans income and store characteristics. American JournalofPreventiveMedicine, 29(1), 1-9.
118