a perception of employees on hr practices …eprints.utar.edu.my/927/1/ba-2012-0902939.pdf · a...
TRANSCRIPT

A PERCEPTION OF EMPLOYEES ON HR PRACTICES TOWARD ORGANIZATIONAL PERFORMANCE IN
HOTEL INDUSTRY
i
A PERCEPTION OF EMPLOYEES ON HR PRACTICES TOWARD ORGANIZATIONAL PERFORMANCE IN HOTEL
INDUSTRY
CHONG CHYN WAH
ENG SIE LIH GWEE SHIANN HERNG
OOI YAW YANG WANG CHEE HUNG
BACHELOR OF BUSINESS ADMINISTRATION (HONS)
UNIVERSITI TUNKU ABDUL RAHMAN
FACULTY OF BUSINESS AND FINANCE DEPARTMENT OF BUSINESS
MARCH 2012

A PERCEPTION OF EMPLOYEES ON HR PRACTICES TOWARD ORGANIZATIONAL PERFORMANCE IN
HOTEL INDUSTRY
ii
A PERCEPTION OF EMPLOYEES ON HUMAN RESOURCE
PRACTICES TOWARDS ORGANIZATIONAL
PERFORMANCE IN HOTEL INDUSTRY
BY
CHONG CHYN WAH
ENG SIE LIH
GWEE SHIANN HERNG
OOI YAW YANG
WANG CHEE HUNG
A research project submitted in partial fulfillment of the
Requirement for the degree of
BACHELOR OF BUSINESS ADMINISTRATION (HONS)
UNIVERSITY TUNKU ABDUL RAHMAN
FACULTY OF BUSINESS AND FINANCE
DEPARTMENT OF BUSINESS
MARCH 2012

A PERCEPTION OF EMPLOYEES ON HR PRACTICES TOWARD ORGANIZATIONAL PERFORMANCE IN
HOTEL INDUSTRY
iii
Copyright @ 2012
ALL RIGHTS RESERVED. No part of this paper may be reproduced, stored in a retrieval
system, or transmitted in any form or by any means, graphic, electronic, mechanical,
photocopying, recording, scanning, or otherwise, without the prior consent of the authors.

A PERCEPTION OF EMPLOYEES ON HR PRACTICES TOWARD ORGANIZATIONAL PERFORMANCE IN
HOTEL INDUSTRY
iv
DECLARATION
We hereby declare that:
(1) This undergraduate research project is the end result of our own work and that due
acknowledgement has been given in the references to ALL sources of information be they
printed, electronic, or personal.
(2) No portion of this research project has been submitted in support of any application for
any other degree or qualification of this or any other university, or other institutes of
learning.
(3) Equal contribution has been made by each group member in completing the research
project.
(4) The word count of this research report is___35,658___words.
Name of Students: Student ID: Signature:
1.Chong Chyn Wah 09ABB02939
2.Eng Sie Lih 09ABB05788
3.Gwee Shiann Herng 09ABB04096
4.Ooi Yaw Yang 09ABB03204
5.Wang Chee Hung 09ABB03916
Date: __March 15, 2012___

A PERCEPTION OF EMPLOYEES ON HR PRACTICES TOWARD ORGANIZATIONAL PERFORMANCE IN
HOTEL INDUSTRY
v
ACKNOWLEDGEMENT
First and foremost, we would like to thank to Universiti Tunku Abdul Rahman (UTAR) for
giving us a chance to conduct this research project. Through conducting the research, we are
able to understand how an organization increases its performance by changing or modifying
its internal policy. This experience enables us to better suit into working environment from
the point of human resource perspective.
Apart from that, we also want to show our highest appreciation to our most respected
research project supervisor, Mr. Peter Tan Sin Howe who gives us a lot of guidance and
support throughout the process. Through his professional opinion, we learn a lot of
knowledge that cannot be obtained in the lecture class. This research project is impossible to
complete without his opinion and guidance.
Moreover, we would like to take this opportunity to thank to our target respondents who
spend their time in answering our questionnaire. Their idea and opinion is very important to
us in completing this research project. Besides that, we would also like to show our
appreciation to management of hotel for their time and consideration in allowing us to do
survey with their employees.
Last but not least, we would like to show highest gratitude for every group member who
cooperate with each other in completing this research project. The effort and scarification
made by every group member will never be forgotten. Thank you.

A PERCEPTION OF EMPLOYEES ON HR PRACTICES TOWARD ORGANIZATIONAL PERFORMANCE IN
HOTEL INDUSTRY
vi
DEDICATION
We would like to dedicate this research project to individual who indirectly or indirectly
contribute to the completion of this research paper. When we are conducting the research, a
lot of people have gives us guidance, support as well as motivation. This range from friends
that support us when we are in the midst of understanding some theories, respondents that
help us answer our questionnaire, management of hotels and every group members who
spend considerable time and effort in completing this research in the past nine months.
Apart from that we would like to show our highest dedication and gratitude to our research
project supervisor, Mr. Peter Tan Sin Howe, for his motivate and professional guidance
throughout our research project. His guidance is very valuable to us as he guide us to the
direct direction and motivate us to complete the research project.

A PERCEPTION OF EMPLOYEES ON HR PRACTICES TOWARD ORGANIZATIONAL PERFORMANCE IN
HOTEL INDUSTRY
vii
TABLE OF CONTENTS
Page
Copyright Page…………………………………………………………………………….. ii
Declaration ………………………………………………………………………………… iii
Acknowledgement…………………………………………………………………………. iv
Dedication………………………………………………………………………………….. v
Table of Contents…………………………………………………………………………... vi
List of Tables………………………………………………………………………………. xi
List of Figures…………………………………………………………………………….. xiii
List of Abbreviations……………………………………………………………………... xiv
List of Appendices………………………………………………………………………… xv
Preface……………………………………………………………………………………. xvi
Abstract…………………………………………………………………………………. xvii
CHAPTER 1 INTRODUCTION
1.0 Introduction…………………………………………………………………..1
1.1 Research Background…………………………………………………….…..1
1.1.1 Background of Hotel Industry in Malaysia………………….….3
1.2 Problem Statement…………………………………………………....8
1.3 Research Objectives ………………………………………………. .12
1.3.1 General Objective ………………………………………….. 12
1.3.2 Specific Objectives ……………………………………….... 12
1.4 Research Questions ……………………………………………….... 12
1.5 Hypotheses of the Study (for quantitative research) ……………..… 13
1.6 Significance of the Study …………………………..………………. 14
1.7 Chapter Layout ………………………………..……………………. 16
1.8 Conclusion …………………………………….…………………..... 17
CHAPTER 2 LITERATURE REVIEW
2.0 Introduction ………………………………………………………… 18
2.1 Review of the Literature………………………………………….. ... 18
2.1.1 Dependent Variable: Organizational Performance………….. .. 18
2.1.1.1 Corporate Financial Performance ………………….. ... 19

A PERCEPTION OF EMPLOYEES ON HR PRACTICES TOWARD ORGANIZATIONAL PERFORMANCE IN
HOTEL INDUSTRY
viii
2.1.1.2 Occupancy Rate ……………………………………… 20
2.1.1.3 Employee Performance ……………………………... 22
2.1.1.4 Turnover Rate ………………………………………. 23
2.1.2 Independent Variable: Human Resource Practices …………. 25
2.1.3 Independent Variable: Selective Hiring …………………….. 26
2.1.4 Independent Variable: Training and Development …………. 28
2.1.5 Independent Variable: Performance Appraisal ……………... 32
2.1.6 Independent Variable: Compensation ………………………. 35
2.2 Review of Relevant Theoretical Models…………………………... 37
2.2.1 Model 1: Comparing Appropriate decision support of
human resource practices on organizational
performance with DEA/AHP model ……………… 37
2.2.2 Model 2: Strategic Human Resource Management and
organizational performance in Singapore ………… 41
2.2.3 Model 3: An investigation of the relationship between
compensation practices and firm performance in
the US hotel industry ……………………………... 45
2.2.4 Model 4: Competency-based human resource practices in
Malaysia public sector organizations …………….. 48
2.2.5 Model 5: Training, motivation, and performance: The
case of human resource management in
construction projects in Mashhad, Iran …………… 51
2.3 Proposed Theoretical/Conceptual Framework ……………………. 55
2.4 Hypotheses Development ………………………………………… 56
2.4.1 The Relationship between Selective Hiring and
Organizational Performance ………………………………... 56
2.4.2 The Relationship between Training and Development and
Organizational Performance ………………………………... 57
2.4.3 The Relationship between Performance Appraisal and
Organizational Performance ………………………………... 58
2.4.4 The Relationship between Compensation and
Organizational Performance ………………………………... 59
2.4.5 The Relationship between Human Resource Practices and
Organizational Performance ………………………………... 60
2.5 Conclusion ………………………………………………………... 61

A PERCEPTION OF EMPLOYEES ON HR PRACTICES TOWARD ORGANIZATIONAL PERFORMANCE IN
HOTEL INDUSTRY
ix
CHAPTER 3 RESEARCH METHODOLOGY
3.0 Introduction ………………………………………………………. 62
3.1 Research Design ………………………………………………….. 62
3.2 Data Collection Methods………………………………………….. 63
3.2.1 Primary Data ………………………………………………... 63
3.2.2 Secondary Data ……………………………………………... 63
3.3 Sampling Design ………………………………………………….. 64
3.3.1 Target Population …………………………………………… 64
3.3.2 Sampling Frame and Sampling Location …………………… 64
3.3.3 Sampling Elements …………………………………………. 66
3.3.4 Sampling Techniques ……………………………………….. 66
3.3.5 Sampling Size ………………………………………………. 67
3.4 Research Instrument ………………………………………………. 67
3.4.1 Pilot Study …………………………………………………... 67
3.4.2 Full Study …………………………………………………….69
3.5 Constructs Measurement (Scale and Operational Definitions) …… 70
3.6 Data Processing …………………………………………………… 81
3.7 Data Analysis ……………………………………………………... 83
3.7.1 Descriptive Analysis ………………………………………... 83
3.7.2 Scale Measurement – Reliability Test ……………………… 83
3.7.3 Inferential Analysis …………………………………………. 86
3.7.3.1 Pearson Correlation Coefficient …………………….. 86
3.7.3.2 Multiple Regression Analysis ………………………. 87
3.8 Conclusion …………………………………………………………89
CHAPTER 4 RESEARCH RESULTS
4.0 Introduction………………………………………………………... 90
4.1 Descriptive Analysis ……………………………………………… 91
4.1.1 Respondent Demographic Profile …………………………... 91
4.1.1.1 Gender ………………………………………………. 94
4.1.1.2 Age ………………………………………………….. 95
4.1.1.3 Ethnic Group ………………………………………... 96

A PERCEPTION OF EMPLOYEES ON HR PRACTICES TOWARD ORGANIZATIONAL PERFORMANCE IN
HOTEL INDUSTRY
x
4.1.1.4 Education Level …………………………………….. 98
4.1.1.5 Location of Work ………………………………….. 100
4.1.1.6 Year of Employment ………………………………. 101
4.1.1.7 Monthly Income …………………………………… 103
4.1.1.8 Working Department ……………………………… 104
4.1.2 Central Tendencies Measurement of Constructs ………….. 107
4.1.2.1 Organizational Performance ………………………. 108
4.1.2.2 Selective Hiring …………………………………….113
4.1.2.3 Training and Development ………………………... 117
4.1.2.4 Performance Appraisal ……………………………. 120
4.1.2.4 Compensation …………………………………….. 124
4.2 Scale Measurement ……………………………………………... 129
4.2.1 Internal Reliability Test …………………………………… 129
4.3 Inferential Analysis ……………………………………………... 131
4.3.1 Pearson Correlation Coefficient …………………………... 131
4.3.1.1 The Relationship between Selective Hiring and
Organizational Performance ………………………. 132
4.3.1.2 The Relationship between Training and
Development and Organizational Performance …… 134
4.3.1.3 The Relationship between Performance Appraisal
and Organizational Performance ………………….. 136
4.3.1.4 The Relationship between Compensation and
Organizational Performance ………………………. 138
4.3.2 Multiple Regression Analysis ……………………………... 140
4.3.2.1 The Relationship between the Four Independent
Variables and Organizational Performance ……….. 140
4.3.2.2 Nature of Relationship …………………………….. 141
4.3.2.3 Strength of Relationship …………………………... 143
4.4 Conclusion ………………………………………………………. 145
CHAPTER 5 DISCUSSION AND CONCLUSION
5.0 Introduction ……………………………………………………… 146
5.1 Summary of Statistical Analyses ………………………………... 147

A PERCEPTION OF EMPLOYEES ON HR PRACTICES TOWARD ORGANIZATIONAL PERFORMANCE IN
HOTEL INDUSTRY
xi
5.1.1 Summary of Descriptive Analyses ………………………… 147
5.1.2 Summary of Inferential Analyses …………………………. 148
5.1.2.1 Reliability Test …………………………………….. 148
5.1.2.2 Pearson Correlation Analyses ……………………... 148
5.1.2.3 Multiple Regression Analyses …………………….. 149
5.2 Discussion of Major Findings …………………………………… 150
5.2.1 Selective Hiring …………………………………………… 151
5.2.2 Training and Development ………………………………... 152
5.2.3 Performance Appraisal ……………………………………. 153
5.2.4 Compensation ……………………………………………... 155
5.2.5 Human Resources Practices ……………………………….. 157
5.3 Implication of the Study ………………………………………… 159
5.3.1 Theoretical Implications …………………………………... 159
5.3.2 Managerial Implications …………………………………... 159
5.4 Limitations of the Study …………………………………………. 162
5.5 Recommendations for Future Research …………………………. 163
5.6 Conclusion ………………………………………………………. 164
References ……………………………………………………………………………….. 165
Appendices ………………………………………………………………………………. 178

A PERCEPTION OF EMPLOYEES ON HR PRACTICES TOWARD ORGANIZATIONAL PERFORMANCE IN
HOTEL INDUSTRY
xii
LIST OF TABLES
Page
Table 1.1: Malaysia Hotel Star Rating …………………………………………………… 6
Table 1.2: Malaysia Tourist Arrival Report in year 2008, 2009 & 2010 ………………… 10
Table 1.3: Average Occupancy Rate in year 2008, 2009 & 2010 ………………………... 10
Table 3.1: Schedule for Pilot Study ………………………………………………………. 68
Table 3.2: Schedule for Full Study ……………………………………………………….. 69
Table 3.3: Questions of Demographic Profile ……………………………………………. 71
Table 3.4: Section B in Questionnaire ……………………………………………………. 76
Table 3.5: Section C in Questionnaire ……………………………………………………. 79
Table 3.6: Rules of Thumb about Reliability Test ………………………………………... 84
Table 3.7: Reliability of Questionnaire (Pilot Study) …………………………………….. 85
Table 3.8: Rules of Thumb about Correlation Coefficient ……………………………….. 87
Table 4.1: Respondent Demographic Profile ……………………………………………... 91
Table 4.2: Frequency Analysis on Gender of Respondents ………………………………. 94
Table 4.3: Frequency Analysis on Age Group of Respondents …………………………... 95
Table 4.4: Frequency Analysis on Ethic Group of Respondents …………………………. 96
Table 4.5: Frequency Analysis on Education Level of Respondents …………………….. 98
Table 4.6: Frequency Analysis on Location of Work of Respondents ………………….. 100
Table 4.7: Frequency Analysis on Years of Employment of Respondents ……………... 101
Table 4.8: Frequency Analysis on Monthly Income of Respondents ………………….... 103
Table 4.9: Frequency Analysis on Working Department of Respondents ………………. 104
Table 4.10: Cronbach’s Alpha Reliability Analysis …………………………………….. 129
Table 4.11: Pearson Correlation Coefficient ……………………………………………. 131
Table 4.12: Correlation between Selective Hiring and Organizational Performance …… 132
Table 4.13: Correlation between Training and Development and Organizational
Performance ……………………………………………………………….... 134

A PERCEPTION OF EMPLOYEES ON HR PRACTICES TOWARD ORGANIZATIONAL PERFORMANCE IN
HOTEL INDUSTRY
xiii
Table 4.14: Correlation between Performance Appraisal and Organizational
Performance ………………………………………………………………… 136
Table 4.15: Correlation between Compensation and Organizational Performance ………138
Table 4.16: Multiple Regression Analyses ……………………………………………… 140
Table 4.17: Model Summary ……………………………………………………………. 143
Table 4.18: Anova ………………………………………………………………………. 144
Table 5.1: Correlation Value between Four Independent Variables and Organizational
Performance ………………………………………………………………….. 150
Table 5.2: Correlation Value between Human Resource Practices and Organizational
Performance …………………………………………………………………. 157

A PERCEPTION OF EMPLOYEES ON HR PRACTICES TOWARD ORGANIZATIONAL PERFORMANCE IN
HOTEL INDUSTRY
xiv
LIST OF FIGURES
Page
Figure 2.1: Ya-Fen Tseng and Tzai-Zang Lee (2009) Conceptual Model …………..…… 37
Figure 2.2: David Wan, Chin Huat Ong and Victor Kok (2002) Conceptual Model …….. 41
Figure 2.3: Karthik Namasivayam, Li Miao and Xinyuan Zhao (2007) Conceptual
Model …………………………………………………………………………. 45
Figure 2.4: Ilhaamie Abdul Ghani Azmi (2010) Conceptual Model ……………………... 48
Figure 2.5: Amin A. Tabassi and Abu H. A. Bakar (2009) Conceptual Model ………….. 51
Figure 4.1: Gender of Respondents ………………………………………………………. 94
Figure 4.2: Age Group of Respondents …………………………………………………... 95
Figure 4.3: Ethic Group of Respondents ……………………………………………..…… 97
Figure 4.4: Education Level of Respondents ……………………………………………... 99
Figure 4.5: Location of Work of Respondents ……………………………………………. 100
Figure 4.6: Years of Employment of Respondents ……………………………………….. 102
Figure 4.7: Monthly Income of Respondents ………………………………………………103
Figure 4.8: Working Department of Respondents ……………………………………….. . 105
A PERCEPTION OF EMPLOYEES ON HR PRACTICES TOWARD ORGANIZATIONAL PERFORMANCE IN
HOTEL INDUSTRY
xv
LIST OF ABBREVIATIONS
HRM Human Resource Management
HR Practices Human Resource Practices
MAH Malaysian Association Hotels
SPSS Statistical Package for Social Science

A PERCEPTION OF EMPLOYEES ON HR PRACTICES TOWARD ORGANIZATIONAL PERFORMANCE IN
HOTEL INDUSTRY
xvi
LIST OF APPENDICES
Page
Appendix 3.1 Questionnaire …………………………………………………………….. 178
Appendix 3.2 Organization Name Card ………………………………………………… 184

A PERCEPTION OF EMPLOYEES ON HR PRACTICES TOWARD ORGANIZATIONAL PERFORMANCE IN
HOTEL INDUSTRY
xvii
PREFACE
Organizational performance is important variable of organization. It defines existing position
of the organization as well as the future prospect that the organization are facing. This is
especially true for organization that relies heavily on labour work to complete their task.
Hotel industry is the example of labour intensive industry. Human resource or employee is
capital of organization. Human capital is also basic building block of the organization that
directly contribute survival and growth of any organization. A well-managed human resource
can become a source of competitive advantages that cannot be imitated by competitors.
A hotel industry is an industry that heavily relies on ability of its employee to serve their
customers so that customers have an enjoyable experience in the hotel. This in turn relies on
how well the organization establishes its human resource policy to manage its employees.
When employees need and expectation are met by human resource policy of organization,
they will provide better service to customers and increase the chance that the customer come
back to the same hotel.
Due to unique geographical location, culture and history of Malaysia, we have become
country that receives millions of tourists all over the world. Hence, these tourists provide a
huge source of income to Malaysia. The main locations that most of the tourists visit are
Penang, Malacca and Pahang States. These three States consists of many heritage buildings,
entertainment as well as shopping malls to attract tourists. The huge number of tourists will
stay in hotel during their visitation in Malaysia. This is the reason why hotel have to look into
their employee welfare from human resource perspective in order to increase its
organizational performance.
Although it is very difficult to measure organizational performance as different industry may
use different measurement to determine organizational performance. However, it is very
crucial that management of hotel industry look into the ways to increase organizational
performance based on their human capital. This is because improving knowledge, skill,
abilities and others of employee will ultimately benefit organization directly or indirectly.

A PERCEPTION OF EMPLOYEES ON HR PRACTICES TOWARD ORGANIZATIONAL PERFORMANCE IN
HOTEL INDUSTRY
xviii
ABSTRACT
It is commonly known that human resource of an organization is important capital. This is
especially true in labour intensive industry such as hotel industry. A well-managed human
resource is able to help organization to improve its organizational performance. Therefore, a
research is conducted to determine the associated between human resource practices and
organizational performance. Independent variables such as selective hiring, training and
development, performance appraisal and compensation are being studied to determine their
relationship with organizational performance. A total number of 210 set of questionnaires is
collected from non-managerial hotel employees and the result are analyzed. Findings shows
that all human resource practices have significant relationship with organizational
performance. Specifically, compensation and performance appraisal have the strongest
relationship. This is followed by training and development and selective hiring. In another
word, hotel management should focus more on compensation and performance appraisal
system in order increase organizational performance. Also, training and development and
selective hiring should not be neglected.

Organizational Performance
Page 1 of 184
CHAPTER 1: INTRODUCTION
1.0 Introduction
This chapter begins with background of study to provide an overview of this
research. Then, next section followed with problem statements that provide brief
statement on the issue which the research determines to address. This chapter will
continue with research questions and objectives. Next, this chapter will flow to
explain the significant of this study. Finally, the last section provides brief
summary on the contents from chapters one until five in this research.
1.1 Background of Research
Employee or more commonly known as human resource is the basic building
block of a company. It plays a significant role and largely determines success and
failure of a company in a particular industry. It is also the most vital capital of the
company, however, few companies really appreciate the role and function
performed by human resource department (Ahmad and Schroeder, 2003).
Human Resource Management (HRM) is widely defined as a field of professional
practice and organizational activity (Tabassi and Abu Bakar, 2009). It is further
defines as systematic process of managing, attracting, and retaining a firm’s
human resource in order to ensure the company is able to outperform other
competitors in obtaining market share (Ahmad, et al., 2003). This function is
particularly important as it helps company to obtain and retain employee with the
needed and necessary knowledge, skill, ability and others (KSAOs) to perform a
particular job effectively. Staff in human resource department will carry out
intense study on the type of employee which is needed by each and every
department and recruit the right people for the company. This process is called
staffing, a central function to effective human resource management.

Organizational Performance
Page 2 of 184
On the other hand, human resource practices are concern with policies set out by
company with regard to managing, attracting and retaining qualified individual.
Such policies vary from industry to industry as it needs to fit into the nature and
requirement of each industry. Practices set by human resource department of a
company have a significant impact on employees’ motivation and their desire to
serve customer effectively. Practices that are perceived by employee as address to
their need have a positive effect on organizational performance. On the other hand,
practices that do not consider employees’ concern not only harm organizational
performance but also long term prospect of the organization.
Central to managing effective human resource is having efficient human resource
department. This department is normally being regarded as “expenditure”
department where the department incurs expenses and consumes huge amount of
company profit in such area as payroll, training and development of employee,
employee and labour relation activity and etc. Instead of regard money spent on
human resource activity as an expenses, it can be taken as investment in
employees’ current competencies and future skill so as the company can achieve
better in the future (Ahmad, etal., 2003). In order to have an effective human
resource management, company must have such function in well-establish and
interrelated manner. These functions include staffing, human resource
development, employee and labour relation, safety and health and compensation
(Mondy, 2008). The extent to which a company is able to success in an industry
depends on its ability to manage these interconnected activities or functions.
Services sector such as hotel industry largely relies on ability of its employee to
provide superior service to customer. The probability on which a customer will
stay in the same hotel for each trip depends on the quality of service provided by
employee of the hotel. The quality of service provided by employee is affected by
level of effort, motivation and desire of employee to provide superior service to
customers. In turn, the level of effort, motivation and employee’s desire is
affected by company’s policy as to whether those policies are motivating or
demotivating and employee-oriented or solely for company profit making
intention. This eventually led to human resource outcome such as employee’s

Organizational Performance
Page 3 of 184
turnover rate, level of job satisfaction and organizational commitment. That is the
reason why human resource practice of a company is crucial to its long term
survival and competitive position in an industry. In order to achieve this aim,
human resource department have to look into the basic need of the employee and
slowly move up the hierarchy of need as specified in Maslow’s hierarchy of need.
Hotel industry is encouraged to establish employee-oriented human resource
practice as it is proved to minimize cost of doing business and provide higher
profit when employee turnover is reduced (Tseng &Lee, 2009).
The most ideal human resource practice as well as practice that closely address to
the need of employee will help organization to achieve highest organizational
performance (Ahmad, et al., 2003). However, few companies really able to
achieve this goal as they fail to see synergy or unable to identify the suitable
bundles of human resource practice to help the company achieve predetermined
organizational performance goal. Problem arises when the “bundles” of human
resource practice adopted by company does not match employees’ needs. Various
1.1.1 Background of hotel industry in Malaysia
The services sector plays an important role in the economy of Malaysia. In
year 2010, services sector contributed 48.5 percent to Gross Domestic
Product (GDP) of Malaysia (Productivity report, 2011). In another word,
almost half of the GDP is contributed from services sector. Hotel industry
appears to be a promising business in this sector because of the existence
of tourism industry in Malaysia. This is because tourists are an important
customer group for hotel industry. Tourism industry in Malaysia
continuously achieves growth every year and provides a considerable
amount of national income to Malaysia government. Hotel industry is able
to gain profit from tourists by providing accommodation to them as they
travelling from place to place.
In year 2010, 24.6 million of tourists arrived in Malaysia and tourist
receipts contributed RM 56.5 billion for Malaysia (Tourism Malaysia,

Organizational Performance
Page 4 of 184
2011). Domestic tourists also contributed a significant amount of sales for
hotels in Malaysia. According to the Department of Statistics, domestic
tourists spend RM 6096 million for accommodation in 2010, achieving a
growth of 4.1 percent compare to expenditure in 2009 which is RM 4171
million. This is a good sign for hotel industry because the fortune of hotel
industry is closely tied to fortune of tourism industry.
The reason to why Malaysia has such a high visitation rate is that Malaysia
has many different cultures and heritage buildings that other countries do
not have. The population in Malaysia consists of Malay, Chinese, Indian
and some ethnic group (Tourism Malaysia, 2012). Each of the races has its
own unique cultures and believes. Apart from that, different races in
Malaysia celebrate different festivals which make Malaysia unique in the
eye of foreigners. These festivals include Hari Raya, Chinese New Year
and HariDeepavali. During the celebration of those event, each ethnic
group will wear their tradition costume and celebrate the event using their
according to their own belief. These are the events that make Malaysia
unique in the eye of foreigners.
Besides that, Ministry of Tourism Malaysia also organizes different type
of events in conjunction with festivals in Malaysia. For example, Ministry
of Tourism will organize an event to celebrate Thaipusam in Batu Caves,
Selangor (Tourism Malaysia, 2012). This event will be held on 7th
February 2012. This event allows different races in Malaysia as well as
tourists from other country to understand each other culture.
Furthermore, Ministry of Tourism will also organize Cuti-cuti Malaysia
and Year-End Sales (YES) every year (Malaysia Year-End Sales (M-YES):
Tourism Malaysia, 2012). Both of the events attract huge amount of
tourists to Malaysia. Through Cuti-cuti Malaysia, tourists are attracted to
such places as A Famosa, Melacca; Genting, Pahang and Georgetown,
Penang. All these places consist of heritage buildings and some other
entertainment that attract tourists to visit. Besides that, Year-End Sales that
held in fourth quarter of every year also attract either local or foreign

Organizational Performance
Page 5 of 184
tourists to go for shopping in various shopping center in Malaysia
(Malaysia Year-End Sales (M-YES): Tourism Malaysia, 2012).
One of the factors to allow these events to being carried out successfully is
that Malaysia has enough hotels to allow tourists from both local and
overseas to stay. Also, the quality of service provided should be
guaranteed to ensure tourists have a good experience when travelling in
Malaysia. In turn, a good service quality is depends on the extent to which
management of hotel treat its employees.
Hotels in Malaysia can be rated from one to five stars based on six criteria
that are qualitative and aesthetic requirement, common areas, bedroom
requirements, services, safety standards and hygiene and staff (Malaysian
Association of Hotels, 2011). Hotels will be assessed based on the above
criteria and they will be given a final score that determine star rating of
their hotels (Malaysian Association of Hotels, 2011). These ratings
provide information to domestic or foreign tourists and help them to
choose type of hotel that they wish to stay.
According to Department of Statistic Malaysia, the number of
establishments in hotel industry has reached 2362 in the year 2009,
achieve an increase of 8.2 percent compare to 2008. Among these
establishments, budget hotels occupy more than half of them which are
67.6 percent, followed by hotels and service departments with about 17.9
percent, 9.7 percent are chalets and the remaining are rest houses or guest
houses. About 165,245 of rooms are available in these establishments for
customers to stay in 2009.
Average occupancy rate is a measure that used to calculate the percentage
of rooms being occupied by customers in a certain period of time.
According to Malaysian Association of Hotels, occupancy rate is measured
quarterly and the report concerning occupancy rate of each State will be
released. This measure can also be regarded as an indicator to determine
performance of hotel industry. This is because only performing hotel and

Organizational Performance
Page 6 of 184
hotel that provide superior service to customers will have high occupancy
rate. This is then related to human resource practice adopted by those
hotels.
The gross output of hotel industry is recorded to have RM 9.0 billion in
2009 which is 2.0 percent more than 2008 (Department of Statistic, 2010).
There are a total of 104,645 employees working in hotel industry and
salaries amounted of RM 1793 million was given to employees in 2009
(Department of Statistic, 2010). These data shows that hotel industry plays
a significant role in Malaysia economy and directly contributes to
economy growth. If hotel industry is able to perform well, it can help to
secure job opportunity of employees working in this industry and ensure
steady growth of Malaysia economy.
The quality of service provided by employees is an important factor that
will affect organizational performance of hotel industry. Hotel industry
will be able to capture the huge profit arise from the growth of tourism by
offering superior service to satisfy the needs of their customer or tourists.
Customers are more likely to stay in the same hotel in their next visit if
they are satisfied with the service provided by the hotel.
The table below shows the number of hotels rated from one to five star in
Malaysia.
Table 1.1: Malaysia Hotel Star Rating
Peninsula Malaysia
Star
Rating
Total Number
of Hotels
5 4 3 2 1
PERLIS 0 1 1 0 2 4
KEDAH 9 10 18 13 9 59
P.PINANG 7 21 8 18 4 58

Organizational Performance
Page 7 of 184
PERAK 2 5 5 19 15 46
SELANGOR 10 15 12 13 17 67
N.SEMBILAN 0 7 6 6 5 24
MELAKA 1 12 18 21 13 65
JOHOR 3 5 16 19 17 70
PAHANG 3 14 22 21 11 71
KELANTAN 1 1 5 12 3 22
TERRENGGANU 3 5 8 16 4 36
TOTAL 39 96 119 168 100 522
SABAH/SARAWAK
SABAH 8 10 35 35 34 120
SARAWAK 7 11 23 13 12 66
TOTAL 15 21 56 48 46 186
FEDERAL
TERRITORY
K.LUMPUR 21 17 27 29 22 116
PUTRAJAYA 2 1 0 0 0 3
LABUAN 1 2 1 5 5 14
TOTAL 24 20 28 34 27 133
Adapted from: Malaysian Association of Hotels (MAH), 2011

Organizational Performance
Page 8 of 184
1.2 Problem Statement
Tourism industry contributes a large portion toward Malaysia economic growth.
Along with mass promotion activities to promote Malaysia tourism, the number of
tourists’ arrival in Malaysia increased over the years. Increasing number of
tourists’ arrival further stimulate the development of hotel industry in Malaysia.
So, high performance in hotel industry will help in advancing Malaysian economy.
In order to determine the major problems faced by hotel industry, we assess
criteria of organizational performance. In assessing performance of hotel industry,
criteria such as profit, annual occupancy rate and employee turnover rate can be
used.
Many researchers reveal that high turnover rate is one of the most challenging
problem faced by hostel industry (Hemdi, 2006; Hinkin&Tracey, 2000; Carbery,
Garavan, O’brien, & McDonnell, 2003). An excessive annual turnover rate of
about 60% is happened in all level of employee in hostel industry globally (Alan,
Radzi, Hemdi,&Otheman,(n.d.)). Even though Malaysia is having a rapid growth
and fabulous development in hotel industry, high turnover rate is still one of the
major obstacles for hotel to achieve better performance.
Human capital is essential to the success of hotel industry. As this is a service-
oriented industry, and the nature of hotel business is extremely people intensive.
Qualified employees are necessary to provide superior services toward their
customers. When the qualified employees decided to leave hotel industry, quality
of services provided will be affected. Therefore hotel industry should have
bundles of human resource practice to keep a sufficient labor pool. Employees’
turnover rate show a negative relationship with human resource practices, which
turnover rate increase as poor human resource practices are used by an
organization (Hemdi, 2006). When an organization having a well organized
human resource practices, its ability to retain qualified employees will be increase
accordingly, thus a lower employee turnover rate can be achieved.

Organizational Performance
Page 9 of 184
Besides that, as qualified employees decide to leave hotel industry, higher cost of
doing business will be incurred. When turnover rate is high, companies have to
spend more money on recruiting, selecting, hiring, and training new employees.
This additional cost will shrink the organization’ profit and hence affect the
organization financially.
In Malaysia, hotel industry provide a relatively low salary when compare with
other sector. An average salary of RM1, 084 per month is received by Malaysian
who works in hotels and restaurants industry. Whereas, Malaysian who works in
other sectors, they able to earn higher average salary. Malaysian who works in
financial services sector is able to earn RM 2,114 per month. Apart from that, for
employee who works in oil, gas and energy sector, an average salary of RM2, 621
is received (Economic Transformation Programme , 2010).
The pay in hotel industry is only half of those of financial services sector or oil,
gas, and energy sector. The living standard in Malaysia increase significantly over
years. Malaysian is demanding for jobs that are able to compensate them with
higher salary in order to cope with high living expenses nowadays. This indirectly
increase turnover rate of employee in this industry. Therefore, employees will
choose to work in another industry which able to provide a higher pays. This is the
reason why turnover rate in this industry remains high and have a negative
impacts on organizational performance of hotel industry.
Moderate occupancy rate is another common problem which often faced by hotel
industry in Malaysia. Rapid growth in Malaysia tourism industry has increased
arrival of tourists to Malaysia. However, the occupancy rate in hotel industry still
remains in a moderate level. According to the data from Tourism Malaysia 2011,
the occupancy rate in the year of 2008, 2009 and 2010 indicated that hotel
performances in Malaysia need certain improvements.

Organizational Performance
Page 10 of 184
Table 1.2: Malaysia Tourist Arrival Report in year 2008, 2009 and 2010
Year
Total Tourist Arrival
2008 22,052,488
2009 23,646,191
2010 24,577,196
Adapted from: Tourism Malaysia, 2010
The above table had recorded the amount of tourist arrived to Malaysia in year
2008, 2009 and 2010. In year 2008, the total tourist arrival is amounted to
22,052,488. Followed by, in year 2009, it increased to 23,646,191. The amount of
tourist visited Malaysia continues increased to 24,577,196 in year 2010. (Tourism
Malaysia, 2011)
Table 1.3: Average Occupancy Rate of Hotels in year 2008, 2009, 2010.
Year Total Occupancy Rate
2008 66.3
2009 60.9
2010 59.3
Adapted from: Tourism Malaysia, 2010
Hotel occupancy rate is the percentage of hotel rooms occupied by occupants
during a specific period of time. Bardi’s study showed (as cited in Razalli, 2008)
that the occupancy rate is measured by a formula, the number of room sold
divided by the number of rooms available, it can be a good instrument for
measures or evaluate hotel staff performances level in attracting guests to a
particular hotel.

Organizational Performance
Page 11 of 184
The percentage of occupancy rate in year 2008 is 66.3. In year 2009, the
percentage dropped to 60.9 and in year 2010 the percentage continually dropped
to 59.3. The total average occupancy in 2008, 2009 and 2010 was dropped
continuously (Tourism Malaysia, 2011).
Occupancy rate can also reflect customers’ satisfaction towards services provided
by the particular hotel. Higher occupancy rate indicates that hotel staff has
provided superior service to their customers and able to attract them to occupy
room provided in the hotel. The reduction in occupancy rate normally is caused by
low customer satisfaction towards services provided by the particular hotel. In fact,
services quality provided by a particular hotel is determined by its employees as
hotel industry is a service-oriented sector. In turn, performance of employee to
serve customer is affected by policies and practices that is being used to manage
them. If employees feel they are being focused by human resource department,
they will be motivated to provide better service to customers. Employee
motivation, one of the human resource outcomes, is factor that determines service
quality of a hotel. Eventually, employee motivation can be boosted by having
employee-oriented human resource practice.
In a nutshell, human resource practices enable the firms to strengthen their
attractiveness and hence increase their ability to attract, manage and retain more
qualified employees. For instance, a better compensation scheme with additional
benefits may affect employee’s perception toward his organization’s human
resource practices. Thus a positive outcome of organizational performance can be
achieved.
Compared to the amount of tourist arrival and hotel occupancy rate in 2008, 2009
and 2010, the results we get are contrary different. Suppose it may have a positive
relationship between the amount of tourist arrival and hotel occupancy rate,
however, from the given data, we found the percentage of tourist visit to Malaysia
keep on increasing while the occupancy rate of the hotels dropping gradually. As
opposed to this negative effect and a dominant gap arises in this situation had
shown that, a problem does exist.

Organizational Performance
Page 12 of 184
1.3 Research Objectives
1.3.1 General Objectives
1. To investigate factors that affects organizational performance in terms of
human resource perspectives.
2. To help company to improve its organizational performance.
3. To identify areas of human resource function that company need to pay
attention for in order to improve organizational performance.
1.3.1 Specific Objectives
1. To determine whether selective staffing is significantly related to
organizational performance.
2. To determine whether training and development is significantly related to
organizational performance.
3. To determine whether performance appraisal is significantly related to
organizational performance.
4. To determine whether compensation is significantly related to
organizational performance.
1.4 Research Question
1. What are the factors that affect organizational performance?
2. Is better management of human resource practice will lead to high
organizational performance?
3. Is there a positive relationship between human resource practice and
organizational performance?

Organizational Performance
Page 13 of 184
1.5 Hypotheses of the Study
H0: There is no significant relationship between selective staffing and
organizational performance.
H1: There is a significant relationship between selective staffing and
organizational performance.
H0: There is no significant relationship between training and development and
organizational performance.
H1: There is a significant relationship between training and development and
organizational performance.
H0: There is no significant relationship between performance appraisal and
organizational performance.
H1: There is a significant relationship between performance appraisal and
organizational performance
H0: There is no significant relationship between compensation and organizational
performance.
H1: There is a significant relationship between compensation and organizational
performance
H0: The four independent variables (selective staffing, training and development,
performance appraisal and compensation) do not have significant relationship
with organizational performance.
H1: The four independent variables (selective staffing, training and development,
performance appraisal and compensation) have significant relationship with
organizational performance.

Organizational Performance
Page 14 of 184
1.6 Significance of the study
The findings in this research will contribute to the field of human resource
management as better understanding would be gained on the relationship between
human resource practices and organizational performance especially in hotel
industry in Malaysia. This research will provide more insight on importance of
human resource practices in Malaysia as there is lack of sufficient empirical
research pertaining to human resource practices in Malaysia (Daud, 2006).
Application of the best bundle of human resource practices is one of an important
element for a successful organization because employee is the basic block of an
organization. Human resource practices are needed for effective planning and
managing the job design for employees. Training and development of skills that is
needed by the organization can also be arranged for employees with these
practices. Performance appraisal in human resource practice also ensures the need
and expectation of employees are overseen and satisfied. In short, human resource
practices are essential in managing employees and motivate them to achieve the
goal of organizations in hotel industry.
This research will enhance the performance of hotel industry which will indirectly
contribute to tourism industry in Malaysia. Good human resource practices will
help to manage each employee effectively in terms of closely address to the need
and expectation of employees. Once the needs and expectations of employees are
fulfilled, they will be more motivated and contribute more effort in effectively
perform their job. Employees with high motivation are an important factor in
providing superior service to customers. This is needed in hotel industry because
the service provided plays an important role in affecting the performance in this
industry. Thus the performance of hotel industry can be improved by increasing
employee performance through effective human resource practices.
The findings in this research will help managers in determining the best bundle of
human resource practices that will help hotels to formulate effective strategies for
these practices. We will also provide managers with a clearer vision on the link
between human resource practices and organizational performance. By applying

Organizational Performance
Page 15 of 184
these practices, complaints and errors related to the service provided to customers
will be decreased. Hotels will also experience lower turnover rate because
employees are motivated and their needs and expectations are satisfied. The
improvement of hotel revenue will also be seen along with the improvement of
organizational performance.
Tourism industry is the main contributor to GDP of Malaysia every year. Tourism
industry brings a considerable amount of revenue to hotel industry as when
tourists, whether domestic or foreign, travel from place to place, they need certain
place for them to rest and stay overnight. Hotel is the most suitable place for them.
So, tourists are important customer group to hotel industry. Thus, the quality of
service provided by hotel industry will affect satisfaction level of tourists. Hotel
industry can enhance its ability to capture sales from this group of customers by
offering good services to customers. Human resource practices will be a critical
tool for hotels to ensure the level of service quality provided by employees is at
optimum level.

Organizational Performance
Page 16 of 184
1.7 Chapter Layout
Chapter 1: Introduction
The introduction includes the background of research, problem
statement, research, problem statement, research question and research
objectives, followed by significant of the study.
Chapter 2: Literature Review
This chapter covers literature reviews that discuss and evaluate other
research studies in relation to current research topic. It serves as the
establishment to test the hypothesis.
Chapter 3: Research Method
In term of research setting, types of sample used, data collection, types
of measurement scales and methods of analysis, this chapter will
discuss on how the research was implemented.
Chapter 4: Research Result
This chapter presents the current research result and the patterns of the
result will be reported in table and chart form. There is no discuss of
the result included.
Chapter 5: Discussion and Conclusion
Overall, this chapter concludes the entire project which comprised
discussion and interpretation of the research results, identify the
limitation of the research and recommendation for future research.

Organizational Performance
Page 17 of 184
1.8 Conclusion
This chapter presents the background of the study, problem statement, research
question and objectives of the study. This chapter also explains the significant of
this study. Finally, the research layout is discussed in the last section of this
chapter.
The following chapter will cover the literature review to provide a better
understanding on the impact of bundle of human resource practices on
organizational performance. In addition, a proposed research framework will be
developed on the next chapter. The final section of next chapter will discuss about
the hypotheses that are formulated to be evaluated on this research.

Organizational Performance
Page 18 of 184
CHAPTER 2: LITERATURE REVIEW
2.0 Introduction
This chapter begins with review of literature that discusses all the independent
variables and dependent variable. Next, this chapter is continued with review of
relevant theoretical framework. Then, the next section is our proposed theoretical
or conceptual framework. This chapter is then continued with hypotheses
development. Finally, a conclusion of chapter two is discussed.
2.1 Review of Literature
2.1.1Organizational Performance
According to Tseng et al. (2009), there are many factors that can be used
to assess organizational performance. However, we only include turnover
rate, corporate financial performance and employee performance to
measure organizational performance (Tseng et al., 2009). These factors are
important as any changes in these factors will cause company profit to
drop and affect company performance. According to Razalli (2008),
occupancy rate can also be used to measure organizational performance.
As mentioned in previous chapter, occupancy rate is the ratio of hotel
rooms occupied by tourist or customers during a specific period of time.
This variable is important occupancy rate indirectly signals revenue level
of organization.

Organizational Performance
Page 19 of 184
2.1.1.1 Corporate Financial Performance
Organizational performance can be evaluated based on corporate financial
performance. Based on empirical studies made by pervious researchers, a
company can measure its financial performance through market measures
or accounting measures (Alexander & Buchholz, 1978; Cochran & Wood
1984; McGuire,Sundgren, Schneeweis, 1988). According to Hillman and
Keim (as cited in Tsoutsoura, 2004), the market and accounting measure
represent different perspectives of how to measure a firm’s financial
performance.
Accounting measures focus on historical data, it is often ruled by intuition
and past experience (Rizal, 2008). There are many indicators can be used
by hotel in order to measure its financial performance. Examples of the
financial indicators are operating profit margin (OPM), return on asset
(ROA), return on equity (ROE).
Operating profit margin is used to measure profit per unit (dollar) of
product produce. OPM is an essential determinant to improve corporate
financial performance of a company. Increase in OPM will impact
organization ROA and hence result in a better financial performance. ROA
is a measure for evaluate the overall efficiency with which hotel assets are
used to generate profit. Debt is an important part of the capital structure of
many businesses. ROE can use to assess how the debts perform in the
capital structure of an organization.
However, there are some biases in accounting measures. Accounting
measures focus on historical data and only tell about past performance of a
company. Accounting measures are lagging indicators. It cannot be used to
predict future performance of an organization (Denton & White, 2000).
Market measures can be a leading indicator. As oppose to accounting
measures, market measures are more forward looking. In another word, it
more focus on current and future financial performance of a company.
Based on McGuire, Sundren, &Schneeweis(as cited in Tsoutsoura, 2004),

Organizational Performance
Page 20 of 184
market measures are indicator which represents the evaluation of investors
of the ability of a firm to generate more profit. There will be less
accounting procedures. Price-Earnings Ratio (P/E) and Price to Book
Value (P/BV) are two common market measures use to measure corporate
financial performance. Both of the ratios are used to estimate share price
of a company (Gitman, 2006). P/E ratio is measured by market price per
share with current earnings per share (Gitman, 2006).P/E ratio is usually
be used to calculate share price of a company. If a company has high
ability to earn high profit, it will push up share price of the company and
vice versa. On the other hand, P/BV ratio is calculated by dividing market
price per share with book value per share (Gitman,2006).
2.1.1.2 Occupancy Rate
Hotel industry is one of the service industries which emphasis more on
human value. Nature of business in hotel industry focuses on service,
human skills and intangible assets. The ability of hotel staff in attracting
customer to their hotel can be measure by occupancy rate. Occupancy rate
is one of the important measurements to assess how successful is the hotels
to sell their primary product.
Occupancy rate is a measurement to measure the effectiveness of hotel in
its external and internal marketing effort. These marketing efforts can be in
term of radio and television advertisement, advertisements on printed
media such as newspapers and magazines, billboard displays and the forth.
Marketing effort is effective when hotel able to achieve higher occupancy
rate (Bardi, 2003).
Occupancy rate can be calculated by the number of room sold divided by
the number of rooms available (Bardi, 2003).

Organizational Performance
Page 21 of 184
The formula is:
Occupancy Rate = Total rooms sold in a period x 100
Occupancy rate is a tool used by investors to determine the potential gross
income of a hotel. Occupancy rates, average daily rate, yield percentage,
and revenue per available room (RevPAR) are common sales indicators
used by investors to estimate a profitability of a hotel. Under a level of
occupancy, average daily rate, anticipated yield and potential gross income
of a hotel is the amount of sales that a hotel might obtain.
The average daily rate is another sales indicator used in projecting hotel
guest room revenues. It can be measured by total room revenue divided by
number of rooms sold. Yield percentage measure the effectiveness of a
hotel at selling its rooms. Yield percentage is high when hotel able to sell
its rooms at the highest rate available to the most profitable customers.
RevPAR measured the profitability of each guest room in a hotel. It can be
determined by dividing room revenue obtained in a period by the number
of rooms available in the hotel for that period. There are two formulas used
for calculating RevPAR :
Formula:
RevPAR= Room Revenue
Or
Hotel Occupancy Rate x Average Daily Rate
These sales indicators not only represent financial performance of a hotel
but reveal how successful the hotel staff in attracting more customers to
occupied a room in their hotel. Hence, it is one of the importance
measurements to measure organizational performance in hotel industry.
Total number of available rooms
Number of Available Rooms

Organizational Performance
Page 22 of 184
2.1.1.3 Employee Performance
Employee performance is also a dimension in measuring organizational
performance (Mindtools, 2011). The performance of employee is an
important dimension for organizational performance because good
employee performance is the foundation for a successful organization.
A good employee performance is always linked with whether an
organization is able to achieve established objective and goal. The
implementation of Key Performance Indicator (KPI) can be useful in
linking both employee performance and organizational goal. The function
of KPI is to identify the progression of an organization towards achieving
its objectives and goals (Public Record Office Victoria, 2010). Details
obtained from KPI can be used as comparison to ensure the job and task of
employee is compatible with the vision and mission of the organization. It
will be meaningless if the job and task performed by employee does not
match with the expectation of organization (Mindtools, 2011).
There are two types of indicators for KPI which are direct and indirect
indicators (Public Record Office Victoria, 2010). Direct indicator
describes whether employee can achieve his task and objective given to
him. The result of direct indicator is in quantitative form thus easy to be
measured. Indirect indicator shows how well an employee can perform his
task. The efficiency of employee in performing his task is not in
quantitative form thus will be difficult to be measured.
Performance appraisal is also an effective tool in evaluating employee
performance because it is an ongoing process to assist and evaluate the
work performance of employee. Information of employee obtained from
KPI can be used in performance appraisal for evaluation to be done.
Performance appraisal will allow employee to know his performance
within the organization through feedback from appraisal. Different
organization will have different preference in selecting appraisal method
for performance appraisal. 360-degree feedback evaluation method, rating

Organizational Performance
Page 23 of 184
scale method, and ranking method are example of appraisal methods used
in organization.
2.1.1.4 Turnover rate
Turnover rate is an important indicator for organizational performance.
Turnover rate can be identified by calculating the percentage of number of
employee leaving compare with average of employee in an organization.
According to Gustafson (2002), turnover can be referred a measurement
on the relationship between employee and organization when employee
leave the organization.
Turnover rate is interrelated with organizational performance as turnover
will incur direct and indirect cost to the organization (Ton &Huckman,
2007). The departure of employee especially worker with long working
experience or with specific skill which are needed by the organization will
incur huge losses to the organization. Experienced worker with tacit
knowledge is important asset to organization. Thus, high turnover rate,
especially experienced employee, will have a major influence for
organizational performance. Besides that, the remaining workers will need
to fill up work task of previous worker and they will become overburden.
The lack of expertise or experience of new hired worker will not be able to
handle task done by previous worker. It will take a few years for new
workers to gain sufficient experience and obtained tacit knowledge on
their tasks and responsibilities. Thus, organization with high turnover rate
will suffer lower performance as various costs are incurred due to turnover
of employees.
Turnover can be divided into two major categories, which are voluntary
turnover and involuntary turnover (Heneman& Judge, 2009). Voluntary
turnover is employee initiated while involuntary turnover is organization
initiated. Voluntary turnover can be divided into avoidable turnover and
unavoidable turnover (Henemanet al., 2009). Avoidable turnover refers to

Organizational Performance
Page 24 of 184
the turnover of employee can be prevented if organization take action such
as increase salary. On the other hand, unavoidable turnover are turnover of
employee that cannot be prevented such as employee need to leave his
country. Involuntary turnover can also divided into discharge turnover and
downsizing turnover (Henemanet al., 2009). Discharge turnover only
targets on individual while downsizing turnover targets on a group of
employees. Organization will consider the severity on the action of
employee to determine whether to discharge the employee. Downsizing
turnover occurs when there is a situation of overstaffing in organization.
Overstaffing usually happens when economic crisis strikes or organization
faces financial problem, organization will need to discharge employees to
reduce cost and sustain daily operation.
Griffeth et al. propose that dissatisfaction on current job, lack of
commitment to the organization, intention to leave and comparison of
other alternatives are drivers for employee turnover (as cited in Gberevbie,
2010). Researchers also examined that dissatisfaction can also arise when
high performers are not rewarded with the compensation they desired.
However, Gberevbie (2010) conclude that difference on rewards given to
employees can motivate or de-motivate employees on remaining in their
current job. Difference in reward does not necessary lead to employee
turnover in an organization.
There are also researchers who stated that turnover does not necessary be
negative for an organization. Ton &Huckman (2008) proposed that
turnover should be viewed as a contingent phenomenon, not as monolithic
concept.However Ton et al.agrees that negative effect of turnover will
overpower the positive effect of turnover on operational performance.
Osterman proposed that turnover should be seen in what condition it will
be beneficial or harmful to an organization (as cited in Ton et al., 2008).

Organizational Performance
Page 25 of 184
2.1.2 Human Resource Practices
Stroey, Sisson, Guest and Legge proposed that Human Resource
Management (HRM) has received great attention from various researchers
(as cited in Alleyne et al. 2006). It is commonly known that human
resource practices are able to increase organizational performance (Cho,
2004; Chand, 2010; Moideenkutty, Al-Lamki& Rama Murthy, 2010;
Osman, Ho &Galang, 2011; Sohail, Tanveer & Muneer, 2011; Zhai& Liu,
2011). However, few researches really look into human resource practices
employed by service sector or particularly hotel industry. Human resource
practices in hotel industry are important because this industry relies
heavily on labour work to complete tasks (Wang, 2005; Chand, 2007).
Therefore, a well-planned human resource policy is able to help the
organization to produce efficient and effective manpower and thus
increase organizational performance as a whole (Cho, 2004).
In assessing human resource practice in the organization, two main
viewpoints proposed by researcher, that is best-practice model and best-fit
model (Alleyne et al., 2006). Boxall and Purcell proposed that (as cited in
Alleyne et al., 2006) best-practice model can be used to increase
performance of an organization by implementing best practice of
managing human resource. Pfeffer (1998) has come out with a list of
human resource management practice that enables organization to improve
its organizational performance. These practices are:
1) Employment security
2) Selective hiring
3) Self-managed team
4) High pay contingent to organizational performance
5) Extensive training
6) Reduce status differences within the organization
7) Extensive sharing of information throughout the organization.

Organizational Performance
Page 26 of 184
These practices are deemed to improve organizational performance.
However, viewpoint from best-fit model disagree with best-practice model.
Best-fit model is divided into internal fit and external fits. This model
proposed that effective and efficient human resource policies should able
to match into internal and external environment of an organization
(Alleyne et al., 2006).
Wiley and Brooks proposed that (as cited in Chand, 2010) human resource
policy employed by an organization is very important as organizational
performance can be improved if satisfied and inspired employee produces
satisfied customer. This in turn increases the repurchase decision made by
the satisfied customer. Hence, profitability and performance of an
organization can be increased.
2.1.3 Selective Hiring
Talents or human capital are essential for an organization to achieve
superior outcome when compare with other companies. Selective hiring
had become one of the human resource best practices which can generate
positive outcome for organization performance (Delaney &Huselid, 1996;
Pfeffer, 1998). In order to enhance employee skills in companies, Delaney
(1996) suggest that companies can put in effort in improving quality of the
individual hired, companies will able to hire potential employees via
sophisticated selection procedures.
Other than best-practice model, selective hiring was one of the important
components in the human resource best-fit model (Alleyne et al., 2006).
Alleyne (2006) propose that companies should link their selection
practices of hiring with their appraisal and reward system. Internal fit will
achieve as criteria for hiring new employee match with criteria for assess
and reward these new hired employee.

Organizational Performance
Page 27 of 184
Research from Vlachos (2009) have proven that selective hiring contribute
to better organizational performance and able to lead the organization to
grow. Evidence from food companies in Greece showed manager able to
boost their organizational performance and firm growth through hiring
selectively.
Bataineh (2011) have highlighted why hiring selectively are important.
Bataineh suggest that each employee performance will hinge with their
subordinates performance, any hired staff that have not possess the right
skill or abilities will not perform in their job and hence the team will suffer
with poor performance. Hiring selectively also help to reduce company
cost, effective screening enable company to maintain a minimum cost in
their hiring process.
Selective hiring contributes to better organization performance. Hiring
selectively is a practice which generates more profit for the company. Paul
and Anantharaman proposed that (as cited in Vlachos, 2009) hiring
selectively guarantees hired employees possess the right qualifications,
which can help to increase organizational economic performance. Hiring
selectively allow companies to hire employee with desired skills and
behaviorswhich match with the job context (Werbel and DeMarie, 2005).
Pfeffer (1998) had proposed several ways on selective hiring to build a
high performing organization. These main ways included having large
number of applicants per opening, screen applicants for cultural fit and
attitude but not for skills which can be readily trained through training and
development program, clear about most critical skills, behaviors, or
attitudes which are crucial for better performance, using several rounds of
screening to show that hiring process is being taken very seriously by
organizations, senior management should be involve in hiring process to
show the importance of this selective hiring process and close the loop by
assessing the results and performance of the recruiting process.

Organizational Performance
Page 28 of 184
Williams (2006) suggest a “good people strategy”whichallows employee
in a supervisory position to understand overall relationship among
company and employees. Hiring standard is one of key components of
good people strategy. Companies can hire individuals based on the hiring
standard. Delaney (1996) also proposed the selectivity in hiring process
are important and able to lead to positive organization performance.
Pre-employment tests can be used to effectively reduce the turnover rate
(Cho, Woods, Jang, and Erdem 2006). Pre-employment tests are one of the
key components of selective hiring. Cho et al. (2006) proposed that by
passing the pre-employment tests, applicants may have a stronger sense of
belonging toward the company, hence will motivate these applicants.
Applicants who pass pre-employment test are more likely to contribute to
the companies. Besides, by comparing with employees who are hired
without pre-employment tests, employees who pass pre-employment tests
showing a lower turnover rate which they are less likely to leave
companies.
2.1.4 Training and Development
Training and development is needed by every organization in the world.
This is partly because training and development improve organizational
efficiency and effectiveness and partly because training improves
knowledge, skills, ability and others (KSAOs) of employees (Cho, 2004;
Ghafoor Khan, Ahmad Khan, Aslam Khan, 2011). Competitive business
environment future escalates the need that management of organization to
implement training and development in the organization. It is important to
have employees which are properly trained as well as motivated in labour
intensive industry, service industry (Wang, 2005).
Many researchers have different definitions on training and development.
Tabassi and Abu Bakar (2009) proposed that a process of cultivating job-
related knowledge and skill in order to increase performance of firm is

Organizational Performance
Page 29 of 184
known as training and development. On the other hand, training and
development is defined by Swanson (1995) as complicated process of
improving job-related knowledge of employee working in the organization
in order to increase organizational performance. Training is defined by
Bataineh and Ahmad (2011) as transfer of knowledge, skills and
competencies through training course that related specific job skills or
knowledge.
According to Batanieh (2011), training can be divided into on-the-job
training and off-the-job training. On-the-job training provides training to
employee during office hours whereas off-the-job training provides
training to employee by putting them away from their workplace.
Common types of on-the-job training are job rotation and understudy
assignment. On the other hand, organization can organization classroom
lectures, films and simulation exercise as off-the-job training program for
employees (Tabassi et al, 2009). All these training programs improve
employees’ skill and subsequently increase their ability to contribute to
organizational performance.
Doyle proposed that (as cited in Vlachos, 2008) training and development
is able to improve organizational performance in variety of ways. One of
the ways is employees’ skill is able to improve through attending training
and development program. This indirectly increases employee productivity,
job satisfaction and at the end reduces the number of employee who
resigned from the organization. These three events increase profitability
and reduce unnecessary expenses incurred by the organization. Besides
that, training and development will result in internal recruitment to fill up
vacancy in top management. Training and development improves skill and
knowledge of existing employee and prepares them for future challenges.
Once employees are trained, they have the ability to be promoted to higher
position. This reduces the possibility of human resource department to
carry out external recruitment to hire talent from outside of the
organization. Cost incurred and time consumed in external recruitment

Organizational Performance
Page 30 of 184
affect organization financially. Besides that, internal recruitment policy is
able to motivate employee to put in more effort into their work. This
indirectly increases employee productivity as well as organizational
performance. The same model of promoting employees is also being used
in ALPHA, a gas processing company situated in Malaysia (A.K., 2010).
Moreover, training and development also help employees to plan their
career path. Training motivates employee to take up more responsibilities
in order to develop themselves. This will eventually beneficial to the
employee as skills are learned.
Although training and development has a significant relationship with
organizational performance, effective implementation of training and
development in the organization is still in doubt (Sohail et al., 2011;
Tabassi et al., 2009; Wang, 2005; Ghafoor Khan et al., 2011; Osman et al.,
2011; Vlachos, 2008; Zhai et al., 2010; Bataineh et al., 2011). Employees
are human capital of organization. Investment in human capital increases
the ability of employee in performing their task. In another word, trained
employee can help organization to capture more sales, perform tasks with
less resource and bring more revenues to the organization (Ghafoor et al.,
2011). Even though training costs a lot to the organization, however,
organization that provides training courses are the final user of training
outcome.
Research from Sohail et al. shows that training and development variable
is an important variable in service sector. This is because service industry
is an industry that consumes significant manpower. The author also
proposed that provide training courses to employee to improve their
current jobs is as important as provide development courses to ensure
employees able survive in the fluctuating business environment. The
author notes that developing employee is as important as providing
training to employees.
According to Royalty (1996), organization that provides training to
employees will have lower turnover rate. In another word, the more the

Organizational Performance
Page 31 of 184
training courses provided in the organization, the lower the turnover rate.
Turnover that happens in the organization is actually cost to the
organization. The cost comes from recruitment process, orientation
program and training provided to employees once they enter the
organization. So, organization that provide training program to employee
is able to increase organizational performance by lower down unnecessary
expenses.
A research is done with luxury hotel in China and the result shows that
providing training and development course to employees is becoming
critical issue to manager of hotel in China. Specifically, eight hotels
allocate most of the time to train employee who are working in frontline.
On the other hand, some hotels also provide training in term of
management development and organizational culture (Wang, 2005). This
research shows that the significance of training and development programs
in contributing to organizational growth as well as organizational
performance.
According to a research done in banking sector, implementation of
comprehensive training and development program is able to help the
organization to increase its organizational performance. The researchers
also proposed that employees need to be trained in order to improve
current job knowledge as well as enable themselves to meet future
challenges by undergoing development program (Nayyab, Hamid,
Naseer&Iqbal, 2011). Many companies are now focusing on the
significance of training and development in order to sustain competitive
edges and improve skills, knowledge, abilities and others of employees
(Cho, 2004).
We understand training and development is important to an organization.
However, the need that organization required training program in the
organization is depends on assessment of training needs. Training need
assessment is being defined as the process of identifying whether the
organization required training program and seek to determine that whether

Organizational Performance
Page 32 of 184
the implementation of training program can help the organization to
achieve its needs, objectives or solve problems (Arthur & Bennett. 2003).
Once training need is identified, training program will be implemented. At
the end of training program, evaluation of the effectiveness of the training
program is required to determine whether training improves organization
or help to solve problems faced by the organization (Cho, 2004).
2.1.5 Performance Appraisal
Performance appraisal (PA) is one of the important human resource
functions of an organization (Sudarsan, 2009). This topic receives
significant attention from various researchers in term of identifying ideal
performance appraisal process, evaluating performance appraisal process
as well as how performance appraisal contribute to organizational
performance (Kondrasuk, 2011; Williams and Hummert, 1990; Sudin,
2004). All these researches foster researcher to provide evidence on
association between human resource practices (performance appraisal) and
organizational performance (Sudin, 2004).
Researchers have defined performance appraisal in different ways.
Billikopf (2010) proposed that performance appraisal is a technique that
enables supervisor to provide comment to its subordinate regarding their
performance over a specific period of time. On the other hand, Kondrasuk
(2011) proposed performance appraisal system is a process of establishing
performance standard, providing feedback to subordinate as well as
utilizing information of performance appraisal to benefit every
organizational member. Apart from that, Mathis and Jackson proposed that
(as cited in Cho, 2004) performance appraisal is a process to determine to
what extend an employee performs as compare to target established and
create a channel to provide the appraisal information to the particular
employee.

Organizational Performance
Page 33 of 184
There are two important purposes that organization perform performance
appraisal in the organization, that is, developmental and administrative
purpose (Kondrasuk, Crowell, Dillon, Kilzer&Teeley, 2008).
Developmental purpose helps employees to determine their performance
as well as provide guideline to improve their job performance after
reviewed their past performance. On the other hand, administrative
purpose provides information to human resource manager to determine
suitable compensation package for the employee in the next evaluation
period and provides information on necessary training program to help
improve job performance of employee. These purposes ensure employee
performance is in the right direction to achieve organizational goal which
in turn helps organization to perform better.
Organization can make use of performance appraisal process to improve
its organizational performance. This is because goal established during
performance appraisal will motivate employee to put in more effort to
achieve expectation. If employee has any weakness or potential to growth,
training and development program will be used to reinforce the particular
employee. This process can only be identified through performance
appraisal process. On the other hand, excellent achievement is being
rewarded using compensation policy of the organization. In short, human
resource practices are actually interrelated. The extent to which
organization can link relationship between human resource practices will
determine how well an organization performs. As proposed by Armstrong-
Stassen and Cameron (as cited in Selden & Sowa, 2011) organization that
focuses on performance is able to boost employee satisfaction and morale
and reduce the amount of employee who resigned from the organization
(Selden et al., 2011). Increased morale and satisfaction is able to increase
employee productivity and thus improve organizational performance. On
the other hand, reduced employee turnover enable the organization to
lower down unnecessary expenses incurred in managing staff.

Organizational Performance
Page 34 of 184
In fact, performance appraisal process is being disliked by many
employees as communication breakdown always occurred between
supervisor and employees (Kondrasuk, 2011). This communication
breakdown comes from appraiser is not willing to provide comment on the
performance of subordinate or subordinates are not dare to voice out their
opinion regarding target to be achieved in the future. However, effective
implementation of performance appraisal process can be source of
competitive advantages. Specifically, effective implementation of
organizational function such as performance appraisal is difficult to imitate
by competitor (Sudin, 2004). This is then enables organization to perform
better than its competitors and thus increase organizational performance.
Employees dislike performance appraisal is due to subjectivity exist in
performance appraisal process. The author also proposed a list of method
in order to improve performance appraisal process. These methods are
improves the objectivity of performance appraisal system, include opinion
from various sources, increases the frequency of reviewing performance,
establishes a good communication channel between supervisor and
employees and more representative performance standard and provides
training to appraiser (Sudarsan, 2009).
The relationship between performance appraisal and organizational
performance is also supported by other researcher. Nayyab et al. proposed
that (as cited in Lam &Micheal, Yih) individual and organization will
benefit from performance appraisal process. This process will develop
individual employee and influence organizational performance.

Organizational Performance
Page 35 of 184
2.1.6 Compensation
Compensation policy is an essential element among human resource
practices. A good compensation policy enables organization to have better
employee recruitment, retention, satisfaction, and others. Effective
compensation policies in a company create high commitment among
employees (Mess, 2004). Companies can link its compensation policy with
the performance appraisal, training and development, hiring. Organization
able to achieve a better organizational performance by integrating these
human resources practices.
Mondy (2008) defined compensation as “the total of all rewards provided
employees in return for their services”. A total compensation policy
comprises of three key components which are direct financial
compensation, indirect financial compensation, and also non-financial
compensation. Different terms such as “total pay”, “compensation
package”, “direct and indirect compensation” were used in many research
done previously (Milkovich& Newman, 2008; Namasivayam, Miao, &
Zhao, 2006; Zingheim and Schuster, 2008).
Sturman (2006) have stated both amount of the reward and “how” the
money is paid will giving influence future performance of employees in
company. Potential employees will first consider on compensation when
they are looking for employment. Individuals perceive compensation not
only how they are paid, but also how they are valued by companies.
Important of compensation system are important especially in service
industries (Namasivayam et al., 2006). Well designed compensation
systems strategically enhance organizational performance as it able to
attract and retain more talents in companies.
Direct financial compensation includes pay and financial incentives. When
employees perform their works, they will receive a pay from employment
(Kline & Hsieh, 2007). Financial incentives are variable pay given to
employees, it can be given in term of bonuses, profit sharing, team–based

Organizational Performance
Page 36 of 184
pay, and others. Sturman (2006) suggest that base pay is a critical
component of total compensation, and many employers using high pay
levels to attract, retain and motivate their employees.
Indirect financial compensation includes a wide variety of reward
whichreceives indirectly by the employee. These benefits including health
insurance, retirement programs, paid leave, flexible working schedules and
many more which may be legally required or organization provide
voluntarily. Research by Torres & Adler (2011) has proven that health
insurance is one of the most important benefits as it able to secure assets of
each individual employee.
Nonfinancial compensation is often neglected by organizations historically.
This form of compensation including any benefit an employee receives for
job or employer that does not involve tangible value. Chen & Choi
proposed that (as cited in Phonsanam, 2010) generational difference occur
among Baby Boomers, generation X, and Millennials. Each generation
possess different work value. Companies have to include different non-
financial compensation in employee total compensation plan to motivate
employees.
There are four policy choices to be considered to develop an optimal
compensation strategy, which includes internal alignment, external
competitiveness, employee contributions, and the management of the pay
system (Milkovich et al., 2008). Many companies develop their
compensation policies based on these policy choices. Oak Ridge National
Laboratory (ORNL) and BJC HealthCare able to develop a competitive
compensation plan which help to attract and retain qualified and skilled
employees.

Organizational Performance
Page 37 of 184
2.2 Review of Relevant Theoretical Models
2.2.1 Model 1: Comparing appropriate decision support of human resource practices on organizational
performance with DEA/AHP model
Figure 2.1: Ya-Fen Tseng and Tzai-Zang Lee (2009) Conceptual Model
Adapted from: Tseng, Y. F., & Lee, T. Z. (2009).Comparing appropriate
decision support of human resource practices on
organizational performance with DEA/AHP model.Expert
Systems with Application.36. doi:
10.1016/j.eswa.2008.07.066
Organizational Performance Human Resource Practices
Turnover
Productivity
Corporate financial performance
Perceived market performance
Employee performance
Innovation
Employee relations
Motivation
Participation
Training
Hiring
Compensation
Organizational Category
Development culture
Common culture
Stratum culture
Rational culture

Organizational Performance
Page 38 of 184
The main purpose of this study is to determine the effect of human
resource practices on organizational performance with Taiwanese
electronic companies and branches in China according to each culture type.
This study also reveals the significance of organizational performance
based on understanding of a suitable bundle of human resource practices.
Besides that, this research also allows manager or management of
company employed appropriate human resources practices after identify its
organizational culture. This is because difference organizational cultures
have difference influences on organizational performance.
Based on the above diagram, human resource practices included in this
study are motivation, participation, training, hiring and compensation. On
the other hand, dependent variable of the study is organizational
performance. The measures that the author used in measuring
organizational performance includes turnover, productivity, corporate
financial performance, perceived market performance, employee
performance, innovation and employee relations. Apart from independent
variables and dependent variable, the author identifies four major types of
organizational culture, that is, development culture, common culture,
stratum culture and rational culture.
The study discloses that employee’s participation and employee’s relation
are important in stratum, rational, development and common culture
regardless of some small discrepancy. Besides that, the researchers also
proposed that employees’ participation have to be given attention in all
type of organizational culture.
In term of common culture, organizational innovation always receives
more attention by manager than any other type of culture. Besides that,
manager also regards employee’s relation, organizational innovation and
corporate financial performance of organizational performance as being
important. Manager of stratum culture pays more attention to employee’s
relations than any other type of organizational category.

Organizational Performance
Page 39 of 184
In term of rational culture, employee’s relations, organizational innovation
and corporate financial performance of organizational performance as
being given focus by manager in Taiwan whereas employee’s relations
organizational innovation and employees’ turnover of organizational
performance is focused by manager in China. Manager from electronic
industry pay extra attention to employees’ participation and employees’
relations as appropriate decision.
The researchers also proposed that result of the study has a positive
relationship with involvement factor and negative relationship with
employees’ turnover in common cultures. The study also reveals that
branch manager focus more on the significance of employee motivation
and compensation whereas manager from Taiwan electronic industry pay
more attention to corporate financial performance and employee
performance. In term of stratum and rational culture, there is a positive
relationship with employees’ participation and negative relationship with
compensation of employee. In either Taiwanese electronic industry or
branches, influence of employee relations on organizational performance
is higher in stratum and rational than other type of organizational culture.
The limitation that the researchers face during the study is sample
collected consists of greater variance as the researcher collect data from
two sources only. This has result in lower rate of response and smaller
sample size. The researchers also proposed way to improve quality of
work to future research. These ways are collect financial and customer
information, internal process message, learning and growth of company
procedure and increase the understanding of human resource practices and
organization performance by strengthen information. Future researcher
also improves this study by incorporating Balanced Scorecard theory.
After we studied this journal, we are not taking all independent variables
from this journal to our study. The independent variables that we are not
adopting in our study are motivation and participation. We consider
motivation is not a human resource practice and it is a psychological result

Organizational Performance
Page 40 of 184
after those human resource practices are performed (Ayeni, 2007). In term
of participation, we judge that it is not suitable to use in our research
because of our research target. Hotels normally employ large number of
employees which include cleaner and chef. It is difficult for management
of hotels to include and involve opinion of all employees in decision
making.
As mentioned above, hiring is a process for employer to recruit employees
with the right potentials and capabilities. As a human resource practice,
hiring is not a complete process, it should combine with selection to
contribute to organizational performance, called selective hiring. Selective
hiring is a very important practice for every organization. An organization
advertises job vacancy in newspaper and selects the best suit applicant
through selective hiring and interview process. (Lopez, 2007)
Training and development is an essential element of every organization to
improve organizational performance. To preserve its market share and
increase competitive advantage, organization needs to be able to create
new knowledge and not only to rely on utilization of existing knowledge.
(Vemic, 2007) Besides that, training and development is necessary for
organizations to arouse potential of employees in order to increase
productivity. Therefore, training and development is adopted into our
study.
Compensation can be linked to business structure, employee recruitment,
retention, motivation, performance, feedback and satisfaction. (Fogleman,
2004) Compensation usually is the first consideration for potential
employees when they looking for jobs. (Fogleman, 2004) Moreover,
monetary compensation is used to attract potential employees whereas
non-monetary compensation typically is used to retain talents. Hence,
compensation is an important element in every organization and we
decided to put in compensation into our research as an independent
variable.

Organizational Performance
Page 41 of 184
2.2.2 Model 2: Strategic Human Resource Management and
Organizational Performance in Singapore
Figure 2.2: David Wan, Chin Huat Ong and Victor Kok (2002) Conceptual
Model
Source: Wan, D., Kok, V., & Ong, C. H. (2002). Strategic Human
Resource Management and Organizational Performance in Singapore.
Sage Publications
Selective staffing
Extensive training
Organizational
Performance
Empowerment
Performance appraisal
Broad job design
Performance-based pay

Organizational Performance
Page 42 of 184
The main purpose of this research is to determine the linkage between
strategic human resource management practices and organizational
performance in Singapore as well as understand the meaning of the result
gained for both managers and practitioners.
In order to carry out the research, the authors have included six different
independent variables. These variables are selective hiring, extensive
training, empowerment, performance evaluation, broad job design and
performance-based pay. However, broad job design is being excluded
from the study and replaced with team-based work.
Mail survey is being used in the study. The result of multiple regression
reveals that there is a positive relationship between bundle of strategic
human resource management practices with financial performance. Apart
from that, the result also shows that positive relationship exists between
human resource management variables with human resource performance.
In assessing the relationship with human resource performance based on
change in F, empowerment variable contribute the highest. This is
followed by training, selection and performance appraisal. The study also
reveals that there is tendency that different strategic human resource
management variables can have impact on different aspect of performance.
There are also limitations that researchers face in this study. One of them
is the sample size of the study is quite small. Besides that, the study does
not determine whether there is any relationship organizational value and
human resource management strategy and hence organizational
performance.
The researchers proposed that future study can be improved by having a
more comprehensive sample, putting human resource management system
as mediator variable in the study, collecting data from various sources and
considering longitudinal analysis.
From this journal, we are only adopting training and performance appraisal
into our research. As mentioned in previous journal, training is important
Organizational Performance
Page 43 of 184
element that drives organization towards higher level of achievement.
Performance appraisal is tied to reward and pay, placement and promotion,
and training and development. According to Christina Hamlett,
performance appraisal provides comparison with previous performance of
workers in term of skill sets, knowledge, initiative and participation. This
review will reflect whether an employee is prepared for a promotion.
Besides that, it helps employees to do better, raise self-esteem and
motivation. (Simpson, 2001)
For empowerment, there are several reasons wedo not include it as
independent variable in our research. One of reasons is that abuse of power
may happen when empowerment is practiced and therefore affect
employees’ morale. Furthermore, empowerment is a form of delegation
that authorizes lower level employee to perform task which his/her
superior are supposed to do. Problem arise when those employee do not
have enough knowledgeable or are not capable enough to make decision.
This will increase risk to an organization. Furthermore, information will be
shared due to empowerment is being practiced. So, chance of leakage of
critical information might happen. (Management Study Guide, n.d.)
In term of team-based work, we realize that cooperation in team may get
communication problem. Employees with poor interpersonal skill may
affect performance of team-based work and it is easily to
misunderstanding among members. Although performance of team is
greater than sum of individual work, failure in managing team-based
approach will bring significant cost to the organization. Team-based work
takes much more time to make a decision by having a lot of meetings.
(Berry, 2010) Furthermore, this practice values team performance rather
than individual performance. Thus, individual may consider personal
performance is not important. Therefore, team-based work is not taking
into our research. (Gray, 2009)

Organizational Performance
Page 44 of 184
Performance-based pay is a sub-process of compensation. It not
contributes in attracting candidate. As we have adopted compensation as
our independent variable, we are not adopting performance-based pay.

Organizational Performance
Page 45 of 184
2.2.3 Model 3: An investigation of the relationships between
compensation practices and firm performance in the
US hotel industry
Figure 2.3: Karthik Namasivayam, Li Miao and Xinyuan Zhao (2007)
Conceptual Model
Source: K. Namasivayam, Li, M., Zhao, X. Y. (2007). An investigation of
the relationships between compensation practices and firm performance in
the US hotel industry, 26, 574-587. Retrieved October 10, 2011 from
ScienceDirect Journal Database.
The main purpose of this study is to examine relationships between
compensation practices in hotel organizations and their performance.
Compensation is the only independent variable in this journal. On the other
hand, dependent variable is organizations performances. Apart from that,
this paper also examined and reported the relationship between human
resource management practices and hospitality more specifically on hotel
performances.
From the journal, it is discovered that the main factor that influence
organizational performances is compensation systems. The types of
Dependent Variable Independent Variable
Organizational
Performances
Compensation
- Direct compensation
- Indirect compensation

Organizational Performance
Page 46 of 184
compensation can be divided into direct compensation which comprises
base compensation and indirect compensation is in term of benefits.
Compensation systems can bedivided into three different perspectives
which comprise of role of benefits, role of pay system and mediation
effects in compensation. Role of benefits investigate the relationship
between level of benefits give to employees and organizational
performance. In terms of role of pay system, the relationship between level
of pay to employees and organizational performance is discussed. When it
put into the mediation of pay level, the relationship between benefits and
organizational performance will then evaluate differently by the mediation
effects in compensation.
Author was drawn a sample of 1223 hotels from the total amount of
49,209 US hotels to carry out this survey. Benefits, salary, organizational
performance indices and control variables are the four sets of measures
that included in this study. Regression analysis was employed in this
research to analyze result receive from respondents.
The results from regression analysis are as follow. For management
employees, the correlation between salary measures and organizational
performance was stronger. On the other hand, the correlation between
individual benefits and organizational performance was stronger for non-
management employees.
There is significant relationship in two formations: salary versus individual
benefits and individual benefits versus organizational performances for
both management and non-management perspectives. However, when
salary was introduced to mediate the relationship between individual
benefit and organizational performances, there are some variations occurs.
For management side, the effect of individual benefit on organizational
performance was not statistically significant. Meanwhile, for non-
management side, the effect of individual benefit on organizational
performance declined significantly.

Organizational Performance
Page 47 of 184
The limitation that the researchers face during the study is time constraints.
More time are required to test on the data. Other potential explanatory
variables are not included in the study.
We choose compensation as one of the independent variables in our study
because we assumed that compensation may have direct influences
towards organization performances. Armstrong’s study showed (as cited in
Idemobi, Onyeizugbe, Akpunonu, 2011) that the important part of human
resource management approach to improve the productivity in an
organization is compensation management. The implementation and
maintenance of compensation system will bring significant improvement
to organizational performance (Idemobi et al., 2011). As conclusion, one
of the important factors in human resource management practices is the
compensation because it will have a direct impact on whether employees
will put in more effort in job. In another words, Hewitt’s study showed (as
cited in Idemobi et al., 2011) that the compensation system built a
structure that implied employees who work harder will get higher pay than
the people who work moderately. In the same way, the compensation will
becomes a tool that able to influence employees’ behavior in order to
improve the organizational performances.

Organizational Performance
Page 48 of 184
2.2.4 Model 4: Competency-based human resource practices
in Malaysian public sector organizations
Figure 2.4: Ilhaamie Abdul Ghani Azmi (2010) Conceptual Model
Source: Ghani Azmi, I. A. (2010, February). Competency-based human
resource practices in Malaysian public sector organizations.
African Journal of Business Management, 4, 235-241. Retrieved
October 15, 2011 from
http://www.academicjournals.org/ajbm/pdf/pdf2010/Feb/Azmi.pdf
Due to the increasing complaint and unsatisfied with service quality of
Malaysian Public service, Malaysia government introduced competency-
based human resource practices at the end of year 2002. After
implementing this policy for five years, this research has been done to
determine to what extent this policy is being implemented in government
public service. The purpose of introducing competency-based human
resource practices is to increase level of service quality as well as help in
organizational change.
Competency-based Recruitment and Selection
Competency-based Training and Development
Organizational
Performances
Competency-based Career Development
Competency-based Performance Management
Competency-based Reward

Organizational Performance
Page 49 of 184
The author has included five of the six competency-based human resource
practices in the study. These included competency-based recruitment and
selection, competency-based training and development, competency-based
career development, competency-based performance management and
competency-based reward.
Main survey is being employed by the researcher to distribute
questionnaire to respondents. Sampling technique used in this research is
simple random technique. After data is collected, factor analysis is being
carried out. It is decided that training and development element is being
combined with rewards element to form a new element known as
organizational development. However, the rest on the independent
variables remain unchanged.
Through result generated from the research, it is discovered that
competency-based performance management, organizational development
and career development are being highly practiced in Malaysian Public
Service. On the hand, competency-based reward and recruitment and
selection are moderately practiced.
Apart from that, the researcher also proposed ways to help Malaysian
Public Service to improve their service quality. One of them is current and
future competencies of public sector employee can be increase by using
competency-based reward system. Besides that, the power of hiring new
employee should be given to each public organization. This is because
only the particular organization understands the kinds of employee and
competency that match their unique situation.
In fact, the content of this journal is quite match with our study. However,
there are some weakness in this journal that makes it cannot perfectly suit
in our study. One of the reasons is that this journal is carried out to
evaluate Malaysia public sector but the focus of our study is on private
sector. Despite both of them are service-based organizations, however,
there are still some differences lies between them. Other than that, this

Organizational Performance
Page 50 of 184
journal apply competency-based element into every independent variable.
This means that all the human resource practice involve competencies
element and it is not suitable in our study. Due to these reasons, this
research paper may not completely suit in our research situation. However,
this research paper does provide a lot of information in human resource
management and help us in understanding more about human resource
practice.
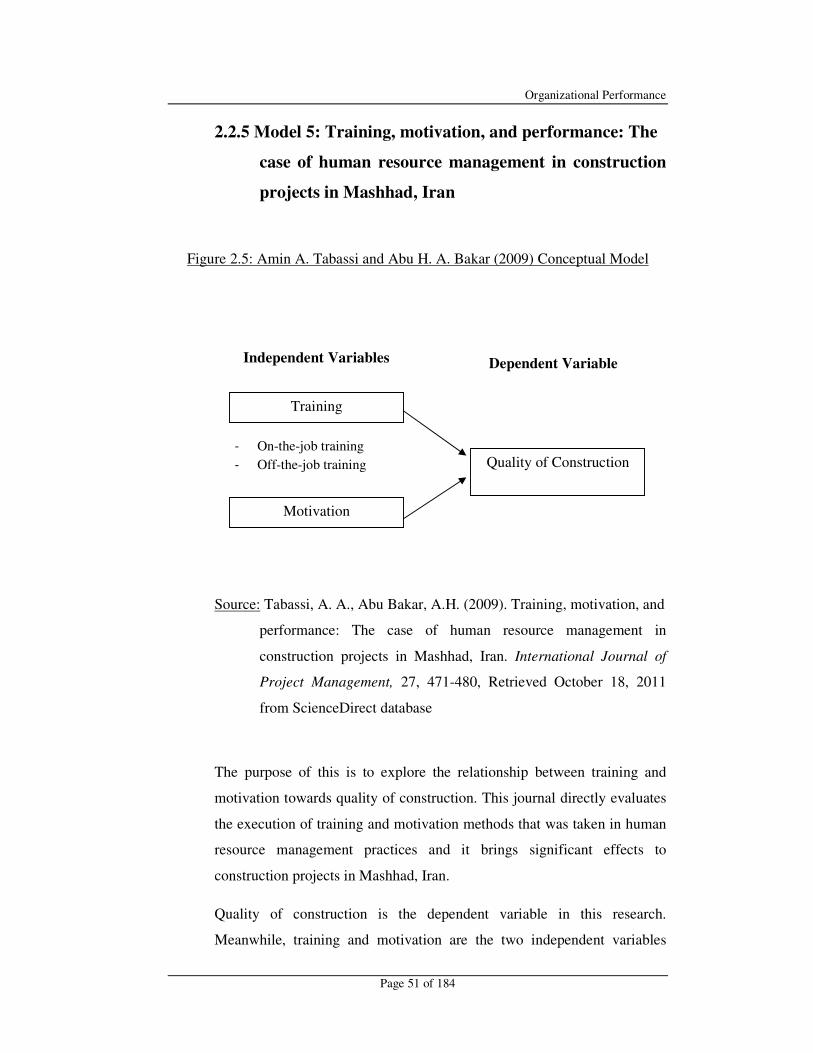
Organizational Performance
Page 51 of 184
2.2.5 Model 5: Training, motivation, and performance: The
case of human resource management in construction
projects in Mashhad, Iran
Figure 2.5: Amin A. Tabassi and Abu H. A. Bakar (2009) Conceptual Model
Source: Tabassi, A. A., Abu Bakar, A.H. (2009). Training, motivation, and
performance: The case of human resource management in
construction projects in Mashhad, Iran. International Journal of
Project Management, 27, 471-480, Retrieved October 18, 2011
from ScienceDirect database
The purpose of this is to explore the relationship between training and
motivation towards quality of construction. This journal directly evaluates
the execution of training and motivation methods that was taken in human
resource management practices and it brings significant effects to
construction projects in Mashhad, Iran.
Quality of construction is the dependent variable in this research.
Meanwhile, training and motivation are the two independent variables
Dependent Variable Independent Variables
Training
- On-the-job training
- Off-the-job training Quality of Construction
Motivation

Organizational Performance
Page 52 of 184
used in this research. Two training methods are explained in this study are
on-the-job training and off-the-job training. Employees have their training
at their workplace or involve in performing actual work is called on-the-
job training. Besides that, off-the-job training is a situation where
employees receive training courses away from their actual workplace.
In term of motivation perspective, the company is encouraged to find
proper ways to satisfy employee different needs. The needs can basically
divide into workers participation, recognition and team belonging.
To find out whether there is significant relationship between training and
motivation in increasing the quality of construction projects is the purpose
of this research. In order to carry out survey for this research, a
quantitative research approach was used to distribute questionnaires. The
target respondent of this study is employees who have direct managerial
experiences in the construction field. 120 sets of questionnaires were sent
through postal mail to groups of respondents and 52 sets of questionnaires
were returned. In this journal, the author applies descriptive analysis to
analyze data received from respondents. Apart from that, co-relational
study is the type of investigation used in this journal. Statistical Package
for the Social Sciences (SPSS) software was employed to analyze the
survey results.
The main problem that Mashhad faces are they lack of sufficient number
of talent in construction industry. Besides that, company in Mashhad also
faces barriers and problems in training staff and workers. Effective
training is another important factor despite create an influential working
environment to encourage innovative and personal commitment of
employees. Low levels of education, low income, and lack of motivation
and family struggles are the main problems faced by Iranian construction
workers.
The limitation of this study is that survey was only done with top grade
construction companies in the Mashhad. Researchers were not able to gain

Organizational Performance
Page 53 of 184
opinions from respondents in other countries. Besides, the questionnaires
was limited to managerial staff in construction companies, non-managerial
employees were not given the chance to express their opinion toward
training and motivation.
In this journal, we decide to use training as one of the independent
variables in our study. Training was chosen because it brings direct
significant impact to organizational performance. Employees’ work-
related knowledge or skills can be developed through training process.
Normally, a well-trained employee is able to perform better than the
employees who are not properly trained. In fact, training is about training
employee to acquire further knowledge in performing current task. In
order to ensure employee are fully equipped with skill and knowledge,
they also required to equipped themselves with skill and knowledge that
enable them to perform future task. Therefore, we will include the element
of development into the independent variable to form training and
development.
On the other hand, motivation mentioned in this journal is meant to fulfill
the need of employees in Maslow’s hierarchy of need. However, it does
not have a clear relationship that enable employee to put in more effort in
performing their work. Motivation can be a tool used by manager to drive
employees to put in more effort in their work (AdeyinkaTella, Ayeni,
Popoola, 2007). It can be done by fulfilling employees’ needs. However, it
does not have enough evidence to build a direct linkage to the
organizational performances. Moreover, Purcell and Lepak’s study showed
(as cited in Katou, 2008) that motivation is a kind of attitude inherited by
employees. Motivation can be aroused in employees themselves to
perform their skills and competencies by using different mechanisms (such
as compensation, promotion and incentives). After make use of some
motivation techniques, it will then bring some influences to the
organizational performances. Therefore, it cannot consider as an
independent variable that it does not bring a simple and direct linkage to

Organizational Performance
Page 54 of 184
organizational performances. As opposed to the purpose of our study, we
reject this variable from our study.
Apart from that, the dependent variable in this journal is quality of
construction. Although the dependent variable is not same as our study but
the independent variable in this research paper is still being adopted. This
is because good quality of construction also signals the extent to which an
organization performs. If the quality of construction is good, it means the
organization is performing well. On the other hand, companies that
produce low quality of construction means that company have some
deficiencies in their operation. In another word, those companies have low
organizational performance. For this reason, we adopt this research paper
despite their dependent variable is different with our study.

Organizational Performance
Page 55 of 184
2.3 Proposed Theoretical/Conceptual Framework
Source: Develop from research
Based on previous research and our understanding in the relationship between
human resource management and organizational performance, we have
constructed a theoretical framework for our research.
Through the study of previous research, we included selective hiring, training and
development, performance appraisal and compensation as independent variables
in our study. On the other hand, organizational performance is the dependent
variable in our research.
The main purpose of this research is to find out whether the above theoretical
framework has a significant relationship and subsequently help organization to
improve organizational performance through proper handling of human resource
practice.
Selective hiring
Training and Development
Performance Appraisal
Compensation
Organizational Performance
Independent Variables Dependent Variable

Organizational Performance
Page 56 of 184
2.4 Hypotheses Development
Based on our literature searching and review, we can come out with a framework
about the relationship between certain human resource management Practices and
organizational performances and we can continue our next step in which testing
the following hypothesis in our study.
2.4.1 Selective hiring and organizational performance
Hypotheses 1:
H1: There is a significant relationship between selective staffing and
organizational performance.
A study from Schuster shows (as cited in Vlachos, 2009) that the selective
hiring is a critical practice to contribute to profit of a company. Selecting
right peoples can help to reduce the costs of training as well as earn more
profits as the defect costs will be lower down. Besides that, study from
Huselid also showed (as cited in Vlachos, 2009) that high performing
organization normally employed selective hiring practices that enable them
to enhance employee productivity and at the same time increase the
organizational performance. Hence, turnover rate of employees will be
reduced.
Study from Cho, Jang, and Erdem showed (as cited in Vlachos, 2009) that
when adopting selective staffing, pre-employment test will be used as a
key component to screen and select peoples who are competent and also
highly committed to the organization. This can help to reduce organization
turnover rate as incompetent employee or employee who are not suitable
to the position offered will not be employed. Thus, subsequent resign will
not be happened. Pre-employment test also help to increase organization
efficiency.

Organizational Performance
Page 57 of 184
Many human resource management best practice author, including Pfeffer
and Veiga (1999), MacDuffie (1995) and Pfeffer (1995) stressed on
selective hiring with the intention of obtaining the right candidate with the
right qualification to fill up the right position (Mess, 2004).
2.4.2Training and development and organizational
performance
Hypotheses 2:
H1: There is a significant relationship between training and
development and organizational performance.
Swanson’s study shows (as cited in Tabassi & Abu Bakar, 2009) that
training and development has the purpose of improving performance
systematically through the process of developing employees’ work-related
skills and knowledge. This purpose had shown there is a linkage between
training and development and organizational performances. As employee’s
skill is being improved, they will have better ability to perform their task.
Nankervis, Compton and McCarthy’s study shows (as cited in
AzlanMohamad, Lo, Maw, 2009) that effective training not only will
provide skills and knowledge for employee to accomplish their job but
also enhance employees satisfaction and productivity of employees.
Training and development also can help organization to achieve its
organizational objectives. This is because as employee’s ability is
improved, they are able to perform better and thus enable the organization
to its objective. The objective can be in term of sales or profit target. So,
training and development can help to enhance organizational performance.

Organizational Performance
Page 58 of 184
2.4.3 Performance appraisal and organizational
performance
Hypotheses 3:
H1: There is a significant relationship between performance appraisal
and organizational performance
Study from Mullins shows (as cited in AzlanMohamad et al., 2009) that
performance appraisal system can measure individual’s performance and
show possible future career advancement that can to improve performance
of the organization. Besides that, performance appraisal system is a set of
activity that is being carried out in order to measure task performance and
define and evaluate current performance. Hence, this system also can be
used to measure individual’s needs accurately and improve productivity.
Performances appraisals allow management to evaluate the organization
performances as a whole. Performance appraisal can improve organization
employee performances by providing employees with an outline to achieve
organizational objectives, operational processes and also personal goals
(Mess, 2004).

Organizational Performance
Page 59 of 184
2.4.4 Compensation and organizational performance
Hypotheses 4:
H1: There is a significant relationship between compensation and
organizational performance
Study from Becker and Gerhart shows (as cited in Namasivayam et al,
2007) that the important factor to achieve organizational goals is by
adopting human resource management practices which include
compensation. The amount of compensation given to the employees will
determine how much efforts employees put in their work. Compensation
can be an instrument in motivating or controlling the efforts that
employees put in, performing and helps in achieving the goals set by
organization.
Namasivayam et al (2007) suggested that a critical role in influencing
organizational performances is compensation systems. Proper designed
pay systems are able to motivate employee performances and it can help in
attract and retain employees at the same time. Talented candidates may get
attracted to an organization due to good compensation package provided
by the organization.
In some cases, compensation also can be defined as reward. Ghani Azmi
(2010) proposed that competency-based reward is defined as the degree to
which an organization rewards employees based on their competencies or
performances. In another word, compensation package of an organization
is measured by the employee performances in term of their skills,
behaviors and attitude in performing the jobs hold by them. This show
how significant is the compensation practice of an organization.

Organizational Performance
Page 60 of 184
2.4.5 Human Resource Practices and Organizational
Performance
Hypotheses 5:
H1: There is a significant relationship between Human Resource
Practices and organizational performance.
Barney, Wright, Dunford, Snell, Voss Tsikriktsis, Funk, Yarrow and
Owen’s study showed (as cited in Vlachos, 2008) that the uniqueness of
human resource practices, causally ambiguous that makes peoples hard to
imitate will be the source to let the firms to sustain their competitive
advantages. Hence, human resource practices may lead to higher firm
performances.
In Pfeffer’s study showed (as cited in Vlachos, 2008) that Pfeffer had
proposed seven human resource practices that included (1) employment
security, (2) selective hiring, (3) self-managed teams and decentralization
of decision making, (4) comparatively high compensation contingent on
organizational performance,(5) extensive training, (6) reduced status
distinctions and barriers, including dress, language, office arrangements
and wage differences across levels, and (7) extensive sharing of financial
and performance information throughout the organization had bring
significant effect in improving firm performances.
Human resource practices are the factor that able positively impact
organizational commitment and commitment can positively impacts the
organizational performances (Wright & Kehoe, 2007). HR practices that
employed in an organization are affective to the commitment of employees
in organization. Hence, this will directly enhance the performances
of employees. Therefore, the enhancement of employees’ performances in
an organization will also positively influence organizational
performance.

Organizational Performance
Page 61 of 184
2.5 Conclusion
This section provides a comprehensive examination of literature that supports the
present research with related theories and propositions from previous research.
The four independent variables, selective hiring, training and development,
performance appraisal and compensation, had been chosen to test relationships
with the dependent variable, organizational performance. The proposed
conceptual framework for this study was developed and the hypotheses to be
evaluated in this research were formulated at the end of this chapter.
In the next chapter, the research methodologies such as research design, sampling
design, sampling procedures, questionnaire design, measurement, data analysis
method and others will be discussed.

Organizational Performance
Page 62 of 184
CHAPTER 3: RESEARCH METHODOLOGY
3.0 Introduction
This chapter provides full explanation on the research design and the procedures
used to obtain and analyze the method data. It covers the research method used in
this research such as data collection methods, sampling design, operational
definitions of constructs, measurement scales and methods of data analysis.
3.1 Research Design
In our study, we are using quantitative research method. A business research that
employs empirical assessments with numerical measurement and analysis
approaches to address the research objectives is known as quantitative research
(Zikmund, Babin, Carr, Griffin, 2010). We choose this method because our
research will be conducted by drawing up sample from hotel industry in three
States in Malaysia. These three States are Penang, Malacca and Pahang. We will
distribute questionnaires to examine the relationship between human resource
management practices and organizational performances of these three States based
on the hotel employees’ perception. Each respondent in this survey will rate
human resource practice in their organization using numeric scales. The numeric
values collected from the questionnaires can be analyzed by using SPSS software.
We choose quantitative research method because our research will involve large
number of respondent. Due to the high volume of respondent, we will quantify
their opinion into a scale and translate their opinion into result by using SPSS
software.
Apart from that, our study is a causal research. Causal research allows researchers
to make causal inferences and seeks to identify causes and effects relationship
(Zikmund et al, 2010). In short, when there is something occurred (effect), there is

Organizational Performance
Page 63 of 184
always a reason (cause) that makes it happen. The purpose of this research is to
find out the reasons that cause the declination of organizational performance in the
three States in Malaysia.
3.2 Data Collection Methods
In order to conduct a survey for our study, we will use both primary data and
secondary data in order to conduct this research.
3.2.1 Primary Data
First hand data obtained by researchers on the variables of interest for
specific purpose of the study is called as primary data (Sekaran, et al,
2010). Collecting primary data is time consuming compared to secondary
data as it takes time to contact with respondents to do the survey. In our
study, the primary data that we used is opinion from our targeted
respondent. We obtained their opinion by disseminating self-administered
questionnaire to them. Specifically, we will design a questionnaire that
consists of questions that related to independent variables and dependent
variable of our study and seek our targeted respondents to provide their
opinion to us. The data that obtained from respondents is considered to be
first hand data, or in another word, primary data.
3.2.2 Secondary Data
The information we gathered from someone other than the researchers who
conducting the current study is known as secondary data (Sekaran et al,
2010). In our study, we used journal written by other researchers through
internet. We also gather information through relevant websites and obtain
statistics from government websites. Secondary data is easier to obtain

Organizational Performance
Page 64 of 184
when compare to primary data. Apart from that that, we also utilize
essential knowledge from journals suggested by other authors that are
relevant to our study. For example, we used journal from Science Direct,
Emerald and EBSCO host. Besides that, we also use OPAC database
provided by our university to conduct the research.
3.3 Sampling Design
To complete our survey effectively and accurately, sample is important to get our
research question answered. Sampling is a process of identifying representative
fairly from right individuals, objects or events of the target population (Sekaran et
al., 2010).
3.3.1 Target Population
According to Sekaran et al. (2010), target population is the population of
individuals which researchers are interested to investigate. Due to our
study is about the effect of human resource practices on organizational
performance and our target is hotel industry. So, our target population is
set to be employees who are working in hotel industry. Specifically, we
would like to collect information from non-managerial employees in hotel
and get their perception regarding whether human resource practices
employed by their organization will affect organizational performance.
According to Department of Statistic Malaysia (2010), the latest data
regarding employees working in hotel industry were 104,645 peoples.
3.3.2 Sampling Frame and Sampling Location
Sampling frame is representing all the elements in the population from
which the sample is drawn (Sekaran et al., 2010). In order to conduct our
survey, list of target population is important for us to contact them.

Organizational Performance
Page 65 of 184
Unfortunately, we are unable to get full list of population who are working
in hotel industry. This is partly because employee information is
considered to be private and confidential to the organization and partly
because total number of employees who are working in hotel industry is
too huge for us to get their information.
In this study, questionnaires will be distributed to the employees of hotels
in Pahang, Penang and Malacca.
Pahang is one the top tourist attractions in Malaysia. This is because
Genting Highland is situated in Pahang States. According to Genting
Malaysia (2010), Genting Highland attracted 19.9 million visitors in 2010.
There are six hotels in Genting Highland which include Maxims Genting,
Highland Hotel, Theme Park Hotel, Resort Hotel, Awana Genting
Highlands Golf & Country Resorts and First World Hotel – one of the
world’s largest hotels with 6,118 rooms.
Penang Statistics (2011) figures out that there are 2.674 million visitors in
the first three quarter of 2011. According to MAH (2011), Penang
possesses 104 hotels including from one to five-star hotel, apartment and
green hotel.
Malacca is a city with centuries-old buildings, glorious history, unique
heritage and numerous museums and delicious foods that attracted a large
number of tourists every year. There are also a multitude of hotels with
different size in Malacca.
These three sampling locations attract a great volume of tourists every year.
Therefore, the management of hotels from Pahang, Penang and Malacca
must be improved to fulfill the increasing requirements from customers.

Organizational Performance
Page 66 of 184
3.3.3 Sampling Elements
For this study, the respondents are employees who are working in hotels of
Pahang, Penang and Malacca. Specifically, target respondents of our
survey are non-managerial employees who are working in hotel. Example
of non- managerial employees is such as employee working in reception
counter or front office, security guards, cleaner and technical staff of the
hotel. This is because we wish to get non-managerial employees’ response
as to how personnel in human resource department should do or policies
they should employed in order to increase organizational performance.
Employees’ perception on human resource practices plays a significant role
in increasing organizational goals. Due to hotel is a human-oriented
business which requires significant manpower in carrying out work, there
are some employees who will be unavailable in answering our
questionnaire.
3.3.4 Sampling Technique
In this research, we used convenience sampling technique to select
respondent from our target population. Convenience sampling is under
non-probability sampling. Non-probability sampling means element in
target population does not assign any probabilities to be chosen as sample
of the research (Sekaran et al., 2010). On the other hand, convenience
sampling refers to collecting information from target population based on
the concept that whether the target respondent are convenience or
available to do questionnaire with us (Sekaran et al., 2010). In this study,
our sampling location is at Penang, Malacca and Pahang States. Due to
hotel industry is labour extensive industry, employee are normally busy
with their own work. So, we decided to use this sampling technique to
prevent their work is being interrupted due to our research.

Organizational Performance
Page 67 of 184
3.3.5 Sampling Size
As mentioned in the previous section, numbers of employee who are
working in hotels in year 2010 were 104,645. According to Sekaran et al.
(2010), a total number of 384 respondents are required to conduct the
survey. These respondents will be selected from Pahang, Penang and
Malacca. In our study, a total of 400 sets of questionnaires were distributed
to employees working in our targeted location. However, there are only
210 sets of questionnaires received and the remaining questionnaires are
not suitable due to it was not completed or does not meet requirements.
3.4 Research Instrument
3.4.1 Pilot Study
A pilot study will take place before full study is being carried out. Pilot
study is implemented in a smaller scale to design a confirmatory study in
more depth (Arain, Campbell, Cooper, Lancaster, 2010). Before carry out
full study, pilot study will be carried out as a preliminary study that helps
in testing the reliability of the questionnaire to ensure that the study is
feasible.
During pilot study, we distributed our questionnaires by using a self-
administered approach. The following is the schedule of implementation of
our pilot study:

Organizational Performance
Page 68 of 184
Table 3.1: Schedule for Pilot Study
Source: Develop from research
On 1st January to 3
rd January 2012, we conducted pilot study with 30
employees who are working in hotel in our targeted sampling location. As
mentioned above, we use self-administered questionnaire to distribute our
questionnaire. Before we distribute questionnaire to our respondent, we
will inform them the purpose of our study and the reason why we conduct
this survey. Besides that, we will also make sure our respondent have
sufficient time to answer our questionnaires. This is to ensure they do not
answer the questions in hurry and cause them to choose a wrong option.
After they filled up our questionnaires, we collected back those
questionnaires. The average time that respondents took in answering the
questionnaire is about 15 to 20 minutes.
On 6th
January 2012, we arranged the data that we collected respondents.
At the same day, the data collected is being key-in to Statistical Package
for the Social Sciences (SPSS) software for test the reliability of the
questionnaire.
Date Taken Activity
1st January to 3
rd January
2012
Distribute and collect back 30 sets of questionnaires
6th
January 2012 Arrange data from the collected questionnaires
6th
January 2012 Data entered into SPSS software

Organizational Performance
Page 69 of 184
3.4.2 Full Study
In order to implement full study, employees who are working in hotels of
Malacca, Penang and Pahang will be targeted in our study. So, a total
number of 400 sets of questionnaires are distributed during full study. Self-
administered questionnaire method is used to distribute questionnaires to
our respondents.
Below is the plan that we used to conduct full study:
Table 3.2: Schedule for Full Study
Date Taken Activities
1st February 2012 Gather information about our targeted respondents
10th
February 2012 Distribute and collect questionnaire and provide small gift
14th
February 2012 Analyze collected data and proposed the research results
Source: Develop from research
On 1st February 2012, we gathered information about our targeted
respondents to ease distribution process. During10th
February 2012, we
distributed the questionnaires and collected back after filled up by
respondents. After employees answered our questionnaire, we will provide
small gifts as appreciation for them to participation in our survey. During
14th
February 2012, the data collected from respondents will be tested by
SPSS software and the result of this research is proposed.

Organizational Performance
Page 70 of 184
3.5 Constructs Measurement (Scale and Operational
Definitions)
Constructs measurement is used to prove the validity of the questionnaire. This
questionnaire consists of three sections that include:
Section A: Demographic Profile
Section B: Human Resource Management (HRM) Practices
B1: Selective Hiring
B2: Training and Development
B3: Performance Appraisal
B4: Compensation
Section C: Organizational Performance
All the above variables are used to examine the relationship between human
resource practices that employed by an organization and its organizational
performance. The whole set questionnaire consists of 41 questions. Specifically,
section A consists of eight questions that collect basic demographic information of
respondents. Section B1, B2, B3 and B4 consist of six questions, six questions, six
questions and seven questions respectively. These variables are the human
resource practices that organization used to manage its employees. Last but not
least, there are eight questions designed to measure employees’ perception on
organizational performance.
Besides that, all the questions in the questionnaire are design in fixed-alternative
format in which specific and limited number of options is being provided to
respondents. Respondents are required to provide their opinion by selecting one
of the options. The main purpose of providing only fixed-alternative questions in
the questionnaire is that it eases respondents to answer the questionnaire. Apart
from that, this format also enable researcher to compare response collected across
different respondents.

Organizational Performance
Page 71 of 184
Section A: Demographic Profile
The first part of our questionnaire is about collecting demographic information
from our targeted respondent. Demographic information is important to us to
understand the nature of our respondents and to identify probable relationship
between demographic information with our research topic. Eight questions have
been designed in the first section. The topics covered in each question are as
follow:
Table 3.3: Questions of Demographic Profile
No. of Questions Topic covered
1 Gender
2 Age
3 Ethic group
4 Education level
5 Location of work
6 Years of employment
7 Monthly income
8 Department
Source: Develop from research
The first question of the questionnaire is about gender of respondent. We design
this question in nominal scale format whereby we provide two options for
respondent to answer, either male or female. This is a common question that used
by many researchers in their research projects. The reason we include this
question in the questionnaire is to determine whether there is any differences in
term of gender towards human resource practices and organizational performance.
The questionnaire is then followed by age of respondents. The question is
designed in ordinal scale as the age group can be arranged from smaller amount to
bigger amount. There are a few options that we included in this question, that are:
1) Below 25 years old

Organizational Performance
Page 72 of 184
2) 26-35 years old
3) 36-45 years old
4) 46-55 years old
5) More than 55 years old
We separate the options into five groups because this can help us to get more
accurate and specific data regarding the age of respondents.
The third question is to determine ethnic group that our respondents are belongs to.
This question is belongs to nominal scale. Specifically, a value is assigned to each
ethnic group but it contains no further information except showing different
between ethnic groups. Due to Malaysia consists of three main races, we provide
three options for respondents to choose, that is, Malay, Chinese and Indian. Other
than that, we also provide the fourth option, that is, “others” in case our
respondent is not belongs to any of the ethnic group stated in the questionnaire.
This is because Malaysia consists of many ethnic groups and it is impossible to
list out all ethnic groups that exist in Malaysia.
The forth question is regarding education level of our respondents. Ordinal scale
is being used as the level of education can be arranged from the lowest
qualification, SPM/STPM to highest qualification, PhD. The question is used to
measure the extent to which knowledge, skills and abilities and others that our
respondents posses. The options that we included in the questionnaire are:
1) SPM/STPM
2) Diploma/Advanced Diploma
3) Bachelor Degree
4) Master
5) PhD
Other than that, we also provide “other qualification” option to allow respondents
who possess qualification other than those provided in the questionnaire.

Organizational Performance
Page 73 of 184
The fifth question is to determine location of work of our respondents. As
mentioned in the previous chapter, our targeted respondents are employees who
are working in Penang, Malacca and Pahang States. Hence we include only three
options for our respondents, that is, Penang, Malacca, and Pahang. We are using
nominal scale to design this question. A value is being assigned to each of these
three States in order to show differences between them but the value does not
contain any other information such as order and distance. The reason that we ask
respondent about their location of work is that we would like to determine
whether there is any differences in term of location of work towards human
resource policy employed by organization.
The sixth question is about number of year that our respondent working in the
hotel. Ordinal scare is being used to design this question as the number of years of
employment can be arranged from less than one year to more than five years. We
provide four options such as:
1) Less than one year
2) 1-2 years
3) 3-5 years
4) More than 5 years
Number of years of employment can be used to determine level of experience of
our target respondents and the familiarity of the respondents towards norms,
culture and ways thing are done in the organization. The longer the time
employees working in an organization, he or she posses more experiences and
more familiar with the operations of the organization.
Next, we also concern about monthly income that our targeted respondents receive.
Scale of measurement used in this question is ordinal scale. This is because
monthly income earned by respondents can be arranged. In order to determine
level of income that our respondent earned every month, we group the options into
five groups and the examples are as follow:
1) Less than RM 2,000
2) RM2,000 to RM3,000

Organizational Performance
Page 74 of 184
3) RM3,001 to RM4,000
4) RM4,001 to RM5,000
5) More than RM5,000
The last question that we ask in this section is regarding the department that our
target respondents are working in. Nominal scale is used in this question as value
assign in each option only convey differences between options and cannot be
arranged or get to know the distance between options. Our target respondents who
are working in hotel industry may come from different departments. Each of the
departments may take different responsibilities and perform different kind of jobs.
We listed out nine common departments in hotel industry. We also provide “other
department” option to let respondents to fill up their department if their
department is not stated in the list. The nine departments stated in questionnaire
are as follow:
1) Housekeeping department
2) Security department
3) Food and beverage department
4) Chief department
5) Human resource department
6) Chief telecommunication department
7) Sales department
8) Controller department
9) Accounting department
All the above information that given by the respondents who are working in hotel
industry can helps us in determining the demographic traits of employees working
in hotel industry. Hence, it can give us a better understanding of the influences of
human resource management practices towards organizational performances.

Organizational Performance
Page 75 of 184
Section B: Human Resource Management (HRM) Practices
After collected demographic information from our targeted respondent, the focus
of the questionnaire shift to independent variables. Independent variables that
mentioned in the previous chapter include selective hiring, training and
development, performance appraisal and compensation. In order to assess how
these independent variables influence organizational performance, a list of
questions with 5-point likert scale is designed. 5-point likert scale is being used
because it helps to improve validity and standardize the questionnaire.
Standardization of options provided in questionnaire is important to allow
researchers to compare across questions in the questionnaire. Besides that,
standardized option also helps to provide reliable answer to researcher. Below is
the example of options provided in each question:
In each question, respondent will be given a scale ranging from 1 to 5 which
represent strongly disagree, disagree, neutral, agree and strongly agree
respectively. Respondent may choose their answer from 1 to 5 that signals to what
extent they agree or disagree with the statement in the questionnaire. In certain
circumstances where respondent neither agree nor disagree with the statement in
the questionnaire, they can choose “3” as their answer. This reflects respondent
does not have specific opinion on the question provided. An overview of section B
will be provided before each sub-section is discussed.
Table 3.4: Section B of Questionnaire
Strongly Disagree (SD) Disagree (D) Neutral (N) Agree (A) Strongly Agree (SA)
1 2 3 4 5

Organizational Performance
Page 76 of 184
Sub-section Question Areas covered
B1
SH1 Regards selecting best candidates as important task
SH2 Employs extensive selection process
SH3 Uses consultant when hiring personnel
SH4 Uses interview panels to select candidate
SH5 No bias in hiring and selection process
SH6 Continuously improve and review recruitment and selection
process.
B2
TD1 Provide training opportunities
TD2 Organize training program to enhance employee
competency
TD3 Provide different kinds of training program
TD4 Frequency of providing training program
TD5 On-the-job and off-the-job training
TD6 Emphasize long term development for employees
B3
PA1 Performance appraisal is subset of performance
management system
PA2 Involvement and participation on performance appraisal
process
PA3 Use performance appraisal as a guideline towards achieving
goals
PA4 Performance appraisal can be used as a corrective system
PA5 Provide feedback to employee during and at the end of
performance appraisal process
PA6 Revise compensation plan after performance appraisal
process

Organizational Performance
Page 77 of 184
Source: Develop from research
In the first sub-section, question on selective hiring is being designed. This
variable measures to what extent organization focuses on establishing an effective
recruitment and hiring system in hiring the best candidates into the organization.
There are six items that are being designed to measure selective hiring variable.
These items are being adopted from Vlachos and McKenize, McKenzie and
Jackson.
The next sub-section measures training and development variable. This
independent variable measures to what extent organization provide training
opportunities, organize training programs and emphasize long term development
for employee training plans. There are six items that are being designed in this
sub-section. These questions are adapted from Tseng et al. and Tabassi et al.
In term of performance appraisal, six items is being included to measure this
independent variable. This dimension measures to what extent member of
organization satisfied with performance appraisal policy practiced by organization.
Questions under this section are adopted from Mondy and Dick Grote.
B4
C1 Employee requires comprehensive compensation package of
employment rather than simple pay and benefit
C2 Use incentive to boost performance
C3 Constantly reviews and improves working schedule
C4 Provide comparable compensation package
C5 Uses compensation system to attract more and better
candidates
C6 Well-designed compensation system able to retain talented
employees
C7 Integrates compensation plan with its mission and goals

Organizational Performance
Page 78 of 184
One of the most important policies that organization has to focus on is
compensation policy. We identify the importance of this human resource practices
and designed questions to gauge respondent’s opinion. There are seven items that
has been included in this sub-section which we adapted from Zingheim and
Schuster, Soodchai Ting Phonsanam, Mondy, Sudin and Righeimer.
Section C: Organizational Performance
In this section, we designed questions to determine the perception of respondents
towards criteria used to measure organizational performance. Similar to the above
section, 5-point likert scale is used to measure to what extent respondents agree or
disagree with the statements provided. Eight questions have been designed to
measure organizational performance. Specifically, two questions is allocated for
each dimension of organizational performance. Below is the example of 5-point
likert scale provided in each question:
Respondents can choose from “1” to “5” to represent to what extent they disagree
or agree with the statements. In cases where respondent strongly disagree with the
statement in the questionnaire, they can choose “1”. On the other hand, respondent
can choose “5” if they are strong agree with the statement provided. If respondents
do not have any specific opinion of the statements stated in organizational
performance variable, they can choose “3” to represent their neutral stand.
Strongly Disagree (SD) Disagree (D) Neutral (N) Agree (A) Strongly Agree (SA)
1 2 3 4 5

Organizational Performance
Page 79 of 184
Below is the overview question in section C:
Table 3.5: Section C in Questionnaire
Section Question Dimension
C
OP1 Corporate financial
performance OP2
OP3 Occupancy
rate OP4
OP5 Employee
performance OP6
OP7 Turnover
rate OP8
Source: Develop from research
There are four dimensions under organizational performance, that is, corporate
financial performance, occupancy rate, employee performance and turnover rate
of the organization. In the first dimension, corporate financial performance, two
items is being adopted from Murasiranwa. This dimension measures to what
extend employee can contribute to financial performance of the organization by
having good service quality as well as whether the organization evaluate
organization performance based on financial performance.
The next dimension is occupancy rate. Occupancy rate dimension measure to what
extent occupancy rate can contribute to higher revenue as well as ability to attract
more customers. Two items are being adapted from Razalli in order to determine
employees’ perception.
Apart from that, employee performance dimension is also discussed in this section.
This dimension measures how employees can enhance their own performance in
order to further enhance organizational performance. We adopted two items from
Huselid and a journal with the title of “Public Record Office Victoria”.

Organizational Performance
Page 80 of 184
The last dimension of organizational performance is turnover rate of organization.
This dimension measures to what extent turnover that occurred in the organization
will have any effect to the organization as a whole. In order to measure employees’
perception towards turnover that occur in their organization, two items are being
adopted from Ton and Huckman.
Organizational Performance
Page 81 of 184
3.6 Data Processing
After we collected back all questionnaires, some preliminary steps have to be
done in order ensure quality and consistency of data. These data collected will be
converted into information and used for further analysis to test on hypotheses
developed in previous chapter. Accuracy and timeliness of the data can affect
result of the research, therefore data processing are important in our research
project (Malhotra, 2007). According to Malhotra (2007), data processes including
several stages such as questionnaire checking, edit data, data coding, transcribing
the data, data cleaning and the process end with selecting a proper data analysis
strategy.
First of all, we manually check questionnaires collected after respondents fill up
the survey form. We will ensure all questionnaires collected are complete and
eliminate unacceptable questionnaires. In this stage, we discover some incomplete
questionnaires.
Data editing will be done to ensure accuracy of the questionnaires. Among those
questionnaires, some of respondents did not follow instructions stated.These
questionnaires are considered as invalid and we have to remove them. Other than
that, we found that two set of questionnaires that we collected back from
respondents did not answer two questions in Section B. Therefore, these
questionnaires were edited by looking at the pattern of their overall responses.
After data editing, a number is being assigned to the edited data. According to
Malhotra (2007), numerical codes will be assigned to each data as it makes the
process of entering data to be smooth. Coded data will afterward been transcribing
into computer. We key in the data collected into SPSS software. A more extensive
consistency checks will be undertaken by using SPSS software in data cleaning
stage. We review on inconsistencies of data to generate more accurate information
for later analysis.

Organizational Performance
Page 82 of 184
The final step in data processing is the selection of the data analysis strategy.
Based on earlier work in designing our research project, we select a data analysis
strategy which able to match with characteristics of data collected.

Organizational Performance
Page 83 of 184
3.7 Data Analysis
3.7.1 Descriptive analysis
In order to summarize the result of demographic profile of our respondent,
a descriptive analysis must be used. Descriptive analysis is used to convert
raw data entered by respondents into a form that makes reader to be easier
to understand, interpret and finally make decision based on the data
obtained. In order to make use of data collected from our targeted
respondent, a plan is drawn to effectively convert raw data into
information.
There are eight questions regarding demographic information of
respondents that is being designed in Section A of the questionnaire. In
term of gender of respondents, we plan to use pie chart to show percentage
of male as well as female. Pie chart is able to clearly display each gender
and allow reader to quickly understand the proportion of each gender from
the sample.
Apart from that, we will use frequency analysis and bar chart to show
proportion of each age group of our targeted respondents. On the other
hand, ethnic group of our targeted respondent will be show by using pie
chart. In term of education level, location of work, number of years of
employment and monthly income of our targeted respondent, frequency
analysis and bar chart will be used to represent data collected. Last but not
least, we will use bar chart to represent data collected on department that
our targeted respondents are working in.
3.7.2 Scale Measurement – Reliability Test
Reliability of questionnaire is important as it measure internal consistency
of response by respondents. Reliability is a measure used to determine to
what extend the questionnaire free from random error and ability to

Organizational Performance
Page 84 of 184
produce consistent result.The most popular test that research used to test
reliability is Cronbach’s coefficient alpha. Coefficient alpha (α) is figure
that shows the direction and the strength of the linear relationship between
the dependent variable and independent variable.
The higher the coefficient alpha value, the higher the reliability of the
questionnaire. Coefficient alpha value start from 0 to 1 whereby “0” means
there is no internal consistency within response gathered from respondents
whereas “1” means complete consistency. According to Zikmund,
coefficient alpha can be categories as follow:
Table 3.6: Rules of Thumb about Reliability Test
Coefficient alpha (α) value Reliability
0.80 – 0.95 Very good reliability
0.70 – 0.80 Good reliability
0.60 – 0.70 Fair reliability
Below 0.60 Poor reliability
Adapted from: Zikmund, W. G., Babin, B. J., Carr, J. C., & Griffin, M.
(2010). Business researchmethods (8th ed.). New York: South-
Western/Cengage Learning.
Based on the table, reliability of questionnaire is considered to have very
good reliability if the coefficient alpha value is from 0.80 to 0.95. On the
other hand, coefficient alpha value of 0.70 to 0.80 is considered to have
good reliability. For the range with a coefficient alpha of 0.60 to 0.70, the
level of reliability is considered to be fair reliable.When coefficient alpha
falls below 0.60, the level of reliability is considered to be poor reliable.
A pilot test has been carried out after we collect data and opinion from 30
respondents. Opinion provided by these respondents is being entered into
SPSS software in order to determine the reliability of the questionnaire.
The result of pilot study after key into SPSS software are as follow:

Organizational Performance
Page 85 of 184
Table 3.7: Reliability of Questionnaire (Pilot Study)
Topic covered Coefficient alpha value
Selective Hiring 0.855
Training and Development 0.923
Performance Appraisal 0.863
Compensation 0.912
Organizational Performance 0.780
Overall Reliability 0.944
Source: Develop from research
According to the result generated by SPSS software, coefficient alpha
value of selective hiring, training and development, performance appraisal
and compensation are 0.855, 0.923, 0.863 and 0.912 respectively. In
another word, all independent variables have very good reliability in
investigating the problems that we are intended to measure. On the other
hand, coefficient alpha value of dependent variable, organizational
performance is 0.780 which is considered to have good reliability. Apart
from testing each individual variable in the questionnaire, we also test the
reliability of overall questionnaire. The coefficient alpha value of overall
reliability is 0.944 which is considered to be very good reliable. Since the
reliability of this questionnaire is quiet high, so this questionnaire is
considered to be suitable to be used in full study.

Organizational Performance
Page 86 of 184
3.7.3 Inferential Analysis
We used likert scale to test the relationship between our independent variables and
dependant variable. Likert scale is a type of ratio scale under scale of
measurement. Thus our variables are known to be metric in terms of measurement
because ratio scale is under this category. We choose Pearson correlation
coefficient and multiple regression analysis as our statistical techniques to test the
relationship between variables which are metric.
3.7.3.1 Pearson correlation coefficient
Pearson correlation coefficient is a technique used to measure the degree
of association between two variables which may have any value between -
1.0 and 1.0 (University of the West of England, 2007). The correlation
coefficient is represented by r. If the value of r is 1.0, there is perfect
positive linear (straight-line) relationship. If the value of r is -1.0, there is
perfect negative linear relationship or perfect inverse relationship. The
strength of association will be stronger as the value of correlation
approaches one while it will be weaker as the value of association
approaches zero.

Organizational Performance
Page 87 of 184
The rules of thumb about correlation coefficient are show below:
Table 3.8: Rules of thumb about correlation coefficient
Coefficient Range Strength of Association
±0.91 - ±1.00 Very strong
±0.71 - ±0.90 High
±0.41 - ±0.70 Moderate
±0.21 - ±0.40 Small but definite relationship
±0.00 - ±0.20 Slight, almost negligible
Source: Adapted from Hair, Money, Samouel and Page (2007). Research
methods for business.John Wiley & Sons Ltd, pg. 358.
3.7.3.2 Multiple regression analysis
Multiple regression analysis can be defined as an analysis done on testing
the effect of multiple independent variables on single dependent variable
with interval scale. (Zikmund, W. G., 2010) The equation of multiple
regression analysis is:
Yi = b0 + b1X1 + b2X2 + b3X3 +…….. + bnXn + ei
The coefficient of multiple regression, R2 shows the variance of dependent
variable with the combination of all independent variables. (Zikmund, W.
G., 2010) The variation of each independent variable on dependent
variable can be tested in this equation. Each independent variable has a
different percentage of contribution towards the variation of the dependant
variable. The effect of independent variables on dependent variable can be
ranked.
In our research, the multiple regression is use to identify the human
resource practices that could bring significance influences on the
employees’ perception toward organizational performance. From there,

Organizational Performance
Page 88 of 184
researchers will be able to develop least-square regression equation and
determine the beta to rank between independent variables.

Organizational Performance
Page 89 of 184
3.8 Conclusion
In conclusion, this chapter outlines the research design in detail. This research
methodology will be based on primary and secondary data sources that outlined
the research design within the specified sample frame. The measurement for each
variable is discussed in depth and data collection and analysis methods were also
presented. The proposed data analysis in this chapter will be explained further in
chapter four.

Organizational Performance
Page 90 of 184
CHAPTER 4:RESEARCH RESULTS
4.0 Introduction
At the beginning of this chapter, descriptive analysis of our target respondent is
presented. Besides that, central tendencies measurement of constructs is also
discussed in this chapter. The chapter is then followed by describing the scale
measurement of the research. Lastly, inferential analyses are made to show the
relationship between independent variables and dependent variable.

Organizational Performance
Page 91 of 184
4.1 Descriptive Analysis
4.1.1 Respondent Demographic Profile
Table 4.1: Respondent Demographic Profile
Variables Frequency Percentage
Gender
Male
Female
Age
Below 25
26 – 35 years old
36 – 45 years old
46 – 55 years old
More than 55 years old
Ethic Group
Malay
Chinese
Indian
Others
Education Level
SPM / STPM
Diploma / Advance Diploma
Bachelor Degree
Master
PhD
Other qualification
105
105
82
73
38
14
3
98
86
21
5
77
82
37
9
1
4
50.0
50.0
39.0
34.8
18.1
6.7
1.4
46.7
41.0
10.0
2.4
36.7
39.0
17.6
4.3
0.5
1.9
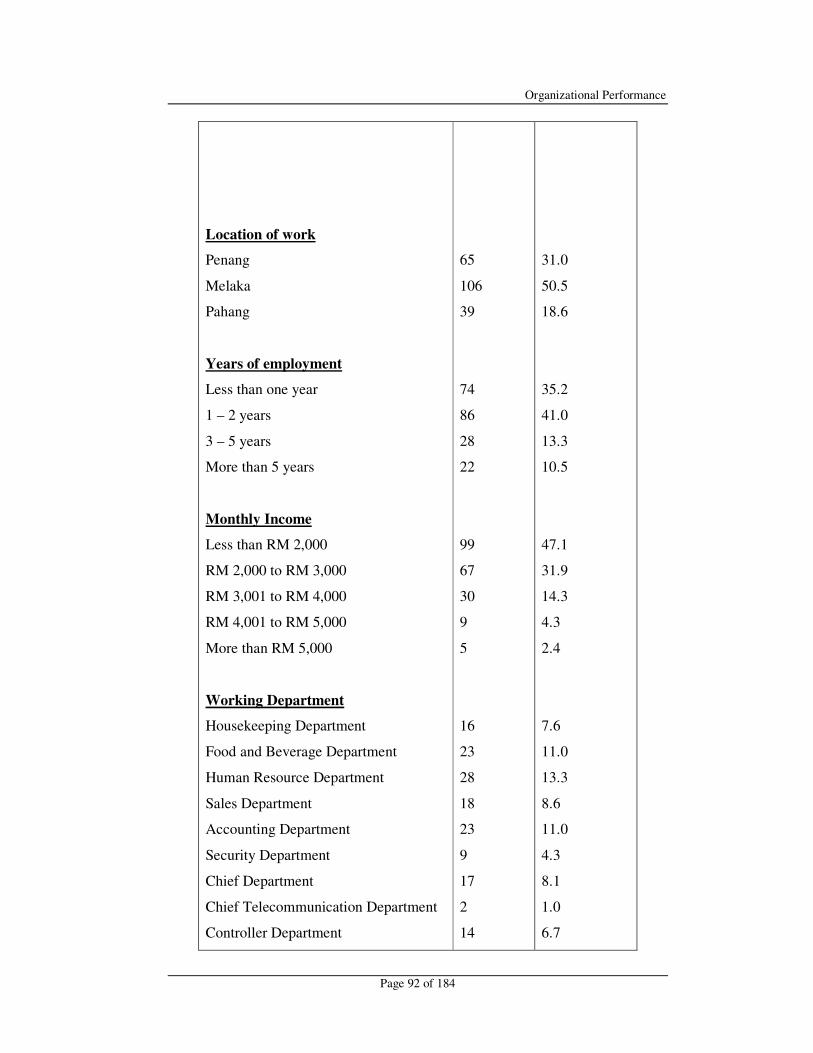
Organizational Performance
Page 92 of 184
Location of work
Penang
Melaka
Pahang
Years of employment
Less than one year
1 – 2 years
3 – 5 years
More than 5 years
Monthly Income
Less than RM 2,000
RM 2,000 to RM 3,000
RM 3,001 to RM 4,000
RM 4,001 to RM 5,000
More than RM 5,000
Working Department
Housekeeping Department
Food and Beverage Department
Human Resource Department
Sales Department
Accounting Department
Security Department
Chief Department
Chief Telecommunication Department
Controller Department
65
106
39
74
86
28
22
99
67
30
9
5
16
23
28
18
23
9
17
2
14
31.0
50.5
18.6
35.2
41.0
13.3
10.5
47.1
31.9
14.3
4.3
2.4
7.6
11.0
13.3
8.6
11.0
4.3
8.1
1.0
6.7

Organizational Performance
Page 93 of 184
Other Department 60 28.6
Source: Developed for this research

Organizational Performance
Page 94 of 184
4.1.1.1 Gender
Table 4.2: Frequency Analysis on Gender of Respondents
Figure 4.1: Gender of Respondents
Source: Developed for this research
Table 4.2 and Figure 4.1 show the percentage of 210 female and male
respondents who take part in the questionnaire survey. The questionnaires
Gender
Frequency Percent Valid Percent Cumulative Percent
Valid Male 105 50.0 50.0 50.0
Female 105 50.0 50.0 100.0
Total 210 100.0 100.0

Organizational Performance
Page 95 of 184
which collected by us through the survey consisted by 105 male and 105
female. Both of them occupied 50% in each category. Based on the
collected information above, we have equal amount of gender respondents
who participated in this questionnaire survey.
4.1.1.2 Age
Table 4.3: Frequency Analysis on Age Group of Respondents
Figure 4.2: Age Group of Respondents
Age
Frequency Percent Valid Percent Cumulative Percent
Valid Below 25 82 39.0 39.0 39.0
26 - 35 73 34.8 34.8 73.8
36 - 45 38 18.1 18.1 91.9
46 - 55 14 6.7 6.7 98.6
More than 55 years
old 3 1.4 1.4 100.0
Total 210 100.0 100.0
39.0%
34.8%
18.1%
6.7%
1.4%

Organizational Performance
Page 96 of 184
Source: Developed for this research
Table 4.3 and figure 4.2 above show the distribution of age of our
respondents. This survey was established by 210 respondents. It was found
82 respondents are below 25 years old, 73 respondents are between 26-35
years old, 38 respondents are between 36-45 years old, 14 respondents are
between 46-55 years old, whereas 3 respondents are more than 55 years
old. The percentages of each category are distributed as 39%, 34.8%,
18.1%, 6.7% and 1.4% respectively. Based on the collected information,
most of the respondents who participated in this questionnaire survey are
below 25 years old.
`4.1.1.3 Ethnic Group
Table 4.4: Frequency Analysis on Ethnic Group of Respondents
Ethnic Group
Frequency Percent Valid Percent Cumulative Percent
Valid Malay 98 46.7 46.7 46.7
Chinese 86 41.0 41.0 87.6
Indian 21 10.0 10.0 97.6
Others 5 2.4 2.4 100.0
Total 210 100.0 100.0

Organizational Performance
Page 97 of 184
Figure 4.3: Ethnic Group of Respondents
Source: Developed for this research
Table 4.4 and Figure 4.3 had shown the ethnic group of respondents that
participated in our survey. Among these respondents, 98 of them are
Malays, with the percentage of 46.7, 86 of them are Chinese, with the
percentage of 41.0, 21 of them are Indians, with the percentage of 10.0,
and 5 of them are from other ethnic group, with the percentage of 2.4. This
shows that most of the respondents are Malays because they occupied the
highest percentage in this questionnaire survey.

Organizational Performance
Page 98 of 184
4.1.1.4 Education Level
Table 4.5: Frequency Analysis on Education Level of Respondents
Education Level
Frequency Percent Valid Percent Cumulative Percent
Valid SPM/STPM 77 36.7 36.7 36.7
Diploma/Advanced
Diploma 82 39.0 39.0 75.7
Bachelor Degree 37 17.6 17.6 93.3
Master 9 4.3 4.3 97.6
PhD 1 .5 .5 98.1
Other qualification 4 1.9 1.9 100.0
Total 210 100.0 100.0
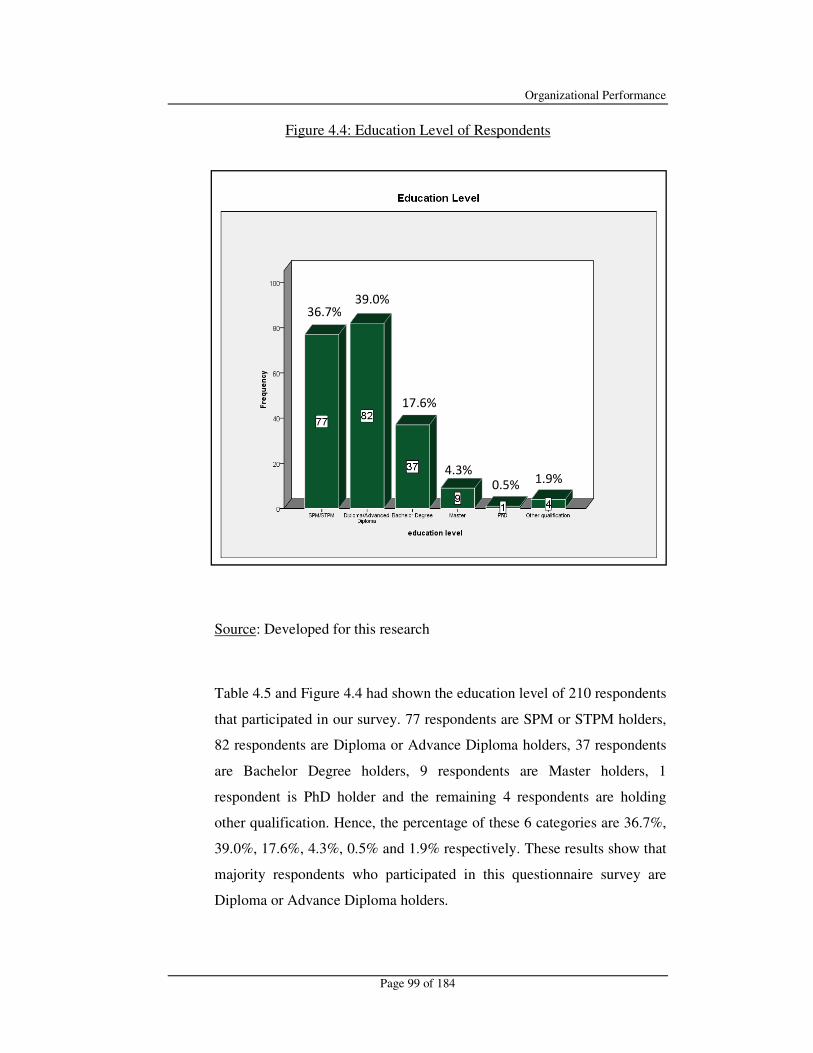
Organizational Performance
Page 99 of 184
Figure 4.4: Education Level of Respondents
Source: Developed for this research
Table 4.5 and Figure 4.4 had shown the education level of 210 respondents
that participated in our survey. 77 respondents are SPM or STPM holders,
82 respondents are Diploma or Advance Diploma holders, 37 respondents
are Bachelor Degree holders, 9 respondents are Master holders, 1
respondent is PhD holder and the remaining 4 respondents are holding
other qualification. Hence, the percentage of these 6 categories are 36.7%,
39.0%, 17.6%, 4.3%, 0.5% and 1.9% respectively. These results show that
majority respondents who participated in this questionnaire survey are
Diploma or Advance Diploma holders.
36.7%
39.0%
17.6%
4.3%
0.5% 1.9%

Organizational Performance
Page 100 of 184
4.1.1.5 Location of Work
Table 4.6: Frequency Analysis on Location of Work of Respondents
Figure 4.5: Location of Work of Respondents
Source: Developed for this research
Our questionnaires are separated into three different locations. Table 4.6 and
Figure 4.5 show the working location of our respondents. Among 210 respondents,
Location of work
Frequency Percent Valid Percent Cumulative Percent
Valid Penang 65 31.0 31.0 31.0
Melaka 106 50.5 50.5 81.4
Pahang 39 18.6 18.6 100.0
Total 210 100.0 100.0
31.0%
50.5%
18.6%

Organizational Performance
Page 101 of 184
31.0% or 65 respondents are from Penang, 50.5% or 106 respondents are from
Malacca, and the remaining 18.6% or 39 respondents are from Pahang. From the
collected information, it shows that most of the respondents are from Malacca
State.
4.1.1.6 Years of Employment
Table 4.7: Frequency Analysis on Years of Employment of Respondents
Years of employment
Frequency Percent Valid Percent Cumulative Percent
Valid Less than one year 74 35.2 35.2 35.2
1 - 2 years 86 41.0 41.0 76.2
3 - 5 years 28 13.3 13.3 89.5
More than 5 years 22 10.5 10.5 100.0
Total 210 100.0 100.0

Organizational Performance
Page 102 of 184
Figure 4.6: Years of Employment of Respondents
Source: Developed for this research
Table 4.7 and Figure 4.6 have shown the years of employment of our
respondents who are employed and working in hotel industry. There are 74
respondents were employed less than one year, 86 respondents were
employed one to two years, 28 respondents were employed two to three
years, and the remaining 22 respondents were employed more than 5 years.
The percentages of each of the categories are 35.2%, 41.0%, 13.3% and
10.5% respectively. Based on the information above, majority of the
respondents who participated in our questionnaire survey have worked in
hotel industry for one to two years.
35.2%
41.0%
13.3% 10.5%

Organizational Performance
Page 103 of 184
4.1.1.7 Monthly income
Table 4.8: Frequency Analysis on Monthly Income of Respondents
Figure 4.7: Monthly Income of Respondents
Monthly Income
Frequency Percent Valid Percent Cumulative Percent
Valid Less than RM 2000 99 47.1 47.1 47.1
RM 2001 to RM 3000 67 31.9 31.9 79.0
RM 3001 to RM 4000 30 14.3 14.3 93.3
RM 4001 to RM 5000 9 4.3 4.3 97.6
More than RM 5000 5 2.4 2.4 100.0
Total 210 100.0 100.0
47.1%
31.9%
14.3%
4.3% 2.4%

Organizational Performance
Page 104 of 184
Source: Developed for this research
Table 4.8 and Figure 4.7 show the monthly income received of the 210
respondents who participated in questionnaire survey. Based on the
information shown above, there are 99 respondents are receiving less than
RM 2,000 salary per month, 67 respondents are receiving RM 2,001 to
RM 3,000 salary per month, 30 respondents are receiving RM 3,001 to
RM 4,000 salary per month, 9 respondents are receiving RM 4,001 to RM
5,000 salary per month, the remaining 5 respondents are receiving more
than RM 5,000 salary per month. The percentages of each of the categories
are 47.1%, 31.9%, 14.3%, 4.3% and 2.4% respectively. In a nutshell, most
of the respondents are receiving less than RM 2,000 salary per month.
4.1.1.8 Working Department
Table 4.9: Frequency Analysis on Working Department of Respondents
Working Department
Frequency Percent Valid Percent
Cumulative
Percent
Valid Housekeeping Department 16 7.6 7.6 7.6
Food and Beverage
Department 23 11.0 11.0 18.6
Human Resource
Department 28 13.3 13.3 31.9
Sales Department 18 8.6 8.6 40.5
Accounting Department 23 11.0 11.0 51.4
Security Department 9 4.3 4.3 55.7
Chief Department 17 8.1 8.1 63.8
Chief Telecommunication
Department 2 1.0 1.0 64.8

Organizational Performance
Page 105 of 184
Figure 4.8: Working Department of Respondents
Source: Developed for this research
Table 4.9 and Figure 4.8 had shown the departments which are worked by
the 210 respondents in hotel industry. These respondents are dispersed into
Controller Department 14 6.7 6.7 71.4
Other Department 60 28.6 28.6 100.0
Total 210 100.0 100.0
7.6%
11.0%
13.3%
8.6%
11.0%
4.3%
8.1%
1.0%
6.7%
28.6%

Organizational Performance
Page 106 of 184
different categories based on different departments. Among 210
respondents, 16 respondents are from Housekeeping Department, 23
respondents are from Food and Beverage Department, 28 respondents are
from Human Resource Department, 18 respondents are from Sales
Department, 23 respondents are from Accounting Department, 9
respondents are from Security Department, 17 respondents are from Chief
Department, 2 respondents are from Chief Telecommunication Department,
14 respondents are from Controller Department, and the remaining 60
respondents are from other department that we do not mentioned in this
questionnaire survey. Each department is holding different value of
percentages, Housekeeping Department 7.6%, Food and Beverage
Department 11.0%, Human Resource Department 13.3%, Sales
Department 8.6%, Accounting Department 11.0%, Security Department
4.3%, Chief Department 8.1%, Chief Telecommunication Department
1.0%, Controller Department 6.7%, and the remaining 28.6% is for the
other department.

Organizational Performance
Page 107 of 184
4.1.2 Central Tendencies Measurement of Constructs
In this section, we will generate frequency table to measure the mean of
our variables by using SPSS version 16.0. The standard deviation of each
of the statements measured in our questionnaire will also be shown in this
section. Data collected from our respondents will be converted into
percentage to know the frequency on each of the likert scale of the
statements. The ranking of mean and standard deviation of the statements
will be tabulated in table form in this section.

Organizational Performance
Page 108 of 184
4.1.2.1 Organizational Performance
Statement SD D N A SA Mean Standard
Deviation Rank
1. This organization
evaluates
organizational
performance based
on financial
performance.
6.2 12.4 38.6 33.3 9.5 3.2762 1.00711 8
2. Good service
quality provided by
employees to
tourists will help to
drive financial
performance of
organization.
5.2 8.1 29.0 45.2 12.4 3.5143 0.98907 1
3. High occupancy
rate in this hotel is
used to measure
organizational
performance as
more revenue is
being generated.
5.2 9.5 32.9 41.4 11.0 3.4333 0.98692 5
4. Occupancy rate
reflect the ability of
employees in
attracting more
tourists to stay in the
hotel.
4.3 11.0 33.3 36.2 15.2 3.4714 1.01738 2

Organizational Performance
Page 109 of 184
Statement SD D N A SA Mean Standard
Deviation Rank
5. An increase in my
own performance in
the organization will
lead to increase in
salary as
organizational
performance
improved overtime.
4.3 10.0 39.0 37.6 9.0 3.3714 0.93581 7
6. Key Performance
Indicator (KPI) is
able to help the
organization to
define and measure
progress towards
organizational goals
and objectives.
5.2 9.0 38.1 34.8 12.9 3.4095 0.99948 6
7. Good and
effectives human
resource practices
employed by this
organization are able
to reduce turnover
rate of the
organization.
5.2 8.6 34.3 40.0 11.9 3.4476 0.98778 3

Organizational Performance
Page 110 of 184
Source: Developed for the research
The table above shows the central tendencies measurement of constructs of
organizational performance. The scale of measurement of this variable is
Likert scale which is ranging from (1) strongly disagree and (5) strongly
agree.
The statement ‘Good service quality provided by employees to tourists
will help to drive financial performance of organization’ scored the highest
mean of 3.5143 compare to other statements. Among 210 respondents,
there is 5.2% of respondents strongly disagree with this statement, 8.1% of
the respondents are disagree with this statement, 29.0% of respondents
remain neutral on this statement, while 45.2% of the respondents are agree
with this statement and 12.4% of respondents are strongly agree with this
statement.
Secondly, the statement of ‘Occupancy rate reflect the ability of
employees in attracting more tourists to stay in the hotel’ scored the
second highest mean score of 3.4714 among other statements in this
variable. There is 4.3% of total respondents strongly disagree with this
statement, 11.0% of respondents disagree with this statement, 33.3% of the
respondents have neutral opinion on this statement, while 36.2% of total
Statement SD D N A SA Mean Standard
Deviation Rank
8. Turnover that
happens in this
organization will
disrupt work of
existing employees
and incur cost to the
organization.
4.3 8.1 36.7 41.4 9.5 3.4381 0.92725 4

Organizational Performance
Page 111 of 184
respondents are agree with this statement and 15.2% of respondents are
strongly agree with this statement.
The following statement is ‘Good and effectives human resource practices
employed by this organization are able to reduce turnover rate of the
organization’ which scored the third highest mean score which is 3.4476
among other statements in this variable. Among 210 respondents, there is
5.2% of respondents strongly disagree with this statement, 8.6% of
respondents disagree with this statement, 34.3% of the respondents are
neutral with this statement, while 40.0% of respondents are agree with this
statement and 11.9% of respondents are strongly agree with this statement.
The fourth highest mean score of 3.4381 among these statements is scored
by the statement ‘Turnover that happens in this organization will disrupt
work of existing employees and incur cost to the organization’. There is
4.3% of total respondents choose strongly disagree as their opinion on this
statement, 8.1% of the respondents are disagree with this statement, 36.7%
of the respondents are neutral with this statement, while 41.4% of
respondents are agree with this statement and 9.5% of respondents are
strongly agree with this statement.
The statement ‘High occupancy rate in this hotel is used to measure
organizational performance as more revenue is being generated’ has the
fifth mean score among these statement which is 3.4333. Among 210 of
respondents, 5.2% of them are strongly disagree with this statement, 9.5%
of them are disagree with this statement, 32.9% of them have neutral
opinion on this statement, while 41.4% of respondents are agree with this
statement and 11.0% of them are strongly agree with this statement.
The statement with the sixth mean score, 3.4095 in this variable is ‘Key
Performance Indicator (KPI) is able to help the organization to define and
measure progress towards organizational goals and objectives’. There is
5.2% of respondents strongly disagree with this statement, 9.0% of
respondents disagree with this statement, 38.1% of respondents are neutral

Organizational Performance
Page 112 of 184
with this statement, while 34.8% of respondent agree with this statement
and 12.9% of respondents strongly agree with this statement.
The seventh mean score of 3.3714 is scored by the statement ‘An increase
in my own performance in the organization will lead to increase in salary
as organizational performance improved overtime’. Among these
respondents, 4.3% of respondents strongly disagree with this statement,
10.0% of respondents disagree with this statement, 39.0% of respondents
have neutral opinion on this statement, while 37.6% of respondents agree
with this statement and 9.0% of respondents strongly agree with this
statement.
Lastly, the statement of ‘This organization evaluates organizational
performance based on financial performance’ scored the lowest mean
score which is 3.2762 compare to other statements. There is 6.2% of
respondents strongly disagree with this statement, 12.4% of respondents
disagree with this statement, 38.6% of respondents remain neutral on this
statement, while 33.3% of them are agree with this statement and 9.5% of
them are strongly agree with this statement.
As for the standard deviation, the statement with the lowest standard
deviation is ‘Turnover that happens in this organization will disrupt work
of existing employees and incur cost to the organization’ with the value of
0.92725. The statement with the second lowest value is ‘An increase in my
own performance in the organization will lead to increase in salary as
organizational performance improved overtime’ which is 0.93581. The
statement with the third lowest value is ‘High occupancy rate in this hotel
is used to measure organizational performance as more revenue is being
generated’ which is 0.98692. The statement with the fourth lowest value is
‘Good and effectives human resource practices employed by this
organization are able to reduce turnover rate of the organization’ which is
0.98778. The statement with the fifth standard deviation score is ‘Good
service quality provided by employees to tourists will help to drive
financial performance of organization’ which is 0.98907. The statement

Organizational Performance
Page 113 of 184
with the sixth standard deviation score is ‘Key Performance Indicator (KPI)
is able to help the organization to define and measure progress towards
organizational goals and objectives’ which is 0.99948. The statement with
the seventh standard deviation score is ‘This organization evaluates
organizational performance based on financial performance’ which is
1.00711. The statement with the highest value is ‘Occupancy rate reflect
the ability of employees in attracting more tourists to stay in the hotel’
which is 1.01738.
4.1.2.2 Selective Hiring
Statement SD D N A SA Mean Standard
Deviation Rank
1. This organization
regards selecting
best candidates to
fill up vacancy as an
important task.
7.6 10.5 39.5 29.0 13.3 3.3000 1.07182 4
2. This organization
employs extensive
selection process
whenever there is
vacancy in the
organization (e.g:
assessment centers,
ability and aptitude
tests, interview and
multi-level resumes
6.2 12.4 32.4 41.4 7.6 3.3190 0.99670 2

Organizational Performance
Page 114 of 184
screening process).
3. This organization
uses consultant
when hiring
personnel.
11.4 20.0 34.8 25.7 8.1 2.9905 1.11532 6
4. During
recruitment and
selection process,
interview panels are
being used to select
the most competent
candidate.
8.1 13.8 32.4 36.7 9.0 3.2476 1.06516 5
5. There will not be
any bias in the
hiring and selection
processes of this
organization.
5.2 12.9 38.1 33.8 10.0 3.3048 0.99399 3
6. This organization
continuously
improves and review
recruitment and
selection processes.
5.7 12.9 35.2 34.3 11.9 3.3381 1.03294 1
Source: Developed for the research
The table above shows the central tendencies measurement of constructs of
selective hiring. The scale of measurement of this variable is Likert scale
which is ranging from (1) strongly disagree and (5) strongly agree.
The statement ‘This organization continuously improves and review
recruitment and selection processes’ scored the highest mean of 3.3381
compare to other statements. Among 210 respondents, there is 5.7% of
respondents are strongly disagree with this statement, 12.9% of the

Organizational Performance
Page 115 of 184
respondents are disagree with this statement, 35.2% of respondents remain
neutral on this statement, while 34.3% of the respondents are agree with
this statement and 11.9% of respondents are strongly agree with this
statement.
Secondly, the statement of ‘This organization employs extensive selection
process whenever there is vacancy in the organization’ scored the second
highest mean score of 3.3190 among other statements in this variable.
There is 6.2% of total respondents strongly disagree with this statement,
12.4% of respondents disagree with this statement, 32.4% of the
respondents have neutral opinion on this statement, while 41.4% of total
respondents are agree with this statement and 7.6% of respondents are
strongly agree with this statement.
Thirdly, the statement ‘There will not be any bias in the hiring and
selection processes of this organization’ scored the third highest mean
score which is 3.3048 among other statements in this variable. Among 210
respondents, there is 5.2% of respondents strongly disagree with this
statement, 12.9% of respondents disagree with this statement, 38.1% of the
respondents are neutral with this statement, while 33.2% of respondents
are agree with this statement and 10.0% of respondents are strongly agree
with this statement.
The fourth mean score of 3.3000 among these statements is scored by the
statement ‘This organization regards selecting best candidates to fill up
vacancy as an important task’. There is 7.6% of total respondents choose
strongly disagree as their opinion on this statement, 10.5% of the
respondents are disagree with this statement, 39.5% of the respondents are
neutral with this statement, while 29.0% of respondents are agree with this
statement and 13.3% of respondents are strongly agree with this statement.
The following statement is ‘During recruitment and selection process,
interview panels are being used to select the most competent candidate’
scored the fifth mean score which is 3.2476 among other statements in this

Organizational Performance
Page 116 of 184
variable. Among 210 respondents, there is 8.1% of respondents strongly
disagree with this statement, 13.8% of respondents disagree with this
statement, 32.4% of the respondents are neutral with this statement, while
36.7% of respondents are agree with this statement and 9.0% of
respondents are strongly agree with this statement.
Lastly, the statement of ‘This organization uses consultant when hiring
personnel’ scored the lowest mean score which is 2.9905 compare to other
statements. There is 11.4% of respondents strongly disagree with this
statement, 20.0% of respondents disagree with this statement, 34.8% of
respondents remain neutral on this statement, while 25.7% of them are
agree with this statement and 8.1% of them are strongly agree with this
statement.
As for the standard deviation, the statement with the lowest standard
deviation is ‘There will not be any bias in the hiring and selection
processes of this organization’ with the value of 0.99399. The statement
with the second lowest value is ‘This organization employs extensive
selection process whenever there is vacancy in the organization’ which is
0.99670. The statement with the third lowest value is ‘This organization
continuously improves and review recruitment and selection processes’
which is 1.03294. The statement with the fourth lowest value is ‘During
recruitment and selection process, interview panels are being used to select
the most competent candidate’ which is 1.06516. The statement with the
fifth standard deviation score is ‘This organization regards selecting best
candidates to fill up vacancy as an important task’ which is 1.07182. The
statement with the highest value is ‘This organization uses consultant
when hiring personnel’ which is 1.11532.

Organizational Performance
Page 117 of 184
4.1.2.3 Training and Development
Statement SD D N A SA Mean Standard
Deviation Rank
1. This organization
provides every
employee with
training
opportunities to
improve their
knowledge, skill,
abilities and others.
6.2 8.6 31.0 39.0 15.2 3.4857 1.05008 1
2. Training program
organized by this
organization is able
to enhance
employee
competency.
10.0 8.6 29.5 39.0 12.9 3.3619 1.12496 3
3. This organization
provides different
kinds of training
program for their
employees.
6.7 11.4 31.4 38.1 12.4 3.3810 1.05704 2
4. This organization
frequently organize
training program for
their employee.
7.1 14.3 30.5 38.1 10.0 3.2952 1.06195 5
5. This organization
organizes on-the-job
or off-the-job
training for their
employees.
8.1 7.6 37.6 38.1 8.6 3.3143 1.01486 4

Organizational Performance
Page 118 of 184
6. This organization
emphasize on long
term development
for employees
training plans.
9.0 8.1 38.1 35.2 9.5 3.2810 1.05000 6
Source: Developed for the research
The table above shows the central tendencies measurement of constructs of
training and development. The scale of measurement of this variable is
Likert scale which is ranging from (1) strongly disagree and (5) strongly
agree.
The statement ‘This organization provides every employee with training
opportunities to improve their knowledge, skill, abilities and others’ scored
the highest mean of 3.4857 compare to other statements. Among 210
respondents, there is 6.2% of respondents strongly disagree with this
statement, 8.6% of the respondents disagree with this statement, 31.0% of
respondents remain neutral on this statement, while 39.0% of the
respondents are agree with this statement and 15.2% of respondents are
strongly agree with this statement.
Secondly, the statement of ‘This organization provides different kinds of
training program for their employees’ scored the second highest mean
score of 3.3810 among other statements in this variable. There is 6.7% of
total respondents strongly disagree with this statement, 11.4% of
respondents disagree with this statement, 31.4% of the respondents have
neutral opinion on this statement, while 38.1% of total respondents are
agree with this statement and 12.4% of respondents are strongly agree with
this statement.
Organizational Performance
Page 119 of 184
Thirdly, the statement ‘Training program organized by this organization is
able to enhance employee competency’ scored the third highest mean
score which is 3.3619 among other statements in this variable. Among 210
respondents, there is 10.0% of respondents strongly disagree with this
statement, 8.6% of respondents disagree with this statement, 29.5% of the
respondents are neutral with this statement, while 39.0% of respondents
are agree with this statement and 12.9% of respondents are strongly agree
with this statement.
The fourth mean score of 3.3143 among these statements is scored by the
statement ‘This organization organizes on-the-job or off-the-job training
for their employees’. There is 8.1% of total respondents strongly disagree
on this statement, 7.6% of the respondents are disagree with this statement,
37.6% of the respondents are neutral with this statement, while 38.1% of
respondents are agree with this statement and 8.6% of respondents are
strongly agree with this statement.
The following statement is ‘This organization frequently organize training
program for their employee’ scored the fifth mean score which is 3.2952
among other statements in this variable. Among 210 respondents, there is
7.1% of respondents strongly disagree with this statement, 14.3% of
respondents disagree with this statement, 30.5% of the respondents are
neutral with this statement, while 38.1% of respondents are agree with this
statement and 10.0% of respondents are strongly agree with this statement.
Lastly, the statement of ‘This organization emphasize on long term
development for employees training plans’ scored the lowest mean score
which is 3.2810 compare to other statements. There is 9.0% of respondents
strongly disagree with this statement, 8.1% of respondents disagree with
this statement, 38.1% of respondents remain neutral on this statement,
while 35.2% of them are agree with this statement and 9.5% of them are
strongly agree with this statement.

Organizational Performance
Page 120 of 184
As for the standard deviation, the statement with the lowest standard
deviation is ‘This organization organizes on-the-job or off-the-job training
for their employees’ with the value of 1.01486. The statement with the
second lowest value is ‘This organization emphasize on long term
development for employees training plans’ which is 1.05000. The
statement with the third lowest value is ‘This organization provides every
employee with training opportunities to improve their knowledge, skill,
abilities and others’ which is 1.05008. The statement with the fourth
lowest value is ‘This organization provides different kinds of training
program for their employees’ which is 1.05704. The statement with the
fifth standard deviation score is ‘This organization frequently organize
training program for their employee’ which is 1.06195. The statement with
the highest value is ‘Training program organized by this organization is
able to enhance employee competency’ which is 1.12496.
4.1.2.4 Performance Appraisal
Statement SD D N A SA Mean Standard
Deviation Rank
1. Performance
appraisal is a part of
performance
management system.
4.8 11.0 31.9 39.0 13.3 3.4524 1.01195 4
2. This organization
allows involvement
and participation of
employees in the
entire performance
appraisal process.
4.3 10.0 32.4 43.8 9.5 3.4429 0.94796 5

Organizational Performance
Page 121 of 184
Source: Developed for the research
3. This organization
uses performance
appraisal process to
make sure every
member of
organization achieve
goals established by
top management.
4.8 11.9 27.6 43.3 12.4 3.4667 1.01252 3
4. Performance
appraisal process
employed by this
organization is able
to point out areas
which I need to
improve.
6.7 8.1 31.0 38.1 16.2 3.4905 1.06820 1
5. My supervisor
will provide
feedback to me
during and at the
end of performance
appraisal process.
6.2 8.6 29.5 41.4 14.3 3.4905 1.04098 1
6. This organization
will revise
employees’
compensation plan
after performance
appraisal process.
7.6 10.5 30.5 40.0 11.4 3.3714 1.06495 6

Organizational Performance
Page 122 of 184
The table above shows the central tendencies measurement of constructs of
performance appraisal. The scale of measurement of this variable is Likert
scale which is ranging from (1) strongly disagree and (5) strongly agree.
The statements of ‘Performance appraisal process employed by this
organization is able to point out areas which I need to improve’ and ‘My
supervisor will provide feedback to me during and at the end of
performance appraisal process’ scored the highest mean of 3.4905
compare to other statements. For the first statement, there is 6.7% of
respondents strongly disagree with this statement, 8.1% of the respondents
disagree with this statement, 31.0% of respondents remain neutral on this
statement, while 38.1% of the respondents are agree with this statement
and 16.2% of respondents are strongly agree with this statement. As for the
other statement, there is 6.2% of total respondents strongly disagree with
this statement, 8.6% of respondents disagree with this statement, 29.5% of
the respondents have neutral opinion on this statement, while 41.4% of
total respondents are agree with this statement and 14.3% of respondents
are strongly agree with this statement.
The following statement ‘This organization uses performance appraisal
process to make sure every member of organization achieves goals
established by top management’ scored the third highest mean score which
is 3.4667 among other statements in this variable. Among 210 respondents,
there is 4.8% of respondents strongly disagree with this statement, 11.9%
of respondents disagree with this statement, 27.6% of the respondents are
neutral with this statement, while 43.3% of respondents are agree with this
statement and 12.4% of respondents are strongly agree with this statement.
The fourth mean score of 3.4524 among these statements is scored by the
statement ‘Performance appraisal is a part of performance management
system’. There is 4.8% of total respondents strongly disagree with this
statement, 11.0% of the respondents disagree with this statement, 31.9% of
the respondents are neutral with this statement, while 39.0% of

Organizational Performance
Page 123 of 184
respondents are agree with this statement and 13.3% of respondents are
strongly agree with this statement.
The statement of ‘This organization allows involvement and participation
of employees in the entire performance appraisal processes scored the fifth
mean score which is 3.4429 among other statements in this variable.
Among 210 respondents, there is 4.3% of respondents strongly disagree
with this statement, 10.0% of respondents disagree with this statement,
32.4% of the respondents are neutral with this statement, while 43.8% of
respondents are agree with this statement and 9.5% of respondents are
strongly agree with this statement.
Lastly, the statement of ‘This organization will revise employees’
compensation plan after performance appraisal process’ scored the lowest
mean score which is 3.3714 compare to other statements. There is 7.6% of
respondents strongly disagree with this statement, 10.5% of respondents
disagree with this statement, 30.5% of respondents remain neutral on this
statement, while 40.0% of them are agree with this statement and 11.4% of
them are strongly agree with this statement.
As for the standard deviation, the statement with the lowest standard
deviation is ‘This organization allows involvement and participation of
employees in the entire performance appraisal process’ with the value of
0.94796. The statement with the second lowest value is ‘Performance
appraisal is a part of performance management system’ which is 1.01195.
The statement with the third lowest value is ‘This organization uses
performance appraisal process to make sure every member of organization
achieve goals established by top management’ which is 1.01252. The
statement with the fourth lowest value is ‘My supervisor will provide
feedback to me during and at the end of performance appraisal process’
which is 1.04098. The statement with the fifth standard deviation score is
‘This organization will revise employees’ compensation plan after
performance appraisal process’ which is 1.06495. The statement with the
highest value is ‘Performance appraisal process employed by this

Organizational Performance
Page 124 of 184
organization is able to point out areas which I need to improve’ which is
1.06820.
4.1.2.5 Compensation
Statement SD D N A SA Mean Standard
Deviation Rank
1. Employee regards
comprehensive
compensation
package of
employment as
direct compensation
(salary), indirect
compensation
(insurance) and non-
financial
compensation
(flexible working
hour) rather than a
simple pay and
benefit package.
5.2 17.1 35.2 32.4 10.0 3.2476 1.02393 4
2. This organization
use incentive to
boost individual
performance. E.g:
Bonus and
allowances.
7.6 9.5 38.1 34.3 10.5 3.3048 1.03641 3

Organizational Performance
Page 125 of 184
3. This organization
constantly reviews
and improves the
employees’ working
schedule.
6.2 13.8 32.4 37.6 10.0 3.3143 1.03355 1
4. This organization
provides comparable
compensation for
similar position at
another hotel.
5.2 17.1 34.8 34.3 8.6 3.2381 1.00738 6
5. This organization
uses compensation
system to attract
more and better
candidates.
5.7 16.7 34.8 32.9 10.0 3.2476 1.03324 4
6. This organization
has a well-designed
and competitive
rewards and
compensation
system that are able
to retain talented
employee.
8.6 12.9 34.3 34.8 9.5 3.2381 1.07181 6
7. This organization
integrates
compensation plan
with its mission and
goals in order to
gain or sustain
competitive
advantages over its
rivals.
7.1 12.9 29.5 42.4 8.1 3.3143 1.03355 1

Organizational Performance
Page 126 of 184
Source: Developed for the research
The table above shows the central tendencies measurement of constructs of
compensation. The scale of measurement of this variable is Likert scale
which is ranging from (1) strongly disagree and (5) strongly agree.
The statement of ‘This organization constantly reviews and improves the
employees’ working schedule’ and ‘This organization integrates
compensation plan with its mission and goals in order to gain or sustain
competitive advantages over its rivals’ scored the highest mean of 3.3143
compare to other statements. Among 210 respondents, there is 6.2% of
respondents strongly disagree with this statement, 13.8% of the
respondents disagree with this statement, 32.4% of respondents remain
neutral on this statement, while 37.6% of the respondents are agree with
this statement and 10.0% of respondents are strongly agree with this
statement. As for the second statement, there is 7.1% of respondents
strongly disagree with this statement, 12.9% of the respondents disagree
with this statement, 29.5% of respondents remain neutral on this statement,
while 42.4% of the respondents are agree with this statement and 8.1% of
respondents are strongly agree with this statement.
The following statement ‘This organization use incentive to boost
individual performance’ scored the third highest mean score of 3.3048
among other statements in this variable. There is 7.6% of total respondents
strongly disagree with this statement, 9.5% of respondents disagree with
this statement, 38.1% of the respondents have neutral opinion on this
statement, while 34.3% of total respondents are agree with this statement
and 10.5% of respondents are strongly agree with this statement.
The fourth highest mean score of 3.2476 is scored by the statement
‘Employee regards comprehensive compensation package of employment
as direct compensation (salary), indirect compensation (insurance) and
non-financial compensation (flexible working hour) rather than a simple
pay and benefit package’ and ‘This organization uses compensation

Organizational Performance
Page 127 of 184
system to attract more and better candidates’. There is 5.2% of total
respondents choose strongly disagree as their opinion on this statement,
17.1% of the respondents disagree with this statement, 35.2% of the
respondents are neutral with this statement, while 32.4% of respondents
are agree with this statement and 10.0% of respondents are strongly agree
with this statement. As for the second statement, there is 5.7% of
respondents strongly disagree with this statement, 16.7% of respondents
disagree with this statement, 34.8% of the respondents are neutral with this
statement, while 32.9% of respondents are agree with this statement and
10.0% of respondents are strongly agree with this statement.
Lastly, the statement of ‘This organization provides comparable
compensation for similar position at another hotel’ and ‘This organization
has a well-designed and competitive rewards and compensation system
that are able to retain talented employee’ scored the lowest mean score
which is 3.2381 compare to other statements. There is 5.2% of respondents
strongly disagree with this statement, 17.1 % of respondents disagree with
this statement, 34.8% of respondents remain neutral on this statement,
while 34.3% of them are agree with this statement and 8.6% of them are
strongly agree with this statement. As for the second statement, there is 8.6%
of respondents strongly disagree with this statement, 12.9% of respondents
disagree with this statement, 34.3% of the respondents are neutral with this
statement, while 34.8% of respondents are agree with this statement and
9.5% of respondents are strongly agree with this statement.
As for the standard deviation, the statement with the lowest standard
deviation is ‘This organization provides comparable compensation for
similar position at another hotel’ with the value of 1.00738. The statement
with the second lowest value is ‘Employee regards comprehensive
compensation package of employment as direct compensation (salary),
indirect compensation (insurance) and non-financial compensation
(flexible working hour) rather than a simple pay and benefit package’
which is 1.02393. The statement with the third lowest value is ‘This

Organizational Performance
Page 128 of 184
organization uses compensation system to attract more and better
candidates’ which is 1.03324. The statement with the fourth standard
deviation score is ‘This organization constantly reviews and improves the
employees’ working schedule’ and ‘This organization integrates
compensation plan with its mission and goals in order to gain or sustain
competitive advantages over its rivals’ which is 1.03355. The statement
with the sixth standard deviation score is ‘This organization use incentive
to boost individual performance. E.g: Bonus and allowances’ which is
1.03641. The statement with the highest value is ‘This organization has a
well-designed and competitive rewards and compensation system that are
able to retain talented employee’ which is 1.07181.
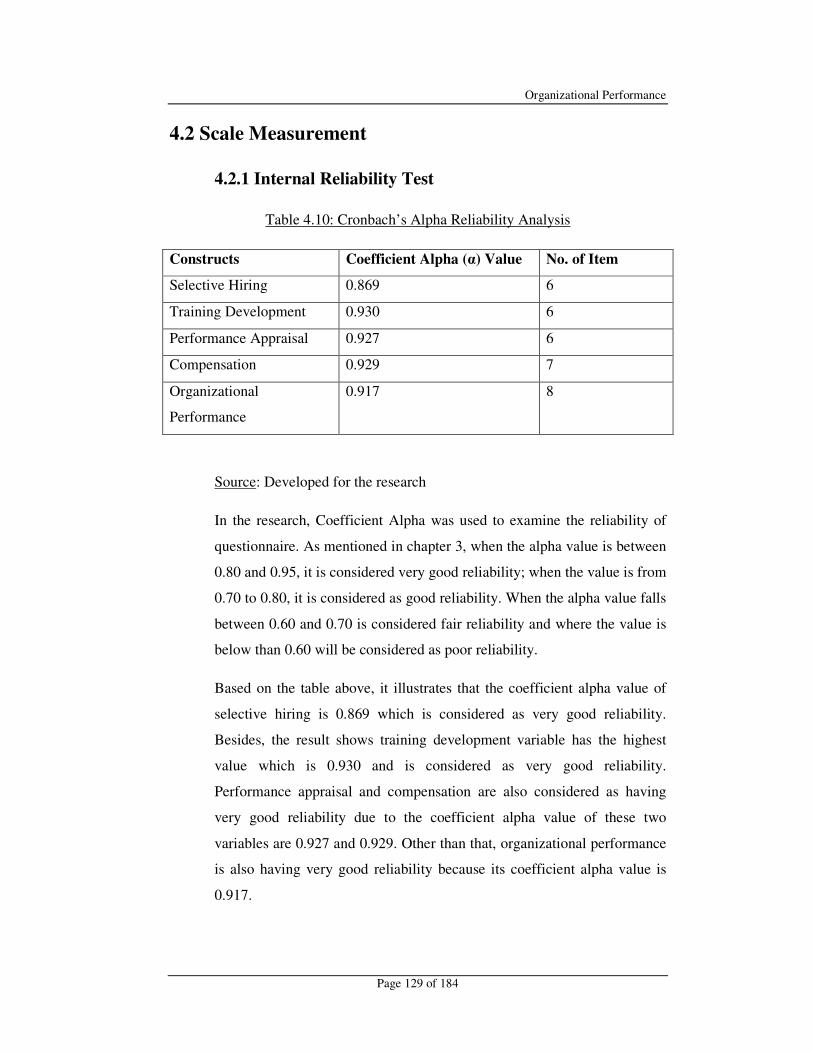
Organizational Performance
Page 129 of 184
4.2 Scale Measurement
4.2.1 Internal Reliability Test
Table 4.10: Cronbach’s Alpha Reliability Analysis
Constructs Coefficient Alpha (α) Value No. of Item
Selective Hiring 0.869 6
Training Development 0.930 6
Performance Appraisal 0.927 6
Compensation 0.929 7
Organizational
Performance
0.917 8
Source: Developed for the research
In the research, Coefficient Alpha was used to examine the reliability of
questionnaire. As mentioned in chapter 3, when the alpha value is between
0.80 and 0.95, it is considered very good reliability; when the value is from
0.70 to 0.80, it is considered as good reliability. When the alpha value falls
between 0.60 and 0.70 is considered fair reliability and where the value is
below than 0.60 will be considered as poor reliability.
Based on the table above, it illustrates that the coefficient alpha value of
selective hiring is 0.869 which is considered as very good reliability.
Besides, the result shows training development variable has the highest
value which is 0.930 and is considered as very good reliability.
Performance appraisal and compensation are also considered as having
very good reliability due to the coefficient alpha value of these two
variables are 0.927 and 0.929. Other than that, organizational performance
is also having very good reliability because its coefficient alpha value is
0.917.

Organizational Performance
Page 130 of 184
Overall, the result of internal reliability test shows that all the variables of
this research is consistent and reliable due to the coefficient alpha value of
all constructs fall between 0.80 and 0.95. Therefore, the results of this
questionnaire are suitable for further analysis.

Organizational Performance
Page 131 of 184
4.3 Inferential Analyses
4.3.1 Pearson Correlation Coefficient
According to Zikmund (2003), Pearson correlation coefficient refers to the
measurement of the linear association between two metric variables.
Pearson’s correlation analyses indicate the strength of the linear
relationship between two variables and the direction of that relationship.
Besides that, it describes the direction, strength and significant of bivariate
relationship of all variables in the research.
The Pearson correlation coefficient is values from -1 to +1. The value +1
indicates that there is a perfectly positive linear relationship between two
variables; on the other hand, the value with -1 means that there is a
perfectly negative linear relationship between two variables. A zero value
indicates that the variables are not linear related by each other. The table
shows that there are different ranks of strength of linear relationship
between two variables which is identified by different coefficient range.
Table 4.11: Pearson Correlation Coefficient
Coefficient range Strength
±0.91 to ±1.0 Very Strong
±0.71 to ±0.90 High
±0.41 to ±0.70 Moderate
±0.21 to ±0.40 Small but definite
relationship
0 to ±0.20 Slight, almost negligible
Source: Hair, J. F. Jr., Money, A. H., Samouel, P., & Page, M. (2007).
Research methods for business.Chichester. West Susseex: John Wiley
& Sons, Inc.

Organizational Performance
Page 132 of 184
4.3.1.1 Hypotheses 1: The relationship between selective hiring and
organizational performance
H0: There is no significant relationship between selective hiring and
organizational performance.
H1: There is a significant relationship between selective hiring and
organizational performance.
Table 4.12: Correlation between Selective Hiring and Organizational Performance
Correlations
Source: Developed for the research
From the result, there is positive relationship between selective hiring and
organizational performance because of the positive value for correlation
coefficient. The selective hiring variable has a 0.758 correlation with the
organizational performance variable. Thus, when selective hiring is high,
organizational performance is high also.
Selective Hiring
Organizational
Performance
Selective Hiring Pearson Correlation 1 .758**
Sig. (2-tailed) .000
N 210 210
Organizational Performance Pearson Correlation .758**
1
Sig. (2-tailed) .000
N 210 210
**. Correlation is significant at the 0.01 level (2-tailed).

Organizational Performance
Page 133 of 184
The value of this correlation coefficient 0.758 is fall under coefficient
range from ±0.71 to ±0.90. Thus, the relationship between selective
hiring and organizational performance is high. Besides that, the
relationship between selective hiring and organizational performance is
significant because of the p-value 0.000 is less than alpha value 0.01.
As the result, H0 is rejected and H1 is accepted, so there is a significant
positive relationship between selective hiring and organizational
performance.

Organizational Performance
Page 134 of 184
4.3.1.2 Hypotheses 2: The Relationship between Training and
Development and Organizational Performance
H0: There is no significant relationship between training and
development and organizational performance.
H1: There is a significant relationship between training and
development and organizational performance.
Table 4.13: Correlation between training and development and organizational
performance
Correlations
Source: Developed for the research
Table 4.13 shows that there is positive relationship between training and
development and organizational performance due to the positive value for
correlation coefficient. The training and development variable has a 0.728
Training and
Development
OrganizationalPe
rformance
Training and Development Pearson Correlation 1 .728**
Sig. (2-tailed) .000
N 210 210
OrganizationalPerformance Pearson Correlation .728**
1
Sig. (2-tailed) .000
N 210 210
**. Correlation is significant at the 0.01 level (2-tailed).

Organizational Performance
Page 135 of 184
correlation with the organizational performance variable. Therefore, when
training and development is high, organizational performance will be high.
The value of this correlation coefficient 0.728 is fall under coefficient
range from ±0.71 to ±0.90. This result means that the relationship between
training and development and organizational performance is high. Other
than that, the result shows also that the relationship between training and
development and organizational performance is significant. It is because
the p-value 0.000 is less than alpha value 0.01.
Therefore, H0 is rejected and H2 is accepted, so there is a significant
positive relationship between training and development and organizational
performance.

Organizational Performance
Page 136 of 184
4.3.1.3 Hypotheses 3: The relationship between performance appraisal
and organizational performance
H0: There is no significant relationship between performance appraisal
and organizational performance.
H1: There is a significant relationship between performance appraisal
and organizational performance
Table 4.14: Correlation between performance appraisal and organizational
performance
Correlations
Source: Developed for the research
From the result, there is positive relationship between performance
appraisal and organizational performance because of the positive value for
the correlation coefficient. The performance appraisal variable has a 0.811
correlation with the organizational performance variable. Thus, when
performance appraisal is high, organizational performance will be high.
Performance
Appraisal
Organizational
Performance
Performance Appraisal Pearson Correlation 1 .811**
Sig. (2-tailed) .000
N 210 210
Organizational Performance Pearson Correlation .811**
1
Sig. (2-tailed) .000
N 210 210
**. Correlation is significant at the 0.01 level (2-tailed).

Organizational Performance
Page 137 of 184
The value of this correlation coefficient 0.811 is fall under coefficient
range from 0.71 to ±0.90. Thus, the relationship between performance
appraisal and organizational performance is high. Besides that, the
relationship between performance appraisal and organizational
performance is significant due to the p-value 0.000 is less than alpha value
0.01.
Therefore, H0 is rejected and H3 is accepted, so there is a significant
positive relationship between performance appraisal and organizational
performance.

Organizational Performance
Page 138 of 184
4.3.1.4 Hypotheses 4: the relationship between compensation and
organizational performance
H0: There is no significant relationship between compensation and
organizational performance.
H1: There is a significant relationship between compensation and
organizational performance
Table 4.15: Correlation between compensation and organizational performance
Correlations
Compensation
OrganizationalPe
rformance
Compensation Pearson Correlation 1 .836**
Sig. (2-tailed) .000
N 210 210
Organizational Performance Pearson Correlation .836**
1
Sig. (2-tailed) .000
N 210 210
**. Correlation is significant at the 0.01 level (2-tailed).
Source: Developed for the research
Table 4.15 shows that there is positive relationship between compensation
and organizational performance due to the positive value for correlation
coefficient. The compensation variable has a 0.836 correlation with the
organizational performance variable. Therefore, when compensation is
high, organizational performance will be high.

Organizational Performance
Page 139 of 184
The value of this correlation coefficient 0.836 is fall under coefficient
range from ±0.71 to ±0.90. This result means that the relationship between
compensation and organizational performance is high. Other than that, the
result shows also that the relationship between compensation and
organizational performance is significant. It is because the p-value 0.000 is
less than alpha value 0.01.
Therefore, H0 is rejected and H4 is accepted, so there is a significant
positive relationship between compensation and organizational
performance.

Organizational Performance
Page 140 of 184
4.3.2 Multiple Regression Analyses
4.3.2.1 Hypotheses 6: The relationship between four
independent variable and organizational performance
H0: The four independent variables (selective staffing, training
and development, performance appraisal and compensation) do not
have significant relationship with organizational performance.
H1: The four independent variables (selective staffing, training
and development, performance appraisal and compensation) have
significant relationship with organizational performance.
Table 4.16: Multiple Regression Analyses
Coefficients a
Model
Unstandardized
Coefficients
Standardized
Coefficients t Sig.
B Std. Error Beta
1 (Constant) .648 .116 5.588 .000
SelectiveHiring .160 .062 .166 2.597 .010
Training and
Development -.166 .064 -.194 -2.589 .010
PerformanceApprais
al .340 .065 .381 5.265 .000
Compensation .500 .066 .555 7.586 .000
a. Dependent Variable: OrganizationalPerformance

Organizational Performance
Page 141 of 184
4.3.2.2 Nature of Relationship
The following equation explains the relationship between the independent
variables and dependent variable:
Y = a + b1X1 + b2X2 + b3X3 + b4X4
Where Y = Predicted Linear Relationship of Organizational Performance
a = Constant Value
b = Standardized Coefficients
X = Independent Variable
Thus, the regression equation is:
Organizational Performance = 0.648 + 0.160 Selective Hiring – 0.166
Training and Development + 0.340 Performance Appraisal + 0.500
Compensation
Based on the table, the Standardized Beta coefficients indicate the
contribution of each variable to the research. From the results,
compensation is the predictor variables that contribute the highest to the
variation of the dependent variable (organizational performance) because it
is having the largest Standardized Coefficient Beta value for this predictor
variable which is 0.555. This means that compensation make the strongest
unique contribution to explain the variation in dependent variable
(organizational performance), when the variance explained by all other
predictor variables in the model is controlled for.
Performance appraisal is the predictor variables that contribute the second
highest to the variation of the dependent variable (organizational
performance) because Beta value for this predictor variable is 0.381
which is the second highest if compared to other predictor variables.

Organizational Performance
Page 142 of 184
This means that performance appraisal make the second strongest unique
contribution to explain the variation in dependent variable, when the
variances explained by all other predictor variables in the model is
controlled.
Training and development is the predictor variables that contribute the
third highest to the variation of the dependent variable because it is having
the third largest Beta value, -0.194 if compared to other predictor variables.
This means that training and development make the third strongest unique
contribution to explain the variation in dependent variable, when variance
explained by all other predictor variables in the model is controlled for.
Selective Hiring is the predictor variables that contribute the lowest to the
variation of the dependent variable (organizational performance) because
Beta value of this predictor variable is smallest, 0.166 if compared to other
predictor variables. This means that selective hiring make the least
contribution to explain the variation in dependent variable.

Organizational Performance
Page 143 of 184
4.3.2.3 Strength of Relationship
Table 4.17: Model Summary
Model Summary
Model R R Square Adjusted R Square Std. Error of the
Estimate
1 .871a .758 .753 .38826
a. Predictors: (Constant), Compensation, SelectiveHiring, PerformanceAppraisal,
TrainingDevelopment
b. Dependent Variable: OrganizationalPerformance
Source: Developed for the research
Based on the table, it shows that the R value is 0.871. The R value is the
correlation coefficient between the dependent variable and the independent
variables taken together. The result shows that there is positive and high
correlation between dependent variable (organizational performance) and
independent variables (compensation, selective hiring, performance
appraisal, and training and development).
The R square indicates the extent the independent variables can explain the
variations in the dependent variable. From this study, the coefficient of
determination (R square) is 0.758, which indicated that independent variables
(compensation, selective hiring, performance appraisal, and training and
development) can explain 75.8% of the variations in dependent variable
(organizational performance).

Organizational Performance
Page 144 of 184
Table 4.18: Anova
ANOVAb
Model Sum of Squares Df Mean Square F Sig.
1 Regression 96.793 4 24.198 160.526 .000a
Residual 30.902 205 .151
Total 127.695 209
a. Predictors: (Constant), Compensation, Selective Hiring, Performance Appraisal, Training and
Development
b. Dependent Variable: OrganizationalPerformance
Source: Developed for the research
Based on table, the p-value of 0.000 is less than alpha value 0.01. The F-
statistic is significant. The model for this research is a good descriptor of
the relation between the dependent and independent variables. Thus, the
independent variables (compensation, selective hiring, performance
appraisal, and training and development) are significant explain the
variance in organizational performance. Besides that, the alternate
hypotheses are supported by the data.

Organizational Performance
Page 145 of 184
4.4 Conclusion
Throughout this section, different types of analysis are done on the data collected
through survey. First, we conducted a demographic analysis on these data. Within
this analysis a respondent demographic profile is formed to identify the
demographic characteristic of the respondents. Central tendencies measurement of
constructs is also within this analysis to obtain the mean of data collected by using
frequency analysis. Reliability analysis is conducted in the scale measurement
section to test the reliability of the result. Lastly, inferential analyses are
conducted to test the relationship between the independent variables and
dependent variable. Pearson Correlation Coefficient and Multiple Regression
Analysis are used to test whether the relationship between these variables are
significant. The research results will be discussed further in chapter 5.

Organizational Performance
Page 146 of 184
Chapter 5 Discussion and Conclusion
5.0 Introduction
This chapter provides a clear discussion, implication and conclusion from the
previous chapter. The organization of this chapter start with the summary of
statistical analyses includes descriptive and inferential analyses. Then, follow by
the discussion of major findings as well as implication of study. Some of the
limitation and recommendations for future research and conclusion are being
discussed.

Organizational Performance
Page 147 of 184
5.1 Summary of Statistical Analyses
5.1.1 Summary of Descriptive Analyses
From the questionnaire survey result, a summary description of descriptive
analyses was made as the follow. This descriptive analysis is made by
describing the demographic profile of respondents. At first, we know that
the genders of the respondents are occupied 50% for each category. As due
to this result, we have an advantage that we can justify our respondents’
opinions more objective and accurate because our respondents are built up
equally from the different gender category.
Next, we measure our respondents’ ages and get the result that shown
majority of our respondents are from the age group of below 25 years old
and the age between 26 to 35 years old, while the least contribution of the
respondents to this questionnaire survey is from the age group of more
than 55 years old.
After that, we examined our respondents’ contribution to this questionnaire
survey based on their ethnic groups. We can get the result which found
that, most of our respondents are Malays and Chinese races.
The majority of our respondents’ education levels are SPM or STPM
levels and Diploma or Advance Diploma levels. We can know that, most
of our respondents are high educated and able to answer our questionnaire.
From the data collected, there is only one respondent who participated in
our questionnaire survey is from PhD education level.
We targeted three locations for our survey, they were, Penang, Malacca
and Pahang. Most of our respondents are from Malacca, while we have
moderate amount of respondents from Penang. However, the least number
of respondents are from Pahang.

Organizational Performance
Page 148 of 184
Years of employment also one of the determinant factor that we included
in descriptive analyses. The results showed that most of our respondents
were employed less than one year and one to two years.
Subsequently, most of the respondents are receiving less than RM 2,000 as
their monthly income. Besides, the second highest amount of respondents
is receiving RM 2,000 to RM 3,000 income per month. However, small
amount of respondents are receiving more than RM 5,000 salary per month.
A large percentage of respondents are from Human Resource Department,
Food and Beverage Department, and Accounting Department. Relatively,
small amount of respondents who are participated in this survey are from
security department and controller department. The remaining percentage
of respondents is from other departments.
5.1.2 Summary of Inferential Analyses
5.1.2.1 Reliability Test
Regarding to the result from Internal Reliability Test, it illustrated that all
the variables are stability and reliability due to the coefficient alpha values
of the variables fall between 0.80 and 0.95 which is considered as very
good reliability. The result showed that selective hiring scored 0.869,
training and development scored 0.930, performance appraisal scored
0.927, compensation scored 0.929 and organizational scored 0.917 for the
coefficient alpha value.
5.1.2.2 Pearson Correlation Analyses
Based on the Pearson Correlation Analyses, it shows that all the
independent variables (selective hiring, training and development,

Organizational Performance
Page 149 of 184
performance appraisal, and compensation) are having significant
relationship with organizational performance. Besides that, the values of
correlation coefficient of these four independent variables are fall under
coefficient range from ±0.71 to ±0.90 which selective hiring scored 0.758,
training and development scored 0.728, performance appraisal scored
0.811 and compensation scored 0.836. Theses figures indicated that the
relationship between each of the four independent variables and
organizational performance is high.
5.1.2.3 Multiple Regression Analyses
Furthermore, based on the results from Multiple Regression Analyses,
compensation makes the highest contribution to organizational
performance because of its Standard Coefficient Beta value of 0.555 which
is the largest value among other independent variables. The second and
third strongest contribution is performance appraisal and training and
development which scored 0.381 and -0.194. While selective hiring
contributes the lowest to the variation of the organizational performance
which scored Beta value of 0.166.

Organizational Performance
Page 150 of 184
5.2 Discussions of Major Findings
Table 5.1: Correlation Value between Four Independent Variables and
Organizational Performance
Independent
Variables Hypotheses Result
Selective
Hiring
H1: There is a significant relationship between
selective hiring and organizational
performance.
P-value = 0.000
(<0.01)
Training and
Development
H2: There is a significant relationship between
training and development and organizational
performance.
P-value = 0.000
(<0.01)
Performance
Appraisal
H3: There is a significant relationship between
performance appraisal and organizational
performance.
P-value = 0.000
(<0.01)
Compensation
H4: There is a significant relationship between
compensation and organizational
performance.
P-value = 0.000
(<0.01)
Source: Develop for the research

Organizational Performance
Page 151 of 184
5.2.1 Selective Hiring
H1: There is a significant relationship between selective hiring and
organizational performance.
The hypothesis above tested on the relationship between selective hiring
and organizational performance. This hypothesis is proved to be true as
selective hiring is shown to have a significant positive relationship with
organizational performance because the p-value is 0.00 which is lower
than alpha value 0.01 as a result from our data in chapter 4. This
relationship is also proven as there is a significant correlation between
selective hiring and organizational performance due to the coefficient Beta
value of 0.758. This shows that if an organization can do well in selective
hiring, then there will be an increment of 75.8% on organizational
performance. This result is consistent with several studies which are
researched on selective hiring and organizational performance.
According to a study done by Vlachos (2007), selective hiring is an
important practice in improving organizational performance. The result of
this study shows that selective hiring is a good predictor for firm
performance measures, such as perceived market share, perceived sales
and perceived market performance. By selecting the right peoples this can
help to reduce the costs of training and earn more profits at the same time
with the decrease of defect costs.
Based on the study of Cho, Jang, and Erdem (as cited in Vlachos, 2009)
pre-employment test is an important component of selective hiring in
screening incompetent candidates. Pre-employment test can also increase
the commitment of employees passing the test because they will have a
stronger sense of belonging to the company through selective hiring.

Organizational Performance
Page 152 of 184
5.2.2 Training and Development
H1: There is a significant relationship between training and
development and organizational performance.
The hypothesis above tested on the relationship between training and
development and organizational performance. Based on the result from
chapter 4, it shows that there is a significant positive relationship between
training and development and organizational performance because the p-
value is 0.00 which is lower than alpha value 0.01. This relationship is also
proven as there is a significant correlation between training and
development and organizational performance due to the coefficient Beta
value of 0.728. This shows that when an organization is good in training
and development, then there will be an increment of 72.8% on
organizational performance. This result is consistent with several studies
which are researched on training and development and organizational
performance.
According to Raja (2011), training and development are essential to
enhance the ability of employee. In his research he stated that by
increasing employee performance, it will have a positive effect on the
growth of organizational performance as employee performance is an
important factor on the overall performance of an organization. The
elements in training and development in this research are training design,
on the job training and delivery style. These elements have shown to have
positive relationship with organizational performance, thus these results
prove that training and development has a significant positive relationship
with organizational performance.
In the study of Swanson (as cited in Tabassi & Abu Bakar, 2009), training
and development can improve performance systematically through the
process of developing work-related skills and knowledge of employees. By
improving the skills of employee, they will be able to handle their tasks
better thus indirectly increase organizational performance. This shown that

Organizational Performance
Page 153 of 184
there is a linkage between training and development and organizational
performance.
Furthermore, based on a study done by Mohinder and Anastasia (2007),
training and development is one of the human resource practices which
have positive effect on hotel performance. Training and development is
essential for organization to provide good service quality to customers,
because good service quality is one of the performance variable of
organizational performance. This better training and development will
indirectly lead to higher organizational performance. This statement is
further supported by a study done by Nadeem, Yasir and Aysha (2011),
which shows that training and development has a strong correlation on
organizational performance in service industry.
5.2.3 Performance Appraisal
H1: There is a significant relationship between performance appraisal
and organizational performance.
This research tested the relationship between performance appraisal and
organizational performance. Based on the result from chapter 4, it showed
that there is a significant positive relationship between performance
appraisal and organizational performance due to its p-value is 0.000 which
is less than the alpha value 0.01. Besides that, the result also indicated that
there is a significant correlation between performance appraisal and
organizational performance due to its coefficient Beta value of 0.811. This
means that when there is an organization good in performance appraisal, it
will lead to an increment of 81.1% of organizational performance level.
The result of this research was consistent with the statement of several
studies such as Surdasan (2009) who stated that performance appraisal is
the one of the most important process in human resource management for
organizations.

Organizational Performance
Page 154 of 184
Performance appraisal is an evaluation process which evaluates by
managers and delivers feedback regarding employees’ performance.
(Spence and Keeping, 2010) According to Kondrasuk (2011), performance
appraisal can be motivating employees to achieve higher performance
standard by focused on punishing them for poor performance. Thus,
organizations who have practiced performance appraisal will perform
better because of employees are trying to get higher performance to avoid
punishment for poor performance. Yee and Chen (2009) stated that
performance appraisal is used to evaluate and discuss the work
performance of employees periodically in order to identify the strengths
and weaknesses as well as opportunities for improvement among
employees. Furthermore, it is a process of creating work standards;
evaluate employees’ actual performance relative to those work standards;
and giving feedback to employees in order to motivate them to improve
their job performance.
From the result of hypotheses testing, the Beta coefficient value of 0.811
shows that the relationship between performance appraisal and
organizational performance is at a high level. According to Chapman
(2006), performance appraisal is the essential element for effective
management of organizations which helps to develop employees and
improve organizational performance.

Organizational Performance
Page 155 of 184
5.2.4 Compensation
H1: There is a significant relationship between compensation and
organizational performance.
This hypothesis tested the relationship between compensation and
organizational performance.Based on the result from chapter 4, it showed
that there is a significant positive relationship between compensation and
organizational performance due to its p-value is 0.000 which is less than
the alpha value 0.01. Besides that, the result also indicated that there is a
significant correlation between compensation and organizational
performance due to its coefficient Beta value of 0.836. This means that if
there is an organization does well in compensation, it will lead to an
increment of 83.6% of organizational performance level. This research
result was consistent with the study which done by Tsai (2005) stated that
the relationship between compensation and organizational performance is
the one of the most important for management. The study believed that
organization can motivate employees to perform better and thus can have a
positive effect on organizational performance by effectively used rewards.
According to Guest’s study (as cited in Tsai, 2005), a reward and
compensation system is based on expectancy theory, which means that
employees will be more motivated to enhance their performance when
they realize that there is a strong relationship between their performance
and the compensation they received. This is the way that compensation
motivates individuals to perform better and better, compensations and
rewards are always the prime objective makes individuals getting into
work. Furthermore, based on the study of Bretz and Thomas (as cited in
Currall, Towler, Judge, and Kohn, 2005), which has indicated that pay
dissatisfaction will lead to reduced levels of organizational performance.
The organization which manages compensation poorly will affect its
organizational performance also due to unable to retain talents.

Organizational Performance
Page 156 of 184
From the result of chapter 4, it indicated that compensation contribute the
most to organizational performance if compare to other independent
variables. According to Rynes, Gerhart, and Minette (2004), compensation
and pay is the most important element in human resource practices in
motivating employees.

Organizational Performance
Page 157 of 184
Table 5.2: Correlation Value between Human Resource Practices and
Organizational Performance
Dependent
Variables Hypotheses Result
Organizational
Performance
H5: There is a significant relationship between
human resource practices and organizational
performance.
P-value = 0.000
(<0.01)
Source: Developed for the research
5.2.5 Human Resource Practices
H1: There is a significant relationship between human resource
practices and organizational performance.
The hypothesis above tested on the relationship between human resource
practices and organizational performance. Based on the result from chapter
4, it shows that there is a significant positive relationship between human
resource practices and organizational performance because the p-value is
0.00 which is lower than alpha value 0.01. This relationship is also proven
as there is a significant correlation between human resource practices and
organizational performance due to the R square value of 0.758. This shows
that when an organization is good in human resource practices, then there
will be an increment of 75.8% on organizational performance. This result
is consistent with several studies which are researched on human resource
practices and organizational performance.
According to the study of Vlachos (2008), human resource practices are a
significant predictor for firm performance. In this study selective hiring
and compensation show a strong positive correlation on firm performance,
which supports the result of our research. Besides that, research done by

Organizational Performance
Page 158 of 184
Moideenkutty, Al-Lamki&Murty (2010) also shows evidence of human
resource practices is significant for organizational performance. It can be
observed that employee empowerment, selective staffing, performance
management and extensive training will lead to higher performance for an
organization. This is not surprising as human capital is an important source
for organization, thus human resource practices will be needed to sustain
and improve the competency of an organization.

Organizational Performance
Page 159 of 184
5.3 Implication of the study
The implication of study includes theoretical implication and managerial
implication.
5.3.1 Theoretical Implications
This research contributes to the existing literature by extending and testing
the key dimensions of human resource practices toward organizational
performance in hotel industry. This research contributes to the
organizations by suggesting ways to enhance their organizational
performance. In this study, organizational performance is evaluated by
corporate financial performance, occupancy rate, employee performance
and turnover rate. Thus, to have a better performance, management must
improve the performance of these four dimensions. Besides that, findings
from this study help management of organizations in enhancing
organizational performance by improving their selective hiring, training
and development, performance appraisal, and compensation.
Furthermore, this research indicated that compensation is the independent
variable which contribute the most to organizational performance if
compare to others. This means that organizations which hope to enhance
their organizational performance should focus more on compensation
strategy.
5.3.2 Managerial Implications
Through this research, it shows that selective hiring has a significant
positive relationship with organizational performance. According to the
study of Vlachos (2007) selecting hiring is choosing the right people for
the right job base on his skill and characteristic. Selecting hiring can
increase the likelihood of employee in fitting into new organization culture

Organizational Performance
Page 160 of 184
and climate. Besides that, selective hiring can ensure employees hired by
the organization are competent and this will increase the overall
performance of employee. Higher employee performance will lead to
higher organizational efficiency thus will have better organizational
performance.
Furthermore, training and development also shows significant positive
relationship with organizational performance. According to Raja (2011),
training and development is vital for organization to survive in the
challenging and changing world. Even though training and development is
invested on employees, however organization will gain most of the benefit
from this practice as organization is the end users. Management should
construct proper plans on training and development to improve knowledge,
skills, ability and others (KSAOs) of employees. This will increase
organizational efficiency and effectiveness thus increase overall
organizational performance.
Regarding to this research, it showed that performance appraisal have a
significant positive relationship with organizational performance.
According to Spence et al. (2010), performance appraisal should be
occurring annually or semi-annually to help with management decision.
Performance appraisal should be fit with performance management and the
ultimate goal is performance improvement but not rating employees only
in the year end. Performance appraisal will easily lead to misunderstanding
and dispute between managerial and non-managerial employees if there is
bias when processing performance appraisal or not proper words used. To
implement performance appraisal properly, Spence et al. (2010) suggested
that managers should view the raters as passive information processors.
Raters are required to evaluate in the absence of any real context. Besides
that, performance appraisal should be provided in the conditions that are
no consequences to raters themselves or anyone else.
From this research, it suggested that compensation have a strong positive
significant link with organizational performance. It was indicated that

Organizational Performance
Page 161 of 184
compensation is the most important element for organizations to enhance
organizational performance. According to Delaney and Huselid (as cited in
Tsai, 2005), organizations can use performance-related compensation to
enhance employees motivation and performance in order to improve
organizational performance. While a proper compensation system could
improve the organizational performance by focusing employees’ attention
and efforts to the areas where the company wants; on the other hand, an
ineffective compensation system will lead to spoil the morale and
motivation of employees. (Cecilia, 2003) Furthermore, performance-related
compensation should be performed based on performance appraisal to let
employees perceived that there is a fair compensation system.
Top management of organization should emphasize on the human resource
(HR) practices of the organization. Human resource practitioners should be
given support to formulate human resource practices which are suitable for
the organization. By identifying suitable human resource practices
organizational efficiency and effectiveness can be improved and this will
lead to higher organizational performance.

Organizational Performance
Page 162 of 184
5.4 Limitation of the study
In this research, we target Penang, Malacca and Pahang as our sampling location.
Thus the data collected from our research only cover these three areas, these data
only show the perception of employee on human resource practices in hotel
industry in these three states. The results from our research were not significant
enough to be generalized for the perception of employee of hotel industry in
whole Malaysia.
Our group faced a problem when conducting our survey in various hotels in these
three states. We are unable to collect all of the questionnaires which we
distributed to hotel employees. We only received 210 questionnaires through our
survey on these employees. Some of them refuse to respond to our questionnaires
while some of the questionnaires which we received are not valid. Thus we need
to rely on the data obtained from the number of questionnaires we received.
Other than that, the unavailability of sufficient resources has also brought some
obstacles our research. There are a lot of academic journals related to human
resource practices and organizational available online, however there are not
sufficient journals to support our research as our research background is on hotel
industry in Malaysia. There are not many journals which analyze on the effect of
human resource practices on hotel industry in Malaysia. In addition, journals
related to selective hiring and some of the dimensions of organizational
performance such as employee performance are difficult to be acquired from the
database online. This is because journals related to these topics are not been
researched by many researchers.
Lastly, the time and financial for this research is also a constraint for our study.
We need to fulfill our responsibility as university students while progressing with
our research. Midterm exams, assignments and our internship are example of tasks
which are needed to be completed by us as students. Thus we cannot be fully
devoted on conducting this research since all of the members of this research are
university students and do not have financial income to support in searching for
more in depth information and data.

Organizational Performance
Page 163 of 184
5.5 Recommendations for Future Research
Despite there are some limitations we had found when we are conducting this
research, our study still can completed and there are some recommendation that
we can provided for the future researchers who interested in this topic in order to
make some improvements to this study.
In this research, we had shown the relationship between employee perceptions
towards human resource practices in four dimension, training and development,
selective hiring, performance appraisal and compensation that will affect
organizational performances. Four dimensions that we used may not have
sufficient to evidence there are significant effects on organizational performance.
So, we strongly recommend for the future researchers to add up more independent
variables in their research to ensure that their research able to study this topic in
different perspectives, hence, more accurate results will be proposed.
Next, we concerned on the difficulties that we met while getting information from
our respondents. Although we used filter method to distribute our questionnaires
to the hotel employees but there were still lack of comprehensive opinions from
our respondents, they are still have some sort of conservative behaviors in
respondents while giving opinions to us. So, we suggesting future researchers to
use more than one method while distributing their questionnaires or getting
information from the respondents.
Other than that, we also recommend future researchers to build up mediating
mechanism in between human resource practices and organizational performances
to make the relationship more clearly and well understand in between human
resource practices and organizational performances.
Lastly, future researches related to this topic should be done with more coverage
areas in Malaysia. The result of this research will be more representative on the
perception of employee of hotel industry in whole Malaysia. With the
recommendation above, we hope that it can be devoted to the future study in this
field.

Organizational Performance
Page 164 of 184
5.6 Conclusion
In this chapter we begin with the summary of statistical analyses on descriptive
and inferential analyses of the result from chapter 4. Next we provide discussions
on the results of hypothesis tested in our research and validate our research
objective. Managerial implication is also discussed in this chapter to allow our
research to be practical for policy makers and practitioners in organizations.
Limitations that arise when conducting this research are also discussed in this
chapter. Lastly recommendations are presented to provide improvement for future
study.
As conclusion of this study, the results of our research showed that human
resource practices have significant positive relationship with organizational
performance. The human resource practices that are tested in our research, which
are selective hiring, training and development, performance appraisal and
compensation are applicable in enhancing the overall organizational performance
of hotel industry. Thus the result of our research should be used as guidance when
formulating human resource practices for organizations in hotel industry. Lastly,
the result of our study can be used as a reference for future researches on human
resource practices and organizational performance.

Organizational Performance
Page 165 of 184
References
Abu Mansor, N. N., Chakraborty, A. R., Tay, K. Y., Mahitapoglu, Z. (2011).
Determinants of performance management system in South East
Asia.Interdisciplinary Journal of Contemporary Research in
Business.3(2).Retrieved July 14, 2011.
AdeyinkaTella, Ayeni, C. O., Popoola, S.O..(2007). Work motivation, job
satisfaction, and organizational commitment of library personnel in
academic and research libraries in Oyo State, Nigeria.Library Philosophy
and Practice 2007. Retrieved October 18, 2011 from
http://unllib.unl.edu/LPP/tella2.pdf
Ahmad, S. Schroeder, R. G. (2003). The impact of human resource management
practices on operational performance: recognizing country and industry
differences. Journal of Operations Management. 21, 19-43. Retrieved
January 12, 2012.
Alexander, G. J., and Rogene A. Buchholz (1978) “Corporate social responsibility
and stock market performance.” Academy of Management Journal, 21 (3):
479-486.
Alleyne, P., Doherty, L., Greenidge, D. (2006). Approaches to hrm in the
Barbados hotel industry.International Journal of Contemporary
Hospitality Management. 18(2), 94-109. doi:
10.1108/09596110610646655
Alleyne, P., Doherty, L., Greenidge, D. (2006). Human resource management and
performance in the Barbados hotel industry.Hospitality Management. 25,
623-646. doi: 10.1016/j.ijhm.2005.05.001
Arain, M., Campbell, M. J., Cooper, L. C. & Lancaster, G. A. (2010). What is a
pilot or feasibility study? A review of current practice and editorial
policy.Medical Research Methodology.doi:10.1186/1471-2288-10-67

Organizational Performance
Page 166 of 184
Arthur Jr., W., & Bennett Jr., W (2003) Effectiveness of training in organizations:
A meta-analysis of design and evaluation features.Journal of Applied
Psychology. 88(2), 234-245
AzlanMohamad, A., Lo, M. C., Maw, K. L. (2009, October).Human resource
practices and organizational performance incentives as moderator.Journal
of Academic Research in Economics. 1. Retrieved December 12, 2011
from http://www.jare-
sh.com/downloads/num_1_issue_2_2009/abang_azlan.pdf
Bardi, James A. (2003). Hotel front office management. New Jersey: John Wiley
& Sons,Ltd.
Bataineh, M. T., Al-Hazaymeh, A. S. (2011). The role of human resources
practices on service quality: Jordanian King Abdullah University Hospital:
(case study). Interdisciplinary Journal of Contemporary Research in
Business. 3(7) Retrieved September 26, 2011
Berry, O. D. (2010). Working in a team-based culture is hard work for team
leaders. Retrieved July 14, 2011 from
http://quickbase.intuit.com/blog/2010/05/06/working-in-a-team-based-
culture-is-hard-work-for-team-leaders/
Billikopf, G. (2010). The negotiated performance appraisal model: enhancing
supervisor-subordinate communication and conflict resolution. Group
facilitation: a Research and Applications Journal. 10. Retrieved October
18, 2011.
Bonavia, T., Marin-Garcia, J. A. (2011).Integrating human resource management
into lean production and their impact on organizational
performance.International Journal of Manpower.32(8), 923-938. doi:
10.1108/01437721111181679
Carbery, R., Garavan, T. N., O’ Brien, F., & McDonnell, J. (2003).Predicting
Hotel 16 Managers’ Turnover Cognitions. Journal of Managerial
Psychology, 18(7), 649-679.

Organizational Performance
Page 167 of 184
Chand, M. (2010). The impact of hrm practices on service quality, customer
satisfaction and performance in the Indian hotel industry. The
International Journal of Human Resource Management. 21(4), 551-566.
doi: 10.1080/09585191003612059
Chand, M., &Katou, A. A. (2007). The impact of HRM practices on
organisational performance in the Indian hotel industry. Employee
Relations, 29(6), 576-594.
Chand, M., Anastasia, A. K. (2007). The impact of hrm practices on
organizational performance in the Indian hotel industry. 29(6), 576-594.
Retrieved January 11, 2012.doi: 10.1108/01425450710826096
Chin, J. T. (n.d.) Reward and incentive compensation and organisational
performance:evidence from the semiconductor industry. Retrieved January
10, 2012
Cho, S., Woods, R. H., Jang, S., Erdem, M., (2004). Measuring the impact of
human resource management practices on hospitality firms’ Performances,
International Journal of Hospitality Management.
Cho, Y. S. (2004). Examining the impact of human resource management: a
performance based analytic model.ProQuest Information and Learning
Company.Retrieved February 12, 2012.
Cochran, P. L., and R. A. Wood (1984) “Corporate social responsibility and
financial performance.” Academy of Management Journal, 27 (1): 42-56.
Currall, S. C., Towler, A. J., Judge, T. A., Kohn, L. (2005). Pay satisfaction and
organizational outcomes. Personnel Psychology. 58, 618-640
Denton, A. & White, B. (2000), Implementing a balanced-scorecard approach to
managing hotel operations, Cornell Hotel and Restaurant Administration
Quarterly, 41( 1), 94-107.
Fogleman, S. L. (2004). Creative compensation. Retrieved July 14, 2011 from
http://cnr.berkeley.edu/ucce50/ag-labor/7article/article33.htm

Organizational Performance
Page 168 of 184
Gberevbie, D. E. (2010).Organizational retention strategies and employee
performance of Zenith Bank on Nigeria.African Journal of Economic and
Management Studies, 1(1), 61-74
Ghafoor Khan, R. A., Ahmed Khan, F., Aslam Khan, M. (2011).Impact of training
and development on organizational performance.Global Journal of
Management and Business Research. 11(7), Retrieved January 11, 2012.
Ghani Azmi, I. A. (2010, February). Competency-based human resource practices
in Malaysian public sector organizations. African Journal of Business
Management, 4, 235-241. Retrieved October 15, 2011 from
http://www.academicjournals.org/ajbm/pdf/pdf2010/Feb/Azmi.pdf
Gray, C. (2009). Advantages and disadvantages of team-based
organizations.Small Business. Retrieved from
http://smallbusiness.chron.com/advantages-disadvantages-teambased-
organizations-25370.html
Gustafson, C. M. (2002). Employee turnover: a study of private clubs in the USA.
International Journal of Contemporary Hospitality Management, 14(3),
106-113
Hemdi, M. A. (2006). Turnover Intentions of Hotel Employees: The Role of
Human Resource Management Practices, Trust in Organisation, and
Affective Commitment.(Unpublished PHD thesis, Penang: UniversitiSains
Malaysia).
Heneman, H., & Judge, T. (2009). Staffing organization s (6th ed.). New York:
McGraw Hill.
Hillman, A. J., and G. D. Keim (2001) “Shareholder value, stakeholder
management, and social issues: What’s the bottom line?” Strategic
Management Journal, 22(2): 125-139.
Hinkin, T., & Tracey, B. (2000). The Cost of Turnover: Putting the Price Learning
Curve. Cornell Hotel and Restaurant Administration Quarterly, 14-21.

Organizational Performance
Page 169 of 184
Huselid, M. (1995). The impact of human resource management practices on
turnover, productivity, and corporate financial performance. Academy of
Management Journal. 38(3), 635-872.
Idemobi, E. I., Onyeizugbe, C. U., Akpunonu, E. O. (2011). Compensation
management as tool for improving organizational performance in the
public sectors: A study of the civil service of Anambra State of Nigeria,
Sacha Journal of Policy and Strategic Studies, 1, 109-120, Retrieved
October 10, 2011 from
http://www.sachajournals.com/documents/Idemobi002SJPSS.pdf
Ittner, C. D., Larcker, D. F., Meyer, M. W. (1997).Performance, compensation
and the balanced scorecard. Retrieved September 19, 2011
K. Namasivayam, Li, M., Zhao, X. Y. (2007). An investigation of the
relationships between compensation practices and firm performance in the
US hotel industry, 26, 574-587.Retrieved October 10, 2011 from
ScienceDirect Journal Database.
Kato, T., Long, C. (2005).Executives compensation, firm performance and
corporate governance in China: evidence from firms listed in the Shanghai
and Shenzhen stock exchanges. Iza.Retrieved August 14, 2011.
Katou A. A., (2008). Measuring the impact of hrm on organizational
performance.Journal of Industrial Engineering and Management, 1, 117-
142, Retrieved October 20, 2011, doi: 10.3926/jiem.2008.v1n2.p119-142
Khan, M. A. (2010).Effects of human resource management practices on
organizational performance- an empirical study of oil and gas industry in
Pakistan.European Journal of Economics, Finance and Administrative
Sciences. (24). Retrieved August 17, 2011
Kondrasuk, J. N. (2011). The ideal performance appraisal is a format, not a form.
Academy of Strategic Management.10(1).Retrieved September 15, 2011.

Organizational Performance
Page 170 of 184
Lee, C. (1985). Increasing performance appraisal effectiveness: Matching task
types, appraisal process, and rater training. Academy of Management
Review. 10(2), 322-331. Retrieved September 15, 2011.
Lewis, C., Podgursky, M. (n.d.) The pros and cons of performance-based
compensation. Retrieved October 2, 2011
Lopez, S. P., Peon, J. M. M., Ordas, C. J. V. (2007). Human resources
management as a determining factor in organizational learning. Retrieved
July 14, 2011
Malaysian Association of Hotels (2011).Statistic Report.Malaysian Association of
Hotels. Retrieved from http://www.hotels.org.my/index.php/member-
section/statistics-report
Malhotra, N.K. (2007). Marketing Research: An Applied Orientation (5th ed.).
Upper Saddle River, NJ: Pearson/ Prentice Hall, 2007
Management Study Guide.(2008). Employee empowerment – good or
bad.Management Study Guide. Retrieved July 14, 2011 from
http://www.managementstudyguide.com/employee-empowerment.htm
McGuire, J. B., A. Sundgren, and T. Schneeweis (1988) Corporate social
responsibility and firm financial performance. Academy of Management
Journal, 31 (4): 854-872.
Mess, H., (2004).HRM best practice.Otago Management Graduate Review. 2,
Retrieved September 20, 2011 from
http://www.business.otago.ac.nz/mgmt/research/omgr/04mess.pdf
Milkovich, G.T., Newman, J.M. (2008). Compensation (9th ed.). New York:
McGraww-Hill.
Mindtools (2011).Performance management and KPIs linking activities to vision
and strategy. Retrieved July 28, 2011 from
http://www.mindtools.com/pages/article/newTMM_87.htm

Organizational Performance
Page 171 of 184
Moideenkutty, U., Al- Lamki, A., & Murthy, Y. S. R. (2010) HRM practices and
organizational performance in Oman. Personnel Review. 40(2), 239-
251doi: 10.1108/00483481111106101
Mondy, R.W. (2008). Human Resource Management (10th ed.). New Jersey:
Pearson Prentice Hall.
Nayyab, H. H., Hamid, M., Naseer, F., Iqbal, M. (2011). The impact of hrm
practices on the organizational performance The study of banking sector in
Okara, Punjab (Pakistan). Interdisciplinary Journal of Contemporary
Research in Business. 3(3), Retrieved October 18, 2011.
Off-the-job. (n. d.) In BusinessDictionary online dictionary. Retrieved from
http://www.businessdictionary.com/definition/off-the-job-training.html
Oladipo, J. A., Abdulkadir, D. S. (2011). Strategic human resource management
and organizational performance in the Nigerian manufacturing sector: an
empirical investigation. International Journal of Business and
Management.6(9).doi: 10.5539/ijbm.v6n9p46
On-the-job. (n. d.) In BusinessDictionary online dictionary. Retrieved from
http://www.businessdictionary.com/definition/on-the-job-training-
OJT.html
Osman, I. Ho, T. C. F., Galang, M. C. (2011). The relationship between human
resource practices and firm performance: an empirical assessment of firms
in Malaysia. Business Strategy Series. 12, 41-48. doi:
10.1108/17515631111100412
Pearson’s correlation coefficient. (July 13). Retrieved February 26, 2012, from
http://hsc.uwe.ac.uk/dataanalysis/quantInfAssPear.asp
Pfeffer, J. (1998). Seven practices of successful organizations. Carlifornia
Management Review.40(2).
Pfeffer, J.(1998). The human equation: Building profits by putting people first.
Harvard Business School Press, Boston.

Organizational Performance
Page 172 of 184
Phonsanam, S. T. (2010). Total compensation practices and their relationship to
hospitality employee retention. University Libraries.561 Retrieved
October 2, 2011 from
http://digitalcommons.library.unlv.edu/thesesdissertations/561
Productivity report 2010/2011. (2011, May). Retrieved September 24, 2011, from
http://www.mpc.gov.my/mpc/images/file/ProductivityReport.pdf
Public Record Office Victoria (2010).Key performance indicators.Public Record
Office Victoria. Retrieved from http://prov.vic.gov.au/wp-
content/uploads/2011/05/1010g3.pdf
Ram, P., Prabhakar, G.V. (2010). Determinants of pay satisfaction: a study of the
hotel industry in Jordan. European Journal of Social Sciences 14(3).
Retrieved August 21, 2011
Ramley Alan, S. Z., Radzi, S. M., Hemdi, M. A., Othman, Z. (n.d.). An empirical
assessment of hotel managers’ turnover intentions: the impact of
organizational justice. Retrieved from
http://www.onlinereview.segi.edu.my/chapters/vol3_sr1_art1.pdf
Razalli, M. R. (2008). The consequences of service operations practice and
service responsiveness on hotel performance: examining hotels in
Malaysia. Retrieved September 2011
Royalty, J (1996). The effect of job turnover on the training of men and women,
industrial and labour relations review. 49, No.3, pp 506-21.
Rynes, S. L., Gerhart, B., Minette, K. A. (2004). The importance of pay in
employee motivation: discrepancies between what people say and what
they do. Wiley Periodicals Incorporate. 43(4), 381-394. doi:
10.1002/hrm.20031
Schneier, C.E., Beatty, R. W. (1978). The influence of role prescriptions on the
performance appraisal process.Academy of Management Journal. 21(1),
129-135. Retrieved September 15, 2011.

Organizational Performance
Page 173 of 184
Sekaran, U., &Bougie, R. (2010).Research methods for business: A skill building
approach(5th ed.). Chichester, West Sussex: John Wiley & Sons, Inc.
Selden, S., Jessica, E. S. (2011). Performance management and appraisal in
human service organizations: management and staff perspectives. Public
Personnel Management.40(3).Retrieved October 18, 2011.
Simpson, G. L. (2001). Performance appraisal- an important managerial
responsibility.The Mansis Development Corporation. Retrieved from
http://www.managerwise.com/article.phtml?id=161
Siti-Nabiha, A. K. (2010). Performance management system at gas company.
Asian Case Research Journal.14(1), 95-115. doi:
10.1142/S0218927510001325
Sohail, N., Tanveer, Y., Muneer, A. (2011). Human resource practices as
performance tool in telecom industry of Pakistan. Interdisciplinary
Journal of Contemporary Research in Business.3(7).Retrieved January 28,
2012.
Spence, J. R., Keeping, L. (2011). Conscious rating distortion in performance
appraisal: a review, commentary and proposed framework for research.
Science Directs. 21, 85-95. doi:10.1016/j.hrmr.2010.09.013
Sturman, M.C. (2006). Using your pay system to improve employees’
performance: How you pay makes a difference.Cornell Hospitality Report.
6(13), 1-16.
Sudarsan, A. (2009). Performance appraisal systems: a survey of organizational
views. The lcfai University Journal of Organizational Behavior. 8(1),
Retrieved September 15, 2011
Sudarsan, A. (2009). Performance appraisal systems: a survey of organizational
views. LcfaiUniversity Journal of Organizational Behavior.8(1) Retrieved
September 8, 2011

Organizational Performance
Page 174 of 184
Sudin, S. (2004). Human resource practices and organizational performance:
review, synthesis and research implication. International Business
Management Conference.Retrieved October 18, 2011.
Summary findings on accommodation (n.d.) Retrieved September 25, 2011, from
http://www.statistics.gov.my/portal/images/stories/files/LatestReleases/fin
dings/02Summary_Accomodation_2010_BI.pdf
Summary findings on domestic tourism survey (n.d.). Retrieved September 25,
2011, from
http://www.statistics.gov.my/portal/images/stories/files/LatestReleases/fin
dings/03Ringkasan_2010_BI.pdf
Swanson, R. (1995). Performance is the key. Human Resource Development
Quarterly, 6(2), 221-235.
Tabassi, A. A., Abu Bakar, A.H. (2009). Training, motivation, and performance:
The case of human resource management in construction projects in
Mashhad, Iran. International Journal of Project Management,27, 471-480,
Retrieved October 18, 2011 from ScienceDirect database
Ton, Z., &Huckman, R. S. (2008).Managing the Impact of Employee Turnover on
Performance: The Role of Process Conformance.Organization Science,
19(1), 56-68
Torres, E.N. & Adler, H. (2011).Choosing a Compensation Strategy in the Hotel
Industry: An Exploratory Study. Retrieved October 19, 2011, from
http://scholarworks.umass.edu/cgi/viewcontent.cgi?article=1024&context=
gradconf_hospitality&sei-
redir=1&referer=http%3A%2F%2Fwww.google.com.my%2Furl%3Fsa%3
Dt%26rct%3Dj%26q%3Dchoosing%2520a%2520compensation%2520str
ategy%2520in%2520the%2520hotel%2520industry%253A%2520an%252
0exploratory%2520study%26source%3Dweb%26cd%3D1%26ved%3D0C
DAQFjAA%26url%3Dhttp%253A%252F%252Fscholarworks.umass.edu

Organizational Performance
Page 175 of 184
%252Fcgi%252Fviewcontent.cgi%253Farticle%253D1024%2526context
%253Dgradconf_hospitality%26ei%3DX5pcT62XGofirAenhMjlBw%26u
sg%3DAFQjCNH7hfL1k96V-
Diim8PxES_q6BZ16g#search=%22choosing%20compensation%20strateg
y%20hotel%20industry%3A%20an%20exploratory%20study%22
Tourism Malaysia (2012).Chapter 10: Revving up the tourism industry. Retrieved
from http://www.kpkk.gov.my/pdf/tahukah_anda/ETP_bi/chapter10.pdf
Tourism Malaysia. (2011). Average occupancy rates(AOR) of hotels by states
2007/2008. Retrieved from
http://corporate.tourism.gov.my/images/research/pdf/2008/AOR/AOR_20
07_2008.pdf
Tourism Malaysia. (2011). Average occupancy rates(AOR) of hotels by states
2008/2009. Retrieved from
http://corporate.tourism.gov.my/images/research/pdf/2009/AOR/AOR_20
08_2009.pdf
Tourism Malaysia. (2011). Average occupancy rates(AOR) of hotels by states
2009/2010. Retrieved from
http://corporate.tourism.gov.my/images/research/pdf/2010/AOR/AOR_20
09_2010.pdf
Tourism Malaysia. (2011). Malaysia tourist arrivals 2008.Retrieved from
http://corporate.tourism.gov.my/images/research/pdf/2008/TouristArrivals
_Kumulatif_2008.pdf
Tourism Malaysia. (2011). Malaysia tourist arrivals 2009.Retrieved from
http://corporate.tourism.gov.my/images/research/pdf/2009/TouristArrivals
_kumulatif_2009.pdf
Tourism Malaysia. (2011). Malaysia tourist arrivals 2010.Retrieved from
http://corporate.tourism.gov.my/images/research/pdf/2010/TouristArrivals
_kumulatif_2010.pdf

Organizational Performance
Page 176 of 184
Tourists arrivals and receipts to Malaysia (n.d.). Retrieved September 25, 2011,
from http://corporate.tourism.gov.my/
Tseng, Y. F., & Lee, T. Z. (2009). Comparing appropriate decision support of
human resource practices on organizational performance with DEA/AHP
model. Expert Systems with Application. 36. doi:
10.1016/j.eswa.2008.07.066
Vemic, J. (2007). Employee training and development and the learning
organization.Economics and Organization. 4(2), 209-216. Retrieved from
http://facta.junis.ni.ac.rs/eao/eao200702/eao200702-13.pdf
Vlachos, I. (2008). The effect of human resource practices on organizational
performance: evidence from Greece. The International Journal of Human
Resource Management. 19(1), 74-97. doi: 10.1080/09585190701763933
Vlachos, I. P. (2009).The effects of human resource practices on firm growth.Int.
Journal of Business Science and Applied Management. 4, Retrieved
September 21, 2011 from http://organized-change-
consultancy.wikispaces.com/file/view/HRD+Growth.pdf
Wan, D., Kok, V., & Ong, C. H. (2002).Strategic Human Resource Management
and Organizational Performance in Singapore.Sage Publications.
Wang, Y. (2005). Strategic employee training and development in chinese luxury
hotels. Tourismos: An International Multidisciplinary Journal of Tourism.
1(1), 111-118. Retrieved December 30, 2011 from http://mpra.ub.uni-
muenchen.de/25405/
Werbel J.D. and DeMarie, S.M., (2005), "Aligning Strategic Human Rersource
Management and Person Environment Fit", Human Resource Management
review, 15: 242-262
Williams, C.L. (2006). Key Components of a Good People Strategy. Retrieved
January 2, 2012 from http://www.clwill.com/wp-

Organizational Performance
Page 177 of 184
content/uploads/Key%20Components%20of%20a%20Good%20People%2
0Strategy.pdf
Williams, S. L., Hummert, M. L. (1990). Evaluating performance appraisal
instrument dimensions using construct analysis. The Journal of Business
Communication.Retrieved September 15, 2011.
Wong, C. H., Tan, B. I., Loke, S. P., Lee, V. H. (2010). The impact of hrm
practices on km: a conceptual model. Australian Journal of Basic and
Applied Sciences. 4(12), 6281-6291.
Wright, P. M. & Kehoe, R. R. (2007). Human Resource Practices and
organizational commitment: A deeper examination. Center for Advance
Human Resource Studies. 472. Retrieved January 4, 2012 from
http://digitalcommons.ilr.cornell.edu/cahrswp/472
Yee, C. C., Chen, Y. Y. (2009). Performance appraisal system using multifactorial
evaluation model.World Academy of Science, Engineering and Technology.
53
Zacharatos, A. Hershcovis, M. S., Turner, N., Barling, J. (2005). Human resource
management in the North American automotive industry.Emerald Group
Publishing Limited. 36(2), 231-254. Doi: 10.1108/00483480710726127
Zhai, X., Liu, A. (2010).The relationship between human resource practices and
organizational performance in the Chinese construction enterprises.The
HKU Scholars Hub. Retrieved October 18, 2011 from
http://hdl.handle.net/10722/136496
Zikmund, W. G., Babin, B. J., Carr, J. C., & Griffin, M. (2010).Business research
methods (8th ed.). New York: South-Western/Cengage Learning.
Zingheim, P.K. & Schuster, J. R. (2008). Developing total pay offers for high
performers. Compensation & Benefits Review, 40, 55-59.

Organizational Performance
Page 178 of 184
UniversitiTunku Abdul Rahman
A Perception of Employees on Human Resource Practices
towards Organizational performance in Hotel Industry
Survey Questionnaires
_________________________________________________
Dear Respondents:
The purpose of this survey is to examine the phenomenon of human resource
practices in relation to organizational performance in hotel industry. This study is
also looking at to what extent organizational performance can be influenced by
human resource practices. Please answer all questions to the best knowledge of
your understanding. There are no wrong responses to any of these statements. All
responses provided are solely for academic purposes.
__________________________________________________________________
Content and instructions:
1. This questionnaire consists of three sections that comprises of
demographic profile, human resource management practices and
organizational performance.
2. Please answer ALL questions in ALL sections.
3. This will only takes 15 to 20 minutes.
4. Please feel free to share your comment in the space provided. The contents
of this questionnaire will be kept highly confidential.

Organizational Performance
Page 179 of 184
Section A: Demographic Profile
� In this section, we are interested in your background in brief. Please
�your answer and your answer will be kept strictly confidential.
1. Gender
� Male
2. Age
3. Ethic Group
� Malay
� Indian
4. Education Level:
5. Location of work
� Penang
6. Years of employment
7. Monthly income:
8. Department that you are working in
� Female
� Below 25
� 46 – 55 years old
� 26 – 35 years old
� More than 55 years old
� 36 – 45 years old
� Chinese
� Others, please specify: _________________
� SPM/STPM
� Bachelor Degree
� PhD
� Less than RM 2000
� RM 3001 to RM 4000
� More than RM 5000
� Melaka � Pahang
� Less than one year
� 3 – 5 years � 1 – 3 years
� More than 5 years
� Diploma/Advanced Diploma
� Master
� Other qualification, please specify: ________
� RM 2000 to RM 3000
� RM 4001 to RM 5000
� Housekeeping Department
� Food and Beverage Department
� Human Resource Department
� Sales Department
� Accounting Department
� Security Department
� Chief Department
� Chief Telecommunication Department
� Controller Department
� Other department, please
specify: _________________

Organizational Performance
Page 180 of 184
Section B: Human Resource Management (HRM) Practices
This section is seeking your opinion regarding human resource management
practices employed in your company. Respondents are required to indicate to what
extend you agreed or disagreed with each statement. A 5-point Likert scale will be
used in this section. Please circle one number to represent your opinion towards
statements provided. The descriptions of 5-point Likert scale are as follow:
No Questions
Str
on
gly
Dis
ag
ree
Dis
ag
ree
Neu
tra
l
Ag
ree
Str
on
gly
Ag
ree
B1 Selective Hiring
SH1 This organization regards selecting best
candidates to fill up vacancy as an important
task.
1 2 3 4 5
SH2 This organization employs extensive selection
process whenever there is vacancy in the
organization (e.g: assessment centers, ability
and aptitude tests, interview and multi-level
resumes screening process).
1 2 3 4 5
SH3 This organization uses consultant when hiring
personnel
1 2 3 4 5
SH4 During recruitment and selection process,
interview panels are being used to select the
most competent candidate.
1 2 3 4 5
SH5 There will not be any bias in the hiring and
selection processes of this organization.
1 2 3 4 5
SH6 This organization continuously improve and
review recruitment and selection processes
1 2 3 4 5
Strongly Disagree (SD) Disagree (D) Neutral (N) Agree (A) Strongly Agree (SA)
1 2 3 4 5

Organizational Performance
Page 181 of 184
No Questions
Str
on
gly
Dis
ag
ree
Dis
ag
ree
Neu
tra
l
Ag
ree
Str
on
gly
Ag
ree
B2 Training and Development
TD1 This organization provides every employee
with training opportunities to improve their
knowledge, skill, abilities and others.
1 2 3 4 5
TD2 Training program organized by this
organization is able to enhance employee
competency
1 2 3 4 5
TD3 This organization provides different kinds of
training program for their employees.
1 2 3 4 5
TD4 This organization frequently organize training
program for their employee.
1 2 3 4 5
TD5 This organization organizes on-the-job or off-
the-job training for their employees.
1 2 3 4 5
TD6 This organization emphasize on long term
development for employees training plans.
1 2 3 4 5
No Questions S
tro
ng
ly
Dis
ag
ree
Dis
ag
ree
Neu
tra
l
Ag
ree
Str
on
gly
Ag
ree
B3 Performance Appraisal
PA1 Performance appraisal is a part of
performance management system.
1 2 3 4 5
PA2 This organization allows involvement and
participation of employees in the entire
performance appraisal process.
1 2 3 4 5
PA3 This organization uses performance appraisal
process to make sure every member of
organization achieve goals established by top
management.
1 2 3 4 5
PA4 Performance appraisal process employed by
this organization is able to point out areas
which I need to improve.
1 2 3 4 5
PA5 My supervisor will provide feedback to me
during and at the end of performance
appraisal process.
1 2 3 4 5
PA6 This organization will revise employees’
compensation plan after performance
appraisal process.
1 2 3 4 5

Organizational Performance
Page 182 of 184
No Questions
Str
on
gly
Dis
ag
ree
Dis
ag
ree
Neu
tra
l
Ag
ree
Str
on
gly
Ag
ree
B4 Compensation
C1 Employee regards comprehensive
compensation package of employment as
direct compensation (salary), indirect
compensation (insurance) and non-financial
compensation (flexible working hour) rather
than a simple pay and benefit package.
1 2 3 4 5
C2 This organization use incentive to boost
individual performance. E.g: Bonus and
allowances.
1 2 3 4 5
C3 This organization constantly reviews and
improves the employees’ working schedule.
1 2 3 4 5
C4 This organization provides comparable
compensation for similar position at another
hotel.
1 2 3 4 5
C5 This organization uses compensation system
to attract more and better candidates.
1 2 3 4 5
C6 This organization has a well-designed and
competitive rewards and compensation system
that are able to retain talented employee.
1 2 3 4 5
C7 This organization integrates compensation
plan with its mission and goals in order to
gain or sustain competitive advantages over its
rivals.
1 2 3 4 5

Organizational Performance
Page 183 of 184
Section C: Organizational Performance
This section is seeking your opinion regarding organizational performance in
your company. Respondents are required to indicate to what extend you agreed or
disagreed with each statement. A 5-point Likert scale will be used in this section.
Please circle one number to represent your opinion towards statements provided.
The descriptions of 5-point Likert scale are as follow:
No Questions
Str
on
gly
Dis
ag
ree
Dis
ag
ree
Neu
tra
l
Ag
ree
Str
on
gly
Ag
ree
OP Organizational Performance
OP1 This organization evaluates organizational
performance based on financial performance.
1 2 3 4 5
OP2 Good service quality provided by employees to
tourists will help to drive financial performance
of organization.
1 2 3 4 5
OP3 High occupancy rate in this hotel is used to
measure organizational performance as more
revenue is being generated.
1 2 3 4 5
OP4 Occupancy rate reflect the ability of employees
in attracting more tourists to stay in the hotel.
1 2 3 4 5
OP5 An increase in my own performance in the
organization will lead to increase in salary as
organizational performance improved overtime.
1 2 3 4 5
OP6 Key Performance Indicator (KPI) is able to help
the organization to define and measure progress
towards organizational goals and objectives.
1 2 3 4 5
OP7 Good and effectives human resource practices
employed by this organization are able to reduce
turnover rate of the organization.
1 2 3 4 5
OP8 Turnover that happens in this organization will
disrupt work of existing employees and incur
cost to the organization.
1 2 3 4 5
Strongly Disagree (SD) Disagree (D) Neutral (N) Agree (A) Strongly Agree (SA)
1 2 3 4 5

Organizational Performance
Page 184 of 184