a periodically-forced mathematical model for the seasonal
TRANSCRIPT
Bull Math Biol (2012) 74:1098–1124DOI 10.1007/s11538-011-9710-0
O R I G I NA L A RT I C L E
A Periodically-Forced Mathematical Modelfor the Seasonal Dynamics of Malaria in Mosquitoes
Nakul Chitnis · Diggory Hardy · Thomas Smith
Received: 1 March 2011 / Accepted: 24 November 2011 / Published online: 5 January 2012© The Author(s) 2011. This article is published with open access at Springerlink.com
Abstract We describe and analyze a periodically-forced difference equation modelfor malaria in mosquitoes that captures the effects of seasonality and allows themosquitoes to feed on a heterogeneous population of hosts. We numerically showthe existence of a unique globally asymptotically stable periodic orbit and calculateperiodic orbits of field-measurable quantities that measure malaria transmission. Weintegrate this model with an individual-based stochastic simulation model for malariain humans to compare the effects of insecticide-treated nets (ITNs) and indoor resid-ual spraying (IRS) in reducing malaria transmission, prevalence, and incidence. Weshow that ITNs are more effective than IRS in reducing transmission and prevalencethough IRS would achieve its maximal effects within 2 years while ITNs would needtwo mass distribution campaigns over several years to do so. Furthermore, the com-bination of both interventions is more effective than either intervention alone. How-ever, although these interventions reduce transmission and prevalence, they can leadto increased clinical malaria; and all three malaria indicators return to preinterventionlevels within 3 years after the interventions are withdrawn.
Keywords Mathematical model · Malaria
1 Introduction
Malaria is an infectious disease caused by the Plasmodium parasite and transmit-ted between humans by the bites of female Anopheles mosquitoes. Malaria remains
N. Chitnis (�) · D. Hardy · T. SmithDepartment of Epidemiology and Public Health, Swiss Tropical and Public Health Institute,Socinstrasse 57, Postfach, 4002, Basel, Switzerlande-mail: [email protected]
N. Chitnis · D. Hardy · T. SmithUniversität Basel, Basel, Switzerland

A Periodically-Forced Mathematical Model 1099
a serious public health problem with 190–311 million cases and over 863,000–1,003,000 deaths per year (World Health Organization 2009). The Roll Back MalariaPartnership in the Global Malaria Action Plan (2008) has called for increased cov-erage of the world’s population at risk of malaria with malaria control interven-tions such as the use of insecticide-treated nets (ITNs), indoor residual spraying(IRS), and prompt treatment of infected individuals with effective medication suchas artemisinin-based combination therapies (ACTs). Considerable funding has nowbeen pledged by national governments and international funding agencies to reducethe burden of malaria disease, with the eventual goal of interrupting transmission anderadicating malaria.
Mathematical modeling has an important role to play in the planning of malariacontrol and elimination activities (Chitnis et al. 2010b; The malERA ConsultativeGroup on Modeling 2011). Randomized control trials and malaria indicator surveysprovide evidence on the effects of interventions from particular settings but cannotcapture the variety of conditions where malaria transmission takes place. Mathemati-cal models allow us to combine this data with our knowledge of the general processesof malaria transmission to understand and predict effects of malaria control in multi-ple settings. They allow us to answer questions that could be impractical or unethicalto answer with field studies. Mathematical modeling of malaria can help us to quan-tify the effects of control strategies, compare different strategies in different settings,optimize the deployment of strategies, and help to devise target product profiles ofpotential new strategies.
Ronald Ross developed the first mathematical model for understanding malariatransmission (Ross 1905). Macdonald combined Ross’s more famous differentialequation model (Ross 1911), with epidemiological (Macdonald 1950) and ento-mological (Macdonald 1952) field data. His analysis drove much of the theorybehind the global malaria eradication in the 1950s and 1960s that targeted adultmosquitoes. Since then, multiple models have been developed for malaria, includ-ing deterministic compartmental models (Anderson and May 1991; Aron 1988;Aron and May 1982; Chitnis et al. 2006; Cosner et al. 2009; Ngwa and Shu 2000;Smith and McKenzie 2004) and stochastic (Dietz et al. 1974) individual-based mod-els (Eckhoff 2011; Griffin et al. 2010; McKenzie et al. 1998; Smith et al. 2006;White et al. 2011).
Saul et al. (1990) introduced a feeding cycle model of mosquito behavior that morefinely captured the interactions of mosquitoes with their hosts and the environment.Saul (2003), Killeen and Smith (2007), Le Menach et al. (2007), and Chitnis et al.(2008, 2010a) extended this model to look at the effects of interventions such as ITNs,IRS, and zooprophylaxis on malaria control. We now extend the model by Chitnis etal. (2008) to include the effects of seasonality on malaria in mosquitoes.
In many parts of the world, malaria transmission is not constant but climate-dependent and varies seasonally over the year. The emergence of adult mosquitoesdepends on the availability of larval habitats which varies with rainfall and hu-midity. The development time of the parasite within the mosquito (extrinsic incu-bation period) and the time between feeding for mosquitoes depend on the am-bient temperature. Adult survival depends on relative humidity. In most parts ofthe world that are affected by malaria, rainfall, and to a lesser extent, temperature,
1100 N. Chitnis et al.
vary seasonally. Consequently, malaria transmission also varies seasonally, leadingto a peak of transmission in certain months and, in some locations, months thatare relatively free of malaria transmission. This affects, among other things, theoptimum timing of interventions such as IRS with a short-acting insecticide. Mostmathematical models of malaria that include the effects of seasonality assume si-nusoidal forcing (Aron and May 1982; Lou and Zhao 2010) though others havelinked models to climate (Eckhoff 2011; Griffin et al. 2010; White et al. 2011;Hoshen and Morse 2004).
We extend our previously published linear difference equation model (Chitnis etal. 2008) to allow most of the parameters to be periodic sequences of time with aperiod of 1 year (365 days). Though we fix the period at 1 year, we allow the pat-tern of these sequences within the year to be arbitrary. Since the model for malaria inmosquitoes is linear and considers the infectivity of humans to mosquitoes as a pa-rameter, we integrate this model with a stochastic individual-based simulation modelfor falciparum malaria in humans (Smith et al. 2008) to model the nonlinear effectsof the full malaria cycle.
This work is part of a larger project building a comprehensive model for malariawith the objectives of determining target product profiles for new interventions, anddevising optimal deployment strategies for current and future control interventions.Within these goals, this paper serves to lay the mathematical framework of theperiodically-forced model for malaria in mosquitoes, and its integration within theoverall simulation model for malaria. The model includes different aspects of thenatural history of Plasmodium falciparum in humans and in mosquitoes, effects ofthe mosquito life and feeding cycle, effects of human demography, and of the healthsystem.
The models for malaria in humans (Smith et al. 2006, 2008) have already beenused to investigate the effects of vaccines (Penny et al. 2008; Smith et al. 2012) andintermittent preventive treatment (Ross et al. 2008, 2011) in reducing malaria mor-bidity and mortality. The autonomous model for malaria in mosquitoes has been usedto compare the effects of vector control interventions, such as ITNs (Chitnis et al.2008), IRS, and their combinations (Chitnis et al. 2010a), in reducing malaria trans-mission. Here, we extend the work in Chitnis et al. (2008) to a nonautonomous modelby including seasonality and transient dynamics. This extension enables us to capturethe effects of variations in transmission over the year, the decay of effectiveness ofinterventions, and more importantly, incorporate the dynamics of malaria in humans.This allows us to model the full malaria cycle and determine the effects of interven-tions on human disease. We note that while the model for malaria in mosquitoes isindependent of the Plasmodium species, the model for malaria in humans focuses ononly P. falciparum malaria.
We first describe the formulation of the model, its assumptions, and its mathemat-ical properties. We then describe its integration with the individual-based stochasticsimulation model for malaria in humans and show a numerical example of the effectsof ITNs and IRS in reducing malaria transmission and disease.
A Periodically-Forced Mathematical Model 1101
2 Description of Model
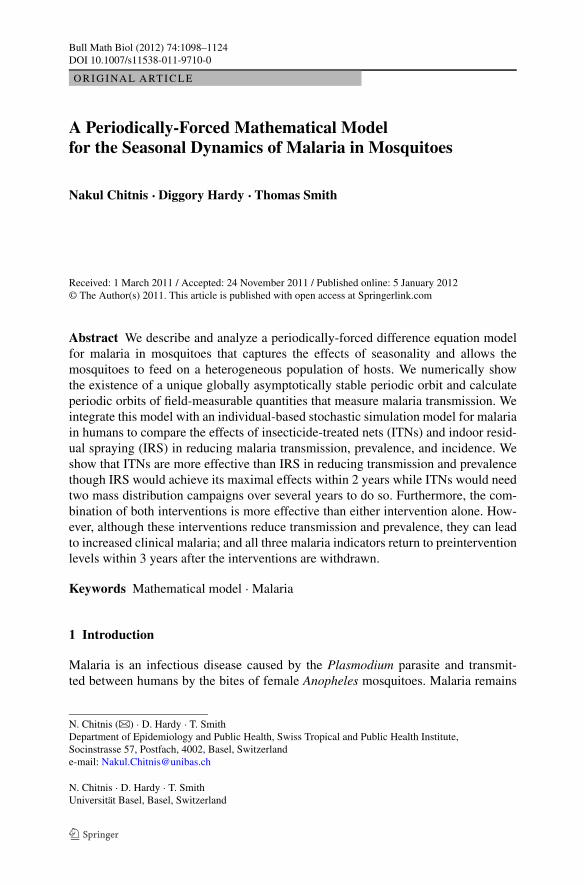
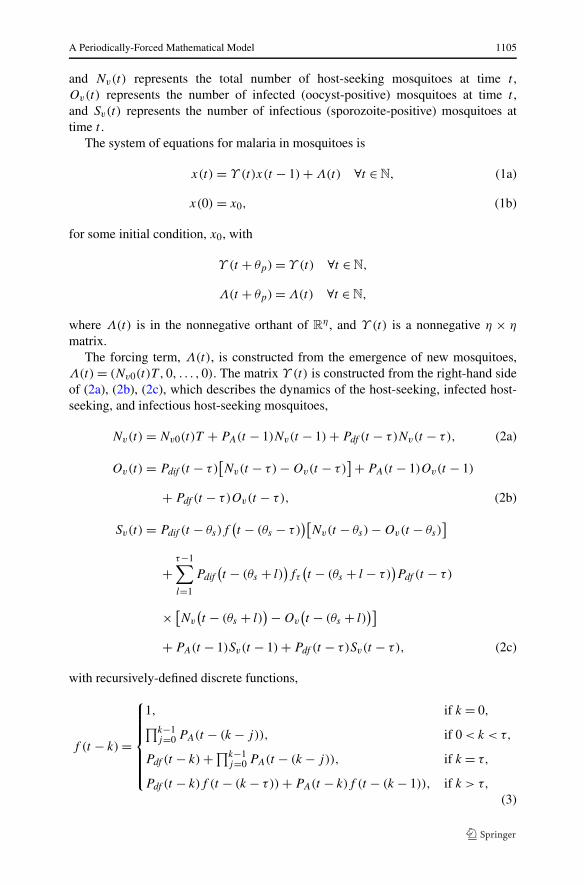
We base the periodically forced model of malaria transmission in mosquitoes onthe autonomous model defined earlier (Chitnis et al. 2008). After emergence froma breeding site, mosquitoes mate and the females search for blood meals which arenecessary for egg development. After encountering and biting a host, the femalemosquito finds a resting place where it digests the blood and evaporates water. Theresting time is temperature dependent (shorter at higher temperatures) and is usually2 to 3 days in tropical areas. After digesting the blood, the mosquito flies in searchof a breeding site to lay eggs, before seeking a host again to repeat the feeding cycle.Figure 1(a) shows a cartoon of the feeding cycle. Usually, mosquitoes begin host-seeking at the same time every night. If they are unsuccessful in biting, they restthrough the day and try again the next night. The probability that a mosquito is suc-cessful in completing a feeding cycle depends on a variety of factors, including innateheterogeneities in the hosts, the quality, construction and location of their houses ordwellings, and their use of malaria or mosquito control interventions (Gillies 1988).
We model each feeding cycle of the mosquito as shown in Fig. 1(b) where an adultfemale mosquito can be in one of five states, A–E. Four of these states, B–E, dependon the type of host that the mosquito feeds on. We label these states with a subscript i
with 1 ≤ i ≤ n, where i denotes the type of host, and n is the total number of differenttypes of hosts.
We let τ be the time it takes a mosquito to return to host-seeking, A, after it hasencountered a host, Bi (provided that the mosquito is still alive). This is the partialduration of the feeding cycle: it is the time it takes a mosquito to complete a feedingcycle, excluding the time it needs to find a host from when it starts host-seeking.
Humans infected with malaria are infective to mosquitoes if they have gameto-cytes in their blood. If a mosquito feeds on an any human of host type i, there isa probability, Kvi(t), that the mosquito will ingest both male and female gameto-cytes, and that they will fuse in the mosquito’s stomach to form a zygote, whichwould develop into an oocyst that releases sporozoites. The mosquito is infective tohumans when it has sporozoites in its salivary glands. The temperature-dependenttime it takes an infected mosquito to become infective (be sporozoite positive) is theextrinsic incubation period, θs (usually 10 to 12 days in tropical areas).
2.1 Model Assumptions
In tropical environments, the parameter that is most affected by the seasonality inclimate, and especially rainfall, is the emergence rate of mosquitoes, Nv0 (see Ta-ble 1 for a full list of parameters). An increased emergence rate leads to a highernumber of host-seeking mosquitoes, resulting in increased malaria transmission frommosquitoes to humans. Correspondingly, the transmission of malaria from humans tomosquitoes is also greater. Therefore, both, Nv0(t) and Kvi(t) are periodic sequencesof time. Since the mosquito model does not consider malaria in humans, we use theresults of the human simulation model (Smith et al. 2008) to calculate the periodicsequence of Kvi(t) as a function of the periodic sequence of transmission of malariafrom mosquitoes to humans.
1102 N. Chitnis et al.
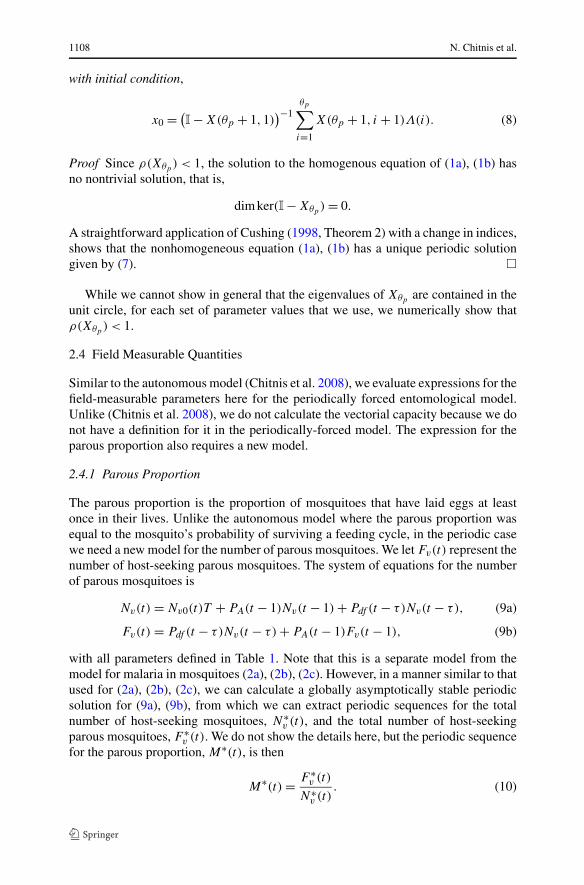
Fig. 1 New mosquitoes emergefrom water bodies (and mate) atrate Nv0(t) into the host-seekingstate A, where they activelysearch for blood meals.A mosquito may encounter andfeed on up to n different types ofhosts. Each type of host,represented by subscript i for1 ≤ i ≤ n, is available tomosquitoes at rate αi(t). If amosquito does not encounter ahost in a given night, it waits inthe host-seeking phase till thenext night, with probability,PA(t). When a mosquitoencounters a host of type i andis committed to biting the host,it moves to state Bi . If themosquito bites, it moves to stateCi where it searches for aresting place. If it finds a restingplace, it moves to state Di
where it rests for τ days. Afterresting, the mosquito moves tostate Ei where it seeks to layeggs. If it is successful in layingeggs, it returns to host-seekingstate, A, where it may thenencounter any type of host. Ateach state, the mosquito may diewith some probability, labeledby subscript μ. The survivalprobabilities and the emergencerate are periodic with a period ofone year. (b) is reproduced, withpermission, from Chitnis et al.(2008, Fig. 2)
The parameters most dependent on temperature are the extrinsic incubation pe-riod, θs , and the partial duration of the gonotrophic cycle, τ . However, we assumethat these parameters are constant. Since, in the model, these parameters are naturalnumbers, the change in temperature needs to be sufficiently large for them to varyseasonally. While this is reasonable for τ , it is a simplifying assumption for θs , whichwe will address in the future.
While the rest of the parameters labeled as periodic in the model, are unlikely tobe periodic with a 1-year period in nature, we label them as such because they can beeasily incorporated into the model as periodic parameters, and the same notation can
A Periodically-Forced Mathematical Model 1103
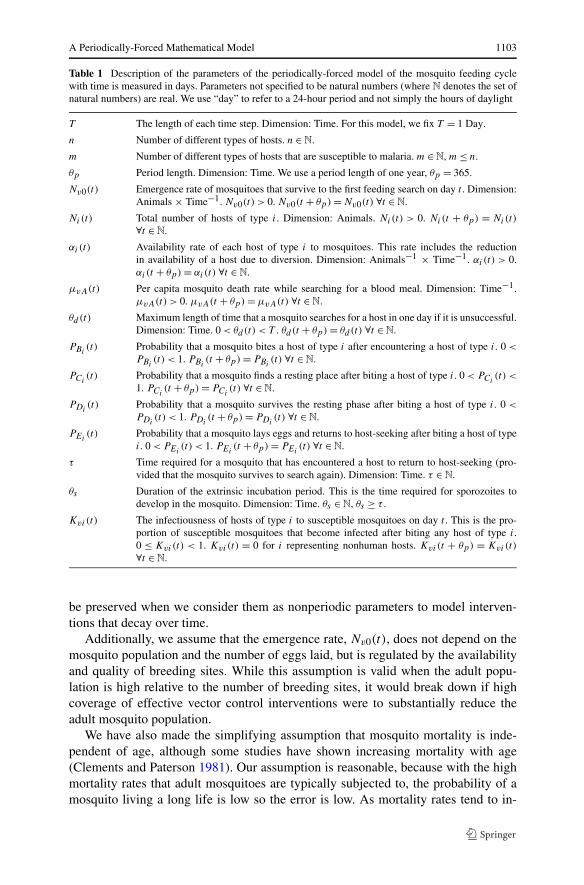
Table 1 Description of the parameters of the periodically-forced model of the mosquito feeding cyclewith time is measured in days. Parameters not specified to be natural numbers (where N denotes the set ofnatural numbers) are real. We use “day” to refer to a 24-hour period and not simply the hours of daylight
T The length of each time step. Dimension: Time. For this model, we fix T = 1 Day.
n Number of different types of hosts. n ∈ N.
m Number of different types of hosts that are susceptible to malaria. m ∈ N, m ≤ n.
θp Period length. Dimension: Time. We use a period length of one year, θp = 365.
Nv0(t) Emergence rate of mosquitoes that survive to the first feeding search on day t . Dimension:Animals × Time−1. Nv0(t) > 0. Nv0(t + θp) = Nv0(t) ∀t ∈ N.
Ni(t) Total number of hosts of type i. Dimension: Animals. Ni(t) > 0. Ni(t + θp) = Ni(t)
∀t ∈ N.
αi(t) Availability rate of each host of type i to mosquitoes. This rate includes the reductionin availability of a host due to diversion. Dimension: Animals−1 × Time−1. αi(t) > 0.αi(t + θp) = αi(t) ∀t ∈ N.
μvA(t) Per capita mosquito death rate while searching for a blood meal. Dimension: Time−1.μvA(t) > 0. μvA(t + θp) = μvA(t) ∀t ∈ N.
θd (t) Maximum length of time that a mosquito searches for a host in one day if it is unsuccessful.Dimension: Time. 0 < θd(t) < T . θd (t + θp) = θd (t) ∀t ∈ N.
PBi(t) Probability that a mosquito bites a host of type i after encountering a host of type i. 0 <
PBi(t) < 1. PBi
(t + θp) = PBi(t) ∀t ∈ N.
PCi(t) Probability that a mosquito finds a resting place after biting a host of type i. 0 < PCi
(t) <
1. PCi(t + θp) = PCi
(t) ∀t ∈ N.
PDi(t) Probability that a mosquito survives the resting phase after biting a host of type i. 0 <
PDi(t) < 1. PDi
(t + θp) = PDi(t) ∀t ∈ N.
PEi(t) Probability that a mosquito lays eggs and returns to host-seeking after biting a host of type
i. 0 < PEi(t) < 1. PEi
(t + θp) = PEi(t) ∀t ∈ N.
τ Time required for a mosquito that has encountered a host to return to host-seeking (pro-vided that the mosquito survives to search again). Dimension: Time. τ ∈ N.
θs Duration of the extrinsic incubation period. This is the time required for sporozoites todevelop in the mosquito. Dimension: Time. θs ∈ N, θs ≥ τ .
Kvi(t) The infectiousness of hosts of type i to susceptible mosquitoes on day t . This is the pro-portion of susceptible mosquitoes that become infected after biting any host of type i.0 ≤ Kvi(t) < 1. Kvi(t) = 0 for i representing nonhuman hosts. Kvi(t + θp) = Kvi(t)
∀t ∈ N.
be preserved when we consider them as nonperiodic parameters to model interven-tions that decay over time.
Additionally, we assume that the emergence rate, Nv0(t), does not depend on themosquito population and the number of eggs laid, but is regulated by the availabilityand quality of breeding sites. While this assumption is valid when the adult popu-lation is high relative to the number of breeding sites, it would break down if highcoverage of effective vector control interventions were to substantially reduce theadult mosquito population.
We have also made the simplifying assumption that mosquito mortality is inde-pendent of age, although some studies have shown increasing mortality with age(Clements and Paterson 1981). Our assumption is reasonable, because with the highmortality rates that adult mosquitoes are typically subjected to, the probability of amosquito living a long life is low so the error is low. As mortality rates tend to in-
1104 N. Chitnis et al.
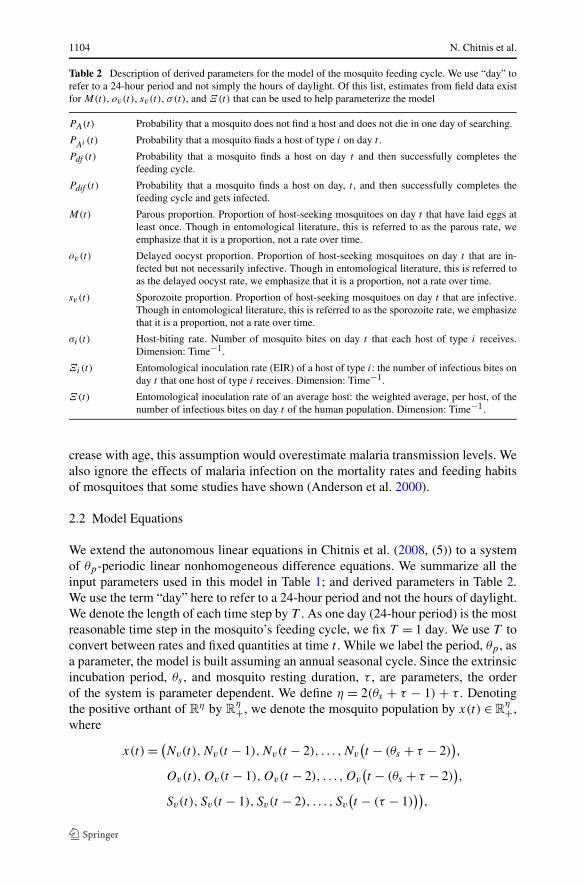
Table 2 Description of derived parameters for the model of the mosquito feeding cycle. We use “day” torefer to a 24-hour period and not simply the hours of daylight. Of this list, estimates from field data existfor M(t), ov(t), sv(t), σ(t), and Ξ(t) that can be used to help parameterize the model
PA(t) Probability that a mosquito does not find a host and does not die in one day of searching.
PAi (t) Probability that a mosquito finds a host of type i on day t .
Pdf (t) Probability that a mosquito finds a host on day t and then successfully completes thefeeding cycle.
Pdif (t) Probability that a mosquito finds a host on day, t , and then successfully completes thefeeding cycle and gets infected.
M(t) Parous proportion. Proportion of host-seeking mosquitoes on day t that have laid eggs atleast once. Though in entomological literature, this is referred to as the parous rate, weemphasize that it is a proportion, not a rate over time.
ov(t) Delayed oocyst proportion. Proportion of host-seeking mosquitoes on day t that are in-fected but not necessarily infective. Though in entomological literature, this is referred toas the delayed oocyst rate, we emphasize that it is a proportion, not a rate over time.
sv(t) Sporozoite proportion. Proportion of host-seeking mosquitoes on day t that are infective.Though in entomological literature, this is referred to as the sporozoite rate, we emphasizethat it is a proportion, not a rate over time.
σi(t) Host-biting rate. Number of mosquito bites on day t that each host of type i receives.Dimension: Time−1.
Ξi(t) Entomological inoculation rate (EIR) of a host of type i: the number of infectious bites onday t that one host of type i receives. Dimension: Time−1.
Ξ(t) Entomological inoculation rate of an average host: the weighted average, per host, of thenumber of infectious bites on day t of the human population. Dimension: Time−1.
crease with age, this assumption would overestimate malaria transmission levels. Wealso ignore the effects of malaria infection on the mortality rates and feeding habitsof mosquitoes that some studies have shown (Anderson et al. 2000).
2.2 Model Equations
We extend the autonomous linear equations in Chitnis et al. (2008, (5)) to a systemof θp-periodic linear nonhomogeneous difference equations. We summarize all theinput parameters used in this model in Table 1; and derived parameters in Table 2.We use the term “day” here to refer to a 24-hour period and not the hours of daylight.We denote the length of each time step by T . As one day (24-hour period) is the mostreasonable time step in the mosquito’s feeding cycle, we fix T = 1 day. We use T toconvert between rates and fixed quantities at time t . While we label the period, θp , asa parameter, the model is built assuming an annual seasonal cycle. Since the extrinsicincubation period, θs , and mosquito resting duration, τ , are parameters, the orderof the system is parameter dependent. We define η = 2(θs + τ − 1) + τ . Denotingthe positive orthant of R
η by Rη+, we denote the mosquito population by x(t) ∈ R
η+,
where
x(t) = (Nv(t),Nv(t − 1),Nv(t − 2), . . . ,Nv
(t − (θs + τ − 2)
),
Ov(t),Ov(t − 1),Ov(t − 2), . . . ,Ov
(t − (θs + τ − 2)
),
Sv(t), Sv(t − 1), Sv(t − 2), . . . , Sv
(t − (τ − 1)
)),
A Periodically-Forced Mathematical Model 1105
and Nv(t) represents the total number of host-seeking mosquitoes at time t ,Ov(t) represents the number of infected (oocyst-positive) mosquitoes at time t ,and Sv(t) represents the number of infectious (sporozoite-positive) mosquitoes attime t .
The system of equations for malaria in mosquitoes is
x(t) = Υ (t)x(t − 1) + Λ(t) ∀t ∈ N, (1a)
x(0) = x0, (1b)
for some initial condition, x0, with
Υ (t + θp) = Υ (t) ∀t ∈ N,
Λ(t + θp) = Λ(t) ∀t ∈ N,
where Λ(t) is in the nonnegative orthant of Rη, and Υ (t) is a nonnegative η × η
matrix.The forcing term, Λ(t), is constructed from the emergence of new mosquitoes,
Λ(t) = (Nv0(t)T ,0, . . . ,0). The matrix Υ (t) is constructed from the right-hand sideof (2a), (2b), (2c), which describes the dynamics of the host-seeking, infected host-seeking, and infectious host-seeking mosquitoes,
Nv(t) = Nv0(t)T + PA(t − 1)Nv(t − 1) + Pdf (t − τ)Nv(t − τ), (2a)
Ov(t) = Pdif (t − τ)[Nv(t − τ) − Ov(t − τ)
] + PA(t − 1)Ov(t − 1)
+ Pdf (t − τ)Ov(t − τ), (2b)
Sv(t) = Pdif (t − θs)f(t − (θs − τ)
)[Nv(t − θs) − Ov(t − θs)
]
+τ−1∑
l=1
Pdif(t − (θs + l)
)fτ
(t − (θs + l − τ)
)Pdf (t − τ)
× [Nv
(t − (θs + l)
) − Ov
(t − (θs + l)
)]
+ PA(t − 1)Sv(t − 1) + Pdf (t − τ)Sv(t − τ), (2c)
with recursively-defined discrete functions,
f (t − k) =
⎧⎪⎪⎪⎪⎪⎨
⎪⎪⎪⎪⎪⎩
1, if k = 0,∏k−1
j=0 PA(t − (k − j)), if 0 < k < τ,
Pdf (t − k) + ∏k−1j=0 PA(t − (k − j)), if k = τ,
Pdf (t − k)f (t − (k − τ)) + PA(t − k)f (t − (k − 1)), if k > τ,
(3)
1106 N. Chitnis et al.
and
fτ (t − k)
=
⎧⎪⎪⎪⎨
⎪⎪⎪⎩
0, if 0 ≤ k < τ,∏k−(τ+1)
j=0 PA(t − (k − j)), if τ ≤ k < 2τ,
Pdf (t − k) + ∏k−(τ+1)j=0 PA(t − (k − j)), if k = 2τ,
Pdf (t − k)fτ (t − (k − τ)) + PA(t − k)fτ (t − (k − 1)), if k > 2τ,
(4)
for k ∈ {0,N} and t > k.The total number of host-seeking mosquitoes, Nv(t), on a given day, t , in (2a) is
the sum of newly emerged mosquitoes (Nv0(t)); mosquitoes from the previous day(t −1) that survived but were unable to find a blood meal (PA(t −1)); and mosquitoesfrom τ days earlier (t − τ ) that successfully fed and completed the feeding cycle(Pdf (t)). The number of infected host-seeking mosquitoes, Ov(t), on a given day, t , in(2b) is the sum of uninfected mosquitoes from τ days earlier (t − τ ) that successfullyfed, survived a feeding cycle, and got infected; infected mosquitoes from the previousday (t − 1) that survived but were unable to find a blood meal (PA(t − 1)), andinfected mosquitoes from τ days earlier (t − τ ) that successfully fed and completedthe feeding cycle (Pdf (t)). The number of infective host-seeking mosquitoes, Sv(t),on a given day, t , in (2c) is the sum of uninfected mosquitoes from at least θs daysago that got infected, survived, and are host-seeking as infective mosquitoes for thefirst time on day t ; infective mosquitoes from the previous day (t − 1) that survivedbut were unable to find a blood meal (PA(t − 1)); and infective mosquitoes from τ
days earlier (t − τ ) that successfully fed and completed the feeding cycle (Pdf (t)).The first two terms in the right-hand side of (2c) include all the possible ways inwhich the mosquitoes could survive at least θs days to start their first feeding cycleas an infective mosquito on day t .
We define the probabilities of remaining in the host-seeking state after one day,PA(t), and encountering a host of type i, PAi (t), in terms of the availability ofdifferent hosts and of the mosquito death rate while host-seeking. The total rate atwhich mosquitoes leave the host-seeking state is the sum of the rates at which themosquitoes encounter each type of host and the death rate:
∑ni=1 αi(t)Ni(t)+μvA(t).
We assume that mosquitoes leave the host-seeking state each day with an exponen-tial distribution over time. Mosquitoes only search for a limited time, θd(t), in oneday, so some mosquitoes will find a host or die on any given day while others willremain in the host-seeking state till the next day. The probability that a mosquito isstill host-seeking the following day is equal to the probability that the mosquito isstill host-seeking after time θd(t),
PA(t) = e−(∑n
i=1 αi(t)Ni(t)+μvA(t))θd (t).
The probability that a mosquito finds a host of type i in one day is
PAi (t) = (1 − e−(
∑nk=1 αk(t)Nk(t)+μvA(t))θd (t)
) × αi(t)Ni(t)∑nk=1 αk(t)Nk(t) + μvA(t)
.

A Periodically-Forced Mathematical Model 1107
The probability that a mosquito finds a host on a given day and then survives a com-plete feeding cycle is
Pdf (t) =n∑
i=1
PAi (t)PBi(t)PCi
(t)PDi(t)PE(t + τ).
The probability that a mosquito finds a host on day t and then survives a completefeeding cycle and gets infected in the process is
Pdif (t) =n∑
i=1
PAi (t)PBi(t)PCi
(t)PDi(t)PE(t + τ)Kvi(t).
We note that PA(t + θp) = PA(t), PAi (t + θp) = PAi (t), Pdf (t + θp) = Pdf (t),Pdif (t + θp) = Pdif (t), ∀t ∈ N. We define Pdf (t) (and similarly Pdif (t)) in terms ofPEi
(t + τ) for notational simplicity and could alternatively have defined it as
P̂df (t) =n∑
i=1
PAi (t − τ)PBi(t − τ)PCi
(t − τ)PDi(t − τ)PE(t),
because in the model equations, the term always appears as Pdf (t − t̂ ) where t̂ ≥ τ .
2.3 Existence of a Periodic Orbit
The system of equations (2a), (2b), (2c) has a unique solution that exists for all time,t ∈ N. We conjecture that a domain of forward invariance exists but we have notshown its existence. We conjecture that this domain is an open bounded set in thepositive orthant of R
η, where each element of x(t) ∈ Rη is bounded below by 0 and
bounded above by a fixed number, xmax. We use the notation of a superscript asteriskto denote a periodic orbit of a variable; I to denote the (η × η) identity matrix; andρ(Y ) to denote the spectral radius of any matrix, Y . From Cushing (1998), we definethe function:
X(t, s) ={
Υ (t − 1)Υ (t − 2) · · ·Υ (s + 1)Υ (s), t ≥ s + 1,
I, t = s.(5)
Theorem 2.1 If all the eigenvalues, λi , of the matrix,
Xθp = X(θp + 1,1)
= Υ (θp)Υ (θp − 1) · · ·Υ (1), (6)
are contained inside the unit circle, that is ρ(Xθp) < 1, then there exists a uniqueglobally asymptotically stable periodic orbit of (1a), (1b),
x∗(t) = X(t + 1,1)x0 +t∑
i=1
X(t + 1, i + 1)Λ(i), (7)
1108 N. Chitnis et al.
with initial condition,
x0 = (I − X(θp + 1,1)
)−1θp∑
i=1
X(θp + 1, i + 1)Λ(i). (8)
Proof Since ρ(Xθp) < 1, the solution to the homogenous equation of (1a), (1b) hasno nontrivial solution, that is,
dim ker(I − Xθp) = 0.
A straightforward application of Cushing (1998, Theorem 2) with a change in indices,shows that the nonhomogeneous equation (1a), (1b) has a unique periodic solutiongiven by (7). �
While we cannot show in general that the eigenvalues of Xθp are contained in theunit circle, for each set of parameter values that we use, we numerically show thatρ(Xθp) < 1.
2.4 Field Measurable Quantities
Similar to the autonomous model (Chitnis et al. 2008), we evaluate expressions for thefield-measurable parameters here for the periodically forced entomological model.Unlike (Chitnis et al. 2008), we do not calculate the vectorial capacity because we donot have a definition for it in the periodically-forced model. The expression for theparous proportion also requires a new model.
2.4.1 Parous Proportion
The parous proportion is the proportion of mosquitoes that have laid eggs at leastonce in their lives. Unlike the autonomous model where the parous proportion wasequal to the mosquito’s probability of surviving a feeding cycle, in the periodic casewe need a new model for the number of parous mosquitoes. We let Fv(t) represent thenumber of host-seeking parous mosquitoes. The system of equations for the numberof parous mosquitoes is
Nv(t) = Nv0(t)T + PA(t − 1)Nv(t − 1) + Pdf (t − τ)Nv(t − τ), (9a)
Fv(t) = Pdf (t − τ)Nv(t − τ) + PA(t − 1)Fv(t − 1), (9b)
with all parameters defined in Table 1. Note that this is a separate model from themodel for malaria in mosquitoes (2a), (2b), (2c). However, in a manner similar to thatused for (2a), (2b), (2c), we can calculate a globally asymptotically stable periodicsolution for (9a), (9b), from which we can extract periodic sequences for the totalnumber of host-seeking mosquitoes, N∗
v (t), and the total number of host-seekingparous mosquitoes, F ∗
v (t). We do not show the details here, but the periodic sequencefor the parous proportion, M∗(t), is then
M∗(t) = F ∗v (t)
N∗v (t)
. (10)
A Periodically-Forced Mathematical Model 1109
2.4.2 Delayed Oocyst Proportion
The delayed oocyst proportion is the proportion of infected mosquitoes: they woulddevelop oocysts if they survived long enough. The first element of x∗(t) is N∗
v (t),and the (θs + τ )th element of x∗(t) is O∗
v (t). The periodic sequence for the delayedoocyst proportion is their ratio,
o∗v(t) = O∗
v (t)
N∗v (t)
. (11)
2.4.3 Sporozoite Proportion
The sporozoite proportion is the proportion of infectious mosquitoes: they have viablesporozoites in their salivary glands. The (2θs + 2τ − 1)th element of x∗(t) is S∗
v (t).The periodic sequence for the sporozoite proportion is
s∗v (t) = S∗
v (t)
N∗v (t)
. (12)
2.4.4 Host-Biting Rate
The host-biting rate is the number of mosquito bites that a host receives per unit time.The periodic sequence for the host-biting rate for hosts of type i is
σ ∗i (t) = 1
TPAi (t)PBi
(t)N∗
v (t)
Ni
. (13)
2.4.5 Entomological Inoculation Rate
The entomological inoculation rate (EIR) is the number of infectious bites a humanreceives per unit time. The periodic sequence for the EIR for hosts of type i is
Ξ∗i (t) = 1
TPAi (t)PBi
(t)S∗
v (t)
Ni
. (14)
The periodic sequence for the weighted average of EIR is
Ξ∗(t) =∑m
i=1 Ξ∗i (t)Ni(t)∑m
i=1 Ni(t)(15)
= S∗v (t)
T
∑mi=1 PAi (t)PBi
(t)∑m
i=1 Ni(t). (16)
2.5 Numerical Simulation
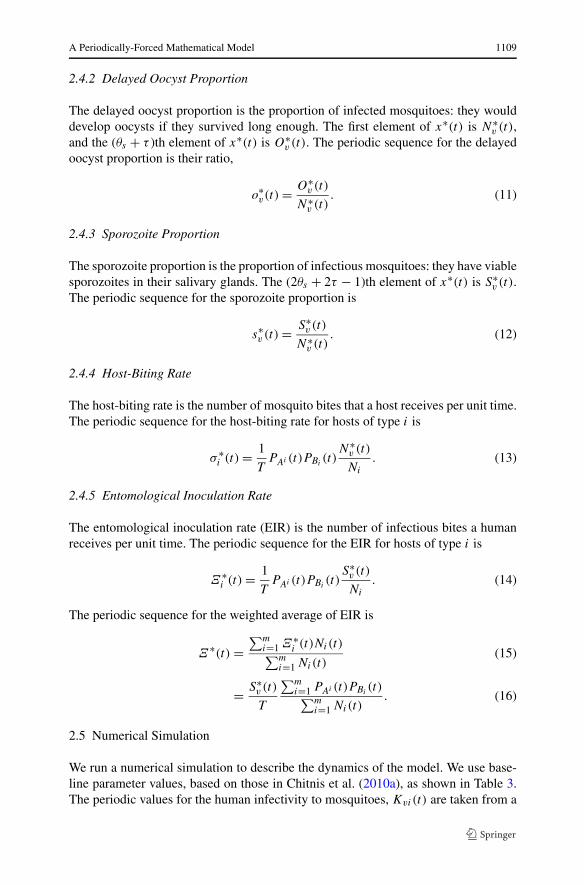
We run a numerical simulation to describe the dynamics of the model. We use base-line parameter values, based on those in Chitnis et al. (2010a), as shown in Table 3.The periodic values for the human infectivity to mosquitoes, Kvi(t) are taken from a
1110 N. Chitnis et al.
Table 3 Parameter values usedto simulate the periodicallyforced model for malaria inmosquitoes. Detailed parameterdescriptions are in Table 1
Parameter Value
T 1 day
n 1
m 1
θp 365 days
N1 1000 an
α1 0.0072 (an × days)−1
μvA 1.6 days−1
θd 0.33 days
PB1 0.95
PC1 0.95
PD1 0.99
PE1 0.88
τ 3 days
θs 11 days
human simulation model, and the mosquito emergence rate, Nv0(t) is matched withKvi(t) and the remaining parameter values to produce an approximation to the mea-sured EIR for Namawala, Tanzania, with a total of 320 infectious bites per person peryear. The values of Nv0(t) and Kvi(t) used in the simulation are shown in Fig. 2. Theresulting time sequence of the total number, the number of infected, and the numberof infectious host-seeking mosquitoes is shown in Fig. 3.
We can numerically show that for parameter values given in Table 3 and Fig. 2,all eigenvalues of the corresponding Xθp are inside the unit circle, so by Theorem 2.1the periodically forced model (2a), (2b), (2c) has a unique globally asymptoticallystable periodic solution for the total number of host-seeking mosquitoes, N∗
v (t), thenumber of infected host-seeking mosquitoes, O∗
v (t), and the number of infectioushost-seeking mosquitoes, S∗
v (t).From the definition of the parous proportion (10), the periodic sequence for the
proportion of parous mosquitoes, M∗(t) corresponding to the globally asymptoticallystable solution for the model for parous mosquitoes (9a), (9b) is shown in Fig. 4. FromN∗
v (t), O∗v (t), and S∗
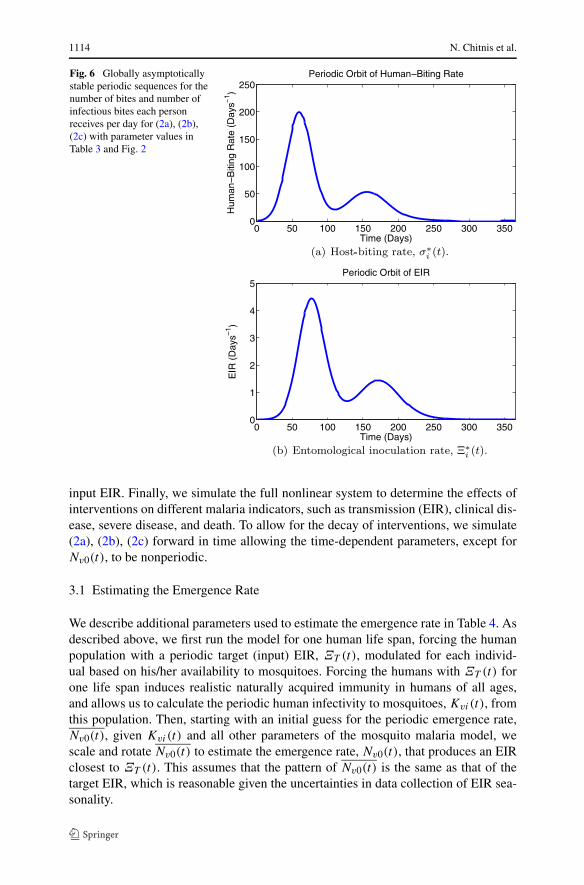
v (t), the periodic orbits for the delayed oocyst proportion and thesporozoite proportion are shown in Fig. 5. The corresponding periodic sequences forthe host-biting rate and EIR are shown in Fig. 6.
3 Full Malaria Cycle
To include the nonlinear effects of the full malaria transmission cycle, we con-nect this periodically-forced model for malaria in mosquitoes with the stochasticindividual-based simulation model for malaria in humans described by Smith et al.(2006, 2008, 2011). This model includes multiple aspects of the dynamics of malariain humans, including superinfection, acquired immunity, variations in parasite den-sities, human demography, the effects of health systems, and different assumptions
A Periodically-Forced Mathematical Model 1111
Fig. 2 Input periodic sequencesfor the parameter values of themosquito emergence rate,Nv0(t), and the humaninfectivity to mosquitoes,Kvi(t), used to drive themosquito malaria model
of heterogeneity. Although the model includes birth and death (natural and malaria-induced), the size and age-structure of the human population is kept constant in eachsimulation through migration.
Each individual in the human simulation model is treated as a different type of hostby the mosquito model. Labeling the number of humans in a simulation of the humanmodel by nH , the number of malaria susceptible hosts in the mosquito models is thenm = nH . If there are no nonhuman hosts, then n = m = nH . If there are nonhumanhosts, then n > nH .
For human hosts, 1 ≤ i ≤ m, the population of each host type is one, Ni = 1;and the host-dependent availability rate to mosquitoes, αi(t), and mosquito survivalprobabilities, PBi
(t), PCi(t), PDi
(t), and PEi(t), can be drawn from probability dis-
tributions around the estimated means for that human population. The infectivity ofeach human to mosquitoes, Kvi(t), is determined by the human simulation modelbased on that human’s past exposure, immunity status, and infection status, includ-ing the multiplicity of infection and parasite density. If there are nonhuman hosts,we set their population size, availability rates to mosquitoes, and mosquito survivalprobabilities from available data.
It is not feasible to measure the periodic sequence for the mosquito emergence rate,Nv0(t), in the field, or derive estimates for it directly. We therefore use the periodicsequence for population-level data of EIR to estimate the emergence rate, as described

1112 N. Chitnis et al.
Fig. 3 The simulated totalnumber, number of infected, andnumber of infectioushost-seeking mosquitoes fromparameter values in Table 3 andFig. 2 of the periodically forcedmosquito malaria model (2a),(2b), (2c)
in the following section. Alternatively, we could use field estimates of the number ofhost-seeking mosquitoes to estimate the emergence rate with a similar algorithm.
Once we have estimated the emergence rate, with all parameters for the mosquitomalaria model, we use (14), to calculate the resulting EIR on each human of thesimulated population. The human simulation model uses this EIR to then determineif the number of infectious bites on each human leads to a new infection or not,given the human’s immunity and infection status. Given past infections, the humansimulation model determines the human infectivity to mosquitoes at each time stepto feed back to the mosquito model. At each time point, the mosquito model passesΞi(t) to the human model and the human model passes Kvi(t) to the mosquito model.

A Periodically-Forced Mathematical Model 1113
Fig. 4 Globally asymptoticallystable periodic sequence of theproportion of mosquitoes whohave fed at least once; calculatedfrom (9a), (9b) and (10) withparameter values in Table 3 andFig. 2
Fig. 5 Globally asymptoticallystable periodic sequences for theproportion of infected andinfectious mosquitoes for (2a),(2b), (2c) with parameter valuesin Table 3 and Fig. 2
Also, events in the human model, such as birth, aging, death, and the distribution anddecay of interventions affect αi(t), PBi
(t), PCi(t), and PDi
(t) in the mosquito model.To simulate the effects of malaria control interventions, we first force the human
malaria model with a periodic input EIR over one life span to bring the human pop-ulation to an immunological state with realistic naturally acquired immunity for thattransmission setting. We then use the corresponding human infectivity to mosquitoes,Kvi(t), to estimate the periodic mosquito emergence rate that would give rise to the
1114 N. Chitnis et al.
Fig. 6 Globally asymptoticallystable periodic sequences for thenumber of bites and number ofinfectious bites each personreceives per day for (2a), (2b),(2c) with parameter values inTable 3 and Fig. 2
input EIR. Finally, we simulate the full nonlinear system to determine the effects ofinterventions on different malaria indicators, such as transmission (EIR), clinical dis-ease, severe disease, and death. To allow for the decay of interventions, we simulate(2a), (2b), (2c) forward in time allowing the time-dependent parameters, except forNv0(t), to be nonperiodic.
3.1 Estimating the Emergence Rate
We describe additional parameters used to estimate the emergence rate in Table 4. Asdescribed above, we first run the model for one human life span, forcing the humanpopulation with a periodic target (input) EIR, ΞT (t), modulated for each individ-ual based on his/her availability to mosquitoes. Forcing the humans with ΞT (t) forone life span induces realistic naturally acquired immunity in humans of all ages,and allows us to calculate the periodic human infectivity to mosquitoes, Kvi(t), fromthis population. Then, starting with an initial guess for the periodic emergence rate,Nv0(t), given Kvi(t) and all other parameters of the mosquito malaria model, wescale and rotate Nv0(t) to estimate the emergence rate, Nv0(t), that produces an EIRclosest to ΞT (t). This assumes that the pattern of Nv0(t) is the same as that of thetarget EIR, which is reasonable given the uncertainties in data collection of EIR sea-sonality.
A Periodically-Forced Mathematical Model 1115
Table 4 Description of additional parameters used to estimate the emergence rate from a given target EIR
ST (t) Target periodic sequence of number of infectious host-seeking mosquitoes. Dimension:Animals. ST (t + θp) = ST (t) ∀t ∈ N.
ΞT (t) Target periodic EIR. Dimension: Time−1. ΞT (t + θp) = ΞT (t) ∀t ∈ N.
ρO Initial estimate for the proportion of infected host-seeking mosquitoes. Dimensionless.
ρS Initial estimate for the proportion of infectious host-seeking mosquitoes. Dimensionless.
ω Estimated scaling factor for the emergence rate. Dimensionless.
ϕ Estimated rotation factor for the emergence rate. Dimensionless.
Since the composition of the human population varies over time, to reduce stochas-tic human heterogeneity, instead of EIR, we fit he number of infectious host-seekingmosquitoes. From (16), the target number of infectious host-seeking is
ST (t) = ΞT (t)
∑i Ni(t)∑
i PAi (t)PBi(t)
T . (17)
We define initial periodic sequences of numbers of host-seeking mosquitoes fromST (t) and reasonable estimates of the delayed oocyst proportion, ρO , and the sporo-zoite proportion, ρS ,
Sv(t) = ST (t),
Nv(t) = 1
ρS
Sv(t)
= 1
ρS
ST (t),
Ov(t) = ρONv(t)
= ρO
ρS
ST (t).
Note that ρO and ρS are only used to initialize the estimation process and do not affectthe value of the estimated emergence rate. We define the initial periodic sequencefor the emergence rate from the equilibrium point of the number of host-seekingmosquitoes from the autonomous mosquito malaria model (Chitnis et al. 2008, (6a)),
Nv0(t) = 1 − PA(t) − Pdf (t)
TNv(t)
= 1 − PA(t) − Pdf (t)
T
1
ρS
ST (t).
After simulating the human population for one life span, we continue to force thehuman simulation model with the target EIR, ΞT (t), for a few years to calculate theresulting Kvi(t). We use Kvi(t) in (2a), (2b), (2c) with the initial emergence rate,Nv0(t) to calculate the number of infectious mosquitoes, Sv(t). We define the scalingfactor, ω, as the ratio of the sum of the target infectious host-seeking mosquitoes over
1116 N. Chitnis et al.
1 year1 (representing the target annual EIR) to the sum of the calculated infectioushost-seeking mosquitoes (representing the calculated annual EIR),
ω =∑t̂+θp−1
t=t̂ST (t)
∑t̂+θp−1
t=t̂Sv(t)
, (18)
for an appropriate t̂ .We then use least squares to estimate the delay between mosquito emergence and
inoculation of humans, ϕ: the time it takes mosquitoes to get infected, and conse-quently for the parasite to develop into infectious sporozoites. We pick ϕ, such thatthe squared distance between the shifted target number of infectious host-seekingmosquitoes and the scaled calculated number of infectious host-seeking mosquitoesis minimized,
εϕ =t̂+θp−1∑
t=t̂
(ST (t − ϕ) − ωSv(t)
)2. (19)
The estimated emergence rate is then
Nv0(t) = 1
ωNv0(t + ϕ). (20)
Note that since Nv0(t) is a periodic sequence, it is defined for all values of t .
3.2 Modeling Malaria Control Interventions
We use the model of the full malaria cycle to compare the effectiveness of ITNs andIRS with dichlorodiphenyltrichloroethane (DDT), used singly and in combination, inreducing malaria transmission and disease. This extends the work of Chitnis et al.(2010a) which compared these interventions, but ignored the effects of seasonalityand decay of interventions and did not consider transient dynamics.
We determine parameter values for both models (human and malaria) for theAfrican village setting of Namawala, Tanzania, based on data from 1990–1991(Charlwood et al. 1997; Smith et al. 1993), with a pre-intervention EIR of 320 in-fectious bites per person per year. For this older data, we use chloroquine as thefirst line treatment against malaria, not an ACT as is the current official policy. Wesimulate a human population size of 1,000. The three main vector species in thisarea are An. gambiae s. s., An. arabiensis, and An. funestus (Charlwood et al. 1997).We model the three mosquito species by replicating (2a), (2b), (2c), interacting withthe same human population. We use parameter values for the initial efficacy of IRSand of ITNs as described in Chitnis et al. (2010a). We also assume that their ef-fectiveness decays exponentially with IRS with DDT having a half-life of 6 months(Sadasivaiah et al. 2007) and ITNs having a half-life of 3 years (Kilian et al. 2008;Lindblade et al. 2005).
1We actually repeat this calculation over several years to average out stochastic variations.

A Periodically-Forced Mathematical Model 1117
We show plots of the effects of no vector control interventions, IRS alone, ITNsalone, and a combination of IRS and ITNs on EIR, prevalence, and clinical incidence,in Figs. 7, 8, and 9, respectively. We run multiple simulations of fourteen model ex-tensions/parameterizations and two random seeds, showing the median, interquartilerange, and minimum and maximum values of all simulations at each time point. Thedifferent models and the analysis of the ensemble is described in more detail in Smithet al. (2012).
Figure 7 shows that IRS reduces malaria transmission over the first two years ofits application but does not lead to further gains as EIR is maintained at a lower ratefrom then on. When IRS is stopped, EIR returns to its preintervention level. ITNs alsolower the EIR for the first two deployments but lead to no further gains, with a returnto the preintervention level of EIR after the deployment of ITNs is stopped. ITNs aremore effective than IRS in reducing transmission. Combining ITNs and IRS leads toadditional gains and is beneficial in this setting. The larger differences in the rangesof the maxima and minima of the EIR with ITNs and a combination of ITNs and IRSshow more uncertainty in these results than in the simulations with IRS alone or withno interventions.
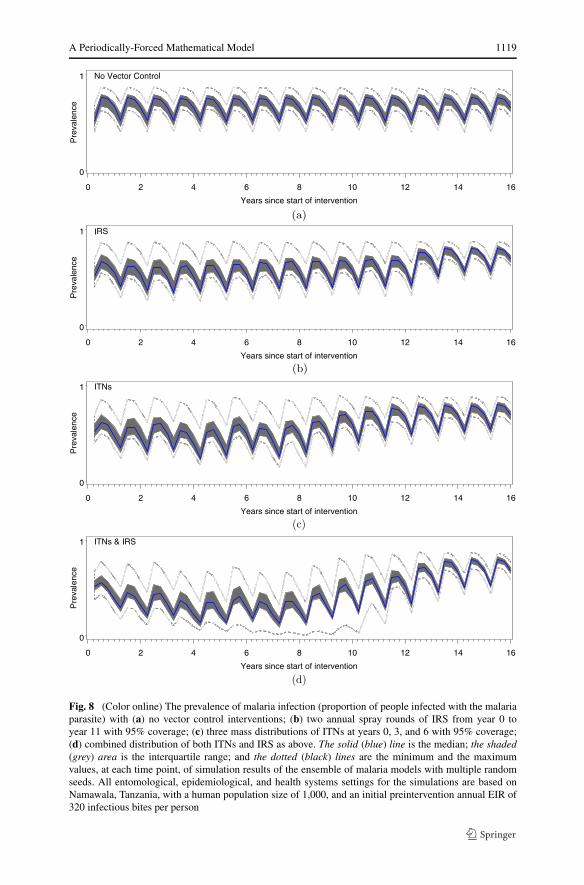
All plots in Fig. 8 show greater variation with larger interquartile ranges and differ-ences between maxima and minima, implying more uncertainty in predicting preva-lence than in predicting EIR. Similar to the plots for EIR, IRS and ITNs reduce preva-lence in their first two deployments but do not lead to further reductions, and return topreintervention levels after the interventions are stopped. Combining ITNs and IRSresults in a lower prevalence than either IRS or ITNs alone.
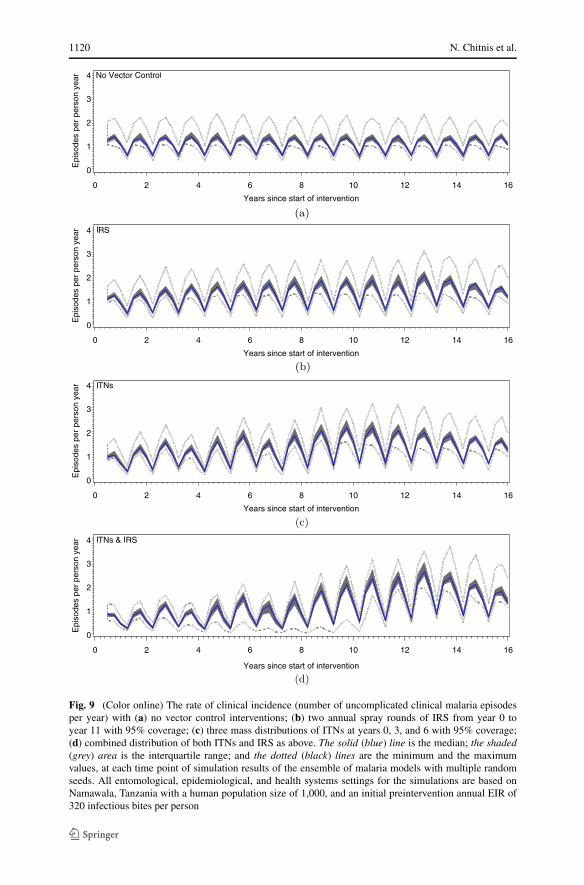
As with the plots for prevalence, Fig. 9 shows uncertainty in predicting clinicalincidence. The plots show that after a small reduction in clinical cases with eitherITNs or IRS, there is an increase above preintervention levels. While the combinationof ITNs and IRS reduce the number of clinical cases, by year eight after ITNs havebeen withdrawn, the number of cases rises above preintervention levels. Some timeafter the interventions (ITNs, IRS, and their combination) have been stopped, thenumber of clinical cases drops to the preintervention level.
4 Discussion and Concluding Remarks
We described a periodically forced model for malaria in mosquitoes that includes sea-sonality of mosquito populations and details of the mosquito feeding cycle that cancapture the effects of vector control interventions such as ITNs and IRS. Most malariaendemic areas of the world experience seasonal variation with a peak of transmissionfollowed by a period of low transmission (Roca-Feltrer et al. 2009). Seasonality istherefore crucial in developing models of malaria that can make quantitative pre-dictions, especially when considering the timing of short-acting interventions. Au-tonomous models of malaria transmission and mosquito dynamics can overestimatethe effects of IRS with insecticides with a short half life such an bendiocarb, whencompared to insecticides with a longer half life such as DDT, because they do not in-clude the relationship between the length of the transmission season and the effectiveduration of the intervention period.

1118 N. Chitnis et al.
Fig. 7 (Color online) The annual EIR (number of infectious bites per person per year) with (a) no vectorcontrol interventions; (b) two annual spray rounds of IRS from year 0 to year 11 with 95% coverage;(c) three mass distributions of ITNs at years 0, 3, and 6 with 95% coverage; (d) combined distribution ofboth ITNs and IRS as above. The solid (blue) line is the median; the shaded (grey) area is the interquartilerange; and the dotted (black) lines are the minimum and the maximum values, at each time point ofsimulation results of the ensemble of malaria models with multiple random seeds. All entomological,epidemiological, and health systems settings for the simulations are based on Namawala, Tanzania, witha human population size of 1,000, and an initial preintervention annual EIR of 320 infectious bites perperson
A Periodically-Forced Mathematical Model 1119
Fig. 8 (Color online) The prevalence of malaria infection (proportion of people infected with the malariaparasite) with (a) no vector control interventions; (b) two annual spray rounds of IRS from year 0 toyear 11 with 95% coverage; (c) three mass distributions of ITNs at years 0, 3, and 6 with 95% coverage;(d) combined distribution of both ITNs and IRS as above. The solid (blue) line is the median; the shaded(grey) area is the interquartile range; and the dotted (black) lines are the minimum and the maximumvalues, at each time point, of simulation results of the ensemble of malaria models with multiple randomseeds. All entomological, epidemiological, and health systems settings for the simulations are based onNamawala, Tanzania, with a human population size of 1,000, and an initial preintervention annual EIR of320 infectious bites per person
1120 N. Chitnis et al.
Fig. 9 (Color online) The rate of clinical incidence (number of uncomplicated clinical malaria episodesper year) with (a) no vector control interventions; (b) two annual spray rounds of IRS from year 0 toyear 11 with 95% coverage; (c) three mass distributions of ITNs at years 0, 3, and 6 with 95% coverage;(d) combined distribution of both ITNs and IRS as above. The solid (blue) line is the median; the shaded(grey) area is the interquartile range; and the dotted (black) lines are the minimum and the maximumvalues, at each time point of simulation results of the ensemble of malaria models with multiple randomseeds. All entomological, epidemiological, and health systems settings for the simulations are based onNamawala, Tanzania with a human population size of 1,000, and an initial preintervention annual EIR of320 infectious bites per person
A Periodically-Forced Mathematical Model 1121
The model is mathematically well-posed and we numerically showed the exis-tence of a unique globally asymptotically stable periodic orbit. We derived this pe-riodic orbit and corresponding field-measurable parameters that describe various as-pects of malaria transmission such as the parous proportion, the delayed oocyst rate,the sporozoite rate, the human-biting rate, and the EIR. We illustrated these field-measurable quantities with an example simulation.
There are some assumptions in this model that still need to be addressed. Weignored seasonal variations due to temperature and would like to include this de-pendence by making the partial duration of the feeding cycle, τ , and the extrinsicincubation period, θs , periodic parameters. We assumed that the mosquito emergencerate does not depend on the adult mosquito population. We want to expand our modelto include this dependence and to also include the development of insecticide resis-tance and the corresponding decrease in the effectiveness of interventions in futureversions of the model.
As this deterministic model for malaria in mosquitoes does not include the humanpart of the malaria life cycle, the extension to a nonautonomous model also allowedus to link it to a previously described stochastic individual-based simulation modelfor malaria in humans to include the full malaria cycle and determine the effects ofinterventions on human disease. An open source version of this full model, codedin C++, is available online (OpenMalaria 2011). We used the integrated model tocompare the effectiveness of two vector control interventions: ITNs and IRS, ap-plied singly, and in combination in reducing malaria transmission, prevalence, andincidence. We based our parameter values on the setting of Namawala, a rural vil-lage in a seasonal high transmission area of Tanzania. Our results showed that bothITNs and IRS are effective in reducing transmission and prevalence and maintain-ing that reduction. However, the reduction occurs over the first two deployments andno further reductions should be expected. Maximal effects would be achieved rela-tively quickly with IRS, but with ITNs the maximal effects would require at least twomass distribution campaigns. Malaria control programs and field researchers need tobe aware that these effects will only be evident in controlled studies with long-termfollow-up. When the deployment of interventions is stopped, transmission and preva-lence quickly revert to preintervention levels, so high coverage levels of interventionsmust be sustained to maintain reductions in transmission and prevalence. There areadditional benefits to combining ITNs and IRS, as transmission and prevalence arelower than using either one alone.
The number of clinical cases, however, can increase with the deployment of thevector control interventions even though transmission and prevalence are reduced.The increase in clinical incidence above baseline levels over time, is not intuitivelyto be expected. We have observed similar, though smaller, effects with simulationsof vaccination using the same models for malaria in humans (Maire et al. 2006). Wethink this results from a decrease in population level immunity, mainly due to re-cruitment of new immunologically naive individuals during the period of protection(the inclusion of immune decay in the human models makes little difference, Smithet al. 2012). These temporary increases in morbidity in the models would be diffi-cult to validate in the field because they are small relative to year-to-year variability,and studies of such phenomena are unlikely to involve long follow-up periods andmatched controls.
1122 N. Chitnis et al.
Other models that have considered similar issues include Griffin et al. (2010) andEckhoff (2011). Griffin et al. (2010) use an individual based model derived from acompartmental model to investigate the effects of different interventions on preva-lence in six different transmission settings with the same mosquito species that weuse but with different seasonality profiles. They show greater reductions in prevalencethan our simulations though their transmission settings have different magnitudesthan the ones we consider here. They do not show the effects of the interventions onclinical incidence. Eckhoff (2011) focusses on an individual based model of mosquitopopulation dynamics and shows similar reductions in EIR that we do with ITN andIRS use but does not show the effects on prevalence or clinical incidence.
Although our models show that the number clinical cases increases after the de-ployment of vector control interventions, we expect that the number of malaria deathswould decrease with the use of these interventions, since a reduction in transmissionmeans that susceptibility in humans shifts to older age groups, in whom episodes areless likely to be severe and result in death (Ross et al. 2006). We plan to use thiscombined model to run more simulations to consider the effects of vector controlinterventions on mortality. We also want to compare the effects of using differentinsecticides, varying the coverage levels, and combining vector control interventionswith other malaria control interventions in various epidemiological and health sys-tems settings. Additionally, we will use the model to determine target product pro-files for new interventions to improve control, interrupt transmission, and maintainelimination in the presence of imported cases.
Acknowledgements NC was supported by a fellowship from PATH-MACEPA and the Malaria Trans-mission Consortium (MTC). DH and TS received support from grant # 39777.01 from the Bill and MelindaGates Foundation and from MTC. The authors thank Susana Barbosa, Olivier Briët, Allan Schapira, andRichard Steketee for helpful discussions and comments. The authors thank Taylor and Francis for permis-sion to reproduce Fig. 1(b) from Chitnis et al. (2008).
Open Access This article is distributed under the terms of the Creative Commons Attribution Noncom-mercial License which permits any noncommercial use, distribution, and reproduction in any medium,provided the original author(s) and source are credited.
References
Anderson, R. M., & May, R. M. (1991). Infectious diseases of humans: dynamics and control. Oxford:Oxford Unversity Press.
Anderson, R. A., Knols, B. G. J., & Koella, J. C. (2000). Plasmodium falciparum sporozoites increasefeeding-associated mortality of their mosquito hosts Anopheles gambiae s.l. Parasitology, 120, 329–333.
Aron, J. L. (1988). Mathematical modeling of immunity to malaria. Math. Biosci., 90, 385–396.Aron, J. L., & May, R. M. (1982). The population dynamics of malaria. In R. M. Anderson (Ed.), The
population dynamics of infectious disease: theory and applications (pp. 139–179). London: Chapmanand Hall.
Charlwood, J. D., Smith, T., Billingsley, P. F., Takken, W., Lyimo, E. O. K., & Meuwissen, J. H. E. T.(1997). Survival and infection probabilities of anthropophagic anophelines from an area of highprevalence of Plasmodium falciparum in humans. Bull. Entomol. Res., 87, 445–453.
Chitnis, N., Cushing, J. M., & Hyman, J. M. (2006). Bifurcation analysis of a mathematical model formalaria transmission. SIAM J. Appl. Math., 67, 24–45.
Chitnis, N., Smith, T., & Steketee, R. (2008). A mathematical model for the dynamics of malaria inmosquitoes feeding on a heterogeneous host population. J. Biol. Dyn., 2(3), 259–285.
A Periodically-Forced Mathematical Model 1123
Chitnis, N., Schapira, A., Smith, T., & Steketee, R. (2010a). Comparing the effectiveness of malaria vector-control interventions through a mathematical model. Am. J. Trop. Med. Hyg., 83(2), 230–240.
Chitnis, N., Schapira, A., Smith, D. L., Smith, T., Hay, S. I., & Steketee, R. W. (2010b). Mathemati-cal modelling to support malaria control and elimination. In Progress & Impact Series (number 5).Geneva, Switzerland: Roll Back Malaria.
Clements, A. N., & Paterson, G. D. (1981). The analysis of mortality and survival rates in wild populationsof mosquitoes. J. Appl. Ecol., 18, 373–399.
Cosner, C., Beier, J. C., Cantrell, R. S., Impoinvil, D., Kapitanski, I., Potts, M. D., Troyo, A., & Ruan, S.(2009). The effects of human movement on the persistence of vector-borne diseases. J. Theor. Biol.,258(4), 550–560.
Cushing, J. M. (1998). Periodically forced nonlinear systems of difference equations. J. Differ. Equ. Appl.,3, 547–561.
Dietz, K., Molineaux, L., & Thomas, A. (1974). A malaria model tested in the African savannah. Bull.World Health Organ., 50, 347–357.
Eckhoff, P. A. (2011). A malaria transmission-directed model of mosquito life cycle and ecology. Malar. J.,10(303).
Gillies, M. T. (1988). Anopheline mosquitoes: vector behaviour and bionomics. In W. H. Wernsdorfer & I.McGregor (Eds.), Malaria: principles and practice of malariology (Vol. 1, pp. 453–485). Edinburgh:Churchill Livingstone.
Griffin, J. T., Hollingsworth, T. D., Okell, L. C., Churcher, T. S., White, M., Hinsley, W., Bousema, T.,Drakeley, C. J., Ferguson, N. M., Basáñez, M. G., & Ghani, A. C. (2010). Reducing Plasmodiumfalciparum malaria transmission in Africa: a model-based evaluation of intervention strategies. PLoSMed., 7(8), e1000324.
Hoshen, M. B., & Morse, A. P. (2004). A weather-driven model of malaria transmission. Malar. J., 3(32).Kilian, A., Byamukama, W., Pigeon, O., Atieli, F., Duchon, S., & Phan, C. (2008). Long-term field perfor-
mance of a polyester-based long-lasting insecticidal mosquito net in rural Uganda. Malar. J., 7(49).Killeen, G. F., & Smith, T. A. (2007). Exploring the contributions of bed nets, cattle, insecticides and
excitorepellency in malaria control: a deterministic model of mosquito host-seeking behaviour andmortality. Trans. R. Soc. Trop. Med. Hyg., 101, 867–880.
Le Menach, A., Takala, S., McKenzie, F. E., Perisse, A., Harris, A., Flahault, A., & Smith, D. L. (2007).An elaborated feeding cycle model for reductions in vectorial capacity of night-biting mosquitoes byinsecticide-treated nets. Malar. J., 6(10).
Lindblade, K. A., Dotson, E., Hawley, W. A., Bayoh, N., Williamson, J., Mount, D., Olang, G., Vulule,J., Slutsker, L., & Gimnig, J. (2005). Evaluation of long-lasting insecticidal nets after 2 years ofhousehold use. Trop. Med. Int. Health, 10(11), 1141–1150.
Lou, Y., & Zhao, X. Q. (2010). A climate-based malaria transmission model with structured vector popu-lation. SIAM J. Appl. Math., 70(6), 2023–2044.
Macdonald, G. (1950). The analysis of malaria parasite rates in infants. Trop. Dis. Bull., 47, 915–938.Macdonald, G. (1952). The analysis of the sporozoite rate. Trop. Dis. Bull., 49, 569–585.Maire, N., Aponte, J. J., Ross, A., Thompson, R., Alonso, P., Utzinger, J., Tanner, M., & Smith, T. (2006).
Modeling a field trial of the RTS,S/AS02A malaria vaccine. Am. J. Trop. Med. Hyg., 75(Suppl. 2),104–110.
McKenzie, F. E., Wong, R. C., & Bossert, W. H. (1998). Discrete-event simulation models of Plasmodiumfalciparum malaria. Simulation, 71(4), 250–261.
Ngwa, G. A., & Shu, W. S. (2000). A mathematical model for endemic malaria with variable human andmosquito populations. Math. Comput. Model., 32, 747–763.
OpenMalaria (2011). http://code.google.com/p/openmalaria/. Date accessed: 11 November 2011.Penny, M. A., Maire, N., Studer, A., Schapira, A., & Smith, T. A. (2008). What should vaccine developers
ask? Simulation of the effectiveness of malaria vaccines. PLoS ONE, 3(9).Roca-Feltrer, A., Armstrong Schellenberg, J. R. M., Smith, L., & Carneiro, I. (2009). A simple method for
defining malaria seasonality. Malar. J., 8(276).Roll Back Malaria Partnership (2008). The Global Malaria Action Plan. http://www.rollbackmalaria.
org/gmap/.Ross, R. (1905). The logical basis of the sanitary policy of mosquito reduction. Science, 22(570), 689–699.Ross, R. (1911). The prevention of malaria (2nd ed.). London: Murray.Ross, A., Maire, N., Molineaux, L., & Smith, T. (2006). An epidemiologic model of severe morbidity and
mortality caused by Plasmodium falciparum. Am. J. Trop. Med. Hyg., 75(Suppl. 2), 63–73.
1124 N. Chitnis et al.
Ross, A., Penny, M., Maire, N., Studer, A., Carneiro, I., Schellenberg, D., Greenwood, B., Tanner, M., &Smith, T. (2008). Modelling the epidemiological impact of intermittent preventive treatment againstmalaria in infants. PLoS ONE, 3(7).
Ross, A., Maire, N., Sicuri, E., Smith, T., & Conteh, L. (2011). Determinants of the cost-effectiveness ofintermittent preventive treatment for malaria in infants and children. PLoS ONE, 6(4).
Sadasivaiah, S., Tozan, Y., & Breman, J. G. (2007). Dichlorodiphenyltrichloroethane (DDT) for indoorresidual spraying in Africa: How can it be used for malaria control? Am. J. Trop. Med. Hyg., 77(Suppl.6), 249–263.
Saul, A. (2003). Zooprophylaxis or zoopotentiation: the outcome of introducing animals on vector trans-mission is highly dependent on the mosquito mortality while searching. Malar. J., 2(32).
Saul, A. J., Graves, P. M., & Kay, B. H. (1990). A cyclical feeding model for pathogen transmission andits application to determine vector capacity from vector infection rates. J. Appl. Ecol., 27, 123–133.
Smith, D. L., & McKenzie, F. E. (2004). Statics and dynamics of malaria infection in Anophelesmosquitoes. Malar. J., 3(13).
Smith, T., Charlwood, J. D., Kihonda, J., Mwankusye, S., Billingsley, P., Meuwissen, J., Lyimo, E., Takken,W., Teuscher, T., & Tanner, M. (1993). Absence of seasonal variation in malaria parasitaemia in anarea of intense seasonal transmission. Acta Trop., 54, 55–72.
Smith, T., Killeen, G. F., Maire, N., Ross, A., Molineaux, L., Tediosi, F., Hutton, G., Utzinger, J., Dietz,K., & Tanner, M. (2006). Mathematical modeling of the impact of malaria vaccines on the clinicalepidemiology and natural history of Plasmodium falciparum malaria: overview. Am. J. Trop. Med.Hyg., 75(Suppl. 2), 1–10.
Smith, T., Maire, N., Ross, A., Penny, M., Chitnis, N., Schapira, A., Studer, A., Genton, B., Lengeler,C., Tediosi, F., de Savigny, D., & Tanner, M. (2008). Towards a comprehensive simulation model ofmalaria epidemiology and control. Parasitology, 135, 1507–1516.
Smith, T., Ross, A., Maire, N., Chitnis, N., Studer, A., Hardy, D., Brooks, A., Penny, M., & Tanner, M.(2012, in press). Ensemble modeling of the likely public health impact of the RTS,S malaria vaccine.PLoS Med. doi:10.1371/journal.pmed.1001157.
The malERA Consultative Group on Modeling (2011). A research agenda for malaria eradication: model-ing. PLoS Med., 8, e1000403.
White, M. T., Griffin, J. T., Churcher, T. S., Ferguson, N. M., Basáñez, M. G., & Ghani, A. C. (2011).Modelling the impact of vector control interventions on Anopheles gambiae population dynamics.Parasites Vectors, 4(153).
World Health Organization (2009). World Malaria Report 2009. http://www.who.int/malaria/publications/atoz/9789241563901/en/index.html.