a personality model for animating heterogeneous traffic...
TRANSCRIPT
COMPUTER ANIMATION AND VIRTUAL WORLDSComp. Anim. Virtual Worlds 2014; 25:363–373
Published online 21 May 2014 in Wiley Online Library (wileyonlinelibrary.com). DOI: 10.1002/cav.1575
SPECIAL ISSUE PAPER
A personality model for animating heterogeneoustraffic behaviorsXuequan Lu1, Zonghui Wang1*, Mingliang Xu2, Wenzhi Chen1 and Zhigang Deng3
1 Zhejiang University, Hangzhou, 310027, China2 Zhengzhou University, Zhengzhou, Henan, China3 University of Houston, Houston, TX, USA
ABSTRACT
How to automatically generate realistic and heterogeneous traffic behaviors has been a much needed yet challengingproblem for numerous traffic simulation and urban planning applications. In this paper, we propose a novel approach tomodel heterogeneous traffic behaviors by adapting a well-established personality trait model (i.e., Eysenck’s PEN (psy-choticism, extraversion and neuroticism) model) into widely used traffic simulation approaches. First, we collected a largeamount of user feedback while users watch a variety of computer-generated traffic simulation video clips. Then, we trainedregression models to bridge low-level traffic simulation parameters and high-level perceived traffic behaviors (i.e.,adjectives according to the PEN model and the three PEN traits). We also conducted an additional user study to validate theeffectiveness and usefulness of our approach, in particular, high correlation coefficients and the Pearson values betweenusers’ feedback and our model predictions prove the effectiveness of our approach. Furthermore, our approach can alsoproduce interesting emergent traffic patterns including faster-is-slower effect and sticking-in-a-pin-wherever-there-is-roomeffect. Copyright © 2014 John Wiley & Sons, Ltd.
KEYWORDS
heterogeneous traffic; behavioral animation; personality traits
Supporting information may be found in the online version of this article.
*Correspondence
Zonghui Wang, Zhejiang University, Hangzhou, 310027, China.E-mail: [email protected]
1. INTRODUCTION
Traffic simulation plays a useful role in studying trafficproblems. The usefulness of traffic simulation becomesmore obvious when a traffic system is too complex todescribe using abstract mathematical models. For example,traffic simulation can dynamically reproduce realistictraffic flows, traffic accidents, and other traffic phenomenain a low-cost and efficient manner. It can also reproduce thespatio-temporal variations of traffic flows and is of greathelp in quantitatively analyzing vehicles, drivers, pedes-trians, roads, and traffic characteristics. Traffic simulationcan visually present the dynamic conditions of vehicularflows in the road network, for example, whether there iscongestion at specific locations, whether there are trafficaccidents, and what measures should be taken when facingsuch problems. As a result, traffic simulation is an effi-cient and flexible tool in assisting and optimizing trafficplan, design, regulation, and even urban development. Inaddition, traffic simulation has been increasingly used in
entertainment applications, such as racing games, virtualtourism, driving training, and special effects in moviesand games, thus leading to an increasing need to incorpo-rate realistic and immersive traffic scenarios into variousvirtual worlds.
A significant portion of existing traffic simulation efforthas been focused on physics-based traffic models; onlylimited works have been centered on incorporating humanfactors into existing traffic models [1–3]. However, inreal-world scenarios, human factors play a critical part toform distinct driving patterns, and different drivers typi-cally have their own driving styles (i.e., driving behaviors),thus giving rise to heterogeneous traffic flows. In practice,traffic simulation in graphics has reached a point whereheterogeneous and lifelike traffic behavioral animation iswarranted, as the ultimate target is to simulate traffic asrealistic as possible and facilitate other visual applications.Therefore, it is important for traffic simulation systems toproduce realistic and heterogeneous traffic flows in virtualworlds. To this end, in this paper, we choose personality
Copyright © 2014 John Wiley & Sons, Ltd. 363
Animating heterogeneous traffic behaviors X. Lu et al.
traits as the main factor to govern drivers’ overall drivingbehaviors although we admit that many other humanfactors also come to play, because personality traitsare relatively easy to identify and trait theories have beenwell established. We focus on generating heterogeneoustraffic behaviors by creating differences in drivers’ under-lying personalities.
Recently, several research efforts have been conductedto incorporate human personality traits into the simula-tion of autonomous agents [4,5]. Surprisingly, to the bestof our knowledge, no similar effort has been attempted toincorporate personality traits to traffic simulation applica-tion to date. Following the lead of [4,5], in this paper, weaim to generate heterogeneous and realistic driving behav-iors by incorporating the PEN (psychoticism, extraversionand neuroticism) model into the simulation of traffic flows.Specifically, we emulate drivers’ personality traits by tun-ing these low-level simulation parameters of a modernphysics-based traffic model [6] and explore the resultingeffects of personality traits on the overall traffic simula-tion. Conventionally, users need to first understand a trafficmodel and then set the low-level simulation parameters ina trial-and-error manner to achieve the desired diversity oftraffic flows. This method is time-consuming, inaccurateand inefficient.
In this work, we automatically map low-level trafficsimulation parameters to established high-level behaviordescriptors including the three factors of the PEN modeland six adjective descriptors, by training an optimal regres-sion model. The used training data set is collected via adeliberately designed user study. With our approach, userscan be relieved from tedious and time-consuming effortof manually tuning low-level traffic simulation parameters.To demonstrate the usefulness of our method, we fur-ther apply our method to various urban traffic scenes. Wealso conducted an additional user study, and high corre-lation coefficients and their significance between users’feedback and our model predictions prove the effec-tiveness of our approach. Besides generating realisticheterogeneous traffic flows, emergent traffic patternsincluding the faster-is-slower effect [7] and the sticking-in-a-pin-wherever-there-is-room effect (Figure 7) can bewell observed in the simulation results by our approach.
2. RELATED WORK
2.1. Traffic Simulation
Traffic modeling approaches can be roughly divided intothree categories, namely, microscopic methods, macro-scopic methods, and mesoscopic methods. Interested read-ers are referred to the latest traffic simulation survey [8].
The most popular traffic simulation methods aremicroscopic traffic models, in which the fundamentalassumption is that the acceleration of an individual vehi-cle is determined by the neighboring vehicles in thesame driveway, especially the closest vehicle. In 1950,Reuschel [9] introduced early microscopic traffic models.
Gerlough [10] described some form of car-following setof rules. Newell [11] explored the nonlinear effects in thedynamics of car following. Nagel and Schreckenberg [12]simulated traffic by means of cellular automata, and theresulting Nagel–Schreckenberg model has been extendedwidely. Recently, the intelligent driver model (IDM) [13]has been proposed by Treiber et al. and enhanced byKesting et al. [6].
In the direction of macroscopic traffic models [14],Lighthill and Whitham [15] and Richards [16] indepen-dently proposed the same traffic model as the oldestmacroscopic traffic model. This fluid-dynamic model wasalso termed the LWR model, in which the key assumptionis no vehicles are entering or leaving the freeway and thetraffic velocity relies merely on traffic density. To improvethis model, Payne [17] and Whitham [18] developed atraffic model with two variables thus leading to the PWmodel. The PW model has been proven to have negativevelocities under some conditions. Zhang [19] made someimprovements to the PW model by removing incorrectbehaviors. In addition, researchers also proposed meso-scopic gas kinetic approaches. Prigogine and Andrews [20]first proposed a Boltzmann-like model for traffic dynam-ics. Later improvements were made by Nelson and hiscolleagues [21] and some other researchers.
Recently, there has been a number of interesting devel-opments in traffic simulations. For example, Sewall etal. proposed a hybrid technique by coupling continuumand agent-based traffic models [22], but simulation typescan not be alternated quickly. Lu et al. [23] presentedan accident-avoidance full velocity difference model toanimate traffic flows in rural scenes. Wilkie et al. [24]introduced a fast technique to reconstruct traffic flowsfrom in-road sensor measurements or procedurally gener-ated data for interactive 3D graphics applications, but it islimited by the available data.
2.2. Modeling Driving Behaviors withHuman Factors
To date, most of existing traffic simulation works modeldriving characteristics and behaviors without taking humanfactors into consideration. A few traffic models have beenproposed to handle human factors [1–3]. However, none ofthem is aimed to simulate driving behaviors with humanfactor aspects for computer animation applications. Themain difference between our work and the aforementionedhuman factor-incorporated traffic models is, they typi-cally model human factors within existing physics-basedframeworks; instead, our work incorporates an indepen-dent personality model to a mainstream traffic simulationmodel in order to tailor the resulting driving behaviors.
2.3. Personality Trait Models
Psychologists develop trait theories to study humanpersonalities. The big three-factor model [25] was pro-posed in 1985, which claimed that personality can be
364 Comp. Anim. Virtual Worlds 2014; 25:363–373 © 2014 John Wiley & Sons, Ltd.DOI: 10.1002/cav

X. Lu et al. Animating heterogeneous traffic behaviors
reducible to three major traits that categorize personalityas psychoticism, extraversion, and neuroticism. Therefore,this three-factor model is also dubbed as the PEN model.The psychoticism trait is a personality pattern typified byaggression and egocentricity. The extraversion factor is apersonality characterized by projecting one’s personalityoutward, and it is typically associated with high levels onpositive behaviors (e.g., active, responsible, and sociable).The last factor, the neuroticism, describes an individual’stendency to become upset or emotional, and it is charac-terized by high levels of negative affect such as anger andtension.
Another widely known personality model is the bigfive-factor model, which was developed by Costa andMccrae [26]. The five factors are openness, conscientious-ness, extraversion, agreeableness, and neuroticism; there-fore, the five-factor model is also called OCEAN, NEOAC,or CANOE. Both the PEN model and the CANOE modeltreat extraversion and neuroticism as central dimensions ofhuman personalities. Although these two well-known per-sonality trait models are depictive, only the PEN modeloffers a detailed explicit causal explanation: it suggests thatdifferent personality traits are caused by the properties ofthe brain, as the result of genetic factors [25]. In contrast,the CANOE model just presumes that there is a role ofgenetics and environment but offers no clear explanation ofcausality. More importantly, the CANOE model has beencriticized for losing the full orthogonality among those fivefactors [27].
3. PRELIMINARIES
3.1. Underlying Traffic Model
The IDM [13] is regarded as a modern simulation method[22]. However, it sometimes generates unrealistic behav-ior in cut-in situations (lane changing manoeuvres) [6].Motivated by this, Kesting et al. [6] proposed an enhancedintelligent driver model (abbreviated as E-IDM) basedon IDM, which performs better than IDM and is there-fore considered as a modern, advanced traffic simulationmethod. In this work, we take advantage of the E-IDM asthe underlying traffic simulation model.
The IDM considers not only the actual speed v of thecurrent vehicle but also the distance s and the velocitydifference �v between the current vehicle and the leader.
aidm.s, v,�v/ D a
"1 �
�v
v0
�ı�
�s�.v,�v/
s
�2#
(1)
where s�.v,�v/ D s0 C vT C v�v2p
ab, and parameter
information can be referred to Table II.In order to prevent unnecessarily strong braking reac-
tions due to lane changes, Kesting et al. [6] formulated aconstant-acceleration heuristic (CAH) that could obtain anupper limit of a safe acceleration. The CAH is given by
acah D
(v2 Qal
v2l�2s Qal
vl.v � vl/ � �2s Qal
Qal �.v�vl/
2‚.v�vl/2s otherwise
(2)
where Qal D min.al, a/ is the effective acceleration, s isthe gap, v and a are the velocity and acceleration of thecurrent vehicle, respectively, vl and al are the velocity andacceleration of the leading vehicle, respectively, and ‚.x/is the Heaviside step function (only effective when x > 0).
a D
8<:
aidm aidm � acah.1 � c/aidmC
cŒacah C b tanh. aidm�acahb /� otherwise
(3)
Kesting et al. [6] combined the IDM and the CAH to obtainan enhanced traffic simulation model—E-IDM—where cis the coolness factor (Eq. (3)).
3.2. Lane-Changing Model
The lane-changing model we use is a simplified gapacceptance model, please refer to [28] for more informa-tion. In a gap acceptance model, drivers typically checkthe feasibility of performing lane changes by comparingthe lead and lag gaps with their corresponding critical gaps(minimum acceptable space gaps).
As seen in Figure 1, dlead is the longitudinal distancebetween the current vehicle and the lead vehicle in the leftor right lane, and dlag is the longitudinal distance betweenthe current vehicle and the lag vehicle in the adjacent lanes.
Figure 1. The lead, subject, lag vehicles and the lead, lag gaps in the presented gap acceptance model.
Comp. Anim. Virtual Worlds 2014; 25:363–373 © 2014 John Wiley & Sons, Ltd. 365DOI: 10.1002/cav

Animating heterogeneous traffic behaviors X. Lu et al.
dminlead and dmin
lag are the corresponding minimum acceptablegaps, and we set dmin D dmin
lead D dminlag in this study.
Gap acceptance formulation: dlead � dminlead and dlag �
dminlag .This formulation indicates that the lead and lag gaps are
acceptable if they are equal or greater than the correspond-ing critical gaps, which means the present driver can makea lane change.
We combine the lateral lane-changing behavior with thelongitudinal traffic model described earlier (E-IDM), thusleading to a full traffic model for our simulation.
4. OUR METHOD
4.1. Perceptual Study for Driving Behaviors
Variation in low-level simulation parameters influencesthe perceived behaviors of vehicles in traffic flows. Inthis section, we conduct a user study to achieve a plau-sible mapping from low-level simulation parameters toperceived driving behaviors. We carefully select two
Table I. Adjective descriptors for the three personality traits inthe PEN model.
Personality traits Adjectives
Psychoticism Aggressive, egocentricExtraversion Active, risk-takingNeuroticism Tense, shy
Table II. Ranges of low-level simulation parameters used inthis work.
Parameter Symbol Min Max
Desired speed v0.m=s/ 25 35Free acceleration exponent ı 4 4Desired time gap T .s/ 1.0 3.0Jam distance s0.m/ 1.0 5.0Maximum acceleration a.m=s2/ 0.5 2.5Desired deceleration b.m=s2/ 1.0 3.0Coolness factor c 0.99 0.99Minimum acceptable gap dmin.m/ 5.0 95.0
adjectives for each factor in the PEN model, and the adjec-tives are chosen from EPQ [29] and [30] according tothe most common driving behaviors, shown in Table I.Low-level simulation parameters and the correspondingvalue ranges are summarized in Table II. The ranges are setto fully contain the corresponding parameter values in [6].
For the user study, we recruited 50 participants whoare between 18 and 50 years old (30% female, 40%drivers). All participants were asked to watch a fewcomputer-generated video clips. Two video clips wereplayed to participants at the same time: one is the referenceclip as a baseline for comparison, using the default sim-ulation parameter values for all vehicles; the other clip isgenerated using random parameter values for marked vehi-cles and default parameter values for unmarked ones. To beconsistent for contrast, the reference video clip is the samein one traffic scenario for all user study questions. Afterthat, participants were asked a few questions, for example,“Do you think the driving behaviors of the marked vehi-cles in the tested video are more aggressive than that inthe reference video?” Participants chose answers on a scalefrom 1 to 9; “1” denotes totally disagree, “5” denotes eitheragree or disagree, and “9” denotes totally agree.
To gain a wide range of sights, we design three trafficscenarios: freeway traffic, narrowing traffic, and crowdedtraffic (Figure 2). The first scenario is a freeway traffic,which simulates diverse driving behaviors on freeway. Thesecond is a narrowing traffic scenario, where a section ofa lane is under construction and vehicles have to moveinto other lanes to get through. The last scenario wechoose is a crowded traffic scenario, where all vehiclesmove slowly.
We deliberately select six parameters (v0, T , S0, a, b anddmin) from Table II, because all of them have intuitive inter-pretation [31]. The other two parameters, ı D 4, c D 0.99,are consistent with [6]. To generate a variety of videoclips describing high-level driving behaviors, the under-lying low-level parameter values (regardless of ı and c)are randomly chosen for the marked vehicles. The markedvehicles in one single clip have the same randomly cho-sen simulation parameter values, while the unmarked onesshare the default simulation parameter values, which areset to be .minC max/=2.
Figure 2. Three traffic scenarios used in our study.
366 Comp. Anim. Virtual Worlds 2014; 25:363–373 © 2014 John Wiley & Sons, Ltd.DOI: 10.1002/cav

X. Lu et al. Animating heterogeneous traffic behaviors
Table III. The mean square error (MSE) and the normalized rootmean square error (NRMSE) between the predicted data and
the real data for four different regression models.
Regression model MSE NRMSE
MLR 0.9123 0.1588PR 1.4839 0.2028GPR 1.8532 0.2826SVMR 2.0624 0.2982
MLR, multiple linear regression; PR, polynomial regression; GPR,Gaussian process regression; SVMR, support vector machine regression.
Table IV. Sampled simulation parameters for six adjectives andthree PEN traits.
Personality traits v0 T s0 a b dmin
Aggressive 33 1 3 2.5 1 9Egocentric 30 2 3 2.5 3 13Active 30 1 4 2.5 3 36Risk taking 34 2 2 2.5 1 8Tense 26 3 4 1 2 63Shy 27 3 5 0.8 3 79Psychoticism 31 2 3 2.1 2 10Extraversion 33 2 2 1.8 1 16Neuroticism 28 3 4 0.6 3 78
Random values are assigned to the simulation parame-ters in different settings, and we generate a total number of110 video clips for our user study. Each participant is askedto rate the driving behaviors of six randomly chosen videoclips in each scenario (18 clips in total). Because there aresix questions for each clip and 18 clips for each participant,we obtain a rich set of 5400 (6 � 18 � 50) data points.
4.2. Regression Model Training andValidation
Through empirical analysis of the user study data, wefound that there could exist a linear or nonlinear regres-sion between perceived behaviors and low-level simulationparameters. To find an optimal regression model, we usethe collected data to train and test different models. Fourregression models are chosen: multiple linear regression(MLR), polynomial regression, Gaussian process regres-sion, and support vector machine regression. We use 80%of the collected data to train different regression models.The rest 20% data are retained for validation, to deter-mine which is the best regression model among all thetrained models.
For the sake of completeness and readability, we presentthe relationship in a concise way (Eq. (4)). The value
−3320 −3315 −3310 −3305−3000
−2000
−1000
0
Lateral (m)
Lon
gitu
dina
l (m
)
Aggressive
−3320 −3315 −3310 −3305−3000
−2000
−1000
0
Lateral (m)
Lon
gitu
dina
l (m
)
Egocentric
−3315 −3310 −3305 −3300−3000
−2000
−1000
0
Lateral (m)
Lon
gitu
dina
l (m
)
Active
−3320 −3315 −3310 −3305−3000
−2000
−1000
0
Lateral (m)
Lon
gitu
dina
l (m
)
Risk−Taking
−3315 −3310 −3305 −3300−3000
−2000
−1000
0
Lateral (m)
Lon
gitu
dina
l (m
)
Tense
−3315 −3310 −3305 −3300−3000
−2000
−1000
0
Lateral (m)
Lon
gitu
dina
l (m
)
Shy
Figure 3. The trajectories of vehicular agents with different personalities.
Comp. Anim. Virtual Worlds 2014; 25:363–373 © 2014 John Wiley & Sons, Ltd. 367DOI: 10.1002/cav
Animating heterogeneous traffic behaviors X. Lu et al.
ranges of the six adjectives and the three PEN factors are1 � 9.
y D f .X/ (4)
where y indicates one of the six adjectives or one ofthe three PEN factors and X is a vector concatenatingv0, T , s0, a, b, and dmin.
After training these four regression models, we utilizethem to make predictions with the retained 20% test data,respectively. And then we do some comparisons betweenthe predicted data and the real data by computing theirmean square error (MSE) and the normalized root meansquare error (NRMSE), and finally pick out the optimalregression model. The NRMSE is computed by Eq. (5),where ymax � ymin is the range of observed values of thedependent variable being predicted. Table III shows theMSE and the NRMSE between the predicted data and thereal data for different regression models.
NRMSE D
pMSE
ymax � ymin(5)
As observed from Table III, the best fitting model is theMLR model. With any given simulation parameters, theMLR model allows us to compute the corresponding val-ues of high-level behaviors (six adjectives and three PENtraits), thus being capable of predicting related drivingbehaviors.
With the MLR model, we obtain the linear mapping ˇadjbetween the six adjective descriptors and the low-level sim-ulation parameters. Here X D .1, v0, T , s0, a, b, dmin/, and1 represents the offset term.
ˇadj D
0BBBBBBBB@
6.39 6.40 4.73 6.20 4.05 2.900.03 0.02 0.06 0.05 �0.04 �0.04�0.77 �0.50 �0.35 �0.66 0.67 0.86�0.10 0 �0.05 �0.10 0.04 0.150.21 0.04 0.17 0.10 �0.17 �0.290.10 0.19 0.07 0.04 �0.05 0.02�0.03 �0.03 �0.01 �0.03 0.01 0.02
1CCCCCCCCA
ˇpen D
0BBBBBBBB@
6.39 5.47 3.480.02 0.05 �0.04�0.63 �0.51 0.77�0.05 �0.07 0.090.13 0.13 �0.230.15 0.06 �0.02�0.03 �0.02 0.02
1CCCCCCCCA
In a similar way, we also derive a linear mapping ˇpen
for the PEN model. Two adjectives are mapped to onecorresponding factor of the model, shown in Table I.
5. RESULTS
With the computed mappings, we can simulate traffic thatexhibits high or low levels of the six personality adjectives
or the three PEN factors. To be consistent, we limit all sixsimulation parameters within their corresponding ranges.Probably there are a few groups of parameters for a singleadjective, and we just choose one sample for each adjectivein this work, shown in Table IV.
5.1. Simulation Results
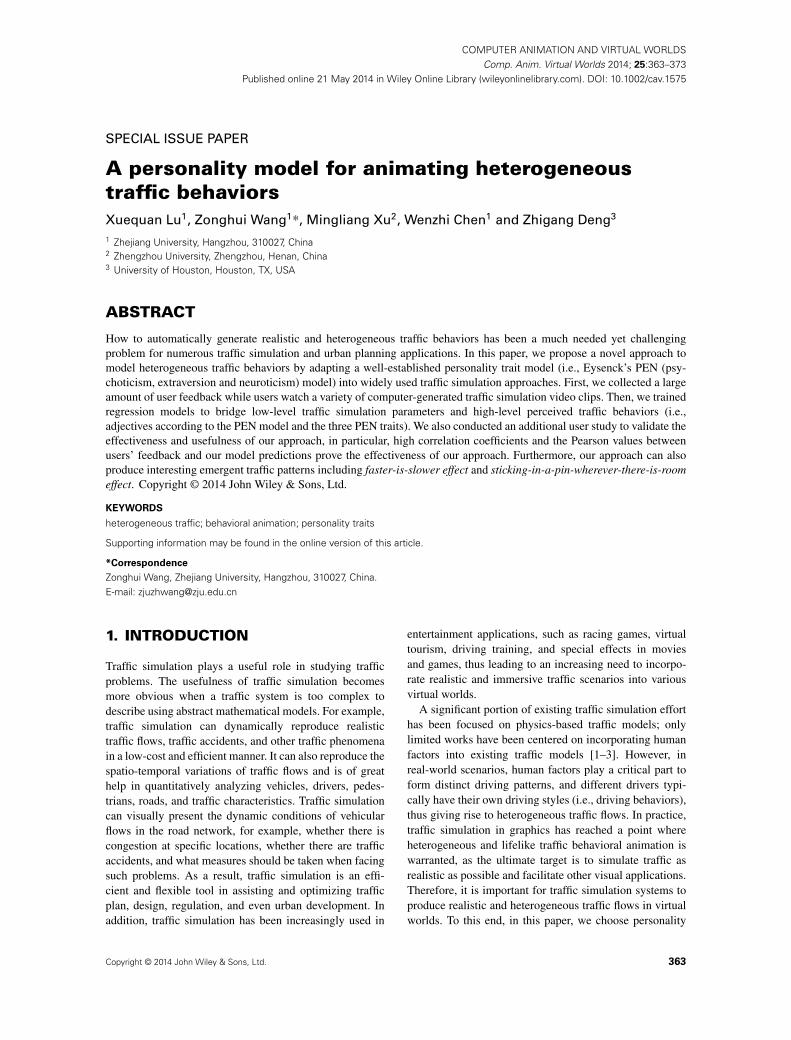
Scenario 1 is a freeway situation, in which rich drivingbehaviors are observed, and we show the trajectories andvelocities of the marked vehicular agents with differentpersonalities in Figures 3 and 4, respectively.
0 5 10 15 20 25 3010
15
20
25
30
35
Time (s)
Vel
ocity
(m
/s)
AggressiveEgocentricActiveRisk−TakingTenseShy
Figure 4. The velocity variations of vehicular agents with differ-ent personalities.
0
5
10
15
20
25
30
35
40
45
Pass
ing
Tim
e (s
)
Aggressive
EgocentricActive
Risk−Taking
Tense Shy
Figure 5. The passing times of vehicular agents with differentpersonalities.
368 Comp. Anim. Virtual Worlds 2014; 25:363–373 © 2014 John Wiley & Sons, Ltd.DOI: 10.1002/cav
X. Lu et al. Animating heterogeneous traffic behaviors
Aggressive agents usually make invasive behaviors andfrequently change lanes. Egocentric agents, which areless aggressive than aggressive ones, typically try to findbenefits by inserting themselves into some place whereverthere is room. Risk-taking agents do not feel afraid to dothings with danger, with little consideration about theirown and others’ situations. Active agents often do thingsactively: accelerating, decelerating, overtaking, changinglanes, or other behaviors with considering their own con-
0% 20% 40% 60% 80% 100%12
13
14
15
16
17
18
19
Percentage of Aggressive Vehicles
Pass
ing
Tim
e (s
)
Faster−Is−Slower Effect
Figure 6. The faster-is-slower effect.
ditions and the surrounding environments. Tense and shyagents always strictly move along a single lane and hardlyperform lane changing, thus leading to more smoothvelocity variations (Figure 4) and a longer interval (see thevideo in the Supporting information).
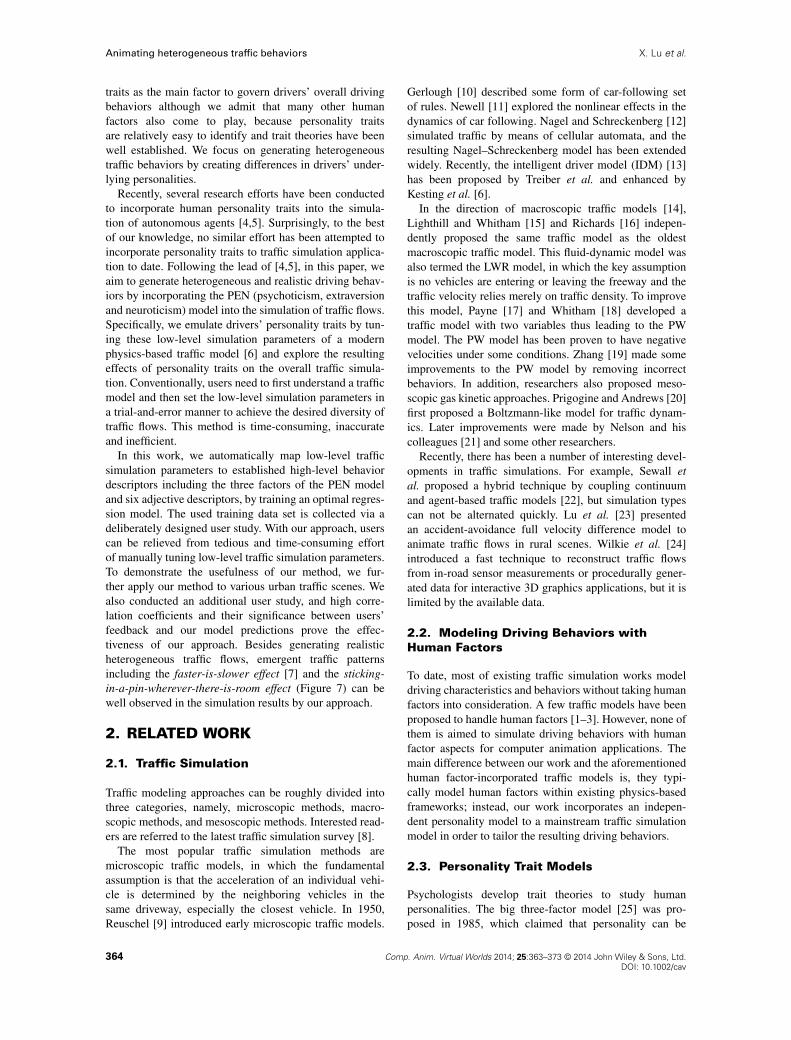
Scenario 2 is a specially designed traffic situation, inwhich vehicular agents with different traits exhibit diversebehaviors. Figure 5 illustrates the passing times of agentswith different traits: aggressive agents, having the short-est passing time, are the fastest to get through, while tenseand shy agents are the slowest to pass through the underconstruction section because they keep a longer distancefrom the leading vehicles and move less quickly.
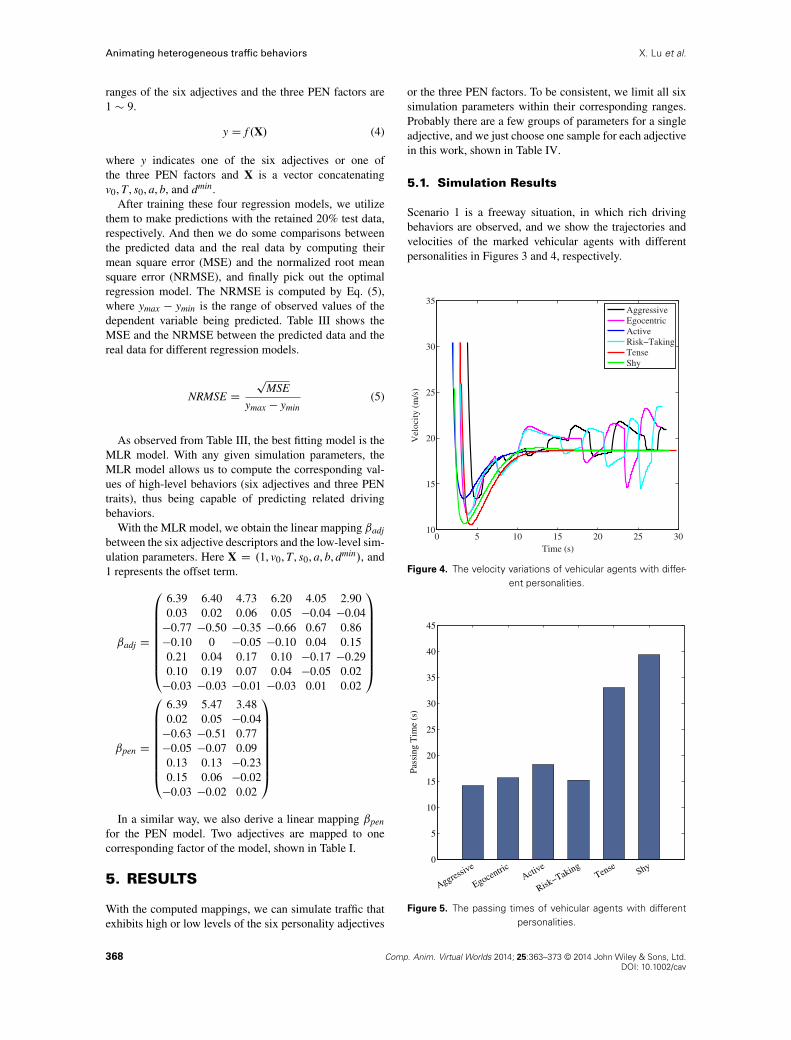
We also observed the emergent faster-is-slower effect [7]when the percent of aggressive agents grows. The passingtime becomes longer when the percent of aggressiveagents exceeds a critical threshold (Figure 6). This effectis typically related with impatience: aggressive agentsalways perform impatient behaviors. When there are a fewaggressive agents in the narrowing traffic scenario, theywill seize the opportunity to quickly pass through the underconstruction section. However, when the percent of aggres-sive agents exceeds a threshold, they fight with each otherand then the clogging appears, thus leading to the increaseof the passing time.
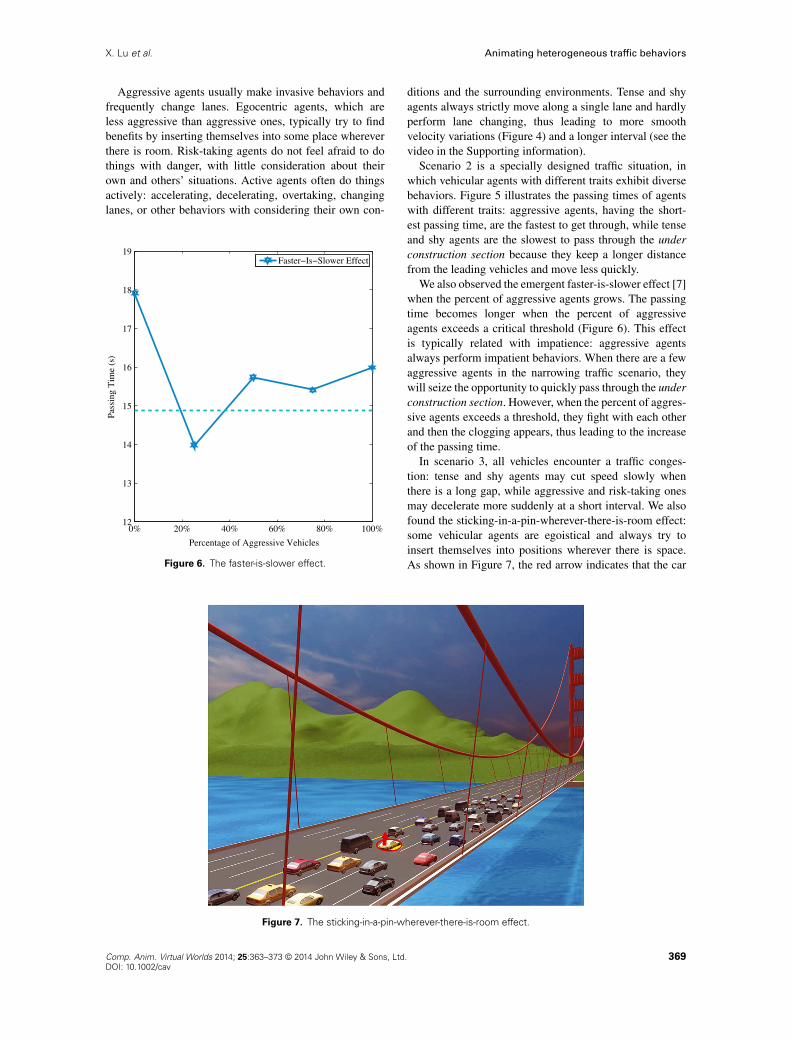
In scenario 3, all vehicles encounter a traffic conges-tion: tense and shy agents may cut speed slowly whenthere is a long gap, while aggressive and risk-taking onesmay decelerate more suddenly at a short interval. We alsofound the sticking-in-a-pin-wherever-there-is-room effect:some vehicular agents are egoistical and always try toinsert themselves into positions wherever there is space.As shown in Figure 7, the red arrow indicates that the car
Figure 7. The sticking-in-a-pin-wherever-there-is-room effect.
Comp. Anim. Virtual Worlds 2014; 25:363–373 © 2014 John Wiley & Sons, Ltd. 369DOI: 10.1002/cav

Animating heterogeneous traffic behaviors X. Lu et al.
Figure 8. Simulating heterogeneous traffic by adapting our method to an urban scene. Vehicles with different colors have differentkinds of personality traits.
Table V. Timing results for all traffic scenarios.
Frames perScenarios Vehicles Faces second
Freeway traffic 60 1446949 659.433Narrowing traffic 56 838660 505.895Crowded traffic 45 1572782 589.857Urban traffic 459 4372694 285.440
surrounded by a red ellipse is moving from one lane toanother to insert itself into a new position, even if there is alittle space.
5.2. Heterogeneous Traffic
Using the derived mappings from the MLR model, we arecapable of generating different traffic behaviors in sim-ulation, thus leading to heterogeneous traffics. Here, weapply our method to an urban scene, shown in Figure 8.Different colors are assigned to vehicular agents by theirpersonality traits; as an example, agents with red color areaggressive. Please see animation results in video from theSupporting information.
5.3. Performance Statistics
Strictly speaking, our technique is a data-driven approach.The user study data can be processed in advance; therefore,our method does not add extra cost to the performance ofruntime simulations.
All the timing results were collected on an IntelCore(TM) i7-3770 3.40-GHz CPU with a GeForce GTX
670 (CPU: Intel Corporation, Santa Clara, CA, U.S. graph-ics card: Nvidia Corporation, Santa Clara, CA, U.S.)graphics card. The runtime results of different traffic sce-narios are shown in Table V.
5.4. Evaluation Study
To validate and evaluate our approach, we also conductedan additional user study. New video clips were createdin this study to reduce bias. It involved 27 participants(ages 18 to 45 years, 12 female, and 15 male). The par-ticipants randomly selected a pair of clips: one using thesampled simulation values in Table IV and the other usingthe default values. Compared with the reference clip, theparticipants were asked to choose which traits the otherclip better exhibits. Note that before asking questions, thethree factors in the PEN model were explained conciselyand explicitly to the participants.
We classified all the answers and calculated the Pear-son correlation coefficients between users’ answers andthe model’s predictions. Furthermore, to demonstrate thatthe results were not induced by accident, we also com-puted the correlation coefficients’ significance. p is thetwo-tailed probability, and 1 � p is the significance. Notethat the coefficient and significance of active trait are lowerthan others’ (Figure 9), because for users, this trait issomewhat difficult to identify and distinguish. The highcorrelation coefficients, as well as the high significancefor other five adjectives (> 0.95) and three PEN traits(> 0.99), validate the strong correlations between partic-ipants’ perception and the model predictions. Therefore,this study demonstrates the effectiveness and usefulness ofour method.
370 Comp. Anim. Virtual Worlds 2014; 25:363–373 © 2014 John Wiley & Sons, Ltd.DOI: 10.1002/cav

X. Lu et al. Animating heterogeneous traffic behaviors
0
0.1
0.2
0.3
0.4
0.5
0.6
0.7
0.8
0.9
1
1.1
Aggressive
EgocentricActive*
Risk−Taking
Tense Shy
Psychoticism
Extraversion
Neuroticism
Correlation CoefficientSignificance
Figure 9. The correlation coefficients between the participants’answers and the model’s predictions for all traits, and thecorresponding correlation coefficients’ significance. * denotes
non-significantly correlated (p > 0.05).
6. CONCLUSION
In this paper, we have presented a novel approach to sim-ulate heterogeneous traffic by training an optimal regres-sion model between low-level simulation parameters andhigh-level personality traits. Our method is able to createinhomogeneous traffic, where vehicular agents exhibit highor low levels of the six adjectives (aggressive, egocentric,active, risk-taking, tense, and shy) and the three PEN traits(psychoticism, extraversion, neuroticism).
To the best of our knowledge, our parameter-to-personality approach is the first-of-its-kind method toanimate traffic behaviors with various personality traits.Our method allows users to be relieved from tedious andtime-consuming work—manually tuning traffic simulationparameters. It should be noted that the default parametervalues for the baseline video clips could be chosen in var-ious ways, and our goal is to enable an easy comparisonbetween the default video clips and the other video clips.The results in our work show that the average form is adecent choice. Our method is not limited to the E-IDM traf-fic model, and it can also be straightforwardly extended toother microscopic traffic models, but needs to derive newmappings between traffic behaviors and new simulationparameters.
Some limitations exist in our current approach. First ofall, computer-generated video clips for user study may beinsufficient. Probably, we can combine this with real-worldtraffic video clips that can display more rich, intuitive,and realistic behaviors. Moreover, a more precisely trainedmodel may be sought out if we find more adjectives.
The future work would be to focus on combiningreal-world traffic video with our current framework andto explore the applicability of our method in real-worldtraffic. We would like to find more adjective descrip-tors to more accurately depict high-level traffic behaviors.Another interesting direction we would also like to pursueis to train an optimal regression model from traffic simu-lation parameters to other trait theories (e.g., the CANOEmodel).
ACKNOWLEDGEMENTS
This research is supported by National Science andTechnology Support Program (Grant 2013BAH23F01),Natural Science Foundation of China (Grants 61328204and 61202207), China Postdoctoral Science Foundation(Grants 2012M520067 and 2013T60706), and ResearchFund for the Doctoral Program of Higher Education ofChina (Grant 20124101120005).
REFERENCES
1. Treiber M, Kesting A, Helbing D. Delays, inaccura-cies and anticipation in microscopic traffic models.Physica A: Statistical Mechanics and its Applications2006; 360(1): 71–88.
2. Kesting A, Treiber M, Schönhof M, Helbing D.Adaptive cruise control design for active congestionavoidance. Transportation Research Part C: EmergingTechnologies 2008; 16(6): 668–683.
3. Treiber M, Helbing D. Memory effects in microscopictraffic models and wide scattering in flow-density data.Physical Review E 2003; 68(4): 046119.
4. Durupinar F, Pelechano N, Allbeck JM, Gudukbay U,Badler NI. How the ocean personality model affects theperception of crowds. IEEE Computer Graphics andApplications 2011; 31(3): 22–31.
5. Guy SJ, Kim S, Lin MC, Manocha D. Simulat-ing heterogeneous crowd behaviors using personalitytrait theory. In Proceedings of the 2011 ACM SIG-GRAPH/Eurographics Symposium on Computer Ani-mation, ACM, Vancouver, British Columbia, Canada,2011; 43–52.
6. Kesting A, Treiber M, Helbing D. Enhanced intelligentdriver model to access the impact of driving strate-gies on traffic capacity. Philosophical Transactionsof the Royal Society A: Mathematical, Physical andEngineering Sciences 2010; 368(1928): 4585–4605.
7. Helbing D, Farkas I, Vicsek T. Simulating dynami-cal features of escape panic. Nature 2000; 407(6803):487–490.
8. Kesting A, Treiber M. Traffic Flow Dynamics: Data,Models and Simulation. Springer: Berlin, 2013.
9. Reuschel A. Vehicle movements in a platoon. Oester-reichisches Ingenieur-Archir 1950; 4: 193–215.
Comp. Anim. Virtual Worlds 2014; 25:363–373 © 2014 John Wiley & Sons, Ltd. 371DOI: 10.1002/cav

Animating heterogeneous traffic behaviors X. Lu et al.
10. Gerlough DL. Simulation of freeway traffic on ageneral-purpose discrete variable computer. Ph.D.Thesis, University of California, Los Angeles, 1955.
11. Newell GF. Nonlinear effects in the dynamics of carfollowing. Operations Research 1961; 9(2): 209–229.
12. Nagel K, Schreckenberg M. A cellular automationmodel for freeway traffic. Journal De Physique I 1992;2(12): 2221–2229.
13. Treiber M, Hennecke A, Helbing D. Congested trafficstates in empirical observations and microscopic simu-lations. Physical Review E 2000; 62(2): 1805–1824.
14. Sewall J, Wilkie D, Merrell P, Lin MC. Continuumtraffic simulation. Computer Graphics Forum 2010;29(2): 439–448.
15. Lighthill MJ, Whitham GB. On kinematic waves. II.A theory of traffic flow on long crowded roads. Pro-ceedings of the Royal Society of London. Series A.Mathematical and Physical Sciences 1955; 229(1178):317–345.
16. Richards PI. Shock-waves on the highway. OperationsResearch 1956; 4(1): 42–51.
17. Payne HJ. Models of freeway traffic and control. Math-ematical Models of Public Systems 1971; 1: 51–60.
18. Whitman GB. Linear and Nonlinear Waves. J. Wiley:New York, 1974.
19. Zhang HM. A non-equilibrium traffic model devoidof gas-like behavior. Transportation Research PartB-Methodological 2002; 36(3): 275–290.
20. Prigogine I, Andrews FC. A Boltzmann-like approachfor traffic flow. Operations Research 1960; 8(6):789–797.
21. Nelson P, Bui D, Sopasakis A. A novel traffic streammodel deriving from a bimodal kinetic equilibrium.In Proceedings of the 1997 IFAC Meeting, Chania,Greece, 1997; 799–804.
22. Sewall J, Wilkie D, Lin MC. Interactive hybrid sim-ulation of large-scale traffic. ACM Transactions onGraphics 2011; 30(6): 135:1–135:12.
23. Lu X, Chen W, Xu M, Wang Z, Deng Z, Ye Y.AA-FVDM: An accident-avoidance full velocitydifference model for animating realistic street-leveltraffic in rural scenes. Computer Animation and VirtualWorlds 2014; 25(1): 83–97.
24. Wilkie D, Sewall J, Lin M. Flow reconstruction fordata-driven traffic animation. ACM Transactions onGraphics 2013; 32(4): 89:1–89:10.
25. Eysenck HJ, Eysenck KM. Personality and Individ-ual Differences: A Natural Science Approach, Appli-cations of Communications Theory. Plenum Press:New York, 1985.
26. Costa P, McCrae R. Revised NEO PersonalityInventory (NEO-PI-R) and NEO Five-Factor Inven-tory (NEO-FFI) Manual. Psychological Assessment
Resources Inc.: 16204 North Florida Avenue, Lutz, FL,
33549, United States, 1992.
27. Block J. A contrarian view of the five-factor approach
to personality description. Psychological Bulletin
1995; 117(2): 187–215.
28. Choudhury CF. Modeling lane-changing behav-
ior in presence of exclusive lanes. Ph.D. Thesis,
Massachusetts Institute of Technology, 2004.
29. Eysenck HJ. Eysenck personality questionnaire, 2013.
30. Eysenck SBG, Eysenck HJ. The place of impulsive-
ness in a dimensional system of personality descrip-
tion. British Journal of Social and Clinical Psychology
1977; 16(1): 57–68.
31. Kesting A, Treiber M. Calibrating car-following
models by using trajectory data: methodological
study. Transportation Research Record: Journal of
the Transportation Research Board 2008; 2088(1):
148–156.
SUPPORTING INFORMATION
Supporting information may be found in the online versionof this article.
AUTHORS’ BIOGRAPHIES
Xuequan Lu is a PhD candidate inthe College of Computer Science andTechnology at Zhejiang University,China. His research interests includecrowd-related animation and geometrymodeling.
Zonghui Wang, born in March1979, is a lecturer in the college ofComputer Science and Engineeringat Zhejiang University in Hangzhou,China. He received his PhD in thecollege of Computer Science andTechnology at Zhejiang University in2007. His research interests focus oncloud computing, distributed system,
computer architecture, and computer graphics.
Mingliang Xu is a lecturer in theSchool of Information Engineering atZhengzhou University, China, and thesecretary of the VR Committee for theChina Society of Image and Graphics.His research interests include com-puter animation, virtual and augmentreality, and mobile computing. Xu hasa PhD in computer science from the
State Key Lab of CAD&CG at Zhejiang University.
372 Comp. Anim. Virtual Worlds 2014; 25:363–373 © 2014 John Wiley & Sons, Ltd.DOI: 10.1002/cav
X. Lu et al. Animating heterogeneous traffic behaviors
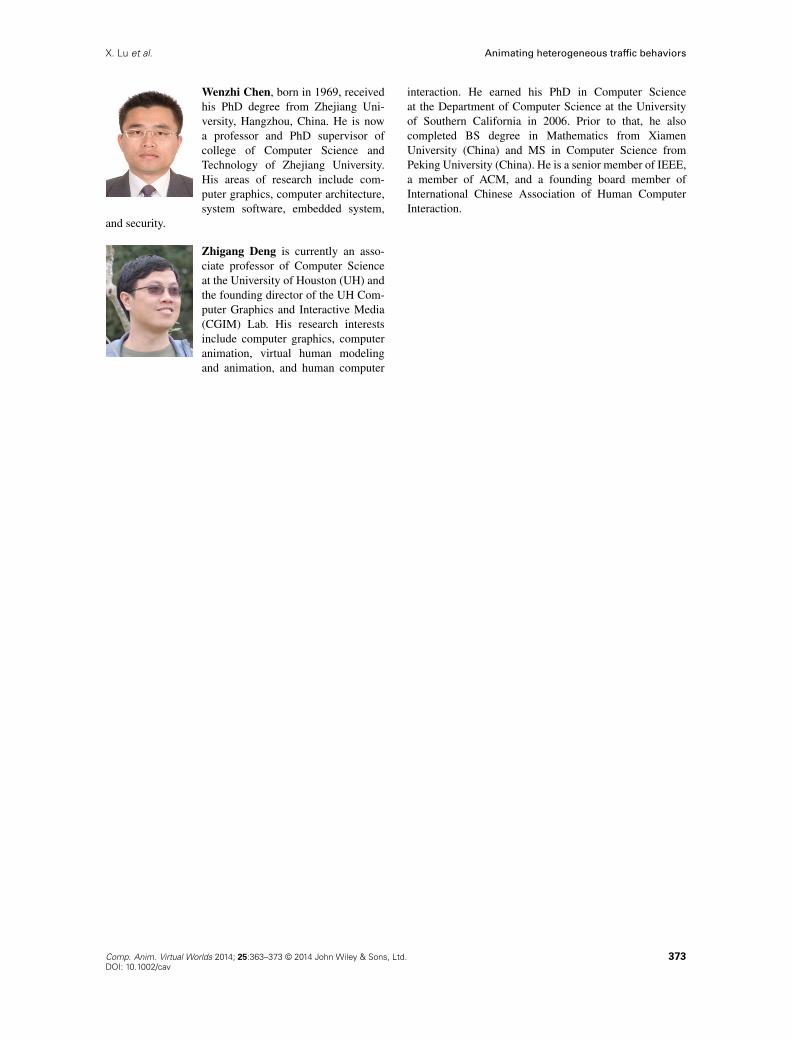
Wenzhi Chen, born in 1969, receivedhis PhD degree from Zhejiang Uni-versity, Hangzhou, China. He is nowa professor and PhD supervisor ofcollege of Computer Science andTechnology of Zhejiang University.His areas of research include com-puter graphics, computer architecture,system software, embedded system,
and security.
Zhigang Deng is currently an asso-ciate professor of Computer Scienceat the University of Houston (UH) andthe founding director of the UH Com-puter Graphics and Interactive Media(CGIM) Lab. His research interestsinclude computer graphics, computeranimation, virtual human modelingand animation, and human computer
interaction. He earned his PhD in Computer Scienceat the Department of Computer Science at the Universityof Southern California in 2006. Prior to that, he alsocompleted BS degree in Mathematics from XiamenUniversity (China) and MS in Computer Science fromPeking University (China). He is a senior member of IEEE,a member of ACM, and a founding board member ofInternational Chinese Association of Human ComputerInteraction.
Comp. Anim. Virtual Worlds 2014; 25:363–373 © 2014 John Wiley & Sons, Ltd. 373DOI: 10.1002/cav