a picture of young children in the u.s. jerry west, ph.d. national center for education statistics...
TRANSCRIPT

A Picture of Young Children in the U.S.
Jerry West, Ph.D.National Center for Education Statistics
Institute of Education Sciences
EDUCATION SUMMIT ON CHILDREN, MEDIA AND LITERACYU.S. DEPARTMENT OF EDUCATION AND PBS

Each year, about 4 million children enter
kindergartenThey come from a variety of backgrounds
• 25 percent are from single-parent households
• 9 percent come from household where English is not the primary language
• 42 percent are racial/ethnic minorities
• 20 percent live in poverty
• 14 percent live with mothers who have not completed high school
• 81 percent were in some kind of regular non-parental care arrangement the year prior to entering kindergarten.

Children’s Early Skills and Achievement

66
30
17
3 10
20
40
60
80
100
Letterrecognition
Beginningsounds
Endingsounds
Sight words Words incontext
Percentage of children in the fall of kindergarten who demonstrate specific reading knowledge and skills: 1998
They begin school with different knowledge and skills
Percent
SOURCE: America’s Kindergartners. NCES 2000-070.

94
58
20
4
0
20
40
60
80
100
Number andshape
Relative size Ordinalsequence
Add/subtract Multiply/divide
* Less than .5 percent
Percent
SOURCE: America’s Kindergartners. NCES 2000-070.
They begin school with different knowledge and skills
Percentage of children in the fall of kindergarten who demonstrate specific math knowledge and skills: 1998

73
36
21
57
21
11
40
115
0
20
40
60
80
100
Letter recognition Beginning sounds Ending sounds
0 risk factors
1 risk factor
2 or more risk factors
They begin school with different knowledge and skills
Percent
SOURCE: The Kindergarten Year. NCES 2001-023. NOTE: Family risk factors include: primary home language was non-English, mother’s highest education was less than high school, living in a single parent household, and family having received welfare assistance.
Percentage of children in the fall of kindergarten who demonstrate specific reading knowledge and skills, by family risk factor index: 1998

Gains in Readingfrom kindergarten through third grade
Mean reading scale scores, by time of assessment: Fall 1998, spring 1999, spring 2000, and spring 2002
SOURCE: From Kindergarten Through Third Grade. NCES 2004-007.NOTE: Estimates reflect first time kindergartners who were assessed in English in all assessment years. First grade refers to the spring of first grade where the majority of the sample was on grade level. Third grade refers to the spring of third grade, where the majority of the sample was on grade level.
108
69
39
27
0
20
40
60
80
100
120
Fall kindergarten
Spring kindergarten
Springfirst grade
Springthird grade
Scale score

Gains in Mathfrom kindergarten through third grade
Mean math scale scores, by time of assessment: Fall 1998, spring 1999, spring 2000, and spring 2002
SOURCE: From Kindergarten Through Third Grade. NCES 2004-007.NOTE: Estimates reflect first time kindergartners who were assessed in English in all assessment years. First grade refers to the spring of first grade where the majority of the sample was on grade level. Third grade refers to the spring of third grade, where the majority of the sample was on grade level.
85
55
32
22
0
20
40
60
80
100
120
Fall kindergarten
Spring kindergarten
Springfirst grade
Springthird grade
Scale score

Gains in Readingfrom kindergarten through third grade, by family risk factors
(risk factors include, living below the poverty level, primary home language was non-English, mother’s highest education was less than high school, and living in a single parent household)
Mean reading scale scores, by time of assessment: Fall 1998, spring 1999, spring 2000, and spring 2002
SOURCE: From Kindergarten Through Third Grade. NCES 2004-007.NOTE: Estimates reflect first time kindergartners who were assessed in English in all assessment years. First grade refers to the spring of first grade where the majority of the sample was on grade level. Third grade refers to the spring of third grade, where the majority of the sample was on grade level.
0
20
40
60
80
100
120
No risks
1 risk
2 or more risks
Fall kindergarten
Spring kindergarten
Springfirst grade
Springthird grade
Scale score

Gains in Mathfrom kindergarten through third grade, by family risk factors
(risk factors include, living below the poverty level, primary home language was non-English, mother’s highest education was less than high school, and living in a single parent household)
Mean math scale scores, by time of assessment: Fall 1998, spring 1999, spring 2000, and spring 2002
SOURCE: From Kindergarten Through Third Grade. NCES 2004-007.NOTE: Estimates reflect first time kindergartners who were assessed in English in all assessment years. First grade refers to the spring of first grade where the majority of the sample was on grade level. Third grade refers to the spring of third grade, where the majority of the sample was on grade level.
0
20
40
60
80
100
120
No risks
1 risk
2 or more risks
Fall kindergarten
Spring kindergarten
Springfirst grade
Springthird grade
Scale score

SchoolCare and
Education
Neighborhood and
Community
Family
Child
Children Develop in Multiple Contexts

Early Care And Education

Young children’s experiences in early care and education
Percentage of children from birth through age six, not yet in kindergarten by type of care arrangement, 2001.
SOURCE: National Household Education Survey. America’s Children: Key National Indicators of Well-Being 2004.
4852
2318 17
26
74
23
14
56
0
20
40
60
80
100
0 to 2 years old
3 to 6 years old
Percent
Parental care only
Total in nonparental
care
Care in home by a
relative
Care in home by a nonrelative
Care in a center-based
program

School-aged children’s experiences in after-school care and education
Percentage of children in kindergarten through third grade by weekday care, 2001.
SOURCE: National Household Education Survey. America’s Children: Key National Indicators of Well-Being 2004. NOTE: Children may have multiple arrangements, percentages may not add to 100.
51
30
23
3
0
20
40
60
80
100Percent
Parental careonly
Home based care
Center-based care
Self-care

Child Health

88
63
27
0
20
40
60
80
100
Any health insurance Private insurance Government insurance
Access to health care
Percentage of children ages 0 to 5 covered by health insurance, by type of insurance, 2002
Percent
SOURCE: U.S. Census Bureau, Current Population Survey, March and Annual Social and Economic Supplements. America’s Children: Key National Indicators of Well-Being 2004.
For children with insurance, basic type of insurance

7469
67686868687076
73 74 74 73
90888888898885858584858485
0
20
40
60
80
100
1990 1991 1992 1993 1994 1995 1996 1997 1998 1999 2000 2001 2002
Below poverty
At or above poverty
Children’s general health
Percentage of children ages 0 to 4 in very good or excellent health by poverty status,1990-2002
SOURCE: U.S. Census Bureau, Current Population Survey, March and Annual Social and Economic Supplements. America’s Children: Key National Indicators of Well-Being 2004.
Percent

57
4337
41
0
20
40
60
80
100
Percentage of kindergartners in excellent general health
White
Black
Hispanic
Asian
Kindergartners general health
Percentage of first-time kindergartners in excellent general health, by child’s race/ethnicity: Fall 1998
Percent
SOURCE: America’s Kindergartners. NCES 2000-070. NOTE: White children are more likely than Black, Hispanic or Asian children to be in excellent general health.

Children’s Families And Homes

2223242526262423 2118 18 18 19
0
20
40
60
80
100
1990 1991 1992 1993 1994 1995 1996 1997 1998 1999 2000 2001 2002
Children in poverty
Percentage of related children under age 6 living in poverty, 1990 to 2002
SOURCE: U.S. Census Bureau, Current Population Survey, March and Annual Social and Economic Supplements. America’s Children: Key National Indicators of Well-Being 2004.
Percent
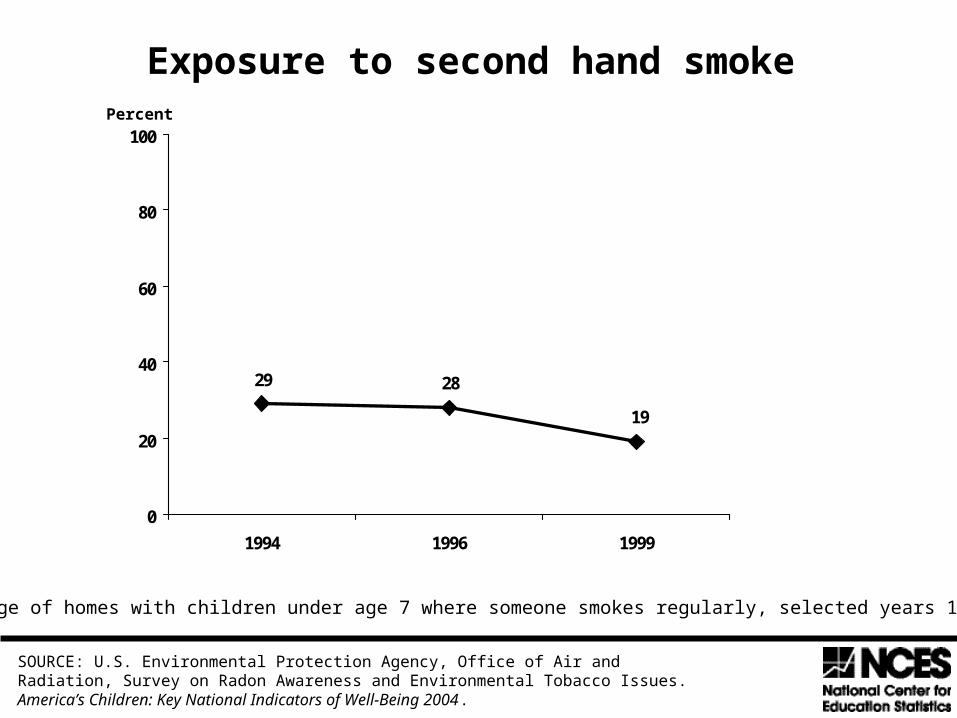
19
2829
0
20
40
60
80
100
1994 1996 1999
Exposure to second hand smoke
Percentage of homes with children under age 7 where someone smokes regularly, selected years 1994-1999
SOURCE: U.S. Environmental Protection Agency, Office of Air and Radiation, Survey on Radon Awareness and Environmental Tobacco Issues. America’s Children: Key National Indicators of Well-Being 2004.
Percent

75
87
38
68
0
20
40
60
80
100
All children livingwith parents
Children livingwith 2 parents
Children livingwith a single
mother
Children livingwith a single
father
Secure parental employment
Percentage of children under age 6 living with at least one parent employed full time all year, by family structure, 2002
Percent
SOURCE: U.S. Bureau of Labor Statistics, March Current Population Survey. America’s Children: Key National Indicators of Well-Being 2004.

Children At The Time of Birth

Very low (3.3 pounds or less)
1%Low (more than
3.3 to 5.5 pounds)6%
Normal (more than 5.5 pounds)
93%
Birth weight
Percentage distribution of children born in 2001, by birth weight: 2001
SOURCE: Born in 2001: First Results From The Early Childhood Longitudinal Study, Birth Cohort (ECLS-B), NCES 2005-036

Premature (less than 37 weeks
gestation)12%
Term88%
Prematurity
Percentage distribution of children born in 2001, by prematurity: 2001
SOURCE: Born in 2001: First Results From The Early Childhood Longitudinal Study, Birth Cohort (ECLS-B), NCES 2005-036

40 years old or older2%
15 to 19 years old11%
20 to 29 years old52%
30 to 39 years old35%
Age of mother at time of birth
Percentage distribution of children born in 2001, by age of mother at time of birth: 2001
SOURCE: Born in 2001: First Results From The Early Childhood Longitudinal Study, Birth Cohort (ECLS-B), NCES 2005-036

• Children develop and learn in multiple contexts
• When children enter school, they are already demonstrating varying knowledge and skills
• Helping children succeed in life begins early and relates to not only their schooling, but also to
– their nonparental care and education– their health and well-being– their home life
