a piezometer method of measuring soil permeability and
TRANSCRIPT

Retrospective Theses and Dissertations Iowa State University Capstones, Theses andDissertations
1949
A piezometer method of measuring soilpermeability and application of permeability data toa drainage problemJames Nicholas LuthinIowa State College
Follow this and additional works at: https://lib.dr.iastate.edu/rtd
Part of the Agriculture Commons, and the Soil Science Commons
This Dissertation is brought to you for free and open access by the Iowa State University Capstones, Theses and Dissertations at Iowa State UniversityDigital Repository. It has been accepted for inclusion in Retrospective Theses and Dissertations by an authorized administrator of Iowa State UniversityDigital Repository. For more information, please contact [email protected].
Recommended CitationLuthin, James Nicholas, "A piezometer method of measuring soil permeability and application of permeability data to a drainageproblem " (1949). Retrospective Theses and Dissertations. 14091.https://lib.dr.iastate.edu/rtd/14091

NOTE TO USERS
This reproduction is the best copy available.
UMI


A PIEZOMETER METHOD OP MEASURIIG SOIL
PKRMEABILITY AID APPLIGATIOI OF PERMEABILITY DATA
TO A DRAIIAGfi PROBLEM
by
James Micholas LutMa
A fliesis Submitted to the
Graduate Paeiilty for the Degree of
DOCTOR OF PHILOSOPHY
Ma^or Subject; Soils
Approved;
Head of Major Department
Dean of 'Graduate Ooliege
Iowa State College
1949
Signature was redacted for privacy.
Signature was redacted for privacy.
Signature was redacted for privacy.

UMI Number: DP13349
INFORMATION TO USERS
The quality of this reproduction is dependent upon the quality of the copy
submitted. Broken or indistinct print, colored or poor quality illustrations and
photographs, print bleed-through, substandard margins, and improper
alignment can adversely affect reproduction.
In the unlikely event that the author did not send a complete manuscript
and there are missing pages, these will be noted. Also, if unauthorized
copyright material had to be removed, a note will indicate the deletion.
UMI UMI Microform DP13349
Copyright 2005 by ProQuest Information and Learning Company.
All rights reserved. This microform edition is protected against
unauthorized copying under Title 17, United States Code.
ProQuest Information and Learning Company 300 North Zeeb Road
P.O. Box 1346 Ann Arbor, Ml 48106-1346

S 5 9 f
L317P
-ii-
fABLl OF COITEHTS
Page
I. IlfRODUCTIOI 1
II. RE?IEf OF LITSRAfURE 4
A. Darcy's Law 4 B. Equation of Flow 7 0. PerBieability Units 9 D. Methods of Measurement 10
1. Laboratory metliods 11
a. The disturbed sample 11 b. The undisturbed sample 11
2. Indirect methods . 12 3. Field methods 12
a. Unlined wells 12 b. Lined wells 13 e. tracers 14
S. Factors Affecting Soil Permeability 15
1. Entrapped air 15 2. Microorganisms 17 3. Salts 20 4. Temperature 20
F. Solution of Flow Problems 21
1. Analytical methods 21
a. Bapuit-Forchheimer theory 21 b. Kirkhaai-Gardnex approach . 25
2. Graphical methods of Dachler, Caaagrande, and Forehheiaer 26
3. The hodograph 27 4. Membrane analogue 28 5. llectrical analogue 29
lumerical methods 31
T "^0 40

-iii-
Page
III. THl PROBLIM 36
A. Piezometer Method for Measuring Soil PeriaeaMlity , . . . 36
1. Field procedure 36 2. Field tests . 40 3. Laboratory procedure ..... 45 4. Results of field tests .......... 50 5. Laboratory results 68
B. Application of Permeability Data to a Drainage Problea 73
1. Procedure 74
a. Draimage of soil with uniform p e r r a e a b i l l t y . . . . . . . . . . . . . 7 7
b, Dralmge of soil with non-uniforw permeability 84
IV. GONGLUSIOIS AID SUMMAET 96
¥. LITSIATURI OlfED 97
¥1. ACIIOfLED^ffilT .103

xao.
1
2
3
4
5
6
7
8
9
10
11
13
Page
5
51
52
53
54
56
57
59
61
62
63
94
-i¥-
LIST OF TABLES
Relation of Preesmre to Flow Through Glay-SeelhMai ( 60).
Field Test Data
Field Tftst Data
Field Test D®.ta
Field Test Bata
Field Test Data
Field Test Data
Field Test Data
Field Test Data
Field Test Data
Field Test Data
Results of luraerieal Analysis

-V-
LIST OF FiaURlS
Fig. Page
1 Illustrating Darcy*e Law. Gardner (38). 6
8 Changes in Peraieability of Soils During Long Submergence. Allison (l), 18
3 PermeaMlity-fime Curves for Hanford Loa® Under Prolonged Submergence. Allison (l). 18
4 Dupuit-Forchlieimer Theory of Soil Drainage. 24
5 Points on let 34
6 Relaxation Pattern. 34
7 Piezometer Method of Measurement of Permeability. 37
8 Installing the Piezometer. 37
9 Flushing out the Piezometer. 39
10 Applying Suction to the Piezometer. Upper Stopper is for a 2-lnch Piezometer. 39
11 Measuring Water Elevation with Reel-Type Electric Probe 44
12 Removing a l-inch Piezometer with Veihmeyer Soil Tube Jack. 44
13 Cirmiit for Location of Equipotential Surfaces. 47 frevert (27).
14 Circuit for Determination of A-function* Frevert (27 ) 47
15 Plot of Field Data to Show Linear Relationship Between In(d-y) and Time t. 48
16 Variatioa of A-funotion with Diameter of Cavity for a 4-inch Long Cavity (For Values of s and d See Text). 69
17 Variation of A-function with Length of Cavity for a 1-inch Diameter Cavity (For Values of s and d See Text). 69
-•ri-
Fig. Page
18 fariation of A-fuactioii ?dth. s, for a Cavity 4-iaehes leag and l-iach in Maaeter. 71
19 Iqiiipotential Surfaces for a Piezometer Cavity. 71
20 Sxample of Mtbaiaim Proeedure, 75
21 Iquipoteatial Plots for Gase of iDralnag© of Uniform Soil. S©« Text for Details. 80
22 Point l€ar a Gurved Boundary. 81
23 Point on an Interface.- 86
24 Point at Upper Oorner. See Text. 89
25 Point at Lower Oorn®r, S@e Text. 89
26 Iquipottntial Plot for Drainage of a Two-layered Soil. 91
27 Icpipotential Plot for Drainage of a Two-layered Soil. 93
28 fiquipotential Garves for Drainage of a Two-layered Soil 93

I. IITROOTGTIOir
It has long toe®n recognized that soil permeability is an
iBEportant factor in land management, soil conservation and land
drainage. Muoh work has been dxjne on methods of measuring soil
permeability and various sehemes have been devised to apply the
information to the design of drainage systems, dams and other
engineering structures.
In general, the measurement of soil permeability has con
sisted of taking a sample of soil from the field into the labo
ratory in either a disturbed or an undisturbed state, passing
water through the sample, and determining its permeability by
use of suitable equations. Such methods of permeability meas
urement have been unsatisfactory for many reasons.
Recently several faethods of determining soil permeability
in the field have been proposed. In 1936 Hooghoudt augered out
a hole in the soil below the water table and observed the rate
of rise of water in the hole. By means of approxiLiate formu
las he was able to calculate the soil permeability. Kirkham
and Van Bavel pointed out certain defects in Hooghoudt's formu
la and derived a more exact equation based on a solution of
Laplace's equation. They tried out the method \?ith success on
several Iowa soils.
In 1945, Kirkham proposed a field method of measuring
soil permeability x'yhich consisted of driving pipes into the

-2-
soil below a water table and meaiuring the outflow of water
frotB the pipe® into the soil. This proposed method was tried
out by Fre^ert and Kirfchaa, They found that it was necessary
to remote the soil from the interior of the pipe and they also
noted that a lauoh laore aecurate measure of the permeability was
obtained by permitting the water to flow into the pipe from the
soil rather than using the outward flow from the pipe into the
soil. Because driving the pipes into the soil compresaed the
soil, they had to use pipes of large diaaeter (8 inches). The
depths to which the soil permeability could be measured were
lifflited to 36 inches because of the equipment used, and special
tools were needed to remove the pipes from the ground.
the preceding field methods have in common certain ad
vantages over any laboratory methods which have been proposed.
First, the soil permeability is measured in situ; second, soil
water is itself used for the measurement; and third, root holes,
worm holes, and rocks have a negligible effect on the deter
mination.
There are, however, certain limitations to these field
aethods. Both of them are limited to shallow depths below the
soil surface and the auger hole method, as it gives a sort of
average permeability over the length of the auger hole, will
not Indicate the permeability of specific layers or horizons.
To overcome the limitations of the above methods, a new
procedure, utilizing pipes of small diameter (piezometers).

-•o«»
has been developed. Tiie method consists basically in measuring
the ratt of flow into a canity at the base of an emptied pie-
^offleter. Advantages of the method are (l) the permeability can
be measured to great depths, (2) the permeability of any layer
in the soil can be measured, (3) the method is quick, acciirate
and simple, fhe deirelop»ent of this method, \i^ich includes
use of a three-dimensloiial electric analogue of the groundwater
problem., constitutes two parts of t&ls thesis.
Kirkhaa has solTed the problem of steady-state flow into
tile drains in a uniform soil but there is no general solution
that will handle all of the complex Tarlations found in natural
soil. Similar types of problems are encountered in the fields
of heat flow, electricity, and hydrodynamics and various in
vestigators have developed numerical methods of obtaining ap
proximate solutions to any desired degree of accuracy. Because
of the similarity of these types of problems, it is evident
that numerical method® qbm also be applied to problems of land
drainage. The development and application of suitable numerical
methods to land drainage constitute a third part of this thesis.
-4-
II. REVIEl OF IiITSRATURE
A fflore thorough review of the literature on soil permea-
bllitir can he found in Freveart's (27) thesis. However this
subject will be covered here in brief.
A. Darcy's Law
The rBDvemeat of fluids through porous media has long been
of great practical importance to agriculturists concerned with
irrigation and drainage and to engineers interested in the flow
of fluids into wells and through filter beds. Since most porous
media can be regarded as a macroscopic collection of more or
less discontimioua capillary tubes, the first experimental
studies which can b© regarded as forming the basis of our pres-
ent-day knowledge of water flow through soils were performed
by Hagen (32) in 1839 and by Poiseuille (53) in 1846. These
investigators studied the flow of fluids through capillary
tubes and from their observationa concluded that the rate of
flow is proportional 1;o the hydraulic gradient.
In 1846 a French hydraulic eiigineer, Darcy, used experi
mental methods to study the flow of water thro\;^h sand filters.
His classic experiments led to the result - now referred to as
Darcy*9 law - that the rate of flow of water through the fil
ter bed was directly proportional to the area of the sand and
to the difference of the fluid heads at the inlet and outlet

—5—
faces of thte bed, and In-^erssly proportional to the thickness
of the hed. (See fig. 1.) Expressed mathematically, Darcy*8
law becomes
Q K I A (1)
where
Q = discharge "velocity
K = coeffioient of periseatoility
A s cross sectional area of bed
L = length of bed
h « difference in head between outlet and inlet faces.
The •B'alidity of Darcy*s law has been confirmed by many
experimenters, aost of ^om used sand separates in their tests.
Since OUT main interest is the application of Darcy*3 law to
the moveraent of water through soils we may consider SeelhetM
(60) to be the first in-s'estigator to use soil in a check of
Darcy's law. The data (in part) -hich SeeHieim obtained is
Included in table 1.
fable 1
Relation of Pressure to Flow Through Clay - Seelheim (60)
Pressure list SjISas. Me^ 150 Gffl. 60 12 c 0.59 cc 100 cm. 60 13 c 0.39 cc
fhese results, though limited, ooafirm the application of
Darey*s latt to fluid flow through clay.
Teraa^hi (66) in 1925 showed that Darcy*s law can be ap
plied to the flow of water through clay and concluded that it

y=k(h,-h;) h,-h.
t-v=kV$]
V
Fig. 1. Illustrating Darcy*s Law. Gardner (38)
7-
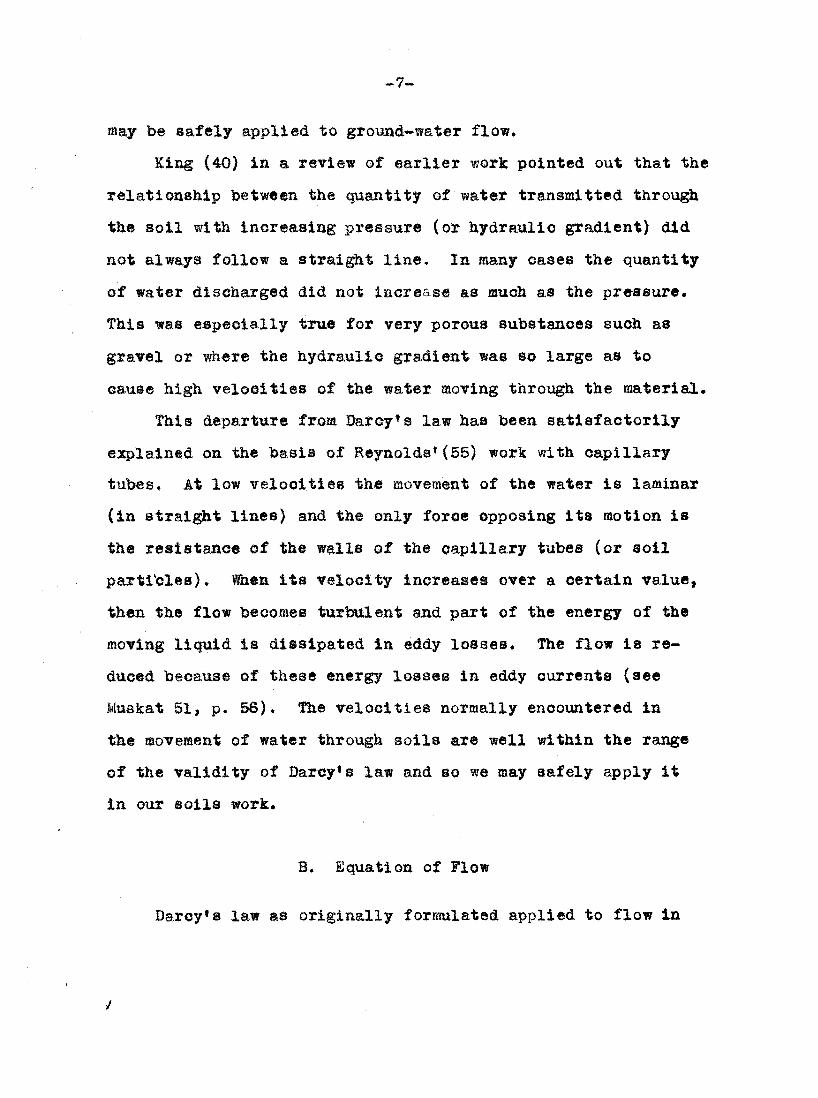
may be safely applied to grouad-irater flow.
Kiag (40) ia a review of earlier work pointed out that the
relatioaship between the quantity of water transmitted throvigh
the soil with increasing pressure (or hydraulic gradient) did
not always follow a straight line. In many cases the quantity
of water discharged did not increase as much as the pressiire.
This was especially true for very porous substances such as
gravel or where the hydraulic gradient was so large as to
cause high velocities of the water moving through the material.
This departure from Darcy's law has been satisfactorily
explained on the basis of Reynolds*(55) work with capillary
tubes. At low velocities the movement of the water is laminar
(in straight lines) and the only force opposing its motion is
the resistance of the walls of the capillary tubes (or soil
parti'cles). Ihen its velocity increases over a certain value,
then the flow becoaies turbulent and part of the energy of the
moving liquid is dissipated in eddy losses. The flow is re
duced because of these energy losses in eddy currents (see
Muskat 51, p. 56). The velocities normally encoimtered in
the aoveiaent of water through soils are well within the range
of the validity of Darcy's law and so we may safely apply it
in our soils work.
B. Equation of Flow
Darcy's law as originally formulated applied to flow in
/
8-
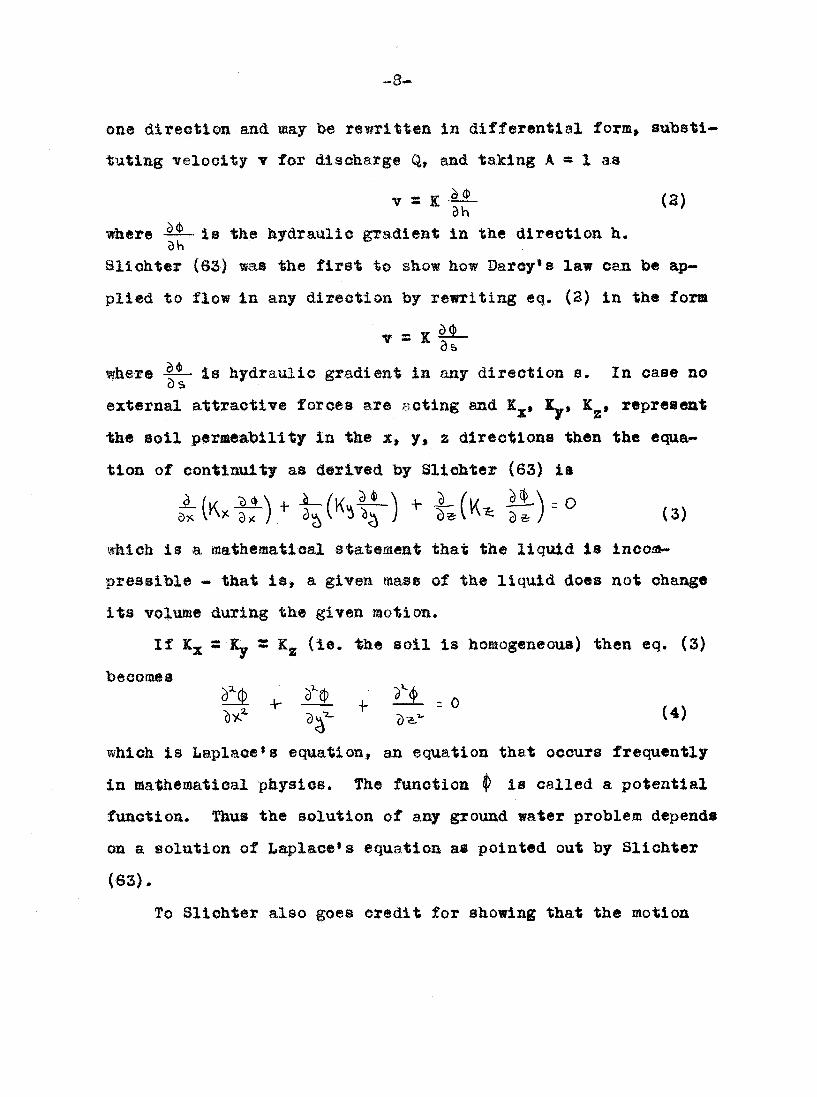
one direction and nay be rewritten ia differential form, substi
tuting Telooity v for discharge Q, and taking A » 1 as
V = K (2) oh
where is the hydraulic gradient in the direction h.
Slichter (63) was the first to show how Darey's law can be ap
plied to flow in any direction by rewriting eq, (3) in the form
where 4^ hydraulic gradient la any direction s. In case no o s
external attractive forces are acting and K^, Ky, K^, represent
the soil peraeability in the x, y, z directions then the equa
tion of continuity as deriTed by Slichter (63) ia
(3)
which is a osathematical statement that the liquid is inco/a-
preasible - that is, a given taass of the liquid does not chaise
its volume during the given motion.
If Kjj s Ky - Kg (ie, the soil is hostogenecaas) then eq. (3)
becomes
^ ^ ill = 0
which is Laplace's equation, an equation that occurs frequently
in mathematical physios. The function is called a potential
function. Thus the solution of any ground water problem depends
on a solution of Laplace's equation as pointed out by Slichter
(63).
To Slichter also goes credit for showing that the motion

9-
©f ground water is analogous to the flow of electricity, the
fl©w of heat, or to a problem In the steady motion of a perfect
fluid. Slichter noted that the gravity factor should be included
in the equations of motion and much of the present day work on
the theory of ground-water moveffient is based on the relationships
discoirered toy him.
C. Permeability Onita
Although soil permeability has been under intensive investi
gation for almost 100 years, there is still no generally accepted
method of expressing the permeatoillty factor or coefficient (K in
eq. 1). Richards (56) suggested that k in the equation
V s ki (5)
where v « quantity of water flowing per unit time per unit area
i as hydraulic grMient
be used. This is the Daroy coefficient and has the convenient
dimensions of velocity (e.g. c® per sec). (The effect of vis
cosity is included in eq. (S) as a dimensionless ratio.) Veloc
ity of flow is in common usage in engineering and hydrologic
work and possesses certain advantage over other methods of ex
pression.
BodraanC?) has suggested a unit of permeability having the
dimension of time according to the following equation.
^•8 = f-i-l/h
where
Pg « permeability coefficient
-10-
g/h = hydraulic gradient
Q/t = discharge velocity
A « orosB sectional area
1 «• length of column
Wyckoff, Botsetj Muskat and leed (73) have introduced th«
visoosity of the fluid into Darcy's equation, thus giving K, tie
dimension of an area. This coefficient waa called the "darcy*
and was defined as the voluiae of fluid of one centipoise vis
oosity passing throu^ a one square om. cross section in one
second under the action of a pressure gradient of one atmos
phere per oai.
Richards (57) later presented a new unit called the "dar**,
which had the dimension of time and was numerically equal to
the mass of the liquid crossing unit area in unit time per
unit pressure gradient per centipoise viscosity* This uait
had the advantage that it was independent of the system of
measurements used (metric or English) and was also adaptable
to a wide range in permeabilities.
Edlefsen (20, p. 431* 432) pointed out that "In some
studies, it is probably preferable to use one form of the
permeability-coefficient, while in other studies, it might
be more convenient to use a different form."
D. Methods of Measurement
lo attempt will be made here to review all of the various

methods of measuring permeability, sinoe there are almost as
many methods in use as there are investigators, tout rather some
of the general features of each method will be described.
1. Laboratory methods
a. The disturbed sample.
In the use of disturbed soil samples the soil ia collected
in the field and is packed into permeameter tubes in the labo
ratory. Mo special attempt is laade to preserve the natural
structure of the soil when filling the permeameter. This
method has met with success in its application on the struc
tureless soils of Western United States in studies of the
effects of various treatments on soil permeability. The
permeability values obtained are not necessarily related to
the permeability of the soil in th^ field but serve to indi
cate the relative effects that various soil treatments might
have in the field. Fireman (22, p. 337) discussed this method
in detail and stated that,
In many cases permeability values obtained In the laboratory may not even sp proximate the percolation rates .... Preliminary tests indicate that, regardless of the correlation between laboratory and field percolation rates, the relative change in permeability obtained in the laboratory as a result of any given treatment is closely correlated with the relative change in percolation rate obtained in the field as a result of a similar treatment.
b. The undist\irbed sample.
¥arious investigators have devised methods of obtaining
so-called undisturbed soil samples. In general these methods

h&we consisted of inserting a metal cylinder into the soil and
removing the cylinier filled itfith soil. The soil-filled cylin
der is then taken into the laboratory where permeability meas-
mrements are made. Large errors enter into the determination
because of the presence of root holes and rock in a sample that
is necessarily small and the tremendous variation between repli
cates makes it impractical to apply the results in the field.
2. Indirect methods
Many soil properties such as hygroscopicity (59), pore
sise distribution (3, 4, 5, 49, 52), point of inflection on
a pF curve (3), size and shape of the soil grains (63), per
centage of elutriable particles of certain sizes (59), have
been used in an effort to find some soil property that can be
correlated with soil permeability. In spite of the great amount
of work done no generally satisfactory method has been foxuid
that can be applied to soils over a wide region. Firensan (23,
p. 340) in a discussion of indirect methods of making permeability
measurements concluded that,
Kiese methods have not been of particular value except in special cases such as the evaluation of probable permeability to air. . . ., nor do they usually involve a saving in effort or expense.
3. Field methods
a. Unllned wells.
fenzel (71) in a review of the literature on methods of
permeability measurements classified the methods of measuring

-13-
permeaMllty froa unlined wells as those imrolvliig observations
oa the drawdown of the well and those involving the rate of re^
covery of the water table. ?ariome equations have been devel
oped for calculation of the permeability from the above meas
urements. A basic assumption of the derivation is that the
Gone of depression around the discharging well has reached
equilibrium (steady-state flow of water). Jacob (39) has de
veloped a foriTOla based on a nonequilibriiiffl state.
In the field of soils Diserens (18) and Kozcny (47) have
proposed digging an auger hole into the soil, and observing the
rate of rise of the water in the hole. Hooghoudt (38) developed
formulas for calculating the soil permeability from the observed
rate of rise of the water in the hole but his equations are not
based on solutions of Laplace*s equation and their validity has
been questioned by Kirkham (45). Kirlcham and Van Bavel (45) and
Tan Bavel and Klrkham (68) have developed ©ore exact formulas
based on solutions of Laplace*s equation and have applied the
method to several Iowa soils.
b. Lined wells.
The lined well method consists of inserting a tube, pipe,
or cylinder into the soil and observing the rate of flow of
water into or out of the pipe. This method has been widely
used (26) in a study of the relative rates of infiltration of
water into different soils. Suitable equations for calculating
the soil perioeability from these observations were lacking un
til lirkham (41) in 1945 solved the problem for a steady-state

14-
oondition. The method of permeaMllty meaeureraent developed
in this paper makes use of the formulas given by Kirkham and
follows somewhat the methods proposed by him.
larlier in 1932 Kozmy (46) proposed a similar method of
driving tubes 10 Offl in diameter below the water table and ob
serving the rate of fall of wster in the pipe after the soil had
been removed from the interior of the pipe. The formulas which
Kozmy developed were based on several approximations and
Kirkhaffi (41) has questioned their validity,
e. Tracers.
Tracers have been effectively used to measure the velocity
of ground-water movement and the results have been summarized
by Tolman (67) and fensel (71). Tracers that have been used
include salt solutions of 11401 and laOlt and dyes such as
flourescein.
The movement of the salt solutions has been followed by
observing the change in electrical conductivity of the ground
water. Wenzal (71) in a discussion of the use of salt solu
tions as tracers pointed out that salt water is heavier than
the ground-water and laay flow downward so as to miss the point
at which the sample is taken,
Tolman (67) in a discussion of the use of dyes aa tracers
stated that they may be more accurate than salt solutions but
their us© is Halted due to their interaction with the organic
matter of the soil.

•15-
S. Factors Affecting Soil Permeability
learly all of the work that has been done on the factors
which affect soil permeability has been done in the laboratory
and most of the results obtained are merely qualitative in char
acter. Much work remains to be done to determine the magnitudes
of the effects that these 'Various factors have on soil permea
bility in the field.
!• Intrap-ped air
A review of the literature indicates that air entrapped in
the pores of the soil is one of the ma^or causes for the failure
of permeability neasuretaents made in the laboratory. Evidence
is lacking on the effect in the field of air entrapped in the
soil but judging froa laboratory experiments it must be of a
considerable magnitude. Its influence must be particularly
great during the initial wetting of a dry soil by rain or by
irrigation water. As the air is dissolved in the percolating
water, its effect on the permeability is decreased until after
a period of tlrae all of the air has been dissolved out of the
soil.
Ohristianacn (14) on the basis of his work on the effect
of entrapped air, concluded that the permeability of the soil
may be reduced to 1/30 of its air-free permeability. The time
required to dissolve the air out of the soil in the percolate
varied from 3 to 53 days.
In laboratory permeability determinations, it was at first
tbought that the air could b® driten out of the soil by wetting
the soil froffl the bottom. This idea is now regarded as falla-
eious since it really makes little difference whether the soil
is wetted from the bottoa or the top. The qualitative reason
for the effect of the entrapped air reraains the same. According
to Wyckoff and Botset (72) an explanation of this phenomena was
given by Jamia for the flow of fluids in constricted capillary
tubes that contained gas bubbles. The presence of a constric
tion or an abrupt change in diameter of the capillary acts as
an obstruction to the gas bubble and it will not flow through
the non-uniform section unless a certain critical force is
exerted on it. A bubble advancing into the constricted portion
of the tube must suffer distortion which Involves an increase
in the surface energy at the Interface between the gas and the
liquid at the small radius end of the bubble. This makes the
surface tension forces unequal with the net stress being to
drive the bubble back and out of the constriction. The appli
cation of a slight external pressure will only serve to drive
the bubble back into the constriction where it will remain
stationary in equilibriuM with the externally applied force.
If this qualitative explanation is valid then it does liot make
any difference ?jhether the water is introduced from the top or
from the bottom as has been advocated by some investigators.
Since air is soluble in water and will in time be dis
solved in the water percolating through the soil, a novel

-17-
method of eliminating the air from the soil was suggested by
ChTistismsen, Fireman, and Allison (16), who first displaced
the soil air with carbon dioxide. Carbon dioxide is readily
soluble in water and when water is added to the soil the car
bon dioxide goes into solution and an air-free soil results.
Wetting the soil under a mcuuffi is another technique used
to eliminate the errors due to entrapped air (64).
2. Microorganisms
Recent investigation on the influence of microorganisms
on soil structure and soil permeability indicate that they may
be much more important in their effect on soil permeability than
heretofore realized.
Although ffork by early investigators (69) indicated that
Microbes and their decomposition products may influence soil
perraeability, Allison (l) in 1947 was the first to show con
clusively the magnitude of this effect. His results show that
under conditions of long submergence the microbial bodies and
the gxjuas and slimes produced in the decomposition of organic
matter may plug up the pores of the soil so that the permea
bility is markedly reduced. The generalized perraeability
curve obtained in the laboratory under long submergence is
shown in fig. 3. Allison (l, p. 440, 441) gives the following
explanation of this curve.
Phase 1. After initiating field or laboratory tests, the permeability decreases to a minimum. On highly permeable soils this initial decrease is small, or nonexistent, but for relatively impermeable soils, it may be appreciable and

-18-
FIG. 2, CHANGES IN PERMEABILITY OF SOILS DURING LONG SUBMERGENCK""-^H i S Oil
PCRMEABtLITY
CW/HR.
STERILe SOIL a WATER
STERILE SOIL-REINOCULATEO CONTROL
70 60 50 40 TIME-DAYS
30 20
FIG.3. PERMEABILITY-TIME CURVES FOR HANFORD LOAM UNDER PROLONGED SUBMERGENCE—AXLISOH

-19-»
OQatinme for 10 to 20 days before the second phase of Increase 1® apparent. The decrease in permeability it probably due to structural changes resulting in part from swelling and dispersion ©f the dry soil upon wetting and in part to dispersion resulting fro» a decrease in electrolyte content of the soil solution as any salts present are removed in the percolate.
Phase 2. When soils are wetted from the surface dowiirard, considerable air Is entrapped in the pores (l, 10). As the air is dissolved and removed in the percolating water, the permeability gradually increases» attaining a oaxiiBUffl ^en all or nearly all of the entrapped air is removed, the minimum peraeabllity appears to be the resultant of two opposing phenomena, that is, the forces described for Phase 1 tending to reduce permeability from the beginning and the forces of air re»oved tending to increase permeability.
Phase 3. After the maximim is reached, the perffleablllty decreases with time, rather rapidly at first then more slowly until after 8 to 4 weeks the rate is usually a small portion of its original value. Frequently it has been observed in laboratory tests that the maxiiMUBi permeability is reached before the last of the entrapped air is removed.
The gradual sealing of the soil during the third phase is
due (as Allison has proven) to biological clogging of the soil
pores with microbial cells and their synthesized products,
slimes, or polysaccharides.
Fig. S shows the results that Allison obtained by using a
soli sterilissed with ethylene oxide gas as contrasted to an
unsterilized soil and a sterile soll-relnoculated. The ster
ilised soils reach a constant high permeability value whereas
the unsterilized soil and the sterile soll-relnoculated have
decreasing permeability with time due to the microbial action

—20""
mnder long ambaergence.
3. Salts
All soils contain oolloidal Material and the degree of
dispersion of the oolloidal material has an effect on the soil
permeability. This effect is particularly ia5)ortant in the
structureless soils of the fleet (33, S4) and of considerably
leas importance in well-g^gregated prairie soils of the Mid
feet.
Harris (35) in a series of classic experiments on the
perraeability of alkali soils fomd that the presence of sodium
on the base exchaage co^lex caused a decrease in the soil
permeability. The decrease was attributed to an increase in
the dispersion of the colloidal particles due to the presence
of sodium in the base exchange complex.
In the reclamation of alkali lands it has been observed
that there is an initial decrease in the soil perraeability
when the excess salts are washed out of the soil. The presence
of excess salts represses the dispersion of the colloids. When
these salts are washed out the soil is deflocculated and the
permeability decreases. In order to flocculate the soil again
it ia necessary to replace the sodium in the base exchange
complex with calcixiffl ?/hieh reflocculates the soil.
4. Temperature
Poiseuille (53) studied the influence of temperature on
Tiscosity of water and determined the relationship between them.

-31
Hag®n (1869) irerifiad Poiseuille^s relationship and found a 3^
increase in peraeaMlity for every increase in temperature by
one degree.
Gustafsson (31) pointed out that as long as Darcy*s law
holds (laminar flow) there is a linear relationship between
teaperature and perraeatoility. In the region where Barcy*s law
is Talid only the forces of friation oppose the movement of the
water and these frictional forces are directly proportional to
the viscosity of the water.
As an example of the magnitude of the effect of temperature,
in the spring of the year with water at 1® C as compared to sum
mer at 23® G the permeability ratios are 100:163 due to temper
ature. However Duley and Domingo (19) in field tests did not
find any practical signifioaace in the effect of temperature
variations on soil pera®atoility,
F. Solution of Flow Probleais
1. Analytical methods
a. Dupult-yorohheimer theory
Although the assuaptions of the Dupuit-Forchheimer theory
of gravity-flow systems have been shown by Muskat (51, p. 359)
and others (fO) to be so questionable as to make the whole theory
untrustworthy, its widespread use even today makes it necessary
to consider it in some detail. (It should be pointed out that
although the theory is based on erroneous ass\«nptions the results

-22-
that are obtaiaed are often surprisingly close to those given
empirically or by exact calculation.)
Dupuit assumed that for small inclinations of the free
surface of a gravity-flow system the streamlines can be taken
as horizontal, and are to toe associated with velocities which
are proportional to the slope of the free surface, but arc in
dependent of the depth. la other words, all the flow is in a
horizontal direction and the rate of flow depends on the slope
of the water table, fhis i® of course contrary to the flow
patterns obtained in sand-tank experiments (34) and electrical
analogues (10) and analytical solutions (44), which have shown
the true, circuituous paths taken by water particles. The
theory thus assuaes that a system will have no gravity-flow
characteristics which is entirely contradictory to the impli
cations of Barcy's law as pointed out by Muskat (51).
lumeroua investigators (2, 17, 46, 47) have applied the
Dupuit-Forchheimer theory to the problem of land drainage and
although the aathematical devices used to get their results
have differed, the equations derived are all very similar.
Russell (59) has discussed the literature on the subject be
fore 1934 and the following example will largely follow his
text. Certain assuiBptions are aiade: (l) the soil is homog
eneous; (2) rain water percolates uniformly through the soil
till it reaches the water table which starts rising; (3) when
the ground water reaches above the drains, it will start to
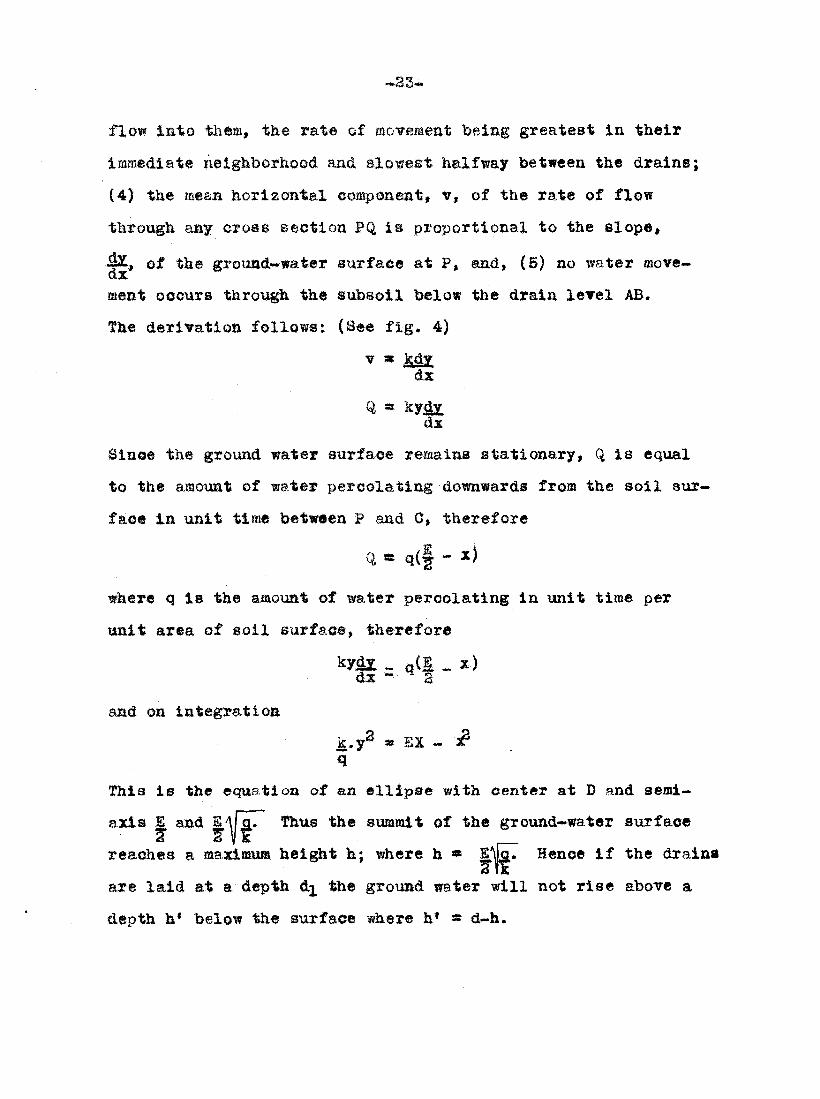
~.S.3-
flow lato them, the rate of movement being greatest in their
iramediat# neighborhood and slowest halfway between the drains;
(4) the me&n horizontal oomponent, v, of the rate of flow
through any cross section PQ is proportional to the slope,
of the groimd-water aurfaee at P, and, {5) no \mter move-QX
ffleat oijcurs through the subsoil below the drain level AB.
The derivation follows: (See fig. 4)
* fed.y dx
Ci a ky^ dx
Sinee the ground water surface reaains stationary, Q is equal
to the amount of water percolating downwards from the soil sur
face In unit time between P and 0, therefore
Q at q(^ - x)
where q is the afflouat of water percolating in unit time per
unit area of soil surface, therefore
and on integration
ic.y^ a EX - # i
This ie the equation of an ellipse with center at D and semi-
I'l 1
axis 1 and fhus the sumffiit of the ground-water surface
reaches a maximm height h; where h « Hence if the drains
are laid at a depth the ground water will not rise above a
depth h* below the surface where h* s d-h.

G R O U N D S U R F A C E
Free Water Surface
(Phreatic Surface)
DRAIN TUBE
DRAIN TUBE
E
Fig. 4. Dupuit-Forchheimer Theory of Soil Drainage

The equation may b@ re-writ tern
d - h- = I
K is determinable and bene# if q (the maxin^ra rate of influx
of water whieM the system will be required to deal with) is
known, the depth and spacing can be chosen in such a way that
the ground water will neirer rise nearer to the surface than
soiae specified distance h, ®hieh must be sufficiently great
to present damage from water-logging.
b. Kirtehaa-Gardner approach^
ly assuming a steady state condition with the potential
function (or its aormal derimtive) known over the boundaries
of the region considered, it is possible to get solutions of
liaplaee*8 equation that will satisfy the known bomdary con
ditions. These solutions can be used (after considerable
mathematical manipulation) to determine the flow into drain
tubes embedded in the soil, Slichter (63) first pointed out
the possibilities of this approach and Gardner et al (39) made
application of it to the problem of artesian flow. Recently
Kirkham (43) has solved the problem of flow into a series of
drain tubes embedded in a hotaogeneous soil. In addition he
has solved the problem of flow into drain tubes embedded in a
two-layered soil (4(4), each layer having a different permea
bility. These solutions were obtained using the method of
images (See Muskat 51, p. 175) and the results were expressed
in conjugate fmctions. The real and imaginary parts were

-26-
separated to give a potential function ajid a stream function.
The normal derimtlre of the potential was obtained at the soil
surface and this aortaal derlirative was then integrated over the
surface of the soil. Multiplication by the soil permeability
gave the quantity of water flowing across the surface of the
soil and therefor© the quantity of water flowing into the drain
tubes.
In this analysis the assumption was made that the surface
of the soil was everywhere at the saae potential (ie. ponded
water). The falling water table was not taken into accoiint in
lirkha®*s. analysis,
2. Qraohical method of Daohltr.. Gasagrande. and Forchheliaer
Muskat (51) la a discussion of Daohler^s work, described
the application of the graphical method to seepage through
dams made of permeable material, fhe Initial problem is the
location of the surface of seepage. The Inflow face, main body,
and outflow face of the dam are treated as separate flow sys
tems by different approximations, and are then synthesized by
the requirements that the fluxes through each shoxild be equal,
and that the fluid heads should be continuous in passing from
on® part to the other. 4fter the surface of seepage has been
located, the equipotential lines, each one representing a con-
stiunt fraction of the total loss in head h, are drawn. Streanh-
linea are chosen to be orthogonal to the eqiAipotential so that
the saae fraction of the total seepage passes between any

-27-
pair of neiglibo3rlag flow lines. The resulting net will consist
of a series of squares. If one aueoeeds in plotting two sets
of curTea so that they intersect at right angles, forraing
squares and fulfilling tbe boundary condition, then one has
obtained a graphical solution of the problem. Oaaagrande (9)
applied the method to soil® which are anisotropic with regard
to permeability. He showed that all dimensions in the direction
k max are reduced by the factor A/KsIb or all dimensions in the V k max j— —
direction of t mlm. are increased by the factor Vk^n*
probleffl is solved for the case of a soil with uniform permea
bility and then the above conditions are applied. The average
permeability will be
¥ * Vk »in k max
and the flow will b®
q « t A
where is the directional derivative of the potential.
The answer obtained by use of the graphical method is
only approximate but is of the correct order of magnitude and
use has been made of the method in the design of earth dams.
3. fhe hodograah
A hodograph is a representation of a dynamical system
In which the coordinates are the velocity components of the
particles of the system. The method of treatment is difficult.
A description by Muskat (51) will be followed here. Although
the method was developed earlier by Helmholtz and Kirchoff,

-28-
Haael (33) first made considerable application of it to t^o-
dimensional seepage systeffls, fhe systems included simulta-
neoualy ii^ermeatole boundaries, constant-potential surfaces,
and surfaces of seepage, fhe liodograph of a flow line is the
cunre which one obtains when plotting from one origin velocity
vectors for all the points of the flow line, ^e straight line
Gonneeting the origin with on® point on the hodograph represents
the fflagnitude and direction of the velocity for the correspond
ing point in the flow line.
Since the velocity along the free water surface is propor
tional to the Bine of the slope, the hodograph for the line of
seepage is a circle with diameter equal to the coefficient of
permeability. The hodograph for a straight boundary is a
straight line.
Once the boundaries of the system are fixed (in the
hodograph plane) the methods of conjugate-function theory can
be applied to the final solution of the problem, although the
transformations of the circular segments representing the free
surfaces involve the theory of modular elliptic functions (See
Musfcat 51, p. 301).
4. Mesi^rane aaalomie
la a study of the uplift pressures on large dams, Brahtz
(8) developed a ajembrane analogue to obtain solutions for two-
diaiensional probleffls* Bie analogue takes advantage of the fact
that the differential equation for the steady state potentials
«29-,
for the percolation witMn an earth or concrete mass has the
same form as the differential eqmatioa for small normal defleo-
tiona of a «nifor»ly stretched rubber mefflbrane (Laplace's equa-
tioa). The relative ordinates at all points along the bound
aries of the membrane are made proportional to the boundary
pressures at corresponding points in the structure. The or
dinates at all interior points will then be proportional to
the pressures at corresponding interior points in the proto-
type. The analogue is set up to represent the field conditions
and the ordinates of the rubber membrane are measured by meajas
of a micrcmeter device.
The a®sufflptions B»de in the use of the meiabrane analogue
are (1) the materials of the d&in and the foundation are honKJg-
eneoms (2) the merabrane i® of infinite extent in all directions
(3) the membrane is only slightly displaced*
llestrlcal analogue
The electrical method of flow analysis in seepage problems
was first proposed by Pavlovsky in 1932 [^Bee Low, Dams, Natl,
les. Com®, 1938 Wash. D.O., for a discussion of the electrical
method] and is based on the relationship between Ohm's law and
Darcy*e law. Ohffi*s law, which expresses the fundamental rela
tion for the flow of an electric current, is expressed by the
equation
i a - o- (6)

where i s curreat per imit area
speoiflc oonductivlty
voltage gradient in the direetion s. The minus siga
indicates that the potential decreases as the current progresses
%n the positive direction. Darcy*s law for the flow through
porous media is
Q • |4. (7) O S
where Q « quantity of water flowing per unit area
k « permeability (or conductivity)
hydraulic gradient in direction s
Equation (6) is identical with equation (7). Since the princi
ples of flow are similar, with the saaie conditions as regards
pressure and path of flow, the flow itself will be similar.
The electrical analogue can be used to trace both the
flow net and the equipotential net and the resulting figures
can be used to coapmte the quantity of flow throiigh the sec
tion investigated*
Ohilds {10» 11, 12, 13) has made the most intensive appli
cation of the electrical analogue method to the study of land
drainage. He soaked sheets of filter paper in colloidal graph-
it© and reproduced a section of the field case. A copper foil
Tsa© used to represent the drain tube. The vertical flow in the
soil above the water table was represented by current input
between a series of strips conducting material insulated from
each other.

-31-.
6.. Muwerlcal methods
Iimcrical methods of solving two-dimeasional partial
differential equations involve the replacement of the con-
tinmum of points in a region considered, by a discrete set of
points, and the replacement of the differential equation by a
finite difference equation. Llebmaan (48) was the first to
show how to replace Laplace*s equation by a finite difference
approximation and obtain a solution by an iterative procedure.
In the process developed by Liebaaan, a square net of points
is laid over the region and approximate values (best guesses)
of the function are assigned to interior points while known
values of the function are placed on the boundary points. The
net is then repeatedly traversed, replacing the value at each
interior point by the mean of the values at the four neighboring
points, using the new values in the improvement of the succeeding
points. After a number of traverses, the function at each point
will converge to a solution of the finite difference equation.
The accuracy of the answer obtained and the rate of convergence
-will both depend on the size of the net spacing.
The difference between the solution of the approximating
difference eqpiation and the differential equation representing
the true solution has been investigated by Richardson (58),
showed that on a net of interval h the difference is of the form
A (X,y)h^+B(x,y)h^4-C(x,y) h®+ —
Since only even powers of h enter here, the difference solution
approaches the differential solution rapidly as h approaches
33-
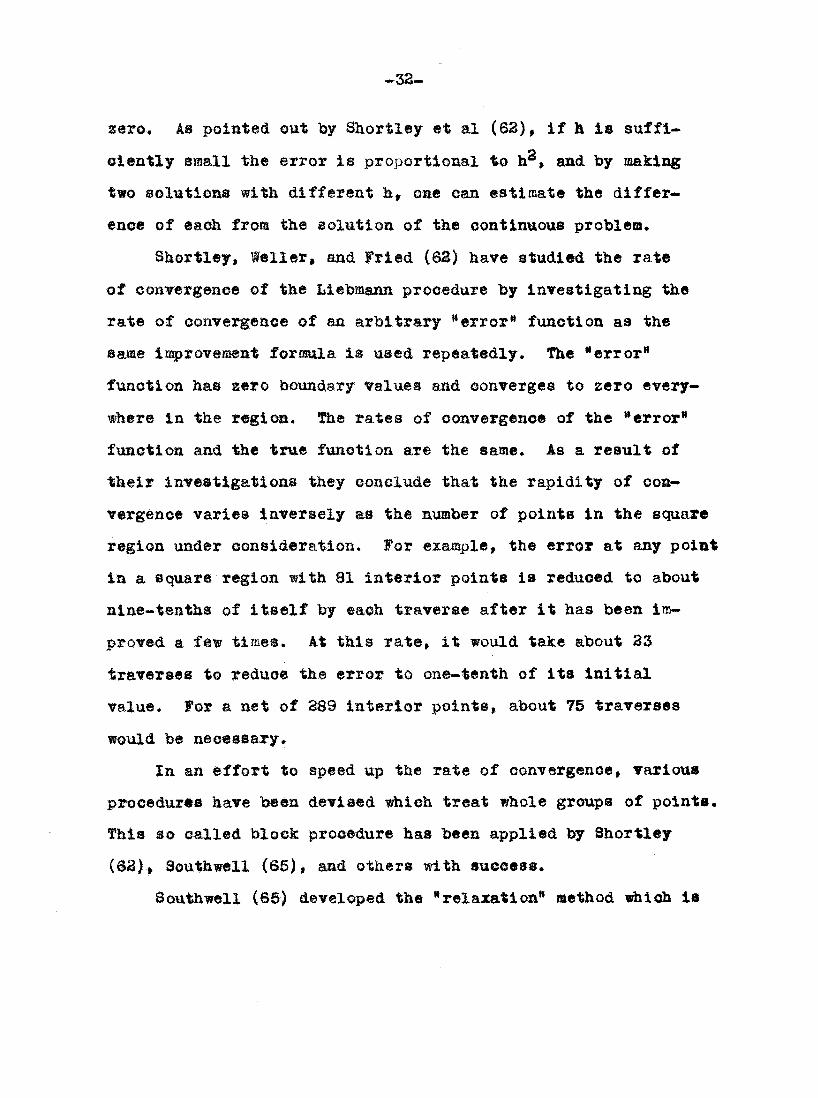
2«ro, As pointed out toy Shortl«y et al (62), if h is suffi-
0i®Btly siaall the error is proportional to and by making
two solmtions with different h, one can estimate the differ-
#a©e of @a(^ from the solution of the continuous problem,
Shortley, Isller, and Fried (62) have studied the rate
of convergence of the Lietomann procedure by investigating the
rate of convergence of an arbitrary *error" function as the
saffle iaprovement formla is used repeatedly. The "error*
function has zero botindary values and converges to zero every
where in the region, the rates of convergence of the "error*
function and the true function are the same. As a result of
their investigations they conclude that the rapidity of con
vergence varies inversely as the number of points in the square
region under consideration, for example, the error at any point
in a square region with 81 interior points is reduced to about
nine-tenths of itself by each traverse after it has been im
proved a few times. At this rate, it would take about 23
traverse® to reduce the error to one-tenth of its initial
value. For a net of 389 interior points, about 75 traverses
would be necessary.
In an effort to speed up the rate of convergence, various
procedures have been devised «hich treat whole groups of points.
This so called block procedure has been applied by Shortley
(62), Southwell (65), and others with success.
Southwell (65) developed the "relaxation* method which is
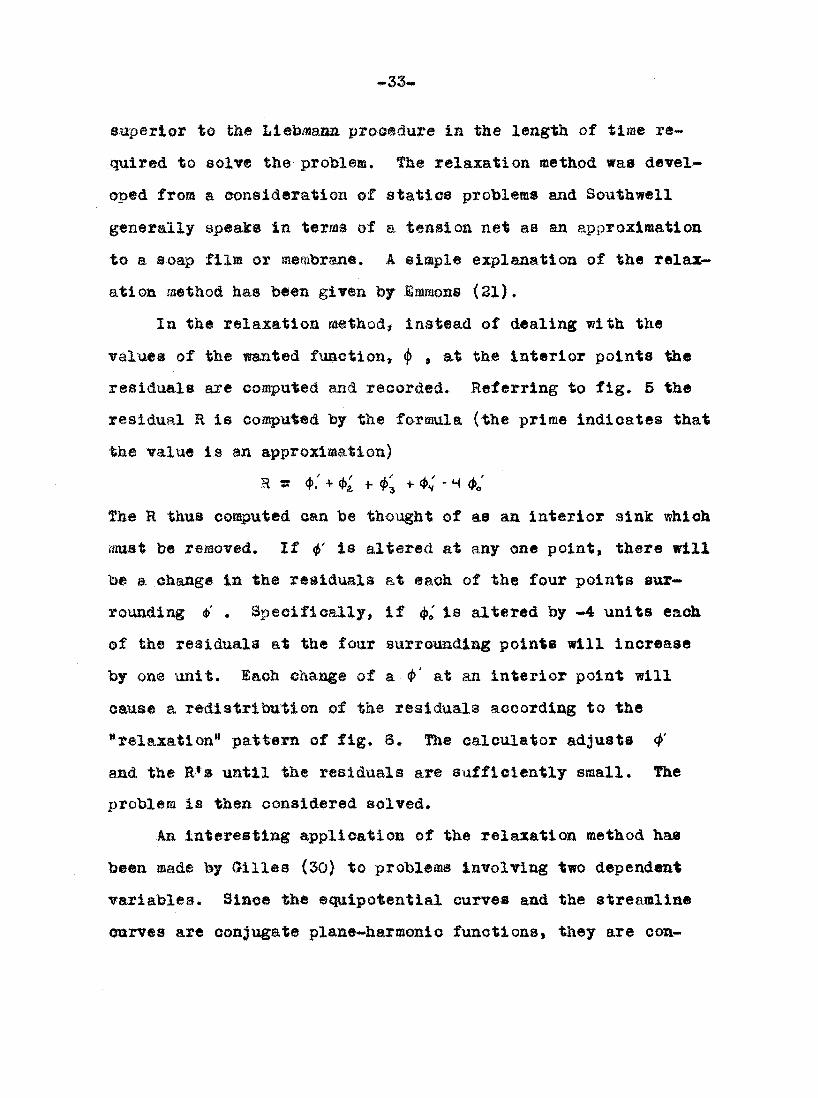
•"33"»
superior to the Itiebaiaaa proeedure in the length of tirae re
quired to solire th© protolem. fhe relaxation method was devel
oped froBi a consideration of statics problems and Southwell
generally speaks in termt of a tension net as an approximation
to a soap film or membrane. A simple explanation of the relax
ation method has been given by Imroons (21).
In the relaxation method, instead of dealing with the
values of the wanted ftinetion, (j> , at the interior points the
residuals are computed and recorded. Referring to fig. 5 the
residual R is coE^uted by the foranila (the prime indicates that
the value is an approximation)
R « 4>' (i>^ -H + <i>^ ' H <i>^
fhe R thus coi^uted can be thought of as an interior sink which
aittSt be reaoved. If 0' is altered at any one point, there will
be a change in the residuals at each of the four points sur
rounding d)' . Specifically, if is altered by -4 units each
of the residuals at th® four surrounding points will increase
by one unit, lach change of a <P' at an interior point will
cause a redistribution of the residuals according to the
"relaxation" pattern of fig. 6. Hie calculator adjusts 4'
and the H*s until the residuals are sufficiently small. The
problem is then considered solved.
An interesting application of the relaxation method has
been made by <*illes (SO) to problems involving two dependent
variables. Since the ecpiipotential curves and the streamline
curves are conjugate plane-harmonic functions, they are con-

4),
^4 (I)o (|)2.
*^3
fiit S.
fif# i# fnflwtii

•3&~'
nscted toy the Gauehy-Rieffianm eqmatioas.
5 0 ^ a tp . ^ ^ yy
Sx ' c)^ ' ^
Gilles developed suitable equation® so that the two wanted func
tions, f &mi <p can b® deterffiined siaultaneoualy. However in
his words, *The process is both laborious and tedious*.
Moskovitz (50) has presented a process which yields pre
cisely the convergent values of the function obtained by in
finitely Biany traverses of the region, fhe Liebmaim formula
is used for several traverses; then, succeeding values of the
improved function are caloulsted by aeaas of tables included in
Mo8kovitE*s paper. Only regions with rectangular boundaries
can be treated by this aethod.
Shaw and Southwell (61) have applied the relaxation method
to probleffis of percolation under a da® and have treated the case
of flow thro^u^ layered porous material having different permea
bilities in each layer.
Fox (25) has shows how values of the function may be com
puted at points close to an irregular boundary.

-36-
III. fHE PROBLEM
The problem can be divided Into three related perta,
(l) the dev#l©pffi©nt of a field procedure of measuring soil
peraeability beneath a water table, (2) the use of the three-
dimeasional electrical analogue for the determination of cer
tain constants in the perffleability equation and the use of the
electrical analogue in the study of soil factors affecting
flow, (3) the application of peraeability data to a drainage
problem solved by numerical aethoda,
A. PieEometer Method of Measuring Soil Permeability
1* pmcedur#
The field procedure as finally developed is as follows:
The surface sod is removed from the soil and a hole is augered
out to a depth of about 6 inches below the surface of the soil.
The auger used is one of 1/16 inch smaller diameter than the
inside of the piezo®et«r. A piezometer (which is an unperfo-
rated pipe) is then driven about 5 inches into the auger«d-out
hole. ,(One inch thia-walled electrical conduit has proven
satisfactory for use as a piezsmeter.) The auger is inserted
inside of the piezometer and a cavity is augered out for another
six inches below the end of the piezometer which is then drivea
with light taps of the aaul (fig. 8) into the soil for another

-37-
SOD REMOVED
^ PIEZOMETER
^SOIL SURFACE \i n 11 I / I ! I I ! II III I
WATER TABLE -2R
7
y I :
/ I
I^CAVITY
s • 2 r
^ /
/ FLOW LINE
IMPERVIOUS 111111111111 111 11 I I L AYFR / i /i I I I I I I I / I I I I I I 11
7. Pl@zQ«©t«? Met&od of Mea8iuf«m«at of Permeatolllty.
8. lastailing th© Piezometer.

—38*"
5 inoliea, Tkis procedure of successive augerings -Is rep«ated
until tlie piezoaeter is at the desired depth below the surface
of the soil. It should be emphasized that the piezometer is
always forced into a cavity with diameter slightly smaller
than that of the inside diameter of the piezometer. It is
never forced into natural soil without augering.
Ihen the piezometer is at the desired depth a cavity of
any convenient length is augered out beneath the piezometer.
Water will flow into this cavity during the permeability test
and it is essential to auger it out with care.
fhen the piezometer ha® been placed at the proper depth,
a hose from a pump is lowered to the bottom of the piezometer
and the cavity is flushed, t© remove puddling effects, by
puffiping out the in-seeping water (fig. 9). In more permeable
soils the cavity is quickly flushed out while in tight clay
soils the water may seep in so slowly that it is necessary to
apply suction to the pipe to speed up the process (fig. 10).
Permeability measureaients are then aade by pumping the
water out of the piezometer and measuring the rate of rise of
the water in the piegoaeter. An electrical probe which works
on the principle that an electric circuit is completed when
the end of the probe touches a water surface, may be used to
measure the water elevation in the piezometer.
fhe level of the water table must also be known for the
calculation of the soil permeability. In highly permeable

-39-
10 Applylag Suetion Upper Stopper la Piezometer.
to the Piezometer, for a 2-incto

40-
soils It takes only a few minutes for the water table to
establish itself. In tight olay soils it may take hours ox
even days for the water table to reach an equilibrium state.
When the laeasurement is coiapleted, the piezometer is
removed from the soil by means of a soil tube jack.
2 , Field tests
Preliminary tests on prairie soils under continuous pas
ture showed that it was essential to remove the surface sod
before installing the piezometer. Forcing the piezometer
through the sod caused a ball of roots and soil to form upon
the end of the piezometer. This plug compressed the soil
around the end of the pipe and reduced the permeability.
Two types of ai;^ers were tried in field tests; one a
regular carpenter's bit with the sharp edges ground off, and
the other a double-twist-type soil ai^er. In heavy soils
there was less tendency for the saturated soil to slip off
the carpenter's bit than off the soil auger. Other than that
no particular advantage was noted for either auger. It was
found advisable to use small-diameter pipe (3/8 in.) for the
handles of the auger so that it was impossible for the operator
to take large bites of soil. Soil puddling and compression
were minimized by taking small auger bites. The auger shaft
was conveniently marked with brass tips so the operator could
tell the depth of the hole.
Any size of pipe could probably be used for a piezometer
-41-
in these tests. In the first field trials 3/4" iron water
pipes were used and were satisfactory for the iBeasurement, but
their weight made them difficult to transport in the field. In
addition, water pipe corrodes very easily. The pipe that proved
most satisfactory was thin-walled electrical conduit, which is
light-weight, strong, and resists corrosion. Three diameters
of conduit were tried, 1.0, 1.5, 2.0 inches and all of them
worked satisfactorily. Conduit is available oommercially in
10-foot lengths. These lengths were cut in half and one end
, was beveled to provide a sharp cutting edge. The pipe was
marked at 1 foot intervals with paint. This was not very
satisfactory since the paint wore off after a little usage.
A more satisfactory method of marking the pipes would be to
cut a shallow groove around the circumference of the pipe
with a pipe cutter,
A driving head made of steel was placed on the piezom
eter while it was being driven into the soil to protect the
piezometer from the battering action of the maul (See fig. 8).
The puap used to puap the water out of the piezometer
was a small pitcher coiimonly foxmd on farms (See fig. 9).
A pipe connection extended above the level of the pumping
cylinder so that the ptamp would not lose its prime between
operations. In field tests a suction of about 0.75 atmos
phere was developed by the pump. It was found necessary to
soak the leathers on the pumping piston in water before using
the pump. No other pumps were tried and no particular advan

tage iB claimed for the pwmp here deseribed although it should
be pointed out that thie pu^ is of rugged construction and no
difficulties were encountered in its use in the field.
Plastic garden hoae with an Inside diameter of 17/32 inch^
and outside diameter of 15/16 inch worked very satisfactorily,
fhe inside diameter was large enoi^ to pass sand-and small
gravel and the wall was sufficiently rigid to stand up under
the suction. Rubber tubing was not satisfactory because of its
small inner diameter and because of the flexibility of the walls
fwo types of electric probes were tried. The first con
sisted of a wooden rod with an embedded wire. One end of the
wire protruded from an end of the, rod. The other end of the
wire was connected in series with a milliamiaeter, a 33-volt
hearing-aid battery* a limiting resistor and a brass collar
that fit ow@T the end of the piezometer. Ihen the wire pro
truding from the end of the wooden rod touched the water sur
face in the piezometer the circuit was completed causing^ the
milliammeter to deflect. The wooden rod was graduated in
inches and a set screw in the brass collar enabled the oper
ator to fasten the rod at any elevation.
leadings were faade in the following ma^er; the rod was
set at aorae predetermined height and the operator waited un
til the rising water in the piezometer reached the rod. A
stop watch was thegi started and the rod teoved up on® inch
(or any desired distance). lh.en the water level reached the

-43-
new elefatioa as Indicated by the deflection of the milliaffi-
meter, the first stop wateh was stopped and a second stop
watch started, fhe reading on the first stop watch recorded
and it wes reset to zero so that it could be used again to take
the third reading. In this way it was possible to get a whole
series of aecurate readings using two stop watches.
The collar attachment that fit over the end of the pipe
also held a small horizontal square of plywood that served as
a platform for the ffiilliaaaaeter, the battery, and a notebook.
The rod-type of probe was not very satisfactory for two
reasons, (l) it was awkward to carry in a oar and in the field,
(3) it took an appreciable length of time to reset at a new
elevation. Because of these liaitations a new electric probe
waa designed following, somewhat, the design of CSiristiansen
(15). A fishing reel (Oreno So. 1165) was fastened on a
square of plywood (See fig. 11) and a graduated length of radio
test lead wire was wound on the reel. A weight consisting of
an insulated brass sleeve fit over the end of the wire that
dropped down inside of the piezometer and the other end of the
wire was hooked onto the reel. There was sufficient friction
in the catchment aechanism of the reel to hold the wire at any
desired elevation. The reel-type probe proved to be more con
venient to operate in the field and was ouch more compact than
the rod-type probe. It could be operated with one hand.
The soil tube Jack used to reruov® the piezometer from the
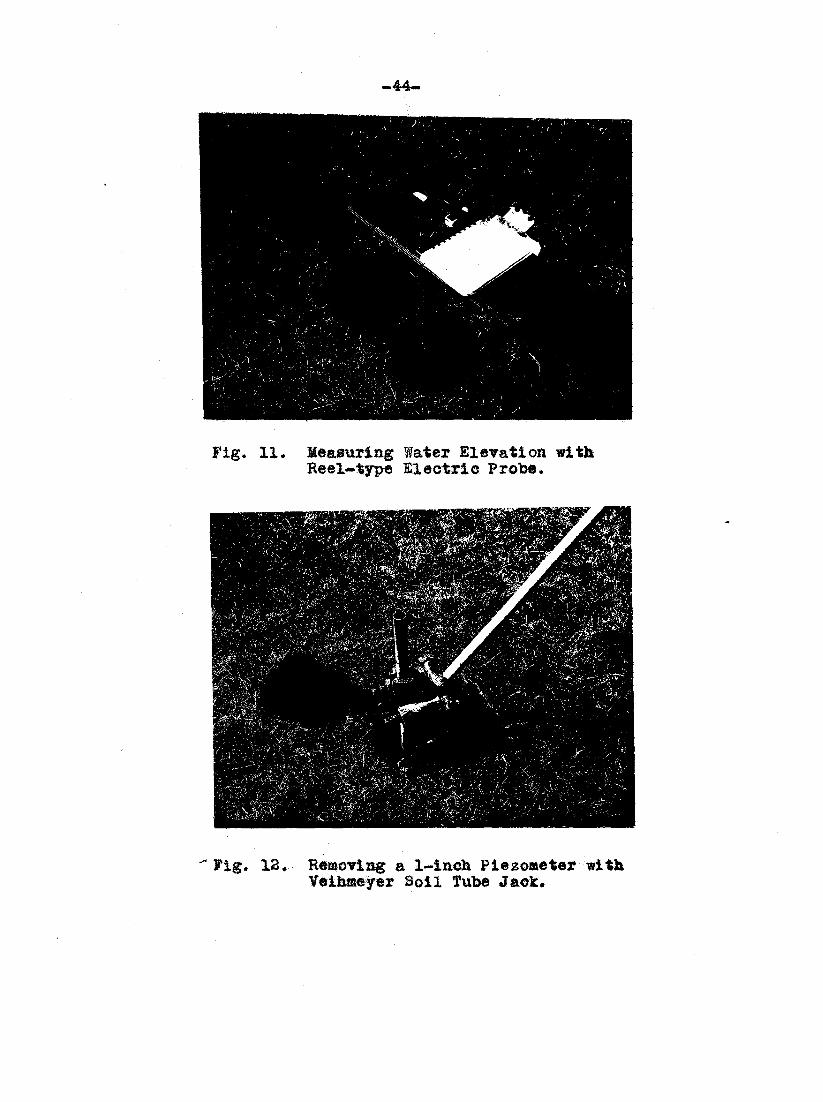
-44-
fig. 11. leasmriag later EleTation with Reel-type Slectrio Protoe.
Fig. 12, R«»oTiiig a 1-iach Piezometer with Teihaeyer Soil Tube J&qTc.

-45-
groimd was the standaid ¥eihm«yer soil tube ack. Special
grips were made to accomodate the 1 1/2 and 2-inch piezom
eters and the rollers were removed from the yoke when these
larger grips were used. A grip made for 3/4'' water pipe was
also used to pmll the 1 inch conduit (See Jtig. 12). Although
the pipe was too large for the grip, no difficulty was encoun
tered in its use. In all cases the soil tube jack performed
satisfactorily, removing pipes up to 2 inches in diameter
from heavy clay soil,
3. Laboratory procedure
The general solution for the problem of flow into a
cylindrical hole with impervious walls and with open end below
a water table, was given by lirkham (41). The expression
obtained for the permeability may be written in the form
(fig. 7)
X - "TT [linCcl-id.VCol-ya.)]
A (w-tj
where I s soil permeability (quantity of water discharging
in unit time through a unit length of soil of unit cross sec
tion, the ends of which are at unit difference in hydraulic
head), R • inside radius of pipe. In s natural logarithm.
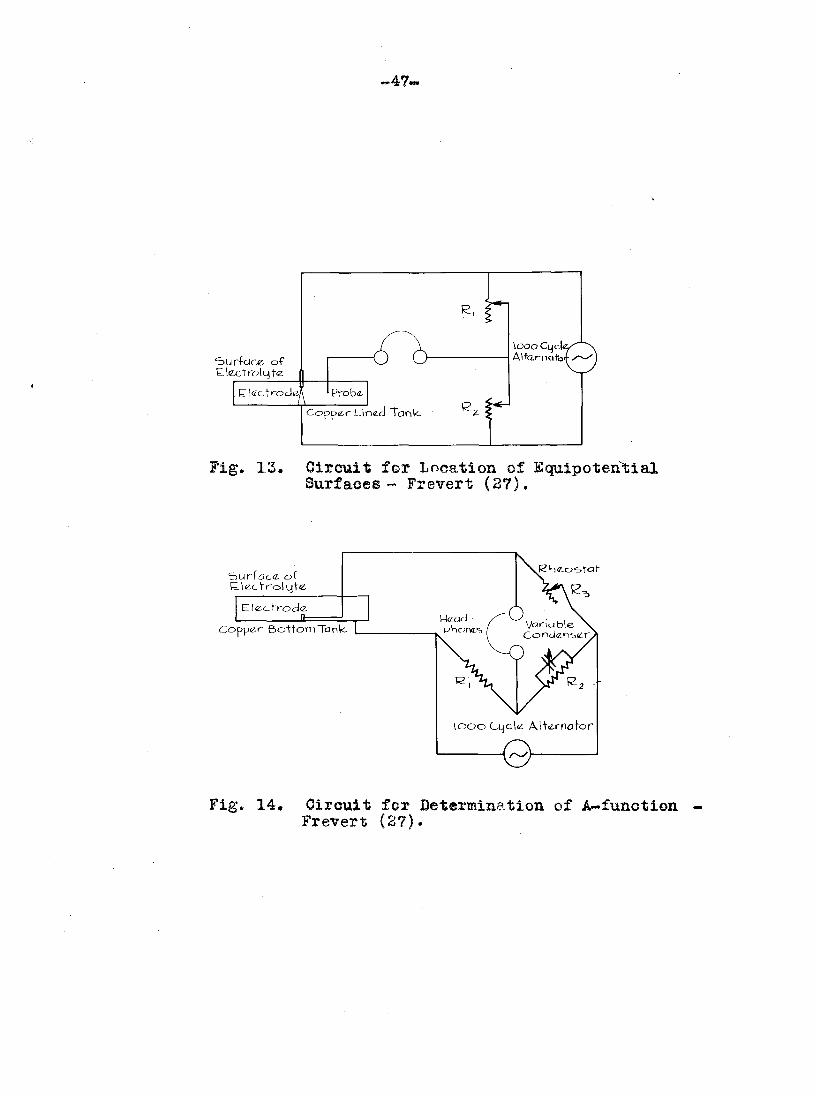
The forraula as presented here differs from that originally given in that the viscosity and density of the soil water and the acceleration of gravity are luaped into the permeability constant. Also, the quantities in the argiiment of the logarithm are revised to account for inward seepage rather than outward seepage as originally described.

d * rJeptli of pipe below water table,, = depth below ^ater
tftbla of TOter in p.ip@ at tijoe t.» fg « dspth below water
tablt of »Bter in pipe at time tg., tg-tj^ « time required fox
water to ri.se froia to fg, A ss a fuiictio.a of the geometry
©f the flow sfsteia iiaviag the physical dl.oeasioa of length.
The qmntity A depeade out the siae and sh8.pe (r,w) ©f
the eavlti" beneath the pieKoatter and also depends on the
distance from the oairitf to the wfi-ter table, d, and the dis-
tsjice to an iBiper«e.abl© layer, s, te aay call A the A-function,
Phyaioally A 1» a sort of conductaaee.; it is the amount
of we.ter which will flo« into the oavity in unit time if the
soil peraeability is unity and a mit difference of hydraulic
head exists between point# in the soil ftt the water table and
points in the soil over th« wallt of the cavity. The .A-fuac-
,tion is the only quantity in equation (8) which cannot be
readily measured or otherwise obtained and we roust resort to
the electric.analogue for its evsluatioa. Frevert (2?) de
veloped the three-difflensional analogue which waa used in this
work and his thesis coataias a deta.iled description of the
construction and Qp.®r&tioa of the analogue. Briefly the
laboratory apparatus oo.asisted of a stock-watering tank 68
laches in diameter and 30 laches deep, the bottom of which waa
lined with 26-gauge copper sheets. (See fig. 13) the ta.nk was
filled with tap water which proved to be sufficiently conduc
tive for the teats.. The c ptr bottoa of the tank was every-
~47«
'ouKcice of El(Zx:trc'tLjte
h
tZleciro cl«i Proba Copper Lined Tank-
\ooo Ctjcl Altar-nqto'
Fig, 13. Circuit for Location of Equipotential Surfaces - Frevert (27).
"burfcice of ELl^^ct rol Ljtt:
Copper
(2he-o'5,tat-
E l£;ctrod<z Q Mc-cid
onc-s Bo-ftomTank- L Variable
\ooo CLjclii^ Al+iz-rnotor
0
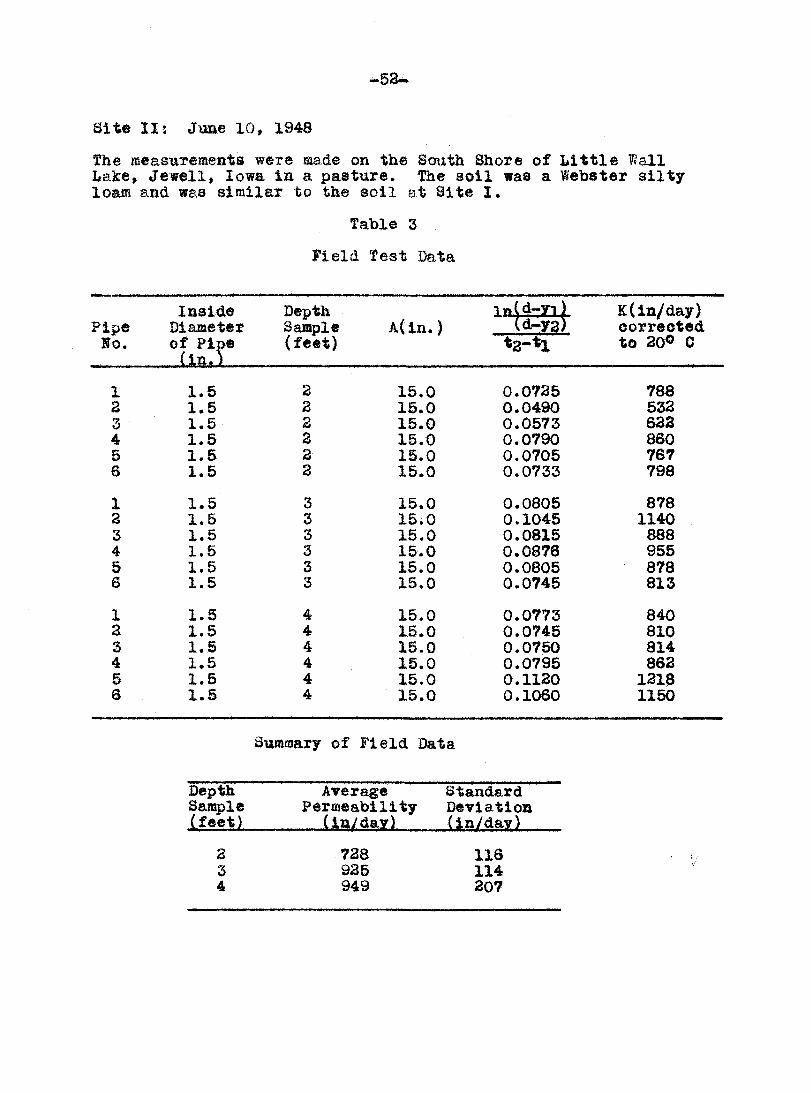
Fig, 14, Circuit for Determination of A-function -Frevert (27),

20
UJ
5
100 200 600 300 500 400
T I M E I N S E C O N D S
''If* M* tf ffM l&tii te Ms»«3r Ml&HmMp Mmm aai fim t»

wkere at the same potential and corresponded in tbe field
case to a stationary water table. The tap water ishicii was the
electrolyte corresponded in the field to the soil which ccm-
dmets water. The water-air smrfaee throi^h which electricity
would not pas® had it® analogy in an impermeable layer in the
soil. A dielectric rod made of plastic corresponded to the
imperiaeable walls of the piezometer and a right cylindrical,
copper electrode attached to one end of the dielectric rod
was analogous to the ©aTity beneath the piezometer. The
dimensions of the dielectric rod and the attached electrode
were in the same proportions as were the dimensions d and 2r
in the field, fhe l-fmetion was coa^uted from the foraula
derived by Kirkham (41).
vn
•^ere
r 5= radius of the soil ca-rity
S5 radiws of cylindrical electrode
cr » specific condttotiTity of the tank electrolyte
-TL = electrical resistance between the cylindrical electrode and the copper tank bottom
k non-indmctiTe Wheatstone Bridge was used for measuring
with 500 cycle AG current at 6 olts for the power supply.
Sarphones were used for balance detection*

-50-
4. Results M usM mm
la the first field tests the piezometers f/ere driven into
the soil withomt any preYloms augering. Headings were takes
interfflittently over a period of two weeks, fhe perffleability
was fomnd to inerease th smcoessive flushi)^s of the cavity
dme to a loosening of the compressed soil beneath the piezom
eter. fhe ffiaxinaffl valtte obtained was somewhat lower than* but
approximately the same as, the value obtained with the method
of successive angering®. The aorrtspondeaoe of these two
figures is interpreted to mean that the successive augering
BiethcKi of installing the piezometer® minimizes soil compression
and puddling.
The spring of 1948 was relatively dry and by the time the
method of measurement had been perfected, there were few spots
of uniform soil with a high water table at which measuremeats
could be made. Many of the readings were taken at sites that
were very variable in permeability due to natural soil varia
tions.

Site IJ May 16, 1948
Site description: Tbe soil was a Webster silty clay loam. The tests were soade on Black's Seed Farm about 3 miles south of Ames. The Webster soil was formed from glacial till material and the surface soil, which was in permaneat pasture, supported a dense growth of grass that was matted into a heavy turf. The top 24 inches became progressively lighter in color, grading into a grayish mixture of sand, clay and small gravel at 3 to 4 feet.
Table 2
Field Test Data
>ipe lo.
Inside Diameter of Pi'oe (ia.1
Depth Saj^le {feet) A(in.) t2-tx
K(in/day) corrected to 20O C
1 0.756 2 11.0 0.197 725 2 0.756 2 11.0 0.140 514 , 3 0.756 2 11.0 0.159 586 4 0.756 2 11.0 0.176 648
1 0.756 3 11.0 0.312 1150 a 0.756 3 11.0 0.212 784 3 0.756 3 11.0 0.332 1222 4 0.756 3 11.0 0.290 1069
1 0.756 4 11.0 0.310 1144 2 0.756 4 11.0 0.425 1569 3 0.756 4 11.0 0. 368 1355 4 0*758 4 11.0 0.294 1081
SiMmary of Field Data
Depth Average Standard Sample Permeability Deviatim
(in/dav) (in/dav)
2 618 90 3 1056 192 4 1287 221
-52-
Sit« 111 Juae 10» 1948
The measmremeats were made on the South Shore of Little lall Lake, Jewell, Iowa in a pasture, the soil was a Webster silty loaia s,nd was similar to the soil at Site I.
fable 3
Field fest Data
Pipe lo.
Iaside Diaaaeter of Pipe (Ifit)
Depth Sample (feet)
A(in.) tg-ti
K( l n/day) corrected to 20® C
1 1.5 2 15.0 0.0725 788 2 1.5 2 15.0 0.0490 532 3 1.5 2 15.0 0.0573 622 4 1.5 a 15.0 0.0790 860 5 1.5 2 15.0 0.0705 767 •8 1.5 2 15.0 0.0733 798
1 1.5 3 15.0 0.0805 878 2 1.5 3 15.0 0.1045 1140 3 1.5 3 15.0 0.0815 888 4 1.5 3 15.0 0.0876 955 5 1.5 3 15.0 0.0805 878 6 1.5 3 15.0 0.0745 813
1 1.5 4 15.0 0.0773 840 2 1.5 4 15.0 0.0745 810 3 1.5 4 15.0 0.0750 814 4 1.5 4 15.0 0.0795 862 5 1.5 4 15.0 0.1120 1218 6 1.5 4 15.0 0.1060 1150
Summary of Field Data
Depth Average Standard Sas^le Permeability Deviation
(in/day) (ia/day)
2 3 4
728 925 949
116 114 207

—52
Site HI; July 10, 1948
file Bieaaureaeats were made ia a permaneat pasture located 6 miles eaat of fhitiag, Iowa, near tbe relocated channel of the Little Siomx River* fhe aoii resembled Luton olay at the surface tout the subsoil was much lighter than typical Luton. The surface was a hea¥y plastic clay to a depth of 2o inches becoming pro-gre88i"¥®ly lighter in texture at greater depths. Layers of pure sand were encountered at 4 feet.
Table 4
Field Test Bata
Pipe lo.
Inside Diameter of Pipe (in.)
Depth Sample (feet)
A(in.) InU-yi) U-y2^
tg-tl
K(in/day) corrected to 20® 0
1 1.0 3 12.3 0.000326 1.79 2 1.0 3 12.3 0.000324 1.78 3 1.0 3 12.3 0.000287 1.51 4 1.0 3 12.3 0.000350 1.92 5 1.0 3 13.3 0.000350 1.92 S 1.0 3 12.3 0.000358 1.97
1 1.0 4 12.3 0.0112 61.8 2 1.0 4 12.3 0.0116 64.2 3 1.0 4 12.3 0.0112 61.8
Summary of Field Data
Depth A-rerage Standard Sample Permeability Deviation (feet) (in/day) (in/dav)
3 1.82 0.147 4 63.6 1.30

—SM—
Site I¥i Sept. 12-13, 1948
The meaaurefflents were made in a peifflanent pastiire adjacent to an old slougliway of the Missouri river south of Oaawa, Iowa. The surface soil was a grayish bro«a sticky clay. Several thin sand layers were ©ncoantered in the soil and the subsoil waa extremely variable.
fable 5
Field fest Data
Inside Depth inid^dO) K(in/day) Pipe Diaaeter Sample A(in.) yd-yaj corrected Ho. of Pipe (feet) to 20° G
(in.) ^
1 1.5 2 15.0 0.000662 6.8 a 1.5 2 15.0 0.0 3 1.5 2 15.0 0.003495 35.6
1 1.5 3 15.0 0.000790 8.1 2 1.5 3 15.0 0.04190 430 3 1.5 3 15.0 0,000681 7.0 4 1.5 3 15.0 0.03234 330 5 1.5 3 15.0 0.0 6 1.5 3 15.0 0.0150 150
1 1.0 3 12.3 0.0828 470 2 1.0 3 12.3 0.1061 580 3 1.0 3 12.3 0.000434 2.4 4 1.0 3 12.3 0.001069 5.9
1 1.5 3.5 15.0 0.0001965 2.0 2 1.5 3.5 15.0 0.3848 390 3 1.5 3.5 15.0 0.000185 1.9 4 1.5 3.5 15.0 0.0255 260 5 1.5 3.5 15.0 0.000645 6.6
1 1.5 4 15.0 0.0000110 .11 2 1.5 4 15.0 0.000320 3.3 3 1.5 4 15.0 0.0000110 .11 4 1.5 4 15.0 0.00120 1.2
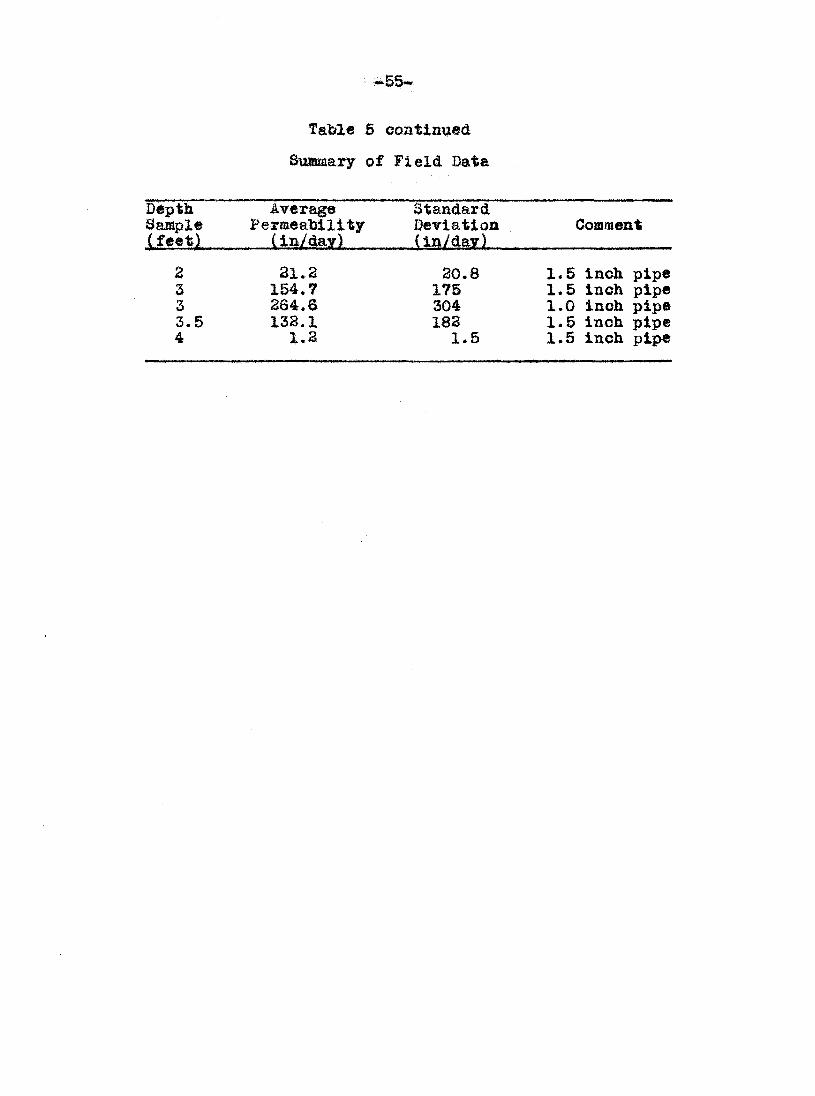
Table 5 contizmsd
Swm&Ty of Field Data
III
QCOw
Average Permeability
(in/dair)
Standard JDe-riation ( I n / d a y )
Comment
a ai.2 20.8 1.5 inch pipe 3 154.7 175 1.5 inch pipe 3 264.6 304 1.0 inch pipe 3.5 132.1 182 1.5 inch pipe 4 1.2 1.5 1.5 inch pipe

«5e-
Site ¥; Sept. 23, 1948
Tests were made on the north shore of Lake Ahquabi near Indianola, Iowa, fhe soil has been classified as Wabash slit loam which consists of 10 inches of silt loam surface soil over a heavy dense clay subsoil. Under native conditions this site wai covered with a forest of hardwoods but when the lake was constructed the trees were removed along with about a foot of the surface. The soil remaining waa much disturbed and contained ©any tree roots, v
fable 6
Field Test Data
Pipe lo.
Inside Diameter of Pipe (in.)
Depth Saffiple (feet)
A(ln.) tg-ti
K(ln/day) correct^ to 20® 0
1 1.5 2 15.0 0.000309 3.2 2 1.5 2 15.0 0.000415 4.2 3 1.5 ' 2 15.0 0.000191 1.9 4 1.5 2 15.0 0.000105 1.1 5 1.5 2 IS.O 0.000387 3.8
1 1.0 2 12.3 0.000431 2.4 2 1.0 , 2 12.3 0.00166 4.1 3 1.0 2 12.3 0.000350 1,9 4 1.0 2 12.3 0.00136 7.4 5 1.0 a 12.3 0.0 6 1.0 2 12.3 0.0
1 l.S 3 15.0 0.0000548 .56 2 1.5 3 15.0 0.0 3 -—Hit a rock-— 4 1.5 3 15.0 0.000458 4.7 5 1.5 3 15*0 0.000510 5.2 6 1.5 3 15.0 —— 0.0
Suaaary of Field Data
Depth Sample (feet)
Average Permeability (in/dav)
Standard Deviation (in/day)
Comment
2 2.85 1.33 1.5 inch pipe 3 2.58 2.67 1.0 inch pipe 3 2.08 2.65 1.5 inch pipe

-57-
Site ?I; Oot. 30-31, 1948
Measmxements were made in the ibottom of a roadside ditch near Lake Oornelia, Iowa, fbe soil was of glaoial origin and consisted of 1 to 8 feet of peat o-rer a gray mottled clay containing grawls and cobbles, fhe soil was very variable and pockets of sand aad gravel were mixed in with heavier aaterial.
Table 7
Field Test Data
Pipe lo.
Inside Diameter of Pipe (in.)
Depth Sample (feet)
A(in.) id-ra)
*8-*l
K(in/day) corrected to 20® 0
1 1.0 3 12.3 0.00356 19.6 2 1.0 3 12.3 0.0520 286 3 1.0 3 12.3 0.0130 72.0 4 1.0 3 12.3 0.0219 120 5 1.0 3 12.3 0.00943 52 6 1.0 3 12.3 0.0680 385 7 1.0 3 12.3 0.0820 450
1 2.0 3 17.0 0.0163 260 S 2.0 3 17.0 0.00456 73 3 s.o 3 17.0 0.01154 185 4 2.0 3 17.0 0.00610 100
1 1.0 4 12.3 0.01048 58 3 1.0 4 12.3 0.00326 18 3 1.0 4 12.3 0.00176 9.7 4 1.0 4 12.3 0.00130 7.2 5 1.0 4 13.3 0.00326 18 6 1.0 4 12.3 0.00579 32 7 1.0 4 12.3 0.00041 2.3
1 2.0 4 17.0 0.00650 104 2 Hit rock-^— 3 -Hit rock 4 3.0 4 17.0 0.00181 29

-58-
fatole 1 continued
Stwinary of Field Data
Depth Sanplc (fett)
A-^erag® Perffleability (in/day)
Standard Deviation (in/day)
Comment
3 197.8 174 1.0 inch pipe 3 154.5 85 2.0 inch pipe 4 20.7 19.1 1.0 inch pipe 4 66.5 52.9 2.0 inch pipe

-59.
Site ¥11: June 11, 1948
Measureaents were made on an area of prairie soil in Howard County that Ma been maintained in its virgin condition by the State Oonser'ration Gommission. The soil has been classified as Clyde silt loam and has a shallow surface layer about 5 inches thick. The subsoil showed tremendous variation over sffiall distances; clay pockets and sand pockets oeeurring within a few feet of each other.
fable 8
Field Test Data
^pe • ^0.
Inside Diaaeter of Pipe ( i n , )
Depth Sample (feet)
A(in,)
*2-«l
K(in/day) corrected to 20® 0
1 1.0 2 12.3 0,01052 58 2 1.0 2 12.3 0.01230 68 3 1.0 2 13.3 0.01340 74 4 1.0 a 12.3 0.00886 49 5 1.0 2 12.3 0.01900 110 6 1.0 2 13.3 —Hit a rock~ 7 1.0 2 12.3 0.0368 205 8 1.0 2 12.3 0.01058 58
1 .756 3 11.0 0.0146 500 2 .756 3 11.0 0.00002 0.07 3 .756 3 11.0 0.0 4 .756 3 11.0 0.00854 294
1 1.0 3 12.3 0.00427 23.5 3 1.0 3 12.3 0.0 3 1.0 3 12.3 0.00496 27.3 4 1.0 3 12.3 0.000886 4.9 6 1.0 3 12.3 —Hit a rock— 6 1.0 3 12.3 0.0128 71.5 7 1.0 3 12.3 —Hit a rook— 8 1.0 3 12.3 —^Hit a rock—
1 .756 4 11.0 0.00000115 0.004 2. .756 4 11.0 0.00000176 0.006 3 .756 4 11.0 0.0000304 0.11 4 .756 4 11.0 —Hit a rock—
1 1.0 4 12.3 0.000531 2.9 S 1.0 4 12.3 0.00305 16.8 3 1.0 4 12.3 0.00000697 .039 4 1.0 4 12.3 —^Hit a rock—

Table 8 coatinued
SuffiBJary of Field Data
Depth Sample {feeti
Average Permeability (in/da¥)
Standard Deviation (in/day)
CoBunent
2 88.8 17.3 1.0 inch pipes 3 198 357 .756 inch pipes 3 85.2 88.3 1.0 inch pipes 4 0.04 0.085 .756 inch pipes 4 6.6 12.7 1.0 inch pipes

-61-
Sit© VIII: Juae 10-11, 1948
ftsts were mad# in a field aortii of the Howard County ¥&rm on a soil similar to that found at Sit® HI. Sand and clay -pockets were found throughout the profile.
Table 9
Field Test Data
Pipe lo.
Inside Diameter of Pipe (in.)
Depth Sample (feet)
A{ln.)
tg-tx
K(ln/day) corrected to 20® C
1 1.0 3 12.3 0.00280 15.4 3 1.0 3 12.3 0.02215 122 3 - 1.0 3 13.3 O.OB980 495 4 1.0 3 12.3 0.05430 300 5 1.0 3 12.3 0.04355 240 6 1.0 3 12.3 0.05100 281 7 1.0 3 12.3 0.06550 360
1 1.0 4 12.3 —Hit rook— 2 1.0 4 12.3 —^mt rock— 3 1.0 4 12.3 0.01886 104 4 1.0 4 12.3 0.02410 133 5 1.0 4 12.3 0.01214 67 6 1.0 4 12.3 0.001008 5.6 f 1.0 4 12.3 0.03910 216
Sawaary of Field Data
Depth Average Standard Sample PermeaMlity De"yiation (feet) (in/day) (layday)
3 259 156.4 4 105 74.5

-62-
Site IX: Oct. 15, 1948
flie measurements were made on Marion silty clay loam which is a terrace soil. The sit® was located on a flat just below a hillside seep near Fairfield, Iowa and the soil was quite uniform.
Table 10
Field Test Data
Pipe lo.
Inside Diameter of Pipe
-Mm ipi
11
Depth Sample (feet)
A(in,) ln4Mll (d-yg)
t3~ti
K{in/day) corrected to 20® C
1 2 3 ,4
3.0 2.0 3.0 2.0
2 2 2 2
17.0 17.0 17.0 17.0
0.00996 0.00955 0.00641 0.00595
159 153 103 95
1 3 3 4
2.0 2.0 2.0 2.0
3 3 3 3
17.0 17.0 17.0 17.0
0.0145 0.00643 0.00716 0.00488
232 103 114 78
1 1.0 3 12.3 0.0243 134 2 1.0 3 12.3 0.0289 159 3 1.0 3 12.3 0.0145 80 4 1.0 3 12.3 —Damaged pipe—
SuHifflary of Field Data
Depth Sample (feet)
Average Permeability (in/day)
Standard De'S'latioii (In/day)
Comment
2 127 33 2.0 inch pipe 3 132 68 2.0 inch pipe 3 124 40 1.0 inch pipe

-63-
Site 1: April 1-2, 1949
Measurements were aade on the Davis Gounty KxperiBaental Farm near Bioomfield, Iowa, fhe soil VB.S Edlna ailt loam and consisted of a 10 inab surface silt loam underlain by a heavy, dense clay subsoil. There was a 1 inoh leached glel layer at 10 Inches.
fable 11
Field feat Data
>ipe lo.
Inside DiMeter of Pipe
( i n A
Depth Sai^le (feet)
A(ln.) (d-ya)
tg-tl
K(in/day) corrected to 20® C
1 1.0 1 12.3 0.00727 53.1 2 1.0 1 12.3 0.00431 34.5 3 1.0 1 12.3 0.00251 20.2
1 3.0 2 17.0 0.00100 27.0 2 2.0 2 17.0 0.00024 5.7 3 2.0 2 17.0 0.00040 9.2 4 2.0 2 17.0 0.00018 4.2
1 1.0 2 12.3 0.00055 44.5 2 1.0 2 12.3 0.00170 14.0 3 1.0 2 12.3 0.00157 12.7 4 1.0 2 12.3 0.00114 9.2 5 1.0 2 12.3 0.00093 7.6 6 1.0 2 12.3 0.00061 6.6 7 1.0 2 12.3 0.00125 10.1 8 1.0 2 12.3 0.00165 13.3
1 2.0 3 17.0 0.000448 10.4 3 2.0 3 17.0 0.000075 1.8 3 2.0 3 17.0 0.0000064 0.15 4 2.0 3 17.0 0.0000257 6.0
1 1.0 3 12.3 0.000001 0.010 2 1.0 3 12.3 0.000000 0.00 3 1.0 3 12.3 0.000030 0.24 4 1.0 3 12.3 0.0000003 0.0024
1 3.0 4 17.0 0.000029 0.67 2 2.0 4 17.0 0.0 0.00 3 3.0 4 17.0 0.0000013 .030

-64.
Table 11 ooatlamed
Suamary of Field Data
Depth Sample ^feet)
Aterage Fexaeabllity (layday)
Standard Deviation (ia/day)
Oommeat
1 35.9 11.2 1.0 inch pipe 2 11.5 9.5 2.0 inch pipe 3 14.7 4.1 1.0 inch pipe 3 4.S 4.6 2.0 inch pipe 3 0.063 0.205 1.0 inch pipe 4 0.23 0.535 2.0 inch pipe

-65-
Tke permeability figures at Sites I and II are very high
and according to Muskat (51) correspond to the permeability of
laedium sand. On the other hand Hissink (36) and Hiasink and
Hooghoudt (3?) in laboratory tests made on undisturbed soil
samples have obtained peraeability figures of from 100 to 3000
inches per day on soils that contained about 65^ clay.
The standard deviations of the readings at Sites I and II
lie between 10 and 20^ of the average. Although a standard
deviation of 10 to 20^ may be considered large in many physical
measurements, it should be remembered that measurements of soil
permeability, taken by coamonly used methods, often vary by
taore than 3000^ (14).
The measurements at Site III rejroduced themselves very
well with a standard deviation of less than 10^ of the average.
However, at Site IV, soil variations caused such a wide range
in permeability values that no conclusions can be drawn from
the results.
At Site ¥ an attempt was made to check the results obtained
by using piezometers of two different diaaieters (1.0 and 1.5
inches). Althoiigh the standard deviations are quite large, the
averages, 2.58, and 2.08, inches per day, are close. The vari
ations in the permeability are attributed to the soil hetero
geneity.
Sites ?, VI, VII, VIII all had very variable soils condi
tions and these variations are reflected in the permeabilities

-66-
obtalned.
The soil at Site IX was quite uaiform and offered an
opportunity to check the validity of the method by comparing
the results obtained with a 1 inch piezometer with the results
of a 3 inch piezometer. The 1 inch piezometer at a depth of 3
feet beneath the soil surface gave an average value of 124 t 40
inches per day while the 3-inch piezometers at the same depth
gave an average value of 133 ±68 inches per day which is con
sidered a satisfactory check.
Measurements were made on the Edina silt loam to see
whether or not the method would work on soils as heavy as the
subsoil of the Edina. The results in general were not satis
factory and the method will have to be modified for use on
heavy soils. Water moves so slowly through these heavy soils
that it is difficult to flush out the cavity with in-seeping
water. One possible method of flushing out the cavity would
be to lower a hose into the cavity and direct a slow stream of
water into the cavity. The water would then flow out the top
of the piezometer. Reeve (54) has tried this method with soils
in the West.
Leakage along the walls of the piezometer may be serious
in some soils and when it occurs, the values obtained for the
permeability will be too high. Since most soils vary in color
with depth, any leakage could be detected by examination of the
color of the suspended matter pumped out of the cavity. Ho
leakage was encountered in any of the tests reported here.
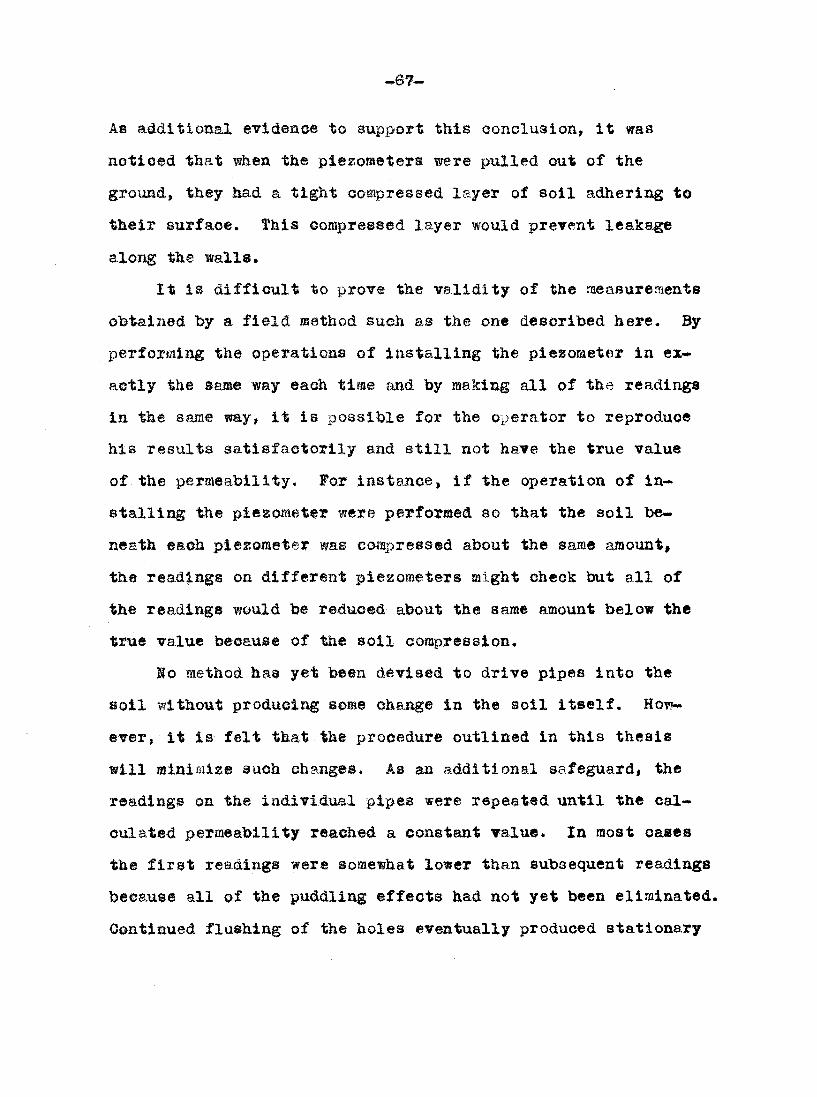
-67-
As additional evidence to support tbis conclusion, it was
noticed that ^ea the piezometers were pulled out of the
ground, they had a tight compressed layer of soil adhering to
their surface, fhis compressed layer would prevent leakage
along the wall®.
It is difficult to prove the validity of the measurements
obtained by a field raethod such as the one described here. By
perforraing the operations of installing the piezometer in ex
actly the same way each tiae and by making all of the readings
in the same way, it is possible for the operator to reproduce
his results satisfaetorily and still not have the true value
of the perffleability. For instance, if the operation of in
stalling the piezoraeter were performed so that the soil be
neath each piezometer was coi^ressed about the same araount,
the readings on different piezometers might check but all of
the readings would be reduced about the same amoimt below the
true value because of the soil compression.
lo method has yet been devised to drive pipes into the
soil without producing some change in the soil itself. Hoi^
ever, it is felt that the procedure outlined in this thesis
will iiiniaiize such changes. As an additional safeguard, the
readings on the individual pipes were repeated until the cal
culated permeability reached a constant value. In most cases
the first readings were somewhat lower than subsequent readings
because all of the puddling effects had not yet been eliminated.
Continued flushing of the holes eventually produced stationary

-68-
Talmes.
On the Tery permeable soils at Sites I and II, it was
difficult with the equipment used to obtain readings at a
depth of more than a few inches beneath the water table. ?ilhen
readings are taken close to the water table, any small error
in the water table aeasureiaent or any drawdown effects will
cause a very large error in the permeability figure obtained,
for these reasons it was thought advisable to take all readings
at least six inches below the water table and deeper if pos
sible.
5. Laboratory results
Fig. 16 shows the variation of the A-function with diameter
of cavity for a 4-inoh long cavity. This figure may be con
sidered valid only if d » w, and s » wj but is approximately
valid for other values of d and s as indicated below. The data
presented in fig. 16 may be used to calculate the A-f\mction of
o&vities having other dimensions, since the A-function is pro
portional to the dimensions of the system^. This is shown by
the following example; The A-function for a cavity 6 inches
long and 2 inches in diaaietex is desired. A cavity 4 inches
long to be in the saae proportion must have a diameter of 1.33
inches. The value of the A-function for a cavity 4 inches long
%irkhaMi (41, p. 62) has proven that doubling the dimensions of a flow system will double the A-function, but we have shown (fig. 18) that when d and s are large compared to w, the value of the A-fmction is independent of d and s. Therefore, with d and a large, doubling the dimensions of the cavity doubles the value of the A-function, regardless of d and s.

-69-
30
CO LlJ X o 20
5 10
I < 0
zm TY ^ MNC :HES Lor sIG
i
2 3 4 DIAMETER OF CAVITY (INCHES)
Fig. 16, Vaxiation of A-fuactioa with Diameter of Gatity for a 4-inch I»ong Cavity (For Values ©f B d See fext),
30
c/) UJ X o 20
3 ij. 'k
0
1
WIT Y 1-INCH DIA
1— LJ
ER
0 I LENGTH OF CAVITY (INCHES)
/
o
Fig. 17. Variation of A-fiinetion with I>e]>li ©f Cavity for a 1-iaeh Diameter Cavity. (For Values of s and d See Text).
-70-
and 1,33 Inciies in diaaeter is read from fig. 16 to be 14.0.
The value then for the oavity 6 inches long and 2 inches in
diameter is (6/4) x 14.0 inches s 21.0 inches,
fig. 17 shows the Tariation of the A-function with length
of cavity for a cavity 1 inch in diameter. Fig. 17 may be used
like fig. 16 to compute A-values for cavities of other dimensions
than those given on the graph. Thus, the A-function for a cavity
2 inches in diameter and 4 inches long is obtained as follows:
For a cavity 1 inch in diameter to be in the same proportion,
it vmst have a length of 3 inches and the A-function reading
from fig. 17 would be 8.5 inches. Since the cavity 2 Inches
in diameter and 4 inches long has dimensions which are twice
those of the 1x2 inch cavity, the A-function woiild be 2x8.5 -
17.0, in agreement with the same value read from fig. 16.
Fig. 18 show© how the A-fimction varies with d(or with s) • - -
when w 55 4 inches, 2r « 1 inch, and s 4-w + d a 24.5 Inches. - ^ t ;
This curve brings out the important fact that if d and s are
both large corapared to w, the A-function valies inappreciably
with d and s. Examination of this curve shows that the value • - >
of the A-function when obtained from fig. 16 or 17 will be
correct to better than about ± if d 5^ w and s l/2w; and ^ ^
that the values will be correct to better than about ± 4^ if ^ ^
d •Sw, s ? 2w. If s s 0 and d » w, the value of the A-f\inctioa /
will be about 25^ too large when obtained from fig. 16 or 17.
The curve is relatively flat between d « w and s » 1/2w. It

I 2. Y
I ^
A^-
fjA*'
d>
[212 X o z = 8 z o I— g4 3 Li-< 0
fL^n
-t s^w^d = 24.5 INCHES
w = 4 INCHES 2r = I INCH
I I 1 ,1 I
s = 0
s+w =0
8 12 16 20 24 28
DISTANCE d BELOW WATER TABLE (INCHES)
Fig. 18. l^sriatloB of A-ftmction with a, for a OaTity 4-iiiehes long and 1-inch in DiaBieter.
' ( y: .-ik
t ^ 's + -!• s S4 fS u.j£
Sf-'-' fii --
^ i - • • 5 ^ •' - ' ••
, r < i
S-'
'--••T X<i, r' fJ
-^'.r -f-'"'-! - . . M ;
PIEZOMETER
XABli WATER 100 KX)
985
L50 ko -70
I I IMPERVIOUS LAYER I , , , , i//////////////n///////n un////////I N////////in////!//////m I!/>'
Fig. 19. l<|aip©t«atlal Suxfaoes for a Pitzoaeter Ga^ity.

-.T2-
ia from this portion of th© cur-r© that values were obtained for
fig. 16 and 17.
Strictly speakiag, if the soil consists of stratified layers,
the A-fmction depends mpon the soil permeability ia each of the
' i layers, and mpon the dimension of the layers as well as the di-
ffieasioa of the oa^rity. However, if a layer is not closer to
the oavlty than the length of the cavity the effect of these
layers, regardless of their permeability will be small. This
conclusion was verified by sifflmlating the following two extreme
field eases in the model tank. (A) fith d « 1 foot, w a 4
inches, 2r • 1 inch and s = l.S feet, an impermeable layer 1
inch thick and 4 feet in diameter was placed in the •'soil* 4
inches above, and coaxially with the cavity, fhe A-function
was measured and found to be reduced 11. Si from the value with
out the impermeable layer, fhe diameter of the disk was now
increased to 8 feet and the A-function measurement made again,
its value remaining sensibly the sajne. (B) With d, Sr, and s
as in (A), a layer of "coarse gravel" 9 square feet in area
and 4 laches thick was placed in the "soil*, with the lower
surface of the "gravel* 4 inches above the top of the cavity.
The A-function was measured and found to have increased
with respect to the value with no gravel. In these experiments,
the impermeable layer was sibilated by a disk of shellacked
plywood, and the ••gravel", by copper sheets bolted together
by conducting screws. A 1/2 inch electrode sisaulated the 1

—
inoto piezometer.
Another ctoeck on the proposition that only the soil in a
small region about the canity contributes to the soil permea-
bilitf was obtained by determining (with the model) the equi-
potential surfaces about the "cavity" as shown in fig. 19. The
Talue 100 is assigned as the potential (hydraulic head) at the
surface of the soil and the value isero at the cavity. The
figure shows that 80^ of the hydraulic head is dissipated in
the soil within a distance of 1 cavity length from the cavity
and about 90^ within two cavity lengths. Soil outside the 80
and 90 rings thus contributes little to the flow and hence to
the A-function and to the value of K.
The effect of roeke and channels in the soil on the
periaeability measureaent was investigated with the model.
Pieces of dielectric were used to simulate rocks, copper wires
to simulate worm holes, and copper strips to simulate cracks
in the soil. If the "cracks* and *worm holes* were not contin
uous from the cavity to the soil surface, their effect was
generally small. Rocks near the cavity had little effect on
the A-function. These findings are essentially the same as
those reported by Frevert (27).
B, Application of Permeability Data to a Drainage Probl®a
The various methods of obtaining solutions for the drainage
problem have been covered briefly in the Review of Literature,
~f4-
Of all tlie methods meiationed, the ntimerical analysis procedure
Is the one oapatole of application to the widest variety of
problem® with a miaifflim of skill and labor. Several examples
will be wor&ed out to show how the method can be applied to
drainage problems involving soils with layers of two different
permeabilities. The equipotentlals will be determined by nu
merical methods and the amount of water flowing into a drain
tube will be determined graphically using the equipotential
plot.
1. Procedure
Following a suggestion of Dr. R. £. Gaskell, Department
©f Mathematics, Iowa State College, the liiebmaan procedure was
used in the analysis. Although other nsethods devised by
Shortley, Southwell and others are somewhat more rapid, the
simple iiiebfliann procedure has the advantage of being easy to
understand and simple to apply. Once the problem has been set
up, the numerical analysis can be readily done by any untrained
person; a stenographer or student help. Ho special training in
mathematics is necessary. In spite of its simplicity, the
niiaerical method is powerful enoxigh to treat some of the most
coaplex problems, ©any of which are intractable to methods of
mathematical analysis.
As an elementary example of the Liebmann procedure, let ua
suppose that in a region bounded by the dotted lines in fig. 20
a function <j> satisfies the finite difference approximation of

•fill.
loo'f^
300^
I K 1
600 ,
400 I
900 8 75 866 860
700 669 650 6 32
500 4 I 7 389 374
1500^
1000 994 989 976
700 7 I 6 680 652
500 408 366 350
t o o •6
'lOOO^
-O-H
900 873 865 853
700 672 6 35 620
500 395 3 75 367
— —o too G
300
6 0 0
40 0
®f ummrn

-76-
Lapla.c©*s equation and is therefore an approximate solution
of the differential equation. may be a potential function
or it may be a stream function. It is assumed that the values
of are known at the boundary points A, B, 0, ..., K, L.
fhese knoTO values art indicated in fig. 30 as slant numbers.
Points a, b, c» ..., h, i are interior points at which is
unknown, fhe initial values assigned to the interior points
are estimates or guesses of what the operator thinks the value
should be. The closer the estimate is to the true value, the
more rapid will be the convergence to the final answer so that
any preliminary calculations or work will be well repaid in
labor saved in the final calculations. However, any finite
assigned values whatever will lead to the correct result.
With the values knoiwx at the bo\indary points and with
arbitrary assigned values at the interior points, the problem
is now ready for solution. The net of interior points is tra
versed moving from point to point replacing each value at the
interior points by the average of its four neighbors. On com
pletion of the first traverse, the net is again traversed with a
second set of values resulting. This procedure is repeated
until the values repeat themselves to the desired number of
significant figures. The difference equation will then be
satisfied. For example, in fig. 20 a net of nine interior
points and twelve boundary points is drawn. The top figure

-77-,
In the col\OTi of figures at polats a, b, c, h, 1, are
the estimates made at the start of the calculation. The sec
ond figure in the coliirai represents the averages obtained on
the first traverse and the third figiiire, the third traverse,
etc. fhe traverses were all made from a to i alphabetically,
thus in the first traverse of the net
0a = 1/4(1000 + 1000 -H 700 +• 800) = 875
» 1/4(1500 + 900 -H ?00 -f- 875) « 994
(p'a » 1/4(1000 + 800 + 700 + 994) a 873
Improved values are always used in the calculation. For
example, the fourth value In 0 b Is the improved value for 0' a
and in $' e the iijjroved 0' b is used.
The operator need not worry about mistakes made in arith
metic since sueceasive traverses will eliminate the errors. The
net is traversed until stationary values result at the interior
points, thus providing a solution of the Laplace equation within
the given region to three significant figures.
a. Drainagge of aoil with uniform permeability
To show how the Liebmsnn aethod could be g^plied to a
drainage problem, a sisple case for \fhlch the analytical solu
tion is known was solved and the result obtained by the Lleb-
laaJMi procedure was compared to the analytical answer. The flow
into a tile drain embedded in a soil of uniform permeability
was studied. At first a solution was attempted for a single
drain tube in an infinite medlura. That Is, the soli was assumed

-78-.
to extend dowawards and sideways for an infinite distance. In
solving the problem it was necessary to determine values of the
function at an arbitrary boundary drawn to confine the problem.
The values on the boundary were determined by extrapolation
from the three points adjacent on a line extending into the
interior of the region. The rate of convergence to the true
value was so slow as to render the method impractical and it
was decided to bound the lower side of the region by an im
permeable layer and to place squally spaced tile drains on
either side of the tile considered, fhia confined the region
with boundaries on which the value of the function or the value
of its norma.1 derivative was known.
Due to symmetry, it was only necessary to consider a
region extending from one tile drain to a plane intermediate
between the two tile drains.
It was assumed that the spacing of the tiles was uniform
and regular. At the surface of the water table the potential
function, 0 , was every^iere given a value of lOCX). The po
tential function was assigned a value of zero over the sur
face of the drain tube (which was assumed to be flowing full
with no bacfe pressure and with completely permeable walls).
At points along a line extending vertically through the cen
ter of the drain, and along a line extending vertically through
a point midway between the drains, and along the surface of the
i^ermeable layer, the aoraial derivative of the potential is

•79-
2©ro. That this is so can toe readily shown by a consideration
of the streamline pattern. The line extending vertically
through the center of the drain is a streamline; so is the
line midway between the drains;and so is the surface of the
iJiperiBeatole layer, fhe derivatiire of the potential normal
to a streamline Is zero since the equipotentlal lines and
the streamlines are orthogonal.
The solution as obtained by the Liebmaan procedure is
shown on fig. 31 by the vertical numbers at the net intersec
tions. Values at points on boiindaries on which the normal
derivative was zero were computed by talcing one-fourth of
the sum obtained by adding the values of the two points on
the boundary to twice the value of the Interior point. This,
in effect, reflected the Interior point to a point outside of
the boundary.
Fox (25) has developed suitable equations based on
linear interpolation for handling points near a curved bound
ary. Referring to fig. 22.
A comparison of the nuaierioal solution was made with the ana
lytical solution presented toy Klrkham (43) v,'hlch Is
X ^ (i>H f <^a/h
3 + </h (10)
(t>-<^yin {[posh¥(x-ma) /2h-cosTry/2h3 / [coshTr(x-ma) /2htcoSTy/2hlj
x-ma)/2h+co8ir(y-2d)/2h3 / [eoshTT(x-ffla)/2h-co8Tr(y-
(11)

W A T E R T A B L E loa 000 1000 1000 1000 1000 1000 1000 1000 1000 1000 1000 1000 1000 1000
846 877 935 96 ! 973 836 849 872 896 916 932 945 954 961 966 970 972 974 975 975
670 648 687 744 796 837 870 894 912 925 934 940 945 948 950 950
412 383 507 622 708 770 815 8 49 874 892 904 912 919 924 926 927
U 560 864 894
s J 336 534 646 720 772 812 841 861 877 887 8 95 901 905 906
n 316 297 415 534 624 692 744 785 813 835 852 865 8 75 882 886 887
4$4 460 500 564 6 27 682 728 766 792 815 832 846 857 865 8 70 870
560 608 724 80! 839 544 561 598 641 683 721 7 55 779 801 81 8 832 842 851 856 8 58
605 595 604 627 657 690 720 74 9 771 790 807 821 831 840 845 845
632 629 634 649 671 6 96 721 746 765 783 799 813 822 831 834 835
649 664 719 777 en 650 6 5^ 665 682 702 722 744 762 7 79 794 806 814 823 827 829
660 661 665 674 688 706 724 742 7 60 777 792 804 813 820 825 827
663 665 669 677 692 707 724 742 760 7 76 791 803 81 3 819 823 824
/ / / A M P
Fig. 21. Squipotential Plots for Case of Drainage of Uniform Soil. See Text for Details.

-81-
li
a —
' 0a 0.
-a-— ^
01
. aa. fdlmt M9kW a ©nrvtd Bemndftyy.

-82-
wbere thie origin of the coordinate system is taken at the
center of a tile drain and
a s distance between tile in feet
h ~ distance from water table surface to an impermeable layer
d = depth of drain tube.
and q are determined by the boundary condition. In this case
s 1000 and q • 140.6.
The true values were obtained for several points and they
are shown m the slant numerals on fig, 21. The close agreement
between the true values and the numerically-^obtained values is
readily apparent. The greatest error occurs at points lying
close to the drain. The function is changing rapidly at these
points. It would have been possible to get more accurate nu
merical results about the drain by reducing the net interval.
At points in the interior of the region the discrepancy is less
than 1^ whereas it goes up to at points iaiiBediately adjacent
to the drain.
Ihile the equipotential plots are of interest, of far
greater value is the fact that the flow into the drain can be
calculated from the equipotential curves, the flow across an
equipotential line over an area A is given by the expression
<l = Kf^A (IS)
where I « the permeability
change of the potential function in a direction aormal to an equipotential line
k « the area between the points considered

-83-
fli® surface of the water table lies on an equlpotential
line and it was coa'^'eaient to cooprnte the flow across this
surface since the flow across tiia stirface will also equal the
flow into the drain tube, fhe; potential function at the water
table was everywhere 1000 while the potential functions at a
distance 1 foot below the water table were computed and are
indicated on fig. 21. At each foot inter'^al along the surface
of the soil was computed by subtracting the potential
function at the 1 foot depth from 1000; multiplying the result
by 3.75/1000, since 3.75 feet is the total potential drop from
the water table surface to the wall of the tile drain; and by
dividing the result by 1 foot, which is the distance be
tween the two points. Since the interval between the points
along the water table was 1 foot and the thickness of the soil
considered, in the iircctioa perpendicular to the plane of the
figure, is also taken as 1 foot, each value of was multi
plied by an area 1 square foot, faking K » 1 ft/day and adding
up all of the K along the surface of the water table from
a point over the tile to a point midway between the tiles, a
value was obtained for 1/3 of the total flow into the drain
tube, fhis result was then compared with the analytical result
obtained by Ilrkham*s (4 3) equation
Q « 2-rrI ( t + d - r)/ln [^sinh(TT(2d-r)/aJ/sinhifr/a-oo
^-1)*^ In Lsinh%TTnh/a-sinh^7rr/a])/
(sinh^g-rmh/ a-sinh^TT( Sd-r) /a]

-84:-"
where I = permeability in feet/'day
t « thioknea® of ponded water (taken as zero in this case)
d w distance from surface of water table to center of tile drain, taken as 4 feet
h - distance from the water table surface to the impermeable layer, here aseumed to be 12 feet
a = distance between the tile drains, taken to be 28 feet
the result obtained by the graphical method was 6.840 cu.
ft/day while the analytical solution gave an answer of 6.644 cu.
ft/day. The error in the numerical answer was thus 3.6^.
There were 179 points at which the value of the potential
was determined by the Liebmaan procedure and it took about
twelve hours to get the answer. ¥alues of the potential were
calculated by means of i:irkha«*s ecpiation at 26 points in about
the same length of time. However, (if a potential plot Is not
wanted) the answer for Q can be obtained in a few minutes from
Kirkham*s result.
b. Drainage of soil with aon-'-uniforBi permeability
Solutions of problems involving soils with layers of
various permeabilities are difficult to obtain analytically,
especially if the interface between the two layers is irregular
in configuration* The real power of the numerical method is
realized in the solution of these more complex problems.
In Southern Iowa and Missouri, there are large areas of
soils that are difficult to drain because of a dense heavy
clay subsoil. The numerical method was used to study this

-85-
problem. The depth to the elay layer varies in these soils
and for this probleia the depth was taken to be 24 inches, which
is probably deeper than the average. It was assumed that the
trenching machine dmg a trench 18 inches wide and 48 inches deep.
A 6-inch tile was laid on the bottom of the trench half embedded
in the subsoil. The material used to fill the trench was assumed
to have the saiae permeability as the surface soil and the depth
from the soil surface to an impermeable layer was set at 10.5
feet, and the tile spacing was set at 20 feet. The problem was
solved for three different ratios of permeabilities of the sub
soil to the surface soil, t to 5, 1 to 10 and 1 to 100. The
I»iebffiaan procedure wa® used as before. Points in the interior
of the region of uniform permeability presented no problem
but special formulas were required to deal vith points whic^
lay on the interface and points which lay close to a curved
boundary such as the surface of the tile drain. (The net was
so arranged that the interface lay along a line of points).
Shaw and Southwell (61) have derived a formula for points on a
plane interface using a mechanical analogy to a tensioned net.
The result they obtained (ref. fig. 33) may be written
d) = (KH- KTlX'f 3 + 1>4H3(Ktt(P 0a)-3a(£TT'-tT) (13) To- 4(Ki+iil) '
Using somewhat more rigorous methods, a slightly different
equation can be derived. The derivation is based on the finite
approximtion to the solution of the Laplace differential eq\ia-
tioa and is as follows: The first derivatives in the x-y
-86-
-
1
1 !(S.
1 1 1
1^3 1 1
Fig. 23. Point on an Interface

dlreotions are built up on the iaiowledg® that the average
derivative betweea two poiats is approximately e<p.al to the
differeace in the value of the function at these two points
divided by the distaaee or in fig, 23.
_ <t>2.-0O . <t>o~ d)^
d<l) _ 4>,~<i>o . <t)o-a. ' ft.
The Laplace differential equation which must be satisfied is
Kx + 4— K«-^= 0 ^ dx ^
between points <1^2, and and is the average of the
permeabilities Ij and K|j or
% - % ^11
Ky between (|>, and is equal to K| while between (;6o a»d
it equals Eij. Multiplying the first derivatives by the permea
bilities gives
^ KlfKa j ^ da.- (to ^ • ^Kl+Kg ^ ^ <tb- <l>^ ^
Ku-^^—= Ki ; Kn CL O-
The second derivative between two points is approximately the
difference in the first derivatives at these points divided by
the distanoe between them.

"•8S«»
^ 3 j_ (^) (^) - ir (^) ax a. V 2. / ^ «• ^
'^LCKI + Kit) (4>z.+ <J^H) - 2. (KX + Kn) 6o]
^ (K, ^
- i l^i 4^1 + Kn 3 - CKH + <^oJ iAm
Substituting in (13) ma. taking a = 1
(J) - (Ki-f Knl ((f>2.-t- <^m) 4 S. CKt fi "F Kg <^) {14) H (Kir +Ki)
A review of tlie literature revsaletil no derivation for a
corner poiat sucij as oceutt at tlie upper and lower edges of tbe
treneli out in the subsoil. Referring to fig. 24 and 25 the
derivatiires are built mp as before and the solution for the
upper point (fig. 23) is
(b - ^ Ki f <i^w) 4- (Ki > Kg) ((t>t 4 (l>i) (15)
"• GKi -faKa
The equation for the lower point (fig. 34) is
0 . 2.Hti ((tjL'h^) -I-(K^-^ KrT)^(fe-f-(^) (16)
4Ktt+aKl With the aid of these special formulas for points on the
interfaee and near a ourved boundary, the problem was solved
b|r the Liebfflann prooedure. At first a very coarse net was
%
<p/l 00
0,
i4. FSIBI at lipit S4it
(f)A 0o
Hi
I0z
fig# is# f©t»t at %^mw 0@ia»ap, §•• ft*i.
-so-
laid dowa over the region and solved. Then finer nets were made
toy smtodlviding the net intervals of the coarser net. The values
obtained as solution® of the ooarse net were used as starting
values for the finer nets. Fig. 26 illuatrates the use of four
different net intervals in solving one proMcm. At points close
to the drain tube the fmotion changed rapidly and a fine net
was required to give the desired accuracy. At points away
from the drain tube, the desired aocuraoy was attained by Uie
coarser nets, the rate of convergence was speeded up materially
by startii]^ with the coarsest net possible. Ihen a finer net is
constructed by adding one point at the center of each four
points, the resultant net is square but is diagonal to the first
net. Since l»apla©®*a equation is invariant on rotation of the
axes, the saw© averaging formula applies to values on the sew
net.
It toofc about 24 hours to solve the problem of permeabili
ties in the ratios ©f i:i with the aid of a Monroe calculating
machine. The solution for the §.'1 problem was used as a starting
value for the 10:1 problem, which was solved in 16 hours. The
100I1 problem took 11 hours to solve.
Althoxjgh no analytical solution is available to check the
accuracy of the numerical solution, a rough check was obtained
by measuring the normal tangents of the equipotential lines
with respect to the interface, the ratio of the tangents in
the two isedia equals the ratio of the permeabilities (See
Bewley 6, p. 68).

WATE TABLE 1000 1000 1000 1000
»37 942
5M Ml
SI"""'-
264 296 399 |A81 ^ 60l»^ «5C 990 7Y« 769
3«L'.«*.ii.icamT3[:cnii:¥*jr^5rrmr.tT.iH
^ ffT ^ 57? SiU fiSi 686 1 0\2O
427 449 479 i 544 575 606 636 B60 681
///////A M OUS////////LAYER"
Fig. 36. Equipotential Plot for Drainage of a Two-layered Soil.

-92-
WATER TABLE
Z/////// IMPERVlbUS^/-^////LAYER '/////Zy/^///
Fig. 27. Equipotential PIot for Drainage of a Two-layered Soil.

-93"
WATER TABLE
Fig. 28. Equipotential Curves for Drainage of a Two-layered Soil.

-94-
Table 12
Results of lumerical Analysis
%/%l Q( ft 3/day)
!• 5 10 100
6.289 2.905 3.667 2.586
100.0^ 46.1 42.4 41.1
•Calculated
It is clear from the results that when the ratio® of the
permeabilities Ej/Kji is 8 or greater, very little water flows
through the subsoil, ihen the ratio of the permeabilities is
100, the subsoil is for all practical purposes ia^serraeable siace
the equipoteatials ia the Ej raedim strike the interface at
slightly less thaa 90. If it were completely iiiQ>ermeable, the
angle would be 90 .
We may conclude, therefore, that on the Edina soil, which
has a peraeability ratio of at least 10, very little flow takes
place thxoxigh the subsoil when tile drains are placed at four
foot depths. Most of the water must flow laterally through the
surface soil until it reaches the more permeable trench-fill
material.
Kirkham (42) has solired the problem of seepage into a
drain tile half eiabedded in an iaiperiBeable layer and his result
is
Q= J_ (17) ^ In cot irr/qh ^
where the symbols refer to the same dimensions as in eq. (14).

-95-
To compare the relative advantage of placing the tile at
the bottom of a four foot trench, as was done in the problems
here solved, or of placing the tile at a 2 foot depth vdth half
of the tile embedded in the impermeable layer, the drain flux
was calculated for h « d » 2 feet, r « .25 feet, K « 1 foot/day,
t » 0. The result is
Q a 2,371 cu. ft. per day
Gomparing this result with the numericaHy-obtained answer for
the two-layered soil with permeability ratio Kj/Kn • 100 (see
Table 12) it will be noted that the flow into the tile is reduced
11.1^ by placiag the tile at a two foot depth on the surface
of an impermeable layer, if the tile \fere placed a small
distance above the imperaeable layer the flow would actually
be increased above this amount as pointed out by Kirkham (42).
The small increase in flow obtained by placing the tile at a
four foot depth would probably not justify the additional cost
of digging the deeper trench.
-96.
IV. 00NGLU8I0I AND SUMMARY
A field method of measuring the soil permeability beneath
a water table has been developed. Piezometers are driven into
the soil below a water table, the soil is augered out of the
pipe and the rate of rise of the water in the pipe is measured,
fhe permeability is then calculated from the rate of rise by
means of an appropriate formula. Certain geometric constants
occur in the permeability formula. These constants have been
determined in the laboratory with a three dimensional electric
analogue of the groundwater flow problem. The electric analogue
is used to study the effects of soil factors such as stratifi
cation, worm holes, and rocks in the permeability determination.
Field trials on several Iowa soils have shown that the
method is relatively simple, quick and accurate. Readings can
be taken to any depth below the soil surface.
The application of permeability data to drainage has been
demonstrated using a numerical method of analysis. Special
forariilaa have been derived to take care of points at the inter
face of two layers, each having a different permeability. The
results obtained by the numerical methods are accurate and the
method of analysis is simple to apply.
-97-
V. LIfERATURE ClfED
(1
(3
(3
(4
(5
(6
(7
(8
(9
(10
(11
(13
Allison, L. S. Effect of ffiicroorganisms on permeability of soil mder prolonged submergence. Soil Sci. 63:439-450. 1947.
AronoTioi, V. S. and Donnan, W. M. Soil permeability as a criterion for drainage design. Amer. Geophys. Union frans. 37:95-102. 1946.
Baver, L. D. Soil permeability in relation to non-capillary porosity. Soil Sol. Soc. Amer. Proc. 1938/3:52-56. 1939.
1940. Soil physios. John Wiley and Sons, New York.
Bendixen, T. ff. and Slater, 0. S. Effect of the time of drainage on the measurement of soil pore space and its relation to permeability. Soil Sci. Soc. Amer. Proc. 1946/11:35-42. 1947.
Bewley, L. V. neering.
Two-dimensional fields in electrical engi-Maomillan, Mew York. 1948.
Bodman, G. B. The variability of the permeability "constant" at low hydraulic gradients during saturated flow in soils. Soil Sci. Soc. Amer. Proc. 1937/ 2:45-54. 1938.
Brahtz, J. H. A. Pressures due to percolating water and their influence upon stresses in hydraulic structures. Second Congress on Large Dams, lash. D.O. 5;43-71. 1936.
Casagrande, A. Seepage throxigh dams. Jour. New Eng. later lorks Assoc. 51:131-172. 1937.
Childs, E. 0. The water table equipotentials and streamlines in drained lajad. Soil Sci. 56:317-330. 1943.
— T h e w a t e r t a b l e , e q u i p o t e n t i a l s , a n d s t r e a m lines in drained land: II. Soil Sci. 59:313-328. 1945.
The water table, equipotentials, and streamlines in drained land: IV Drainage of foreign water. Soil Sci. 62:183-192. 1946.

-98-
fhe water taMe, equipotentials and stream-lilies ia draiaed laad; V. The moviag water table. Soil Scl. 63:361-376. 1947.
Ghristlansen, J. E. Effect of entrapped air upon the permeability of soil®. Soil Soi. 58:355-365. 1944.
Sojie periaeability characteristics of saline and alkali soils. Agr. Ingr. 28:147-153. 1947.
— ——Fireman, M., and Allison, L. E. Displacement of soil-air by Wg for permeability teste. Soil Sci. 61:355-360. 1945.
Diserens, E. trans. Sixth Gomffl. Int. Soc. Soil Sci. B:188-93. 1932.
• Beitrag gur Bestiffliming der Durchlassigkeit des Bodens in laturlicher Bodenlagerung. Schweizerische I,andw. Moaathefte, 13:188-198; 204-212. 1934.
Buley, F. L. and Domingo, C. 1. Effect of water temperature on rate of Infiltration. Soil Soi. Soc. Amer. Proc. 1943/8:129-131. 1944.
Edlefsen, H. S. Report of the committee on physics of soil ffloisture. Amer. Geophys. Union Trans 21:414-433. 1940.
Emmons, Howard W. The numerical solution of partial differential equations. Quar. App. Math. 2*173-195. 1944.
Fireman, M. Permeability measurements in disturbed soil safflples. Soil Sci. 58:337-354. 1944.
and Bodman, 0. B. Effect of saline Irrigation water upon permeability. Soil Sci. Soc. Amer. Proc. 1939/4:71-77. 1940.
and Magistad, 0. C. Permeability of five western soils as affected by the percentage of sodium of the Irrigatioa-water. Araer. Geophys. Onion Trans. 36:91-94. 1945.
Fox, I#. Solution by relaxation methods of plane potential problems with mixed boundary conditions, (^uar. App, Math. 2:251-257. 1944.
Free, G. R., Browning, G. M. and Musgrave, G. W. Relative infiltration and related physical characteristics of certain soils. U. S. Dept. Agr. Tech. Bui. 729. 1940.

-99-
(27) Frevert, R. Development of a three-dimensional electric analogu© with application to field measurement of ®oil permeability below the water table. Ph.D. thesis, Iowa State College Library. 1948.
(28)< Gardner, fillard The influence of soil characteristics on drainage and irrigation practices. Soil Sci. Soc. Amer. Proc. 1936/1:383-392. 1937.
(29) , Collier, T. R., and Faxr, D. Groundwater, part I: Fundamental principles governing its physical control. Utah Agr. Exp. Sta. Bui. 253. 1934.
(30) Gilles, D. C. The use of interlacing nets for the application of relaxation methods to problenm involving two dependent variables. Proc. Roy. Soc, A 193:407-433. 1947.
(31) Gustafason, Yngve The influence of temperature on the permeability of soils to water. Lantbrukshogskol Ann. 8:425-456. 1940.
(32) Hagen, Q. IJber die Bewegung des Wassers in engen Oylindrischen Rohren. Ann. Phys. u. Chem. 46:423-442. 1839.
(33) Hamel, G. Uber Grundwasserstromung. Ztschr. Angew. Math. und Mech. 14:129-157. 1934.
(34) Harding, S. 1. and Wood, J. K. Model tests of flow into drains. Soli Sci. Soc. Amer. Proc. 1941/6:117-119. 1942.
(35) Harris, A. 1. Effect of replaceable soditim on soil permeability. Soil Sci. 32:435-446. 1931.
(36) Hissink, D. J. Kie reclamation of a part of the Zuyder Zee. Int. Soc. Soil Sci. Trans. 6th Comm. A:177-187. 1932.
(37) and Hooghoudt, S. B. Die Bestiaaaung des Mittleren D-wertes einex Bodenschicht. Int. Soc. Soil Sci. Trans. 6th Comm. A:34-41. 1932.
(38) Hooghoudt, S. B. Btldragen tot de Kenais van eenige latuurkundige Grootheden van den Grond. No. 4. Bepaling van den Doorlaatfactor van den Grond met Behulp van Porapproeven, e,rs. . Ond. 42 (13). . 19 36
(39) Jacob, C. 1. On the flow of water in an elastic artesian aquifer. Amer. Geophys. Union Trans. 21:574-586. 1940.

-100-
(40) King, f. H. Principles and condition of the movements of groimd water. U. S. Geol. Survey Ann. Rpt. 19:61-394. 1899.
(41) Kirkham, D. Proposed method for field measurement of permeability of soil below the water table. Soil Soi. Soc. Amer. Proc. 1945/10:58-68. 1946.
(42) Reduction in seepage to soil underdrains resulting from their partial embedment in, or proximity to, an impervious substratum. Soil Soi. Soc. Amer. Proc. 1947/12:54-59. 1948.
(43) Flow of ponded water into drain tubes in soil overlying an impervious layer. Amer. Geophys. Union Trans. 30:In press.
(44) Unpublished manuscript, Iowa State College, Ames, Iowa. 1949.
(45) and van Bavel, C. H. M. Theory of seepage into auger holes. Soil Sci. Soc. Amer. Proc. 1948/13: In press,
(46) Kozeny, J. Hydrologische Grundlagen des Dranv^suches. Trans. Sixth Goram. Int. Soc. Soil Sci. A:42-67. 1932.
( 4 7 ) — Ueber den Ylasserzu drang bei Dranfugen. Wasserkraft uad lasserwirtschaft 28:13-17. 1933.
(48) Liebmann, H. Die angenaherte Ermittlung harmonischer Funktionen uad Koaformer Abbildungen, Sitz. Bayer. Acad. Wiss. Math.-Phys. Klasse, 385-416. 1918.
(49) Lutz, J. F. and Learner, R. 1. Pore-size distribution as related to the permeability of soils. Soil Sci. Soc. Amer. Proc. 1939/4:28-31. 1940.
(50) Moskovitz, D. The numerical solution of Laplace's and Poiason*s equations. Quar. App. Math. 2:148-163. 1944.
(51) Muskat, M. The flow of homogeneous fluids through porous media, McGraw-Hill Book Go., Hew York. 1937.
(52) Kelson, W. R. and Baver, L. D. Movement of water throu^ soils in relation to the nature of the pores. Soil Soi. Soo. Amer. Ppoc. 1940/5:69-76. 1941.
-101
(53) Poiseuille, J. L. M. Ejperlmental investigation upon the flow of liquids in tubes of very small diameter. Roy. Aoad. Sol. Inst. Math. Phys. Sol. Mem. 9S432W543. 1846. (fr®ns. by W. H. Herschel in Rheo. Mem. it1-10. 1940).
(54) Reeve, R. and Jensen, M. Use of piezometera for groundwater flow studies and measurement of subsoil permeability* Agr» Eng. In Press.
(55) Reynolds, 0* Aix experimental investigation of the oircum-staneea which determine whether the motion of water shall be direot or sinuous and of the law of resistance in parallel channels. Roy. Soo* (London) Trans. 174:935-983. 1883.
(56) Richards, L, A. Goneei'ning permeability units for soils. Soil Sci^ Soc. Amer. Proe. 1940/5s49-53. 1941.
(57) — Discussion of permeability units. Amer. Qeophys* Union Trans. 21*427-428* 1940.
(58) Richardson, Ii. F. The approximate arithmetical solution by finite differences of physical problems involving differential equations, with an application to the stresses in a masonry dam. Roy. Soc. (London) Trans. A3101307-357. 1910.
(59) Russell, J. L. Setentifio research in soil drainage. Jour. Igr. Sci. 24:544-573. 1934.
(60) Seelheim, F. Methoden zur Bestimmung der Durchlassigkelt des Bodens. Zeit, fur Anal. Ghem. 19i387-418. 1880.
(61) Shaw, F. S. and Southwell, R. Y. Problems relating to the percolation of fluids throx^h porous materials. Roy. Soc. (London) Proc. A178:l-17. 1941.
(62) Shortley, G., feller, R., and Fried, B. Numerical solution of Laplace*s and Poisson's equations with application to photoelasticity and torsion. Ohio State Eng. Ixp. Sta. Bui. 107. 1940.
(63) Slichter, G. S, Theoretical investigation of the motion of ground water. U. S. Geol. Survey Ann. Rpt. 19; 295-384. 1899.
(64) Smith, R. 1. and Browning, D. R. Influence of evacuation upon laboratory percolation rates and wetting of undisturbed soil samples. Soil Sci. 62:243-254. 1946.

-102-
Southwell, R. V. Relaxation inethods in theoretical physics. Oxford Press. 1946.
ferzaghi, Charles Principles of soil meohanioe: III Deterffiiaation of permeability of clay. Eng. lews Rec, 95;832—836. 19S5.
Tolman, G. F. Groundwater, p.217-219. McGraw-Hill, lew fork. 1937»
ITan Bavel, C. H. M. and Kirkham D. Field measurement of soil permeability using auger holes. Soil Sci. Soc. Amer. Proc. I948sl3. In Press.
f^aksamn, S. A. and Martin, J. P. The role of microorganisms in the conservation of soil. Science 90:304-305. 1939.
Weir, 1. f. Shape of the water table in tile drained land. Hilgardi a 31143-152. 1938.
fenzel, I.. I. Methods for determining permeability of water-bearing materials. U. S. Geol. Survey Water-Supply Paper 887:1-198. 1942.
lyokoff, R, D. and Botset, H. G. The flow of gas-liquid mixtures through unconsolidated sands. Physics 7:325-345. 1936.
— , Botset, I* G., Muskat, M. and Reed, D. ?/. The measureaient of the permeability of porous media for homogeneous fluids. Rev. Sci. Inst. 4:394-405. 1933.

-103-
TI. AQUOfldDSSlffilT
Til® aatlior wislies t© express htm sincere appreciatioa
to those iho aided diArli^ the oomdmct of the experiment. The
©ontrllwtioas of the followlog are eepecially recognized.
ttr, Don Kirliliaa, in oharge of aajor work, for his
gmidaace aM assistano®.
Dr. J. J. L. Hinris&sea, Dr, t, T. Sarle, Dr. ¥1. H.
Allaway, Dr. Q. M. Broming, and Dr. R. K. FreTert, members
of the oofflffiittee# for -ttielr interest and suggestions.
Dr. R. E. Gaskell for his aid in the derivation of
e«p.ations for aafflerieal analysis and for his interest and
encourageffient.